
Abstract
Whether power-sharing increases polarisation or not in post-conflict societies remains deeply contested. Yet, we currently lack an adequate conceptualisation of polarisation to assess the link (if any) between the two. This article offers a new conceptualisation of polarisation and uses this to gather evidence from Northern Ireland to argue that the assumption that power-sharing entrenches polarisation is not the reality that many think it is. By examining legislator voting records, speeches by party leaders, manifestos and public opinion data, we disaggregate polarisation into different issues, track it over time, and examine both elite and mass levels. We find that overall polarisation declined, albeit some limited polarisation remained in cultural and identity issues, but these were of low salience. We argue that this is the result of parties using identity instrumentally for electoral distinction in a system of convergence – a process that is independent of the effects of power-sharing.
Introduction
Whether power-sharing increases polarisation or not in post-conflict societies is of central importance to academics and mediators interested in managing and resolving conflict. The rise in the number of negotiated ends to civil wars that rely on some form of power-sharing (Billingsbo, 2013) makes this debate particularly relevant today. Yet, studies of post-conflict societies lack an adequate conceptualisation of polarisation, which hinders gathering satisfactory evidence to assess the link, if any, between power-sharing and long-term polarisation. This article offers a new conceptualisation of polarisation in post-conflict settings and applies this to gather evidence from the case of Northern Ireland to argue that common assumptions that power-sharing entrenches polarisation is not the reality that many think it is.
Debates around power-sharing have been unable to move beyond whether it is a valuable tool in conflict transformation or whether it merely institutionalises rival identities that formed the basis of the conflict in the first place. For its supporters, power-sharing neutralises conflict by guaranteeing the inclusion of minority groups while still adhering to the principles of liberal democracy (McGarry and O’Leary, 2017). Power-sharing reduces the likelihood of conflict recurrence (Hartzell and Hoddie, 2007); it incentivizes violent spoilers to transform into stakeholders (Walter, 2002); it promotes parity of esteem between competing groups (O’Leary, 1999); and, it encourages policy making that meets the needs of as many in society as possible and not just the majority (Lijphart, 1969). What is more, when it comes to voting behaviour, it does not appear that power-sharing inevitably leads to ethnic outbidding (Garry, 2016; Mitchell et al., 2009; Tilley et al., 2019).
In stark contrast, critics argue that whatever gains power-sharing appears to offer, these come at the long-term cost of embedding polarisation. From this perspective, power-sharing pits fractious identities against each other and prevents cross-cutting politics from emerging that could dampen violent rivalries (Jarstad and Sisk, 2008; Roeder and Rothchild, 2005; Tull and Mehler, 2005). By accommodating competing (usually ethnic) identities, power-sharing actually incentivizes leaders to appeal to citizens in ethnic terms and strengthens the hand of hardliners (Horowitz, 1985). Power-sharing is seen as creating a dynamic of outbidding by rivals in an attempt to gain electoral advantage, pulling parties to extreme positions (Lee, 2009). This dynamic is compounded by the nature of ‘involuntary coalition’, which insulates the executive from any effective opposition, thus creating a moral hazard for outbidding and polarisation (Taylor, 2006). Elite behaviour is seen as having a spill-over effect on mass attitudes and behaviours, which follow the lead set by elites (Zingher and Flynn, 2018). 1
This long-standing debate has not been resolved due to the lack of an adequate conceptualisation of polarisation in the post-conflict context. Existing understandings of polarisation do not allow us to examine if some policy areas are more likely to be polarised than others, how rates of polarisation may change over time, nor distinguish between elite or mass polarisation. Instead, the term is often used in a catch-all way to indicate a sense of deep political tension between rivals, but this inhibits careful empirical measurement. Therefore, this article offers a new conceptualisation of polarisation and uses this to gather systematic evidence to answer the following questions: do divisions between rival parties in a power-sharing system become entrenched over time or even increase? Does polarisation emerge in some policy areas but not others? Does designing a power-sharing system that accommodates particular identities prevent broader politics from emerging?
To tackle these questions, we use the case of Northern Ireland, whose mixed record under power-sharing makes it an ideal laboratory. This article challenges common assumptions that power-sharing has increased rates of polarisation and, in fact, on most measures it has declined. We find that polarisation is rare and when it happens it does not impact the functioning of the institutions. Although some distance remains between the parties in their electoral appeals around identity politics, this is not emphasised very much and certainly less than bread-and-butter politics. Instead of polarisation, we suggest that the parties are converging. There were also no indications of mass attitudinal or behavioural polarisation. Occasionally, the parties emphasise identity politics for instrumental reasons to distinguish themselves from rivals, but this appears largely independent of the power-sharing institutions.
Conceptualising Polarisation in Post-Conflict Societies
There are multiple understandings of power-sharing that range from the intuitive idea that it covers any instance of including opposition groups in joint national governments (Walter, 2002) through to formal understandings that stress particular institutional designs, like consociationalism (Lijphart, 1969). For this article, we follow Ottmann and Vüllers’ (2015) understanding of power-sharing as an arrangement between the government of a state and a rebel group that promises to establish institutions that mandate joint control of power at the national level of government. We focus exclusively on political power-sharing (albeit Northern Ireland also included minor elements of power-sharing in bureaucracy and the police).
Very few studies of conflict define polarisation carefully, with the exception of Esteban and Ray (2008, 2012). Instead, to find more precise definitions, we need to turn to the wider political science and sociology literature. The core understanding of polarisation sees it as a bimodal distribution of preferences at either extreme with little common middle ground (Fiorina and Abrams, 2008). But polarisation is not just an end point and it can also refer to the process by which actors move towards the extremes and become more distant from each other (DiMaggio et al., 1996). To capture this distinction, Esteban and Ray (2012) refer to ‘polarization’ (bimodal clustering around the extremes) and ‘bipolarization’ (the process of groups pulling away from each other, even if they never fully reach the extremes).
Existing understandings of polarisation embody three limitations when it comes to examining the fate of post-conflict societies. These limitations result in polarisation being used as a somewhat nebulous concept making it hard to be precise on whether it is fostered by power-sharing or not.
First, most approaches tend to assume that society is either polarised as a whole or not. Implicit in these approaches is an assumption that there is a single over-arching dimension of polarisation. Existing studies may observe rigid ethnic blocks (Lemarchand, 2006), certain groups overwhelmingly voting for particular parties (Guelke, 2012) or highly partisan electoral appeals (Jarstad, 2008), and then declare that whole society to be polarised, without drilling down to see what issues are more or less polarised than others. In reality, political actors may be radical in some issue areas, but not in others (Whiting, 2018a). In a post-conflict society, it is easy to imagine a cross-cutting socio-economic cleavage that displays no polarisation while an identity cleavage displays high polarisation. In short, any understanding of polarisation needs to see this as a multi-dimensional concept.
Second, measures of polarisation are often static and look only at snapshots of polarisation. Societies are often identified as either being polarised or not retrospectively, usually proven by the fact that tension or violence has broken out (e.g. Lemarchand, 2006 on the Great Lakes region). Admittedly, there is a small number of exceptions that trace changing rates of polarisation over time, notably the work of Poole and Rosenthal (1997), but this is not usually applied in the post-conflict context. Yet, polarisation is a dynamic process, as captured Esteban and Ray’s (2008) notion of bipolarisation, and the spatial distance between rivals may expand and contract over time. Therefore, a temporal dimension is necessary for understanding polarisation.
Third, existing understandings tend to look at either elite polarisation or mass polarisation, but rarely both. Instead, it is typically assumed that there is a relationship between the two, with either elites following the will of the masses or, more often, elite behaviour setting an example which the masses follow (Barber and McCarty, 2015). Indeed, many of the critiques and defences of power-sharing look only at the elite level and implicitly assume that post-conflict societies should be appraised solely or primarily by what is happening within elites. Given this often exclusively elite focus, it is necessary to bring back in the level of mass polarisation too.
To overcome these limitations, we conceptualise polarisation as multidimensional and seek to disaggregate competition into different issue areas to see which are more or less polarised. We conceive of polarisation as a longitudinal process and seek measures that can track the dynamic nature of this process. Finally, we think of polarisation as operating at two levels (elite and mass), which may or may not be connected, but both of which need to be examined.
The Case of Northern Ireland
Northern Ireland is one case of a broader universe of internal conflicts brought to a negotiated end in the post–Cold War period through power-sharing. The diverse array of cases makes it futile to identify a ‘typical’ or ‘representative’ case – the commonalities between Bosnia, Burundi, Iraq, Lebanon and Northern Ireland (among others) are hard to find. Instead, it is preferable to look for influential cases that provide privileged insights into an empirical puzzle. Given Northern Ireland’s framing as a model for others to follow, it can serve an important ‘pathway case’ (Gerring, 2007) for these debates.
The conflict in Northern Ireland is the United Kingdom’s longest standing and deepest example of polarisation. While a full overview of the conflict is beyond our scope (see English, 2003), the key point for this analysis is the remarkable depth of polarisation throughout the conflict. Beginning in 1969, a violent conflict was waged between Irish republicans (Sinn Féin and the Irish Republican Army (IRA)) fighting to force Britain out of Northern Ireland and the British army and British loyalists (most notably the Ulster Volunteer Force) seeking to remain in the United Kingdom. This resulted in over 3000 deaths and more than 50,000 injuries. From the Irish nationalist perspective, since its foundation in 1921, Northern Ireland was deliberately designed to ensure and favour a Protestant majority at the expense of a Catholic minority, with high levels of discrimination in public sector employment and public housing (Farrell, 1990; Whyte, 1983). There was deep segregation in the labour market, neighbourhoods were segregated, education and civil society were separate for the two communities, and there were very low rates of inter-community marriage. This was the baseline level of polarisation for when the conflict eventually came to an end.
The conflict ended following an IRA ceasefire in 1994 (interrupted briefly in 1996–1997) and a subsequent power-sharing deal in 1998. The 1998 Belfast Agreement institutionalised a form of consociational power-sharing (O’Leary, 1999). It established a devolved Northern Ireland Assembly using Proportional Representation–Single Transferable Vote (PR-STV) – a variant of Lijphart’s recommended use of closed list PR. Upon election to the Assembly, members are asked to declare themselves as ‘nationalist’ (Sinn Féin and the Social Democratic and Labour Party (SDLP)), ‘unionist’ (Democratic Unionist Party (DUP) and the Ulster Unionist Party (UUP)), or ‘other’ (Alliance Party). 2 These designations are then used to give both communities veto power over potentially divisive legislation. Electoral competition is within each block rather than between blocks, with Catholics and Protestants overwhelmingly voting only for nationalist or unionist parties, respectively (Garry, 2016). Under the peace deal, Northern Ireland remained part of the United Kingdom, but it included the provision for a possible referendum to decide whether to remain in the United Kingdom or to reunify with Ireland, with both Britain and Ireland agreeing to facilitate the outcome of any such poll.
After 20 years, the record of power-sharing is mixed. Violence has been eliminated and the IRA is in a permanent state of retirement, albeit some minor violence remains – 14 people were killed in the 5 years between 2013 and 2018 (Nolan, 2018). Former spoilers turned into stakeholders and all the main parties now work through the power-sharing institutions, including the DUP who initially rejected the deal until it endorsed the St Andrews Agreement in 2006/2007. There have been productive periods between the parties, both in terms of volume of legislation passed and positive inter-personal relationships, notably between 2007 and 2011. Famously, the DUP’s leader Ian Paisley, who once declared of Sinn Féin ‘I am not going to sit down with bloodthirsty monsters who have been killing and terrifying my people’, and former IRA commander Martin McGuinness developed such a positive working relationship as co-leaders of the Executive they were christened the ‘Chuckle Brothers’ in the media.
But politics in the region remains a challenge. In its first decade, power-sharing was suspended four times (twice for 24 hours, once for 3 months, and once for 5 years). Politics can get bogged down by clashes over identity issues, especially parades, flags, support for the Irish language, and how to deal with the past. Over the last 5 years, the Assembly led a precarious existence and it came as little surprise when it eventually collapsed in January 2017 for 3 years. The catalyst for the collapse was the mismanagement of a renewable heating policy by the DUP, but this came on top of the previous years’ simmering tensions around identity politics. However, others have argued that the Assembly actually performed some functions fairly well despite experiencing stalemate (Huaghey, 2019).
Academic debates over power-sharing in Northern Ireland have been almost as divided as the region itself. Its proponents point to a decline in violence, argue it achieved a breakthrough where other initiatives failed and highlight how it restored legitimacy to a weak political entity (McGarry and O’Leary, 2004). Other supporters have pointed out that power-sharing has not prevented additional policy dimensions from emerging or led to outbidding (Garry et al., 2017; Mitchel et al., 2009). Murtagh (2015) has found some convergence in public attitudes under power-sharing and cross-party convergence on non-ethnic policies. Hayward and McManus (2018) note that the largest proportion in the electorate today are those who do not identify themselves as either nationalist or unionist and this trend stands in contrast to dominant narratives of a ‘culture war’ under power-sharing.
Yet, critics maintain that power-sharing, and the way it was brought about, undermined mass support for the new political system generally by institutionalising lying and political manipulation (Aughey, 2002; Dixon, 2008) and entrenching community divides (Taylor, 2006). It is seen as rewarding the historically ‘extreme’ parties of the DUP and Sinn Féin at the expense of the moderate UUP and SDLP. It was also seen as marginalising the ‘other’ grouping (albeit the Alliance Party and others have seen an electoral surge over the last 3 years – see Figure 1). It has also been blamed for low levels of ‘bread and butter’ politics (Nolan, 2013). Even those who are not explicit critics of power-sharing have found that it can have detrimental consequences – Sinn Féin has used the legacy of the past and the divided politics of memorialisation as a way to gain political power and influence (McDowell, 2007). As a result, some have gone so far as to suggest that any gains have come about despite power-sharing rather than because of it (Wilford, 2010). It is to evaluate these competing debates that we now turn.
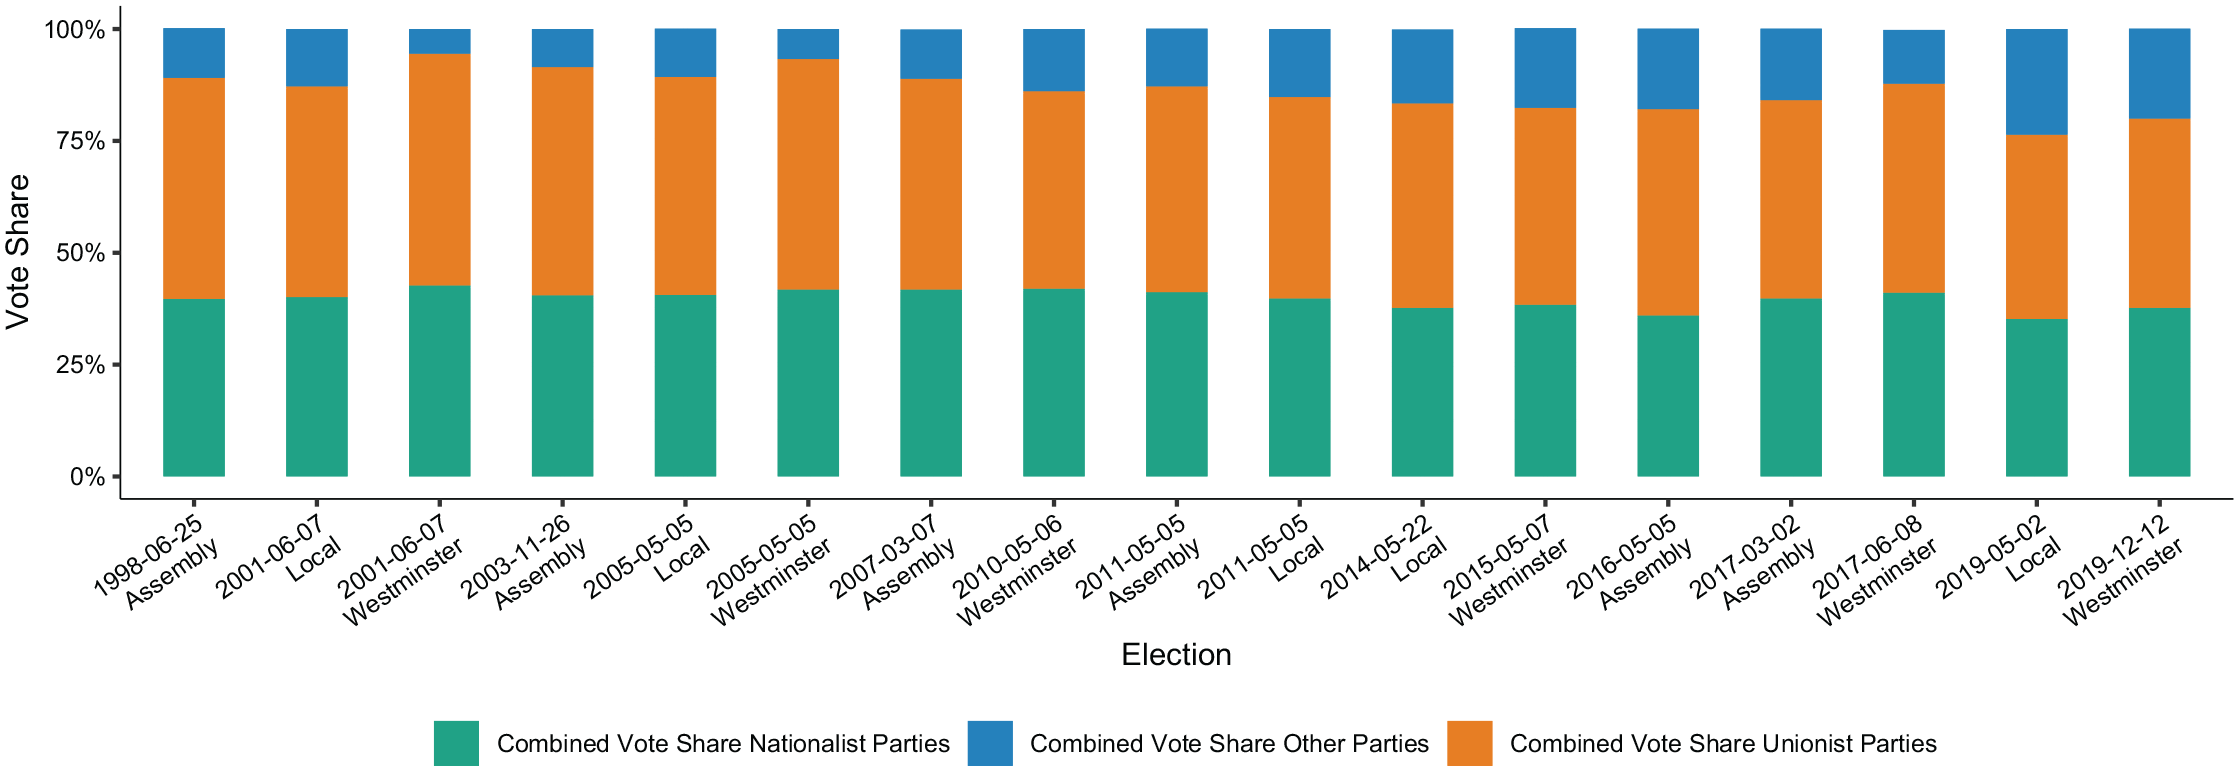
The vote shares of ‘Nationalist’, ‘Other’ and ‘Unionist’ Parties in all elections between 1998–2019.
Findings
Political Issues Under Power-Sharing
The Northern Irish experience defies claims that power-sharing entrenches identity politics at the expense of ‘bread-and-butter’ politics. All votes in the Northern Irish Assembly for a 20-year period until 2018 were coded into issue areas – a total of 810 votes. This is a relatively small amount, but it is worth remembering that the Assembly was suspended for 5 years (2002–2006), did not function for 3 years (2017–2020), and a number of policies are reserved by Westminster, such as macro-economic policy, most taxation and foreign policy. For coding, the full legislation was read by two researchers independently and the initial Assembly debate around the legislation was reviewed, and discrepancies were reconciled through discussion (see Supplemental Appendix for details). Of course, some may claim that all issues in a deeply divided society are underpinned by identity politics, even if they may not initially appear so. It is easy to imagine, for example, education legislation quickly getting wrapped up into arguments over whether a curriculum favours one side more than another. Therefore, if initially non-identity-based legislation became embroiled in identity-based issues, then it was coded as identity-based politics.
These results are displayed in Table 1. This shows that votes on issues related to ‘Peace and Conflict, Identity Issues and Cultural Politics’ accounted for 20.4% of all legislative votes. Unsurprisingly, this was higher in the early years until 2010 (and particularly high in 2002 immediately prior to the Assembly’s 5-year collapse), but since 2011 has typically been in the teens (2017 is an anomaly due to only holding three votes that year). This did not prevent issues related to ‘Welfare and Quality of Life’ (23.7%), the ‘Economy’ (12.7%), ‘Justice Policy’ (8.1%) or ‘Miscellaneous’ issues (13.2%) being addressed.
Policy Votes in the Northern Ireland Assembly (as Percent of All Legislative Votes).
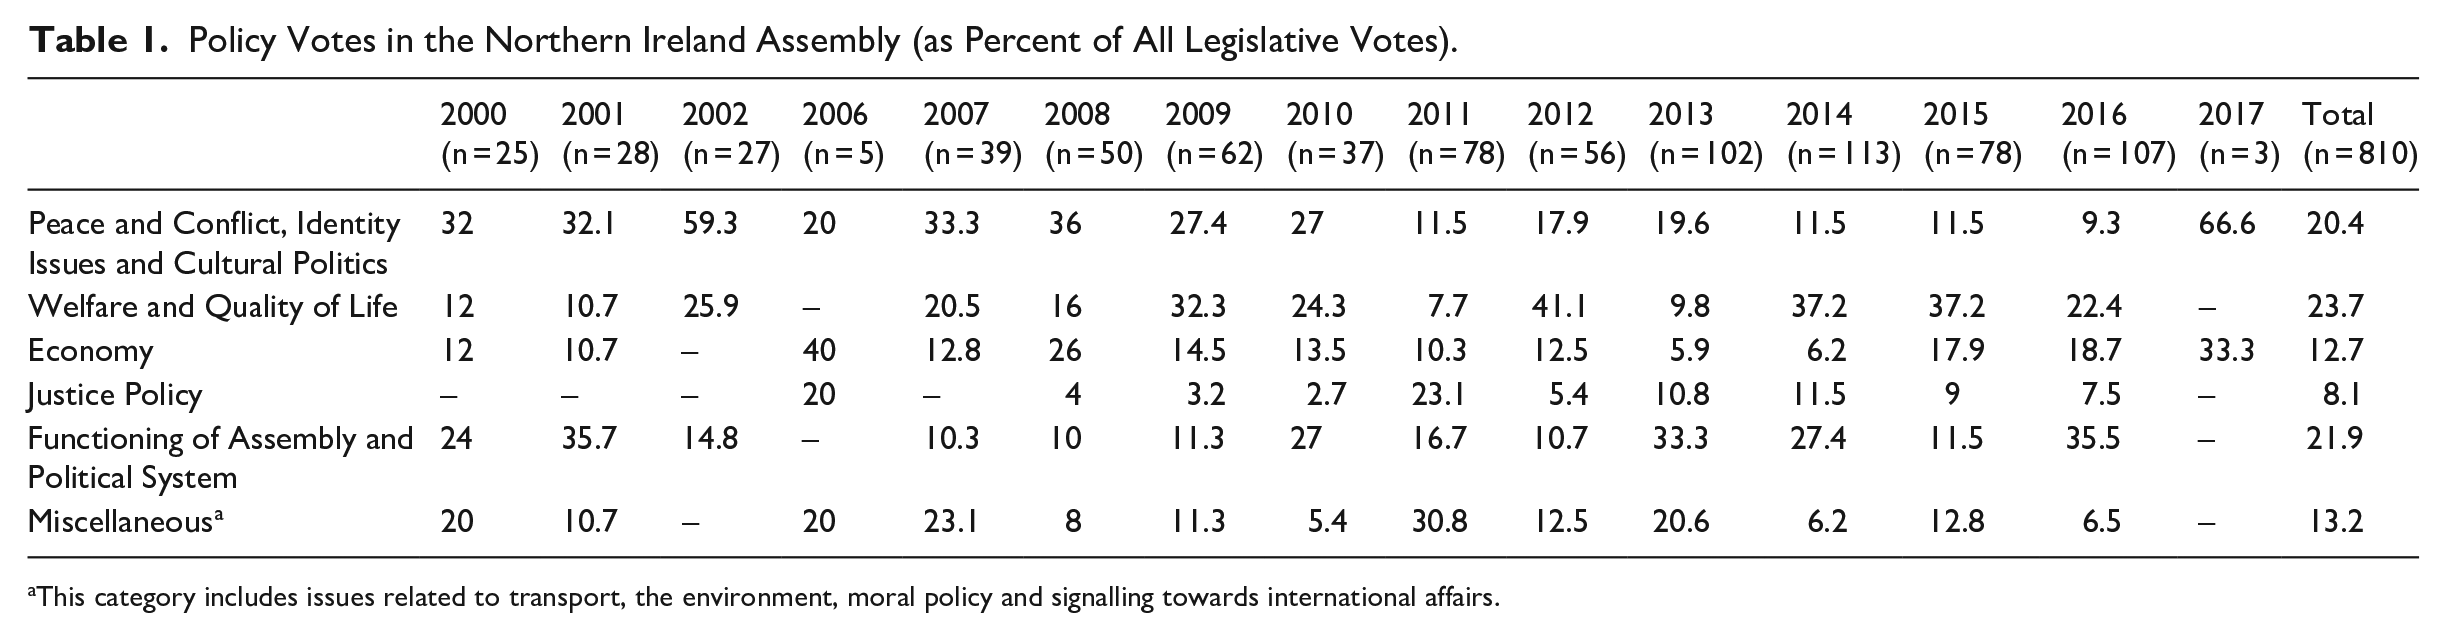
This category includes issues related to transport, the environment, moral policy and signalling towards international affairs.
This only covers issues that made it to the voting stage in the Assembly and it is possible that identity-based politics never make it this far, thus underestimating its salience. Therefore, we also undertook content analysis of the manifestos of the main political parties (see Supplemental Appendix for full coding details). We coded manifestos for all Assembly elections (1998, 2003, 2007, 2011, 2016), except for 2017. This year was excluded because there was an election the previous year and three of the main parties produced very short manifestos just reiterating or referring to the previous manifesto.
Manifestos show the same pattern as legislative voting. As a proportion of all issues covered, issues related to ‘Peace and the Peace Process’ and ‘Cultural Politics and Identity Promotion’ declined for all parties while issues related to the ‘Economy’ and ‘Welfare and Quality of Life’ were the most salient (see Figure 2). This trend is most stark for the historically ‘extreme’ parties. For Sinn Féin, issues related to the peace process and cultural politics covered almost 40% of its manifesto in 1998, falling to a low of 18% in 2011 and then 24% in 2016. The most dramatic decline has come from the DUP, who went from a high of almost 50% in 1998 to 13% by 2016, with the turning point coming from 2007 onwards once the party accepted the peace process.
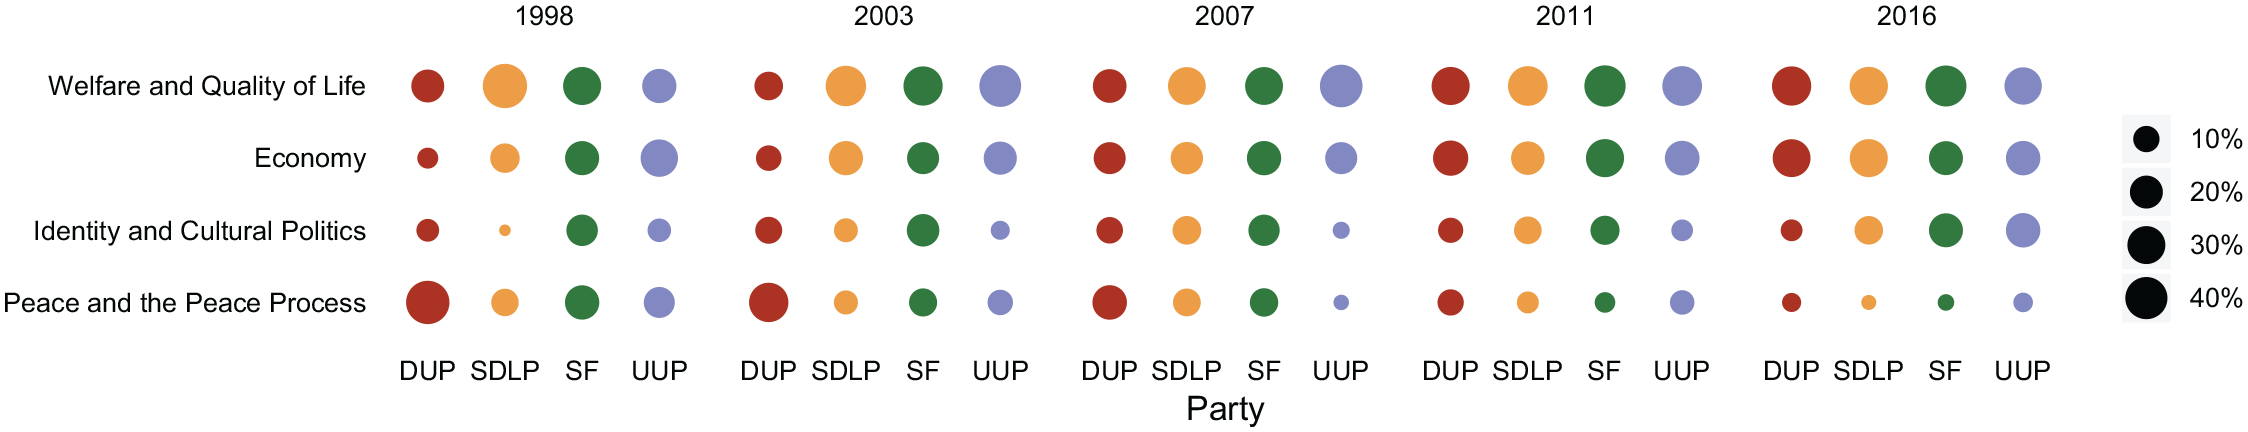
Policy areas covered in manifestos.
Elite Behavioural Polarisation
In order to examine if legislators undergo bipolarisation or become polarised, we applied the DW-Nominate (Dynamic-Weighted Nominal Three-Step Estimation) scaling method of Poole and Rosenthal (1997) to all votes in the Assembly. Using legislators’ voting records, we calculated the ideal point of each legislator in a two-dimensional space and tracked legislators across successive parliaments to see if the distance between members of different parties increased or decreased.
Some caveats are worth noting about this method for measuring polarisation. The primary dimension, or the one that explains most of the variation in legislator voting, generally captures inter-party conflict. Individual legislators’ positions on these scales reflect a mix of ideological positioning and constituency interest as well as party loyalty and discipline, but it is contested as to how much the scale reflects each of these different interests. For example, Lee (2009) claims it is primarily a measure of partisanship while Poole (2007) claims that it is about ideology.
To date there have been five parliaments in Northern Ireland since power-sharing was introduced. However, the second parliament was suspended for 5 years after just 10 votes due to an unwillingness by unionists to share power with Sinn Féin in light of a failure by the IRA to disarm. Therefore, we only include the First, Third, Fourth, and Fifth Assemblies for the W-Nominate analysis (cross-sectional analyses of each parliament), but all Assemblies are included in the DW-Nominate analysis (which tracks over time).
The results are shown in Figure 3 and Table 2. Table 2 shows that the overwhelming amount of legislator behaviour can be explained by just one dimension (90% or higher, except for the Third Assembly where it was 88%). The second dimension only explains an additional 2%–9% of voting behaviour. This is not distinctive to Northern Ireland; Hix et al. (2006: 498) report a similar picture in the EU Parliament, US Congress and Senate, and the UN General Assembly. Although the method does not tell us what constitutes these dimensions, previous research strongly indicates that the primary dimension in Northern Ireland is, unsurprisingly, a nationalist-unionist divide while the secondary dimension is an economic left-right (a dimension that is stronger within the unionist community than the nationalist one) (Evans and Duffy, 1997).
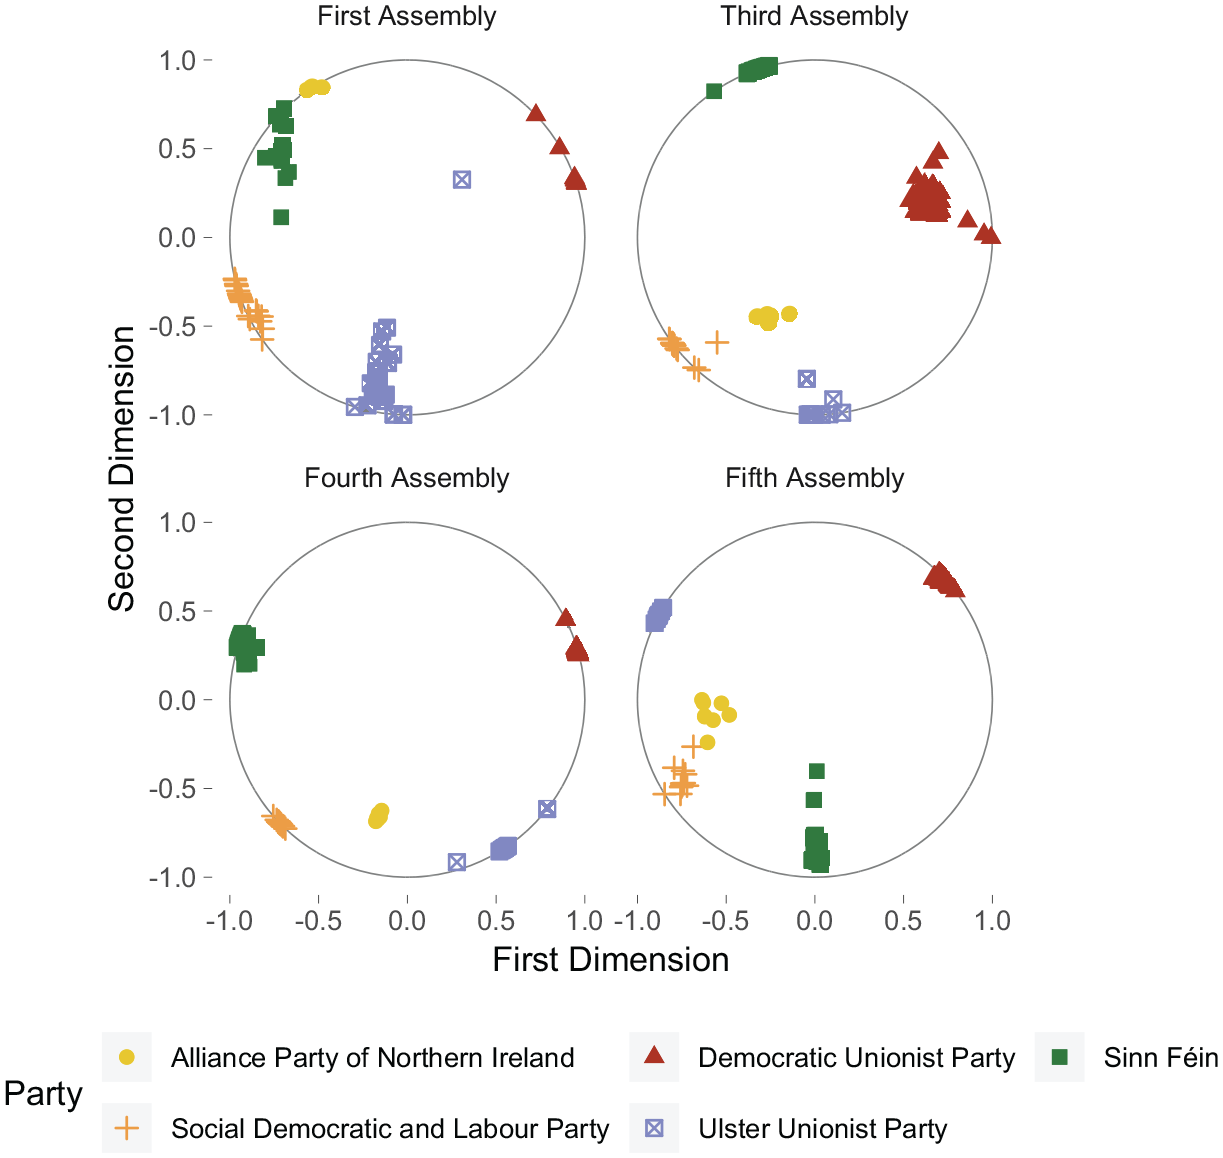
W-Nominate analysis of legislator voting.
W-Nominate scores for the Northern Irish Assembly.
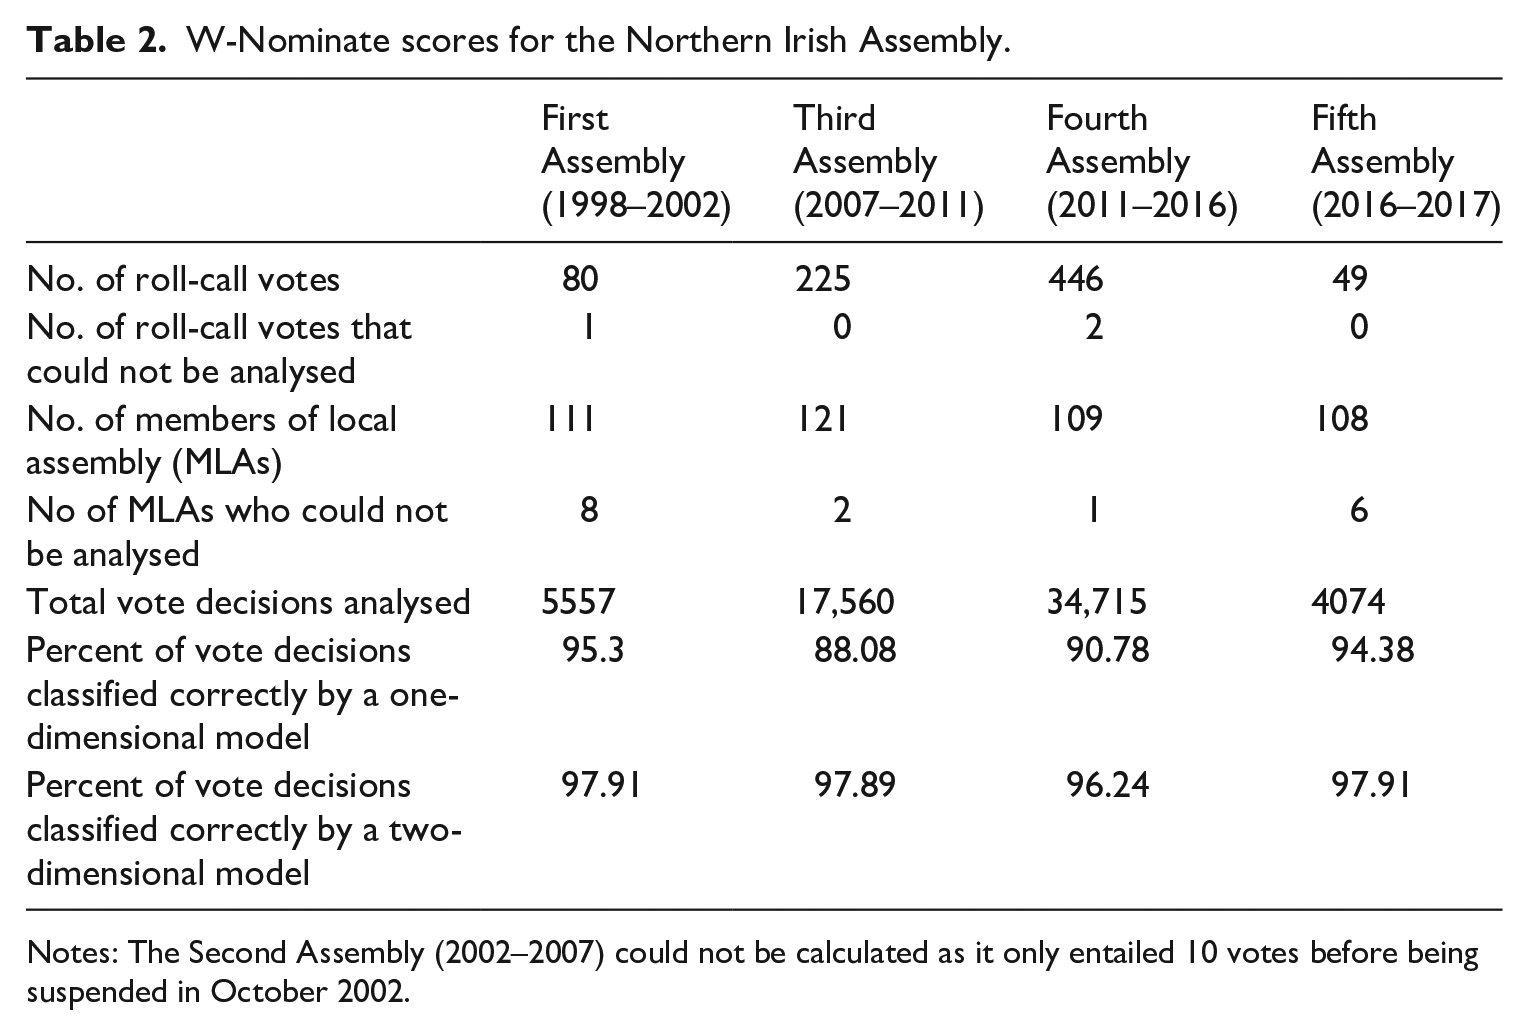
Notes: The Second Assembly (2002–2007) could not be calculated as it only entailed 10 votes before being suspended in October 2002.
Figure 3 shows the changing positions of the parties for each successive Assembly – each symbol represents the ideal point of one individual legislator based on an aggregate of all their votes in that Assembly. It shows that all parties became a lot more cohesive over time and individual legislators within each party begin to vote much more as a tight block. Figure 3 also shows the spatial distance between the parties and how this changed along two dimensions. At a glance, this demonstrates that the only time that full polarisation set in was in the Fourth Assembly between Sinn Féin and the DUP on the first dimension, but with simultaneous convergence on the second dimension. In the other Assemblies, we generally see the parties move towards each other on the first dimension while the pattern is somewhat more variable on the second dimension but without great distances ever emerging.
This can be more easily seen in Figures 4 and 5, which show the distance between the average position of each party’s legislators across the Assemblies on the first and second dimension, respectively. The scale ranges from −1 to +1 so the maximum possible distance between parties is a score of 2. Figure 4 shows that initially the main distance was between the unionist DUP (who rejected the peace deal) and all other parties (who agreed to the peace deal). After this starting point, there was a general convergence before full polarisation in the Fourth Assembly and a return to convergence in the Fifth Assembly. Yet, the Fourth Assembly was the most productive in terms of volume of legislation passed, while the Fifth Assembly collapsed despite clear convergence, indicating that there is no clear link between polarisation and performance. Figure 5 shows that on the weaker second dimension the pattern was more variable. Again, this is indicative that this dimension is not the ethno-national divide, but one that cuts across this divide. Another finding of note is that rates of polarisation within each block are almost as great as the rates between each block, especially for the unionist parties. In the First Assembly, the space between the UUP and the DUP was as great as the space between the DUP and Sinn Féin.
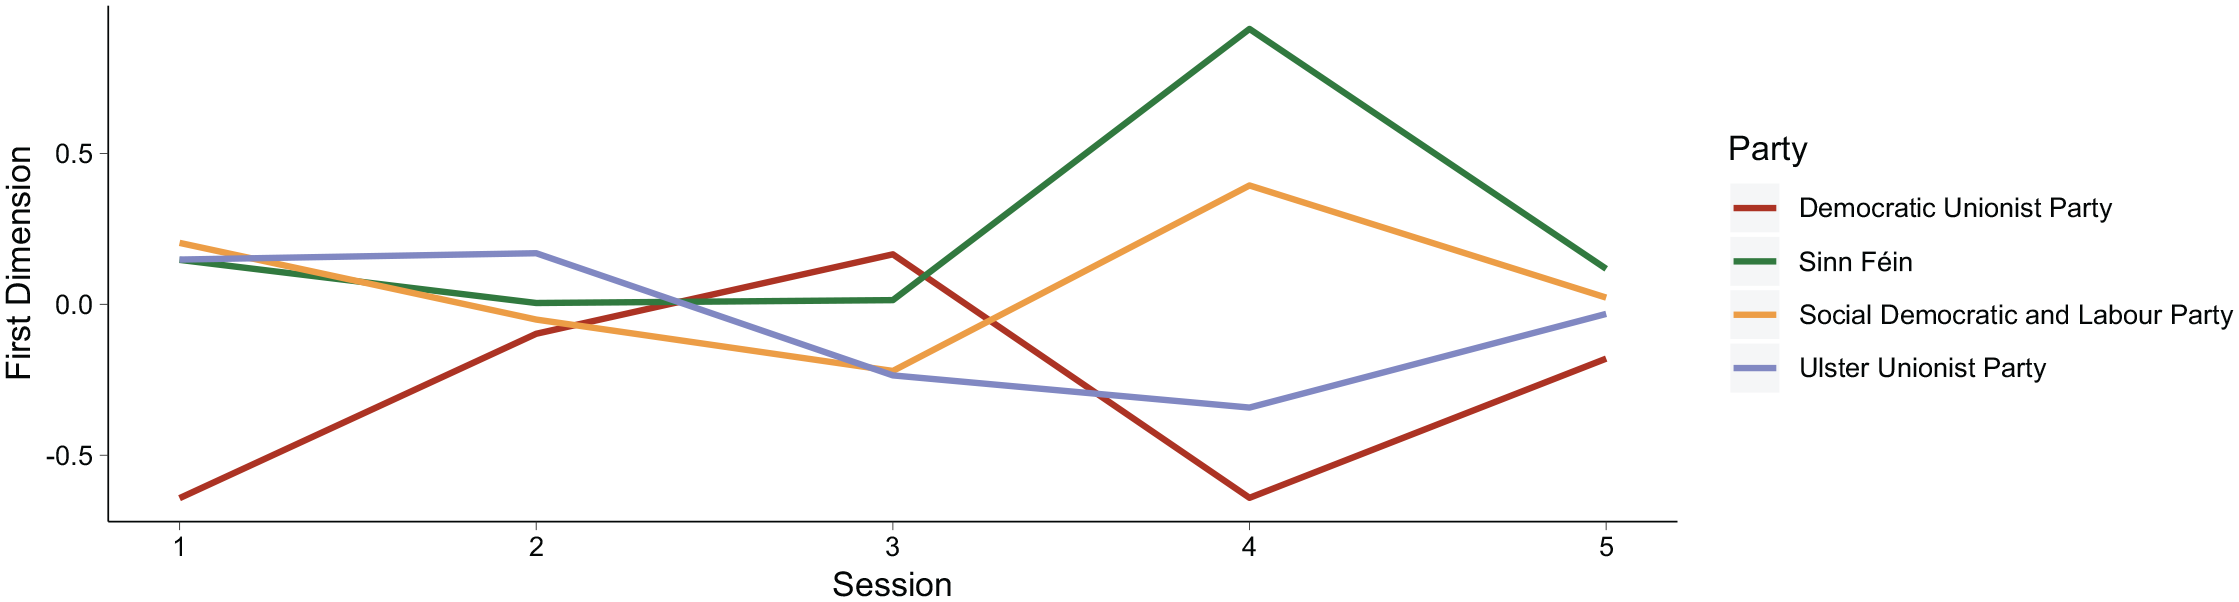
Mean score of parties’ legislators on First Dimension.
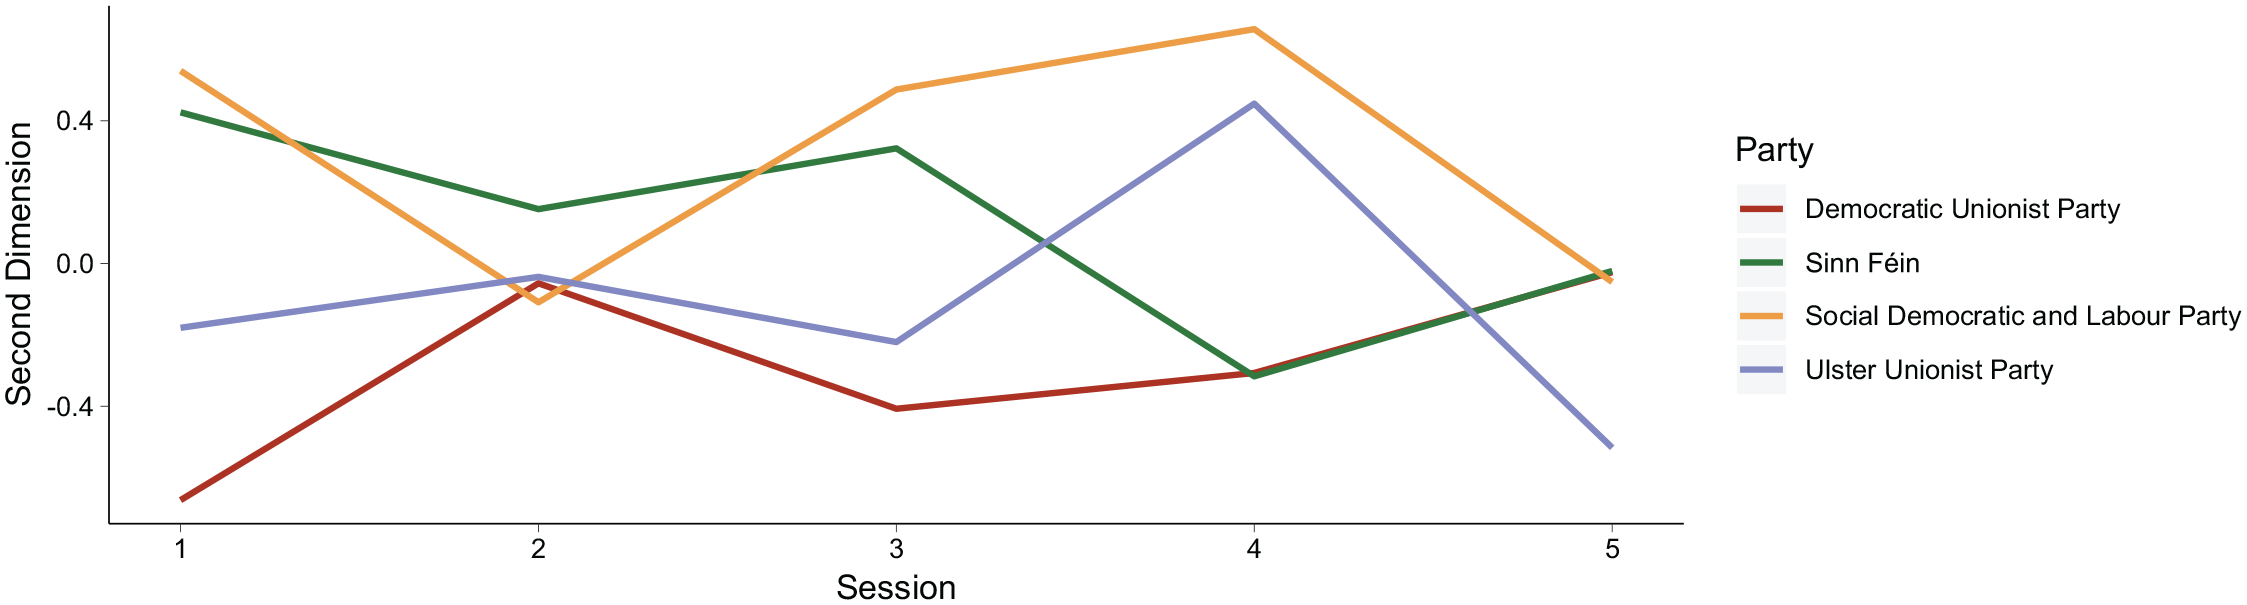
Mean score of parties’ legislators on second dimension.
Overall, the Northern Irish Assembly has only been polarised once (during the Fourth Assembly). This was driven by Sinn Féin and the DUP and it relates to one dimension only (presumably a nationalist-unionist one), albeit this is by far the most significant dimension of party competition. What is more, rates of nationalist-unionist polarisation did not predict the overall functioning of the Assembly.
Manifesto Polarisation
Legislator behaviour only looks at how party members behave when an issue makes it to an Assembly vote. It is also important to examine the positions parties take when making more general appeals on a full array of issues. For that reason, we also examined manifestos. Although very few voters read even part of a manifesto let alone the whole thing, manifestos provide insights into the broad spectrum of policy positions a party adopts (Laver and Garry, 2000). What is more, because they are produced by all parties at regular intervals in a similar format, manifestos are an invaluable tool for comparison both across parties and over time. We examined all manifestos of the main parties in every Assembly election from 1998 to 2016 (five elections). Manifesto data was used in two ways: to give a measure of policy position and to indicate how salient a policy was to a party. We then judged the distance between different parties’ policy positions on multiple issues to estimate the degree to which they were polarised or not over time.
We followed the coding method of the Comparative Manifesto Project, but with two additional categories for Northern Ireland’s post-conflict context: ‘Conflict, Peace and the Peace Process’ and ‘Identity and Cultural Politics’ (see Supplemental Appendix). In order to create comparable scales across parties and over time, we followed the method of Lowe et al. (2011). This combines different individual issues to create overarching latent categories (e.g. a ‘general left-right’ category is a combination of responses covering economic policy, welfare redistribution, government planning, and moral policy). We also followed their method for producing scales to see how important a policy is relative to other issues in the manifesto.
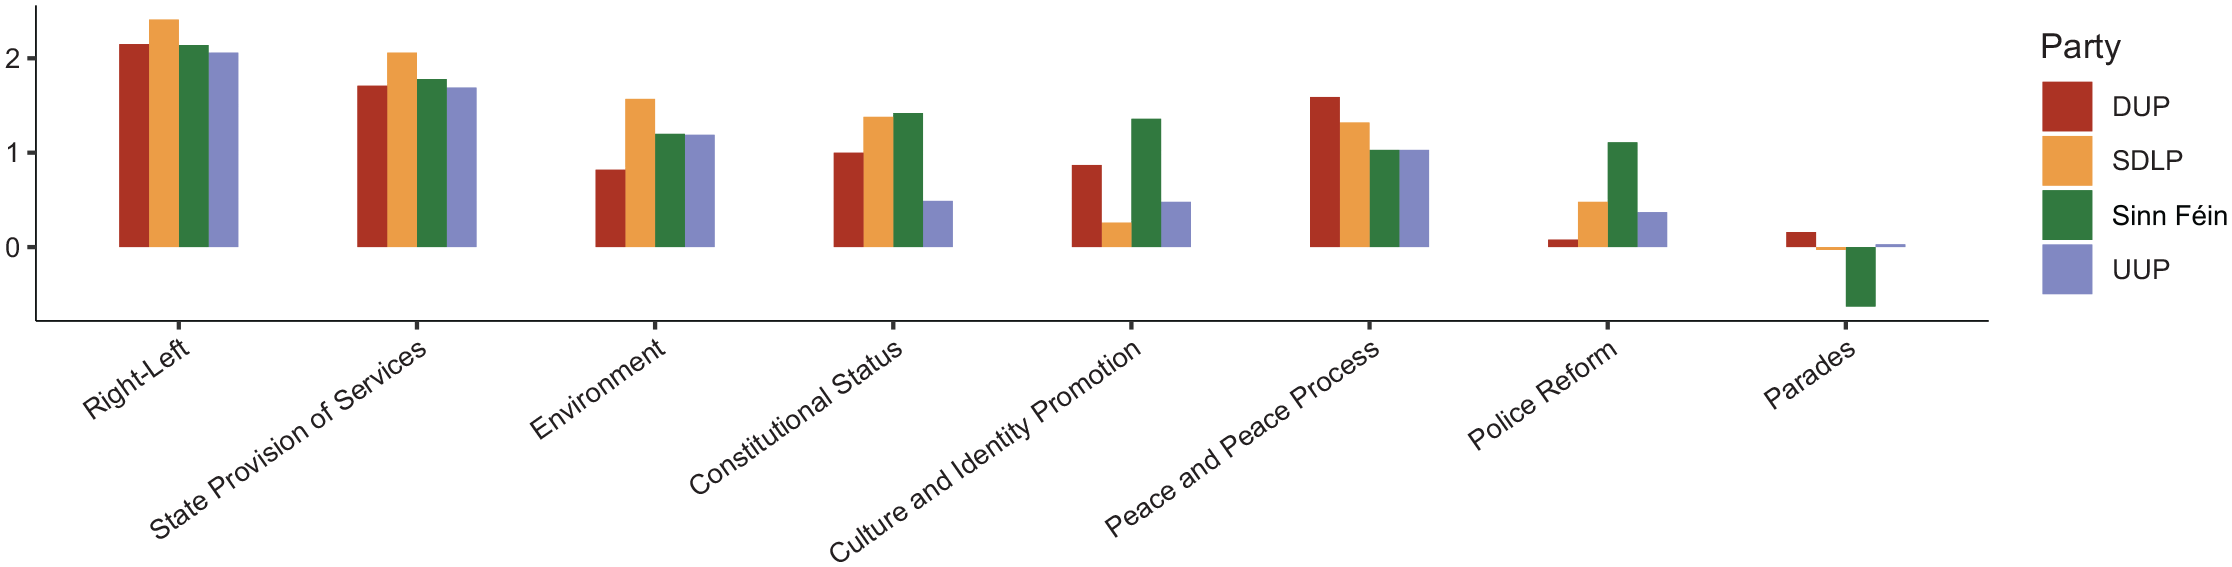
Figure 6 presents the policy positions of the parties across five overarching categories. This shows convergence between parties on socio-economic issues in a left-of-centre position, convergence on issues related to the peace process, but ongoing polarisation on identity issues.
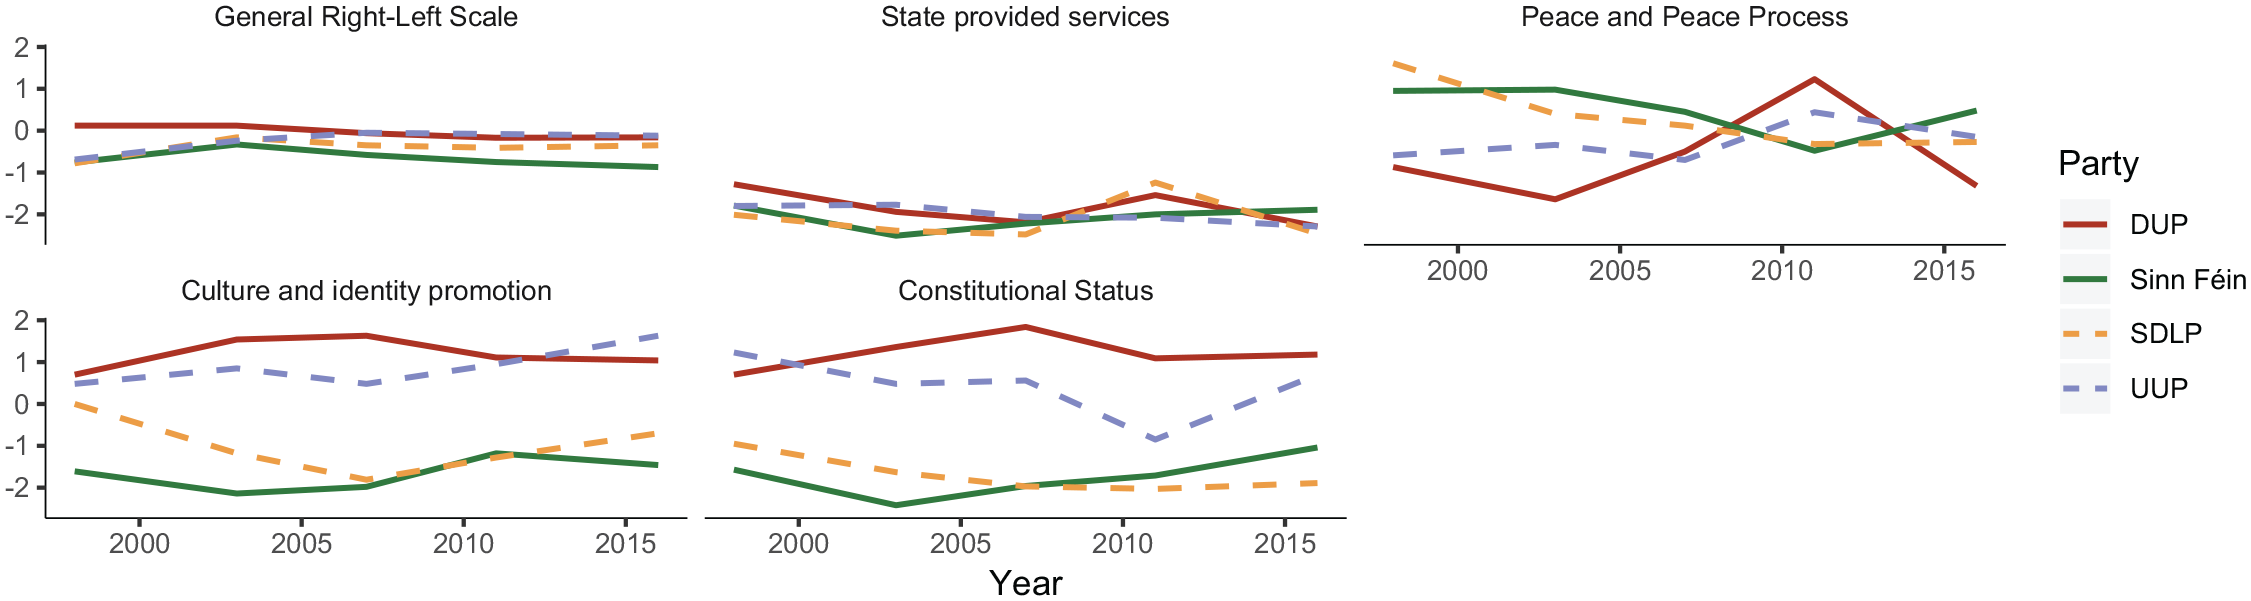
Manifesto policy positions of selected categories.
In the general left-right scale, all parties were left of centre, but with the DUP initially somewhat more centrist before moving left by 2016 – a position which all parties ended up on except for Sinn Féin who pulled slightly further left. However, even then, the spatial distance is not that great. Similarly, all parties saw a clear role for the government in providing welfare services. Other socio-economic scales (not depicted here due to space limitations) showed a similar picture of an overall left-of-centre party system, albeit with small divergences but all parties remaining on the left and more characterised by convergence.
Looking at the ‘Peace and Peace Process’ scale, this depicts how supportive parties are of the peace process and how much they advocate political accommodation with rivals or whether they focus on the problems or drawbacks related to the peace process (higher numbers imply greater support, lower numbers greater criticism). Initially, the highest levels of support were within the nationalist parties and lowest levels of support within the unionist parties, before all parties converged on a neutral position by 2016, apart from the DUP who become more critical. This did not necessarily reflect a falling away of support for the peace process but instead showed its declining importance to the parties after 20 years (see Figure 7). If anything, this implies decreased polarisation amid declining salience.
The average ‘policy importance’ scores of manifesto issues.
When it comes to policies related to the promotion of a particular identity or the rightful constitutional status of Northern Ireland, there remains significant polarisation (higher numbers represent a unionist position while lower numbers represent a nationalist one). The dimension ‘Culture and Identity’ showed clear and consistent polarisation between the unionist and nationalist blocks. There was also evidence of the historically more moderate parties on both the unionist (UUP) and nationalist (SDLP) sides moving towards the edges of the political space over time. This may indicate some outbidding, with moderate parties seeking to use cultural policies to harden their position in response to declining vote shares (see our discussion). ‘Constitutional Status’ examines parties’ positions on whether there should be a united Ireland or whether there should be closer ties to Britain. Unsurprisingly given these issues are the raison d’être of these parties, there was clear polarisation here too. Yet, this should not mask the fact there was also movement on this issue. Sinn Féin moderated their stance over time and, while still clearly in a nationalist position, shifted away from the extremes. The UUP briefly moderated its stance significantly before returning to a solidly unionist position in 2016. Other conflict-related and identity-based issues were also examined, including ‘policing reform’, ‘parades, flags and symbols’, and ‘amnesties’. While these displayed instances of polarisation, there were very few mentions of these in the manifestos at all.
Indeed, this is perhaps the real aspect of this analysis that is of interest – while cultural politics remained polarised, this was of less importance to all parties compared to bread-and-butter politics and issues like the environment. The importance of various dimensions for the parties in terms of how much this was emphasised in a manifesto relative to other issues is displayed in Figure 7, where higher numbers imply greater importance. Even those identity issues that according to the media are very high profile (parades, flags) were actually barely mentioned by any party.
Rhetorical Polarisation in Appeals to Grassroots
We also examined if polarisation was evident in the rhetorical appeals of party elites to their most committed supporters – party members at annual conferences. Language is an important component of political conflict and the words a political actor uses reflect underlying policy preferences and ideological positions. Thus, changes in the use of words relative to other actors can be used to estimate both bipolarisation and polarisation, provided an appropriate set of documents is selected for analysis. Even while acknowledging the importance of words as a form of data, a number of scholars have pointed out potential limitations to word-based content analysis. It has been argued that some speeches matter more than others in revealing underlying ideological positioning (Grimmer and Stewart, 2013), and that including irrelevant words may underestimate policy divergence as may the inclusion of extremely rare words that come up very infrequently (Lowe, 2008) – potential problems we seek to overcome in our analysis.
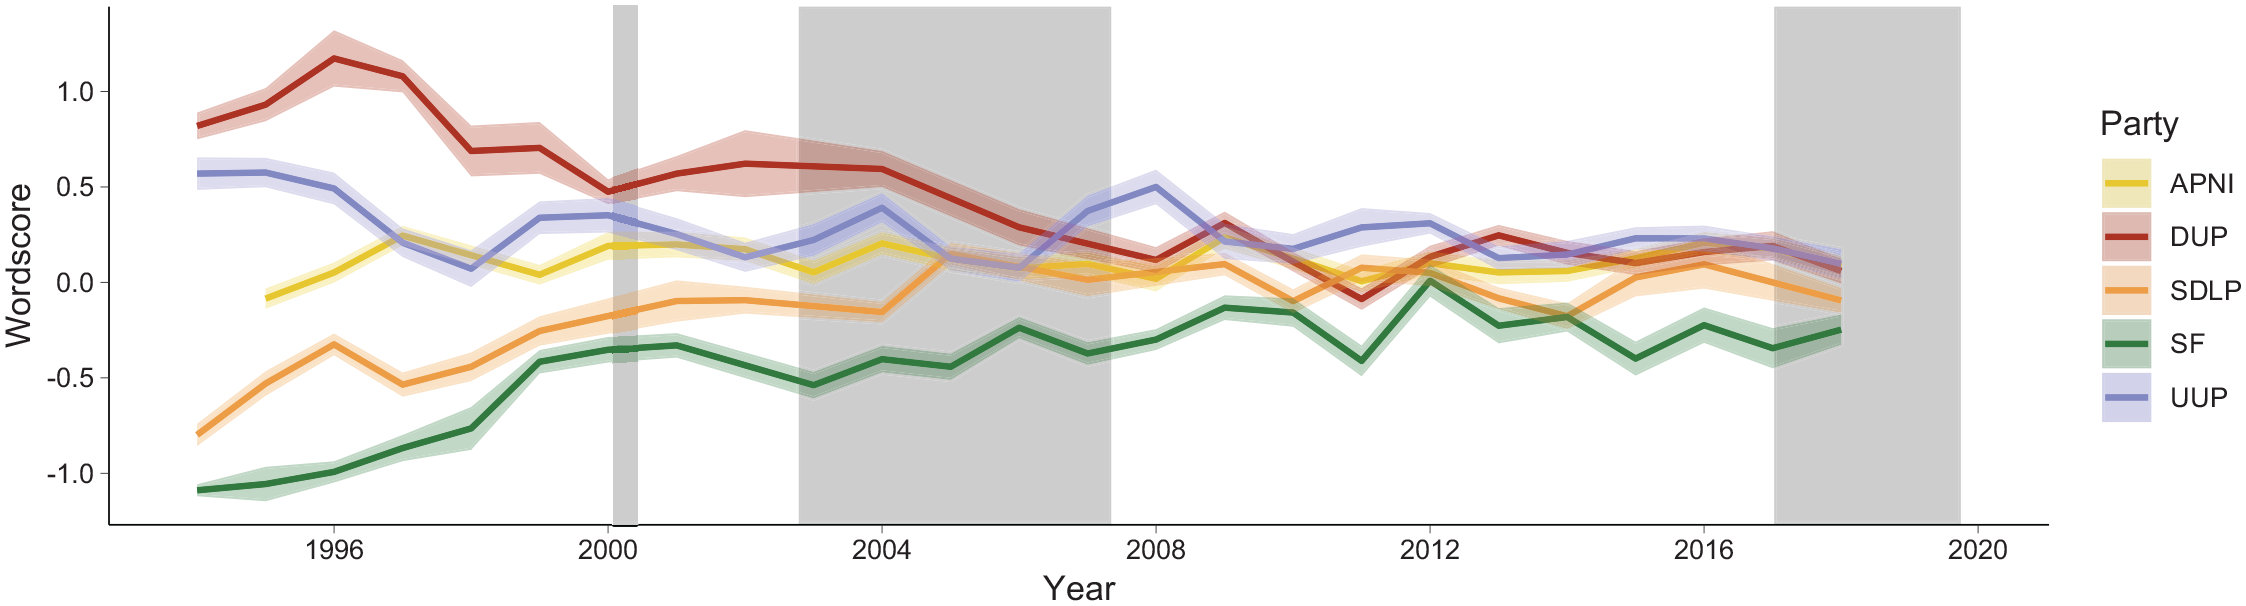
Using the ‘wordscores’ method (see Laver et al., 2003 and Supplemental Appendix), we examined all party conference speeches by leaders of the five main parties from 1994 to 2018 to look at the changing ideological positions of the party leadership. These were plotted on a scale running from −1 to +1, allowing us to estimate changes in distance from each other over time. A limitation of this method is that it aggregates words into one dimension when, as we argue, polarisation should be measured on multiple dimensions. However, this can provide important data over time, meeting our other key criteria of examining the temporal aspect of polarisation. Therefore, provided it is examined in conjunction with other multidimensional measures, it can provide valuable insights. To avoid the limitations mentioned earlier, we focused on speeches by leaders to conferences, which only the most cynical of observers would claim are non-ideological. We ensured we had a large ‘dictionary’ to compare words against by combining speeches by leaders of the five main parties between 1994 and 1997 (4 years prior to power-sharing). We removed all ‘stop words’ to reduce possible distortions from meaningless words and we followed the generally preferred MV method of rescaling (Martin and Vanberg, 2008). Wordscores also had good face validity in this context, as shown by the fact that it reflected wider developments within Northern Irish politics.
Figure 8 shows the changing policy position of leadership speeches over time and their ideological distance from each other. The shaded areas are times when the Assembly was suspended. What is immediately clear is a consistent trend towards convergence by all parties and a reduction in distance between even the ‘extreme’ parties of the DUP and Sinn Féin. There are moments where some parties pull away from each other, but these are soon countered by a stronger converging trend. For example, in the negotiating days between 1994 and 1998, when the DUP refused to recognise any potential deal, it was moving away from its UUP rivals; in 2002, when the Assembly collapsed due to the IRA’s unwillingness to decommission its weapons, Sinn Féin pulled away slightly from the other parties; in 2007, the DUP pulled away just as it agreed to accept the peace deal and the Assembly was restored – most likely as the DUP took steps to maintain its ‘hardline’ image even while in reality compromising. But in all such instances the parties soon returned to the overall pattern of convergence.
Changing policy positions of party leaders’ speeches.
Mass Polarisation
The picture at the mass level is similar to that at the elite level. When it comes to public opinion, there is no polarisation between Catholics and Protestants on socio-economic issues. Furthermore, cleavages on moral issues such as Lesbian, Gay, Bisexual, and Transgender (LGBT) rights or abortion are determined by age rather than ethno-national group. When it comes to attitudes towards the constitutional status of Northern Ireland and ethnic identities, polarisation remains. However, on attitudes towards symbolic politics, like the display of flags and partisan parades, there is less division between the groups. Behavioural indicators also show a decline in polarisation and a society that is not completely determined by an ethno-national cleavage.
To measure mass attitudes, we drew on the annually administered Northern Ireland Life and Times (NILT) Survey. Unfortunately, coverage can be a patchy as many questions tend to change or be dropped from year to year, depending on what is topical. Nonetheless, some key questions were consistently asked. In general, we sought to look at the extent to which attitudes aligned with clear partisan positions (Fiorina and Abrams, 2008) and then looked at the attitudinal distance between nationalists and unionists.
Turning first to attitudes towards socio-economic issues, we produced an ideological consistency scale (Abramowitz, 2010) based on six questions (these were only asked between 1998 and 2006 – see Supplemental Appendix). Figure 9 shows the percentage of the population classified as consistently economically left or right, disaggregated by nationalists and unionists. This shows that a person is not more likely to be left or right based on their ethno-national identity, that there is no real distance between these groups and that the rates for these groups did not change significantly over time. The mean score for unionists on this scale (lower scores were more economically left, higher scores more economically right) went from −2.5 in 1998 to −1.95 in 2006 with standard deviations of 3.27 and 2.84, respectively, indicating that this cohort did not get substantially more dispersed or spread out over time. While nationalists were slightly more left-wing, going from a mean of −3.06 in 1998 to a mean of −3.1 in 2006, their standard deviations also remained largely the same at a size of 3.15 and 3.04. The bimodality coefficient did not go above 0.36 during this time frame (a number between 1 and 0 where a coefficient greater than 0.56 would indicate a bimodal distribution (Lelkes, 2016)) and the overlap coefficient (a number between 1 and 0 where 1 indicates perfect overlap between the two groups) was consistently above 0.825.
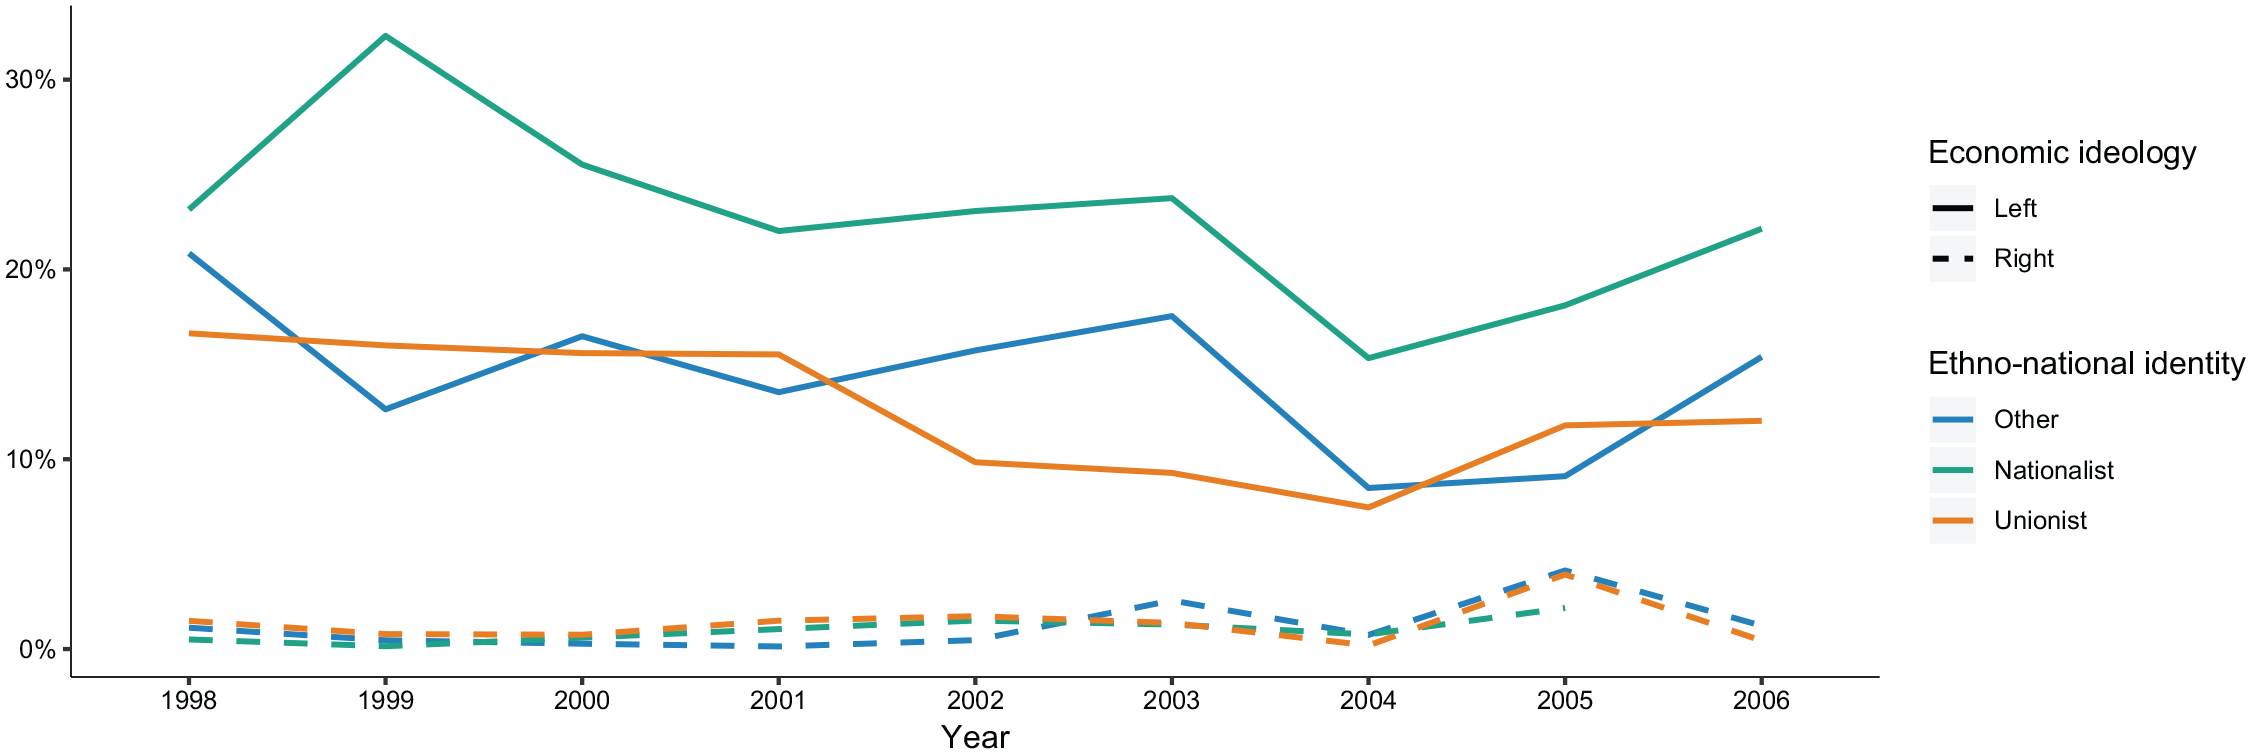
Economic left-right by ethno-national community.
How respondents think of their national identity has long been polarised in Northern Ireland; however, there is little polarisation when it comes to symbolic politics. Protestants overwhelmingly identify as British (67% in 1998; 63% in 2018); Catholics overwhelmingly identify as Irish (65% in 1998; 64% in 2018); while less than 5% of Protestants identified as Irish or Catholics as British in 2018. Yet, when respondents were asked whether they were annoyed by republican murals, kerb paintings or flags, 78% of Catholics and 61% of Protestants were not annoyed in 2004. These numbers stayed consistently high and by 2018 this had risen to 85% of Catholics and 66% of Protestants. The same pattern held for loyalist murals, kerb paintings or flags. In 2004, 62% of Catholics and 66% of Protestants were not annoyed by these, and by 2018, this was 67% and 72%, respectively. When respondents were asked whether they would mind if a close relative were to marry someone of a different religion, in 2014, 79% of Catholics and 60% of Protestants would not mind. By 2018, this had risen to 90% of Catholics and 81% of Protestants. There are also issues that have always cut across the sectarian divide, especially moral issues. These are determined by age than religion, showing that other non-ethnic cleavages are also evident. Attitudes to abortion and LGBT+ issues are the obvious examples here (Thomson, 2016).
In terms of mass behaviour, it is useful to look at voting behaviour, which shows that ethnic voting has not become locked in place. In 2007, 76% of Catholics felt closest to Sinn Féin or the SDLP while 24% chose an ‘other’ or no party, while 71% of Protestants felt closest to DUP or UUP. By 2018, only 49% of Catholics felt closest to Sinn Féin or the SDLP and only 50% of Protestants felt closest to the DUP or UUP. This was reflected in voting patterns too. Figure 1 shows all elections in Northern Ireland since 1998, showing a decline in the combined vote share of ethnic parties from 94% in 1998 to 76% by 2018, and a corresponding rise in ‘Others’ in their stead. Finally, turnout has generally been declining across almost all elections since 1998. These non-voters tend feel less close to the ethnic parties than their voting counterparts, highlighting that the ethnic tribune system has even less of a hold on this cohort. What is more, it does not appear to be the features of the consociational system itself that puts these respondents off voting (Garry, 2016).
One final proxy of polarising mass behaviour is rates of sectarian incidents and crimes. These have fallen dramatically since 2005/2006 when the recording began. In 2005/2006, there were 1701 sectarian incidents and 1469 sectarian crimes. By 2018/2019, there were 865 sectarian incidents and 622 crimes, almost a 50% reduction in incidents and 60% reduction in crimes.
Discussion
The findings can be summarised as follows: power-sharing did not prevent non-ethnic politics from emerging; elite polarisation is rare and when it happened it was not correlated with the collapse of the institutions; bipolarisation was limited, always short in duration and eclipsed by a stronger trend towards convergence; mass polarisation was not evident on either attitudinal or behavioural measures. While some polarisation remained between the parties in their electoral appeals around identity politics, this was not emphasised very much. Without wanting to dismiss the importance of these policies, these occurred within an overall context of lower salience than bread-and-butter issues. In other words, power-sharing did not result in the detrimental consequences that its critics would predict.
Alternative Possible Explanations
One potential criticism is that an alternative interpretation of our findings may be possible that still sees power-sharing as causing polarisation. It may be suggested that power-sharing causes polarisation, but it is not visible in our findings because there is some more powerful force at play that is counteracting power-sharing and creating centripetal incentives. However, the other forces that the literature typically sees as causing centripetalism are either absent in Northern Ireland or have not had an impact.
A common assumption is that increased contact with individuals from different backgrounds in everyday situations reduces divisions and increases tolerance (Niens et al., 2003; Pettigrew, 1997). For example, there has been a notable reduction in segregation in the labour market (except for the security sector where Catholics remain under-represented), and a decline in the number of wards where more than 80% of the population is of the same religion (Grey et al., 2018). There has also been a decline in segregation in owner-occupied and private rented housing driven by an increase in the size of the Catholic middle class; however, public housing remains highly segregated (Grey et al., 2018). Yet, even these limited indicators of less segregation have not translated into meaningful contact and ‘when contact happens it is characterised by politeness and avoidance of any acknowledged difference’ rather than an effort to engage (Hayes and McAllister, 2015 [2013]: 152). Education remains highly segregated with little integrated education, even if there has been a rise in shared education between separate Catholic and Protestant schools (Grey et al., 2018). The percentage of Catholics and Protestants married to someone of the same religion remained less than 15% throughout the post-conflict period and usually closer to 10% (Hayes and McAllister, 2015 [2013]; NILT, 2018). All religions report that the vast majority of their friends, relatives and neighbours are from the same religion (Hayes and McAllister, 2015 [2013]). Younger generations are displaying the same patterns as the general population, indicating that there is little evidence of change any time soon. As such, the idea that a contact thesis drives convergence does not hold when there is such limited contact between the two communities.
Another explanation may be that rising wealth has undermined the conflict divisions. Levels of wealth have certainly increased in Northern Ireland since the peace process and levels of unemployment have decreased for both communities. Gross Value Added per capita for Northern Ireland increased from almost £12,000 in 1998 to just over £21,000 in 2017 (ONS, 2018). Real household income also rose in the same period, increasing from an average of £9000 in 1998 to £15,800 in 2017 (NISRA, 2018). While unemployment rates for Protestants largely remained constant (5% in 1998; 4% in 2017), for Catholics they fell from 10% to 4% (The Executive Office, 2019). Yet, there is no reason to assume that increases in wealth reduce ethnic polarisation, especially given that inequality between the two communities remains complicated. Inequality has reduced with the expansion of a more affluent Catholic middle class, less labour market segregation and more social mobility. But 74 of the 100 most deprived super output areas (small statistical geographical areas) are majority Catholic (NISRA, 2017). 3 Inequality between the two communities has reduced but still persists, so this is unlikely to mitigate levels potential polarisation caused by power-sharing. Furthermore, reductions in inequality are the direct effect of power-sharing’s institutional reforms rather than some separate force.
One significant factor that may well play an important role in encouraging convergence is the electoral system of PR-STV. In theory, this preferential system should create incentives for parties to appeal to all voters in the hope of winning their lower transfers. In Northern Ireland there is some evidence of this happening. While candidates generally obtain the most transfers from other candidates in their party, there is also evidence of voters for moderate parties transferring to formerly extreme parties in their own block, namely, SDLP voters transferring to Sinn Féin and UUP voters transferring to the DUP. What is not evident is voters crossing the community divide to transfer their votes to historically extreme parties – both Sinn Féin and the DUP receive almost no votes from unionist or nationalist voters, respectively. Typically, this is also the case for the SDLP and the UUP, but since agreeing to form an official opposition and after appeals from their leaders to transfer votes, some evidence of unionists and nationalists transferring their votes across the divide to these parties was evident in 2017 (Barry, 2017). But given PR-STV works more within blocks, it does not explain the overall lack of polarisation between the blocks. What is more, the electoral system is an integral part of the overall power-sharing package and so its effect should be included in the effect of power-sharing on polarisation.
Explaining Northern Ireland’s Ambivalent Politics
If, as we argue, power-sharing does not entrench differences or increase polarisation, this raises the question of how we explain the ongoing salience of difficult identity politics despite its relative lack of emphasis by the parties and the electorate? There may well be no polarisation in the sense that critics would predict, but there can be no denying that the Assembly has been suspended four times, it collapsed as recently as January 2017 until January 2020, and Northern Ireland struggles to deal with the past.
We suggest this is best explained by the strategies adopted by the parties in an effort to differentiate themselves from their electoral rivals: in a system of overall convergence, parties are attempting to differentiate themselves on the ethno-national cleavage while simultaneously compromising on other issues. Such an explanation resonates with earlier findings around electoral behaviour (Mitchell et al., 2009) and post-conflict cleavages (Tilley et al., 2019). This, we suggest, is independent of the effects of power-sharing. As Chandra (2006) argues, ethnic identities may not be that different from other political identities and often ethnic identities are viewed by parties as a way to position themselves within the electorate. In such instances, ethnic identities are not ideologically driven exogenous entities that polarise a society around deeply antagonist and exclusive identities, but rather it is deploying them instrumentally for electoral gains. If this is the case, then identity politics may well be more flexible and less polarised than would be expected. As Manning (2019) has shown, former rebels turned political parties will continue to emphasise a civil war cleavage in the post–civil war period if it gives them electoral advantages, but not necessarily if it does not (Manning, 2019). This fits with the transformation of the radical parties in Northern Ireland, which saw them compromise on core issues and embrace reformist politics even while retaining their competing goals of a united Ireland or remaining within the Union (Tonge et al., 2014; Whiting, 2018b).
In the crowded electoral space of post 1998 Northern Ireland, and with rigid block voting, electoral differentiation became the key to success. Under these conditions, Sinn Féin and the DUP made clear commitments to the peace process, but also played up to their historically hardline image in an effort to be seen as the strongest protector of that identity (Mitchell et al., 2009). This did not lead to polarisation and Northern Ireland’s historic rivals are often cooperative with each other even if not always warm. Rather, identities are used instrumentally, albeit circling around an unchanged ethno-national ideological core, and so flexible enough to accommodate while still playing up to hardline images (Whiting, 2018b).
Perhaps the major factor that pushes instrumental identity politics to the brink despite the lack of actual polarisation lies in the moral hazard created by Westminster’s management of Northern Ireland. As a guarantor of the peace process, the British role has largely been to oversee it from a distance without interfering. However, any time it looked in jeopardy, successive governments under Tony Blair, Gordon Brown and David Cameron showed themselves willing to grant political or financial concessions (often at the urging of the government in Dublin and local parties). This, we suggest, meant that the local parties could engage in brinkmanship knowing a safety net of concessions was usually available. In other words, pushing the system to the point of collapse was strategic rather than down to ideological polarisation.
The support given to Sinn Féin during the peace process is well documented, including political support from the British and Irish governments and financial support from Irish-America. Even in the long drawn out process of decommissioning and winning the support of the DUP, the British government combined incentives (like devolving justice powers and tax rates) with disincentives (withholding salaries and passing unpopular policies from Westminster) (Hain, 2012). Blair personally offered amnesties to IRA members ‘on the run’ to secure their support for devolution. Even as late as 2014 under Cameron’s premiership, when the Assembly came close to collapse over legacy issues and symbolic politics, the Westminster government initially said further support was off the table before changing its position. The result was the Fresh Start Agreement for Northern Ireland (2015) and additional funding for the region to offset the costs of welfare reform being imposed throughout the United Kingdom. Even though Theresa May initially appeared less willing to follow this path, ultimately her government became reliant on the DUP in a confidence and supply agreement in 2017 and again more financial support was given to the region. These are only some brief examples, but the point is that when Northern Ireland reached a crisis point, the British government typically offered political concessions or financial benefits. Northern Irish parties do not necessarily have to suffer the consequences of the positions they adopt, instead blame shifting onto each other and onto Westminster while waiting for a rescue package. Where the trade-off lies between providing external support to a power-sharing settlement but avoiding moral hazard clearly requires further research.
Finally, it is possible that the idea of a large distance between the parties is the product of media portrayals rather than a reflection of reality. Murtagh (2015) found that candidates from non-ethnic parties believed that media depictions remained locked in an ‘Orange vs Green’ narrative and their coverage perpetuated this. Looking to evidence outside Northern Ireland, it has been found that media coverage of polarisation increases beliefs that the electorate is polarised (Levendusky and Malhotra, 2016). It has also been argued that the media has an economic incentive to cater to partisan audiences, thus increasing the sense of polarisation, even if the median ideology is centrist (Bernhardt et al., 2008). This is perhaps highlighted by the 2017 Assembly and Westminster elections, which were widely portrayed as polarising ones. These elections came soon after the Assembly had collapsed amid the DUP’s mismanagement of a renewable heating scheme and increased tension over the Irish language, and the Belfast Telegraph described the results as representing the new Balkanization of Northern Irish politics (O’Doherty, 2017). While we could not analyse the 2017 manifestos, our other data on elite speeches and mass attitudes indicate no great rise in polarisation at this time and, in fact, we found increased convergence and a rising vote share for other parties. Clearly, further research on media portrayals compared to empirical realities is needed to see how these may shape a sense of post-conflict polarisation.
Conclusion
Using a more careful understanding of polarisation, the case of Northern Ireland demonstrates that criticisms that power-sharing pulls parties apart may need to be rethought. This case has important lessons for elsewhere. It shows the value of developing a more expanded understanding of polarisation. Existing conceptualizations are overly static and one-dimensional. Our conceptualisation sees polarisation as multi-dimensional and accepts that political systems may be polarised in some issue areas while not being so in others. It also sees this as a dynamic process and, by tracing this over time, it is able to test for bipolarisation as well as whether a system has actually become polarised or not. Finally, it shows the value of looking to both the elite and the mass level. We also demonstrate a way to operationalise this conceptualisation by drawing on a range of empirical measures that tap into different aspects of elite and mass behaviour and preferences. Such a method is potentially transferable to other post-conflict settings.
We are not so bold as to claim that the pattern seen in Northern Ireland will be reproduced in every power-sharing setting. Context matters when it comes to the success or failure of power-sharing (Ottmann and Vüllers, 2015), and the streets of Belfast are very different than those of Baghdad. Nonetheless, Northern Ireland is a useful pathway case for this debate. If polarisation fails to emerge even in a hard case of consociational power-sharing with a history of entrenched divisions and very high segregation, then this is a vital lesson for elsewhere. At the very least, Northern Ireland implies that the entrenchment and increase in the political divisions under power-sharing is not what may be expected and any effort to posit a link between the two needs to be carefully documented and explored.
Supplemental Material
Power_Sharing_and_Polarization_Appendix – Supplemental material for The Myth of Power-Sharing and Polarisation: Evidence from Northern Ireland
Supplemental material, Power_Sharing_and_Polarization_Appendix for The Myth of Power-Sharing and Polarisation: Evidence from Northern Ireland by Matthew Whiting and Stefan Bauchowitz in Political Studies
Footnotes
Acknowledgements
The authors thank Ilarion Stupar for his research assistance. The authors also thank David Cutts, Tim Haughton, John Ishiyama, the attendees of the Politics After War workshop in Stockholm 2018 and the two anonymous reviewers for their feedback.
Declaration of Conflicting Interests
The author(s) declared no potential conflicts of interest with respect to the research, authorship, and/or publication of this article.
Funding
The author(s) received no financial support for the research, authorship, and/or publication of this article.
Supplemental Material
Notes
Author Biographies
References
Supplementary Material
Please find the following supplemental material available below.
For Open Access articles published under a Creative Commons License, all supplemental material carries the same license as the article it is associated with.
For non-Open Access articles published, all supplemental material carries a non-exclusive license, and permission requests for re-use of supplemental material or any part of supplemental material shall be sent directly to the copyright owner as specified in the copyright notice associated with the article.