
Abstract
Past research on the relationship between income inequality and turnout has produced mixed results, with some studies suggesting that income inequality leads to lower turnout while other studies find little or no significant effects. In this article, we investigate the extent to which these mixed results are due to the contingent nature of inequality on turnout, which depends upon the nature of the policy options that are presented to the electorate. We test these expectations on data from national elections in 30 established democracies from 1965 through 2017 covering 300 elections. Regression analysis using country-level fixed effects reveals consistent evidence in favor of our hypotheses: Inequality tends to have a negative impact on turnout, especially in depolarized party systems, but as party system polarization increases the negative impact of inequality is mitigated.
Keywords
Introduction
Income inequality has increased in many established democracies around the world (Alderson and Nielsen, 2002; Alvaredo et al., 2017; Organisation for Economic Co-Operation Development (OECD), 2011; Piketty, 2014; Smeeding, 2005). In most OECD countries, the gap between rich and poor is at its highest level for 30 years. Today, the richest 10% of the population in the OECD area earn 9.5 times the income of the poorest 10%. In the 1980s, this ratio stood at 7:1 and has been rising steadily ever since (Cingano, 2014). However, the rise in overall income inequality is not (only) about surging incomes at the top. Incomes at the bottom grew much slower during the prosperous years and fell during downturns, putting relative (and in some countries, absolute) income poverty on the radar of policy concerns.
A recent report by the World Economic Forum (WEF), drawn from over 700 experts in attendance, pronounced inequality to be the greatest threat to the world economy in 2017 (Elliott, 2017). According to the International Monetary Fund (IMF), income inequality matters for growth and its sustainability. Specifically, if the income share of the top 20% (the rich) increases, then Gross Domestic Product (GDP) growth actually declines over the medium term, suggesting that the benefits do not trickle down (Dabla-Norris et al., 2015). A recent Pew Research Center (PRC, 2014) survey found that the gap between the rich and the poor is considered a major challenge by more than 60% of respondents worldwide.
A diverse range of leading global figures such as former American President Barack Obama, Pope Francis, Chinese President Xi Jinping, and the head of the IMF, Christine Lagarde, have all offered speeches on the gravity of income inequality and the need to address its rise. Political scientists have also recognized this challenge. In 2004, an American Political Science Association (APSA) Task Force on Inequality and American Democracy (2004: 661) concluded “we know little about the connections between changing economic inequality and changes in political behavior.”
Since then, a burgeoning literature has examined the link between income inequality and turnout. The nature of this link is important for a number of reasons. Widening income inequality can concentrate political and decision-making power in the hands of a few. But policies that focus on the poor and the middle class can potentially mitigate inequality. By demanding greater redistribution mass participation in elections can therefore potentially redress this imbalance, but only if those who have most to gain from redistribution vote (Meltzer and Richard, 1981). Indeed, as Mahler (2002) shows, electoral turnout is positively related to government redistribution in developed democracies.
Yet, key questions remain unsettled. Past research on the relationship between income inequality and turnout has produced mixed results: some studies suggest that income inequality leads to lower turnout (Anderson and Beramendi, 2008; Jensen and Jespersen, 2017; Lancee and Van de Werfhorst, 2012; Solt, 2008, 2010; Schäfer and Streeck, 2013; Steinbrecher and Seeber, 2011), while other studies find little or no effect (Fumagalli and Narciso, 2012; Horn, 2011; Stockemer and Parent, 2014; Stockemer and Scruggs, 2012). One reason for these mixed results may have to do with the contingent nature of inequality on turnout, which plausibly depends upon the nature of the policy options that parties present to the electorate. Here, we investigate this possibility and test the effect of income inequality on turnout, and whether it is conditioned by the policy programs of parties. When faced with rising income inequality, if political parties do not articulate policy differences on matters of equality and redistribution, are voters more likely to abstain? Alternatively, if political parties adopt distinctive policy responses, can income inequality actually spur an increase in turnout?
In answering these questions, we build on past research. Broadly speaking, two main approaches dominate the literature: “relative power theory” and “conflict theory.” Relative power theory posits that income inequality has a negative effect on turnout because it leads to a greater concentration of wealth—and with it political power—in the hands of high-income individuals (Steinbrecher and Seeber, 2011: 5). According to this theoretical perspective, political decision-makers are more responsive to the interests of the rich, particularly in unequal societies—and the poor only get what they want if their interests are aligned with those of higher income groups (Bartels, 2008; Flavin, 2012). Thus, according to Solt (2008: 58) “greater economic inequality increasingly stacks the deck of democracy in favor of the richest citizens, and as a result, most everyone else is more likely to conclude that politics is simply not a game worth playing.”
By contrast, conflict theory predicts the opposite effect on political participation. It posits that higher income inequality will lead to more conflictual politics, since increases in income inequality stimulate more engagement in the political process among all income groups. Building on Meltzer and Richard’s (1981) median voter model, the assumption of conflict theory is that individuals’ political interests stem from their position on the income distribution (Stockemer and Parent, 2014). More specifically, low-income individuals will push for more redistribution, which would become costlier for the rich, who then become more politically engaged in an effort to counter the adoption of redistributive policies (see Solt, 2008 for a detailed discussion).
Both relative power theory and conflict theory thus make implicit reference to the structure of political competition in policy terms, but as of yet, no empirical study has explicitly addressed this important conditioning factor. According to conflict theory, income inequality tends to increase turnout because voters are stimulated to articulate their competing preferences. But at the same time, voters are constrained by the electoral choices they are offered. When there are clear ideological differences between competitive parties, there is greater incentive to vote than when there are only minor differences, in which case it does not matter so much which party wins. Polarization may therefore increase turnout (Abramowitz and Saunders, 2008; Béjar et al., 2018; Heath, 2007). In particular, it has been argued that turnout will be higher when citizens have a “greater range of political expression available” (Crepaz, 1990: 183). As Leighley and Nagler (2014) put it, from a self-interest perspective it would be more foolish to sit out an election where the choices differ than to sit out one in which the choices are not choices, but echoes. The empirical evidence in favor of such a direct effect, however, is weak at best (Aarts and Wessels, 2005; Dalton, 2008).
Building on this work, and in line with conflict theory, we would therefore only expect income inequality to increase turnout when parties adopt distinctive policy positions on matters of inequality and redistribution, putting more at stake in terms of which party wins.
Relative power theory also makes assumptions that relate to the nature of political competition. According to relative power theory, income inequality would lead to a decrease in turnout because parties fail to represent the interests of the poor and advance policies that are in the interests of the (already) well-off. As a result, in times of increased income inequality, the political center of gravity will shift to the right and parties will on average be less likely to advocate redistributive policies. In summary, in line with relative power theory, we would only expect income inequality to decrease turnout when the parties are, on average, less likely to put forward pro-redistribution policies, also turning away from the interests of the poor.
Clearly, the logic of both conflict theory and relative power theory in some way depends on the nature of the policy offerings that the voters face. Whereas, conflict theory emphasizes the relative spread of policy options within the party system, relative power theory emphasizes the central tendency. We provide the first direct test of whether these two different components of the policy space moderate the relationship between income inequality and turnout. Theoretically, our main contribution lies in identifying a novel, yet intuitive, explanation for the relationship between income inequality and aggregate-level turnout, one rooted in the policy offerings of political parties. This article proceeds as follows. After reviewing past research on the link between income inequality and turnout, we elaborate our hypotheses, explain the key measures, and then test our expectations against a dataset of 300 elections (from 1965 to 2017) on 30 established democracies.
Income Inequality and Turnout
Past research has examined the relationship between income inequality and turnout at the national (Fumagalli and Narciso, 2012; Lister, 2007; Stockemer and Parent, 2014; Stockemer and Scruggs, 2012), sub-national (Galbraith and Hale, 2008; Mahler, 2002), and individual level (Anderson and Beramendi, 2008; Filetti, 2016; Filetti and Janmaat, 2018; Horn, 2011; Jaime-Castillo, 2009; Jensen and Jespersen, 2017; Lancee and Van de Werfhorst, 2012; Persson, 2010; Schäfer and Streeck, 2013; Solt, 2008, 2010; Steinbrecher and Seeber, 2011), for a variety of different countries, over various time periods. 1 These studies have found income inequality and turnout to have either a negative relationship or a null relationship, with very little evidence of any positive relationship between the two. Of the 18 studies mentioned earlier, 12 find a negative and statistically significant relationship between income inequality and turnout, and 2 find a null relationship. However, there are important differences in these findings according to the type of study in question. Whereas, individual-level studies based on multilevel modeling tend to find a negative relationship between inequality and turnout, aggregate studies have mostly found null effects.
Of the 11 cross-national individual-level studies published in the last decade, 8 studies find a significant negative relationship, 2 find a negative but insignificant relationship, and 1 finds an insignificant relationship whose direction depends upon the measure of inequality. Yet, even among those individual-level studies that find a significant negative relationship, there is disagreement about which groups of voters are most affected by inequality, and whether inequality depresses the turnout of the poor, the well-off, or everyone equally.
Solt’s (2008) seminal study found that political participation is lower in countries with above average income inequality, particularly among those on low incomes. He posits that in unequal societies, low-income individuals become disengaged from politics and subsequently vote less than the rich, leading to a pronounced income bias in turnout. This, he argues, leads to a self-reinforcing cycle, whereby, income inequality produces electorates that are wealthier and smaller due to the abstention of the poor, and which favor policy that ensures income inequality either maintains or increases, thus perpetuating the cycle (Solt, 2010: 258). A number of other comparative studies have also shown that inequality reduces the political participation of low-income voters in particular (Anderson and Beramendi, 2008; Lancee and Van de Werfhorst, 2012; Jensen and Jespersen, 2017; Solt, 2010). By contrast, using World Values Study (WVS) data on 18 OECD countries between 1999 and 2001, Anderson and Beramendi (2008: 303) find that inequality depresses turnout among everyone, both poor and well-off. Although based on a relatively small sample over a short time span, a more expanded analysis by Schäfer and Streeck (2013) of 23 OECD countries from 1970 and 2008, combining data from the International Social Survey Program (ISSP), Eurobarometer, Comparative Study of Electoral Systems (CSES), and the European Social Survey (ESS), finds that inequality “reduces citizen’s propensity to vote as well as their confidence in parliament and government” (ibid: 188). Finally, and somewhat counter-intuitively, a number of unpublished papers find evidence that inequality may depress the turnout of the well-off (Jaime-Castillo, 2009; Persson, 2010; Steinbrecher and Seeber, 2011). However, they also find that the income gap is smaller in countries with high inequality, as the well-off are relatively less likely to vote. The surprising finding that the turnout of the well-off is lower in unequal societies is also found in two similar studies of OECD countries using CSES data, by Jaime-Castillo (2009) and Persson (2010).
Thus, although the weight of evidence points toward a negative relationship between inequality and turnout, through the increased abstention of low-income citizens, there are some exceptions to this pattern. Even more importantly, the general trend of a negative relationship between inequality and turnout (regardless of who it affects the most) has not been replicated in analyses of aggregate data, that record actual turnout instead of respondents’ self-reported turnout. This represents something of a puzzle, since if the individual-level effects are sizable, they should also be observable at the aggregate level.
Of the five cross-national aggregate level studies published, three studies yield statistically insignificant results. First, Stockemer and Scruggs (2012) analyze 567 democratic elections in Western and non-Western countries and find that inequality does not have a substantively important or statistically significant impact on turnout in either region. Second, Fumagalli and Narciso (2012) analyze 63 countries in the 1990s and find that income inequality yields a negative, but statistically insignificant, coefficient when related to turnout. Finally, Stockemer and Parent (2014) again find no effect of inequality on turnout in a study of 161 presidential elections across 79 countries in the 1990s and 2000s.
With respect to the other two aggregate studies, they initially find a negative relationship between inequality and turnout, but this effect appears not to be robust. Mahler (2002: 130–131) notes that the results from his 12-country study should be treated with caution, since the results are driven mainly by the inclusion of the United States. In fact, when the United States is dropped from the analysis the results are no longer statistically significant. Finally, although Lister (2007) finds a negative relationship in his study of 15 democracies between 1963 and 1993, Arzheimer (2008) fails to replicate the findings with the same dataset.
Collectively, these studies show that inequality may lead to a decrease in turnout among those on low incomes, those on high incomes, everyone or no one at all. These mixed findings suggest, as Stockemer (2017: 709) notes that the effect of income inequality on turnout is more complex than has often been articulated. The reasons for these inconsistent findings are potentially manifold, to do with measurement, selection, sample size, and time period. If the impact of inequality on turnout is context specific, then the results may be highly sensitive to the context under investigation. Rather than simply trying to retest the same hypothesis, we posit that research on the link between inequality and turnout should therefore turn to taking into account the context more directly and studying the ways in which context moderates the inequality-turnout link. We develop this line of research by incorporating a key contextual variable into the equation (to do with the structure of the policy space) and by specifying more clearly the scope conditions under which we expect our hypotheses to operate.
Hypotheses
In this article, we test two main hypotheses. Our first hypothesis relates to the causal mechanisms underpinning relative power theory. According to relative power theory, political decision-makers are much more responsive to the issue concerns of the rich (Bartels, 2008; Gilens, 2012 although see Soroka and Wlezien, 2008). High-income earners and the groups that represent their interests are far more likely to donate to political campaigns than low-income earners, which gives the wealthy greater policy influence (Flavin and Franko, 2017: 659). Moreover, politicians are increasingly wealthy themselves and more often come from the business world (Franko and Witko, 2018: 139). This has led to a “revolving door” whereby, large companies also hire former government officials and politicians to gain access and influence over government policy. Inequality can heighten these representational biases. Barth et al. (2015) show that across the OECD rising inequality moves party politics on welfare state issues to the right, and even left wing parties shift their welfare policy platform toward less generosity.
Given that rising inequality can lead lower income voters to demand more redistributive social policies (Meltzer and Richard, 1981; Roberts, 1977; Romer, 1975), under such circumstances ordinary (lower income) voters who prefer redistribution may become alienated or indifferent to the political choices on offer (Zipp, 1985) and abstain from voting. To investigate this possibility, we test whether the impact of inequality on turnout depends on the mean policy position of parties in the party system. When political parties respond to rising inequality by shifting their policy platforms to the right, ordinary voters may become alienated or indifferent to the policy options on offer and respond by abstaining. By contrast, when political parties respond to rising inequality by shifting their policy platforms to the left and adopting more pro-welfare policies, ordinary voters may respond by voting in higher numbers, and so turnout may actually increase. Our first hypothesis then is that the effect of inequality on turnout depends on the mean policy position of parties. To investigate this possibility, we specify an interaction term between inequality and the mean policy position.
H1 (Inequality × Mean policy position): The negative effect of inequality on turnout is strengthened when parties take more right wing positions.
Our second hypothesis relates to conflict theory. According to this theory, income inequality leads to more conflictual politics. Hence, inequality will increase turnout if parties adopt distinctive (polarized) policy positions. However, regardless of how divided the electorate is on matters of redistribution, if competitive parties do not offer any meaningful policy difference, then it will not matter which party wins. Leighley and Nagler (2014: 141–143) show that poorer people in the United States tend to see less difference between the policy platforms of candidates than wealthier people, and are least likely to see candidates as offering meaningful choices on issues. They argue that the poor cannot respond to policy differences that they do not see, and that turnout among the poor will not increase unless one or both of the major parties offers them a distinctive and compelling choice. Thus, if the policy space becomes more polarized during periods of high inequality, turnout may increase. However, if the policy space becomes less polarized, voters may respond by abstaining. Our second hypothesis then is that the effect of inequality on turnout depends on the level of policy polarization. To investigate this possibility, we specify an interaction term between inequality and policy polarization.
H2 (Inequality × Policy polarization): The negative effect of inequality on turnout is weakened when policy polarization increases.
We now turn to the data and measurement for these variables (as well as controls), before proceeding to estimation.
Data and Measures
In order to test these hypotheses, we make use of a uniquely constructed dataset that includes information on turnout in a set of 30 established democracies. We limit the analyses to those countries which Freedom House recognizes as most “Free” (scoring no higher than 1 or 2 on the 7-point political rights scale in any given election year). 2 We focus on these countries because we expect our hypotheses to apply specifically to established democracies where political rights are widely enjoyed, and elections are free and fair. Under these conditions, the chains of electoral accountability are stronger and voters will have greater incentive to respond to the policy offerings of the parties (Birch, 2011; Norris, 2014). By contrast, in less established democracies, where political corruption is more evident, and the electoral process is occasionally flawed, chains of accountability may be disrupted and voters will have less incentive to prize the long term—yet uncertain—benefits that are promised by programmatic policies (Heath and Tillin, 2018).
As a robustness check, we also test our hypotheses on a subset of these cases, focusing on those countries which have continuously enjoyed full political rights (scoring the maximum of 1 in each given election year) and a selection of the wealthiest countries (enjoying a maximum GDP per capita of over US$25,000 per annum). We examine wealthy democracies since voters may care more about the distribution of economic growth (e.g. income inequality) once a given level of growth has been achieved.
The dependent variable is turnout, operationalized as the percentage of votes cast by the registered electorate, a measure commonly used in cross-country studies of turnout. Information on turnout comes from the Institute for Democracy and Electoral Assistance (IDEA) database. The first key independent variable is economic inequality. We examine a Gini indicator of inequality, obtained from Solt’s (2016) Standardized World Income Inequality Database (SWIID). 3 The gini coefficient is the most widely used indicator of income inequality. Solt (2019: 2) describes it as “the average difference in income between all pairs in a population, divided by twice the average income in the population.” Theoretically, the Gini indicator can range from 0—when everybody has the same income—to a maximum of 1—when one person has all the income. We include a yearly measure of Gini that we lag 1 year. By lagging this indicator, we take into account the observation that voters are backward looking when evaluating the performance of the government (Healy and Malhotra, 2013). The fairly short (1-year) lag structure corresponds to how popularity-functions generally model the impact of the economy (Lewis-Beck and Stegmaier, 2013).
The second key independent variables are to do with the policy offerings of the political parties. We distinguish between two aspects of the policy space. The first utilizes a measure of central tendency, which we use to test the relative power theory hypothesis, and the second utilizes a measure of dispersion, which we use to test the conflict theory hypothesis. Following previous research, policy positions are estimated using party manifesto data (Ezrow, 2007; Ezrow and Xenokasis, 2011). These data provide a useful indication of party positions, since they represent the choices that the electorate faces before each election. The data are drawn from the Manifesto Project (MP), 4 one of the most widely used sources for estimating party policy positions, and covers a wide number of countries over a long period of time (Gemenis, 2013). As the content of party programs often comes out of intense intraparty debate, the MP estimates should be reliable and accurate statements about parties’ positions at the time of elections. These measures are generally consistent with those from other party positioning studies, such as those based on expert placements, citizen perceptions of parties’ positions, and parliamentary voting analyses, which provides additional confidence in the validity and reliability of these estimates (Laver et al., 2003). The MP measures are based on content analyses of the programs of the main political parties at every post-war election. The policy statements in each (“quasi-”) sentence are classified into 56 policy categories over 7 policy domains. We focus on those items that relate most closely to matters of redistribution. 5
Following Lowe et al. (2011), the left-right scores of the various parties on matters of redistribution are computed by summing up the logged percentages of all the sentences in the left category and subtracting their total from the sum of the logged percentages of the sentences in the right category. 6 This method better take into account the proportional changes on the left-right scale than the traditional Laver/Budge methodology (Lowe et al. 2011). To measure the political center of gravity, we simply calculate the weighted mean of the party positions (Mean policy position) in each election. To measure political polarization, we follow Alvarez and Nagler (2004), and Ezrow (2007) and calculate the weighted policy dispersion of the party system, which is defined as the standard deviation of all the parties’ policy positions that are reported by the MP in each election. This measure captures the spread of policies available to the electorate, taking into account how competitive each of the parties are. Thus, if a relatively minor party adopts a strong left-wing position this does not affect the index as much as, if a major party does. This captures the political reality that voters face at election time, since if competitive parties do not offer any meaningful policy difference then it matter less which party wins. 7 The equation for weighted party system polarization measure is,
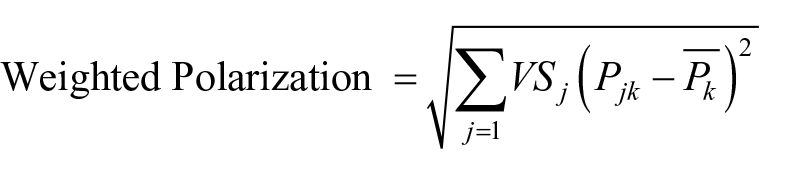
where
In addition to our core independent variables, we also include a variety of controls that past research has shown are related to turnout at the aggregate level. Lagged Turnout is a country’s turnout in election t-1. Unusually, high or low turnout in the previous election should influence the extent to which turnout is likely to increase or decrease in the subsequent election. Under these conditions, when the process is dynamic, including a lagged dependent variable provides estimates that are superior to other models or estimators (see Keele and Kelly, 2006). The effective number of parties (ENP) in an election is, across most studies, negatively associated with turnout (Cancela and Geys, 2016), 8 even though theory might predict a positive association (Blais, 2006). Margin is the log of the difference in vote share between the first and second placed parties in the election, which is generally expected to have a negative association with turnout, as there is less incentive to vote in uncompetitive elections (Cancela and Geys, 2016). Time is a linear time trend that begins at 0 in 1965 and increases by one unit for each year so as to capture any secular increase (or decrease) in turnout (Hooghe and Kern, 2017). Turnout has also been shown to be positively affected by the level of a country’s economic development (Blais, 2006). Therefore, we also include a yearly measure of GDP per capita that we lag 1 year. Information on GDP per capita, measured at current US dollars, is obtained from the World Bank National Accounts Data (2018).
Our data are best characterized as time-series cross-sectional (TSCS), since the set of observations includes an average of 10 election years per country, across 30 established democracies. Estimating a simple regression on the TSCS data can lead to erroneous conclusions if there are unobserved differences among countries (Green et al., 2001; Hsiao, 2003). Thus, we estimate country-level fixed effects to ensure that unobserved differences between countries do not affect our findings. We also estimate country-level fixed effects because our core hypotheses focus primarily on intra-country over-time variation in the dependent variable, rather than cross-sectional variation. Furthermore, by deriving our estimates from variation within the same countries, we effectively control for a wide range of unobservables that vary across countries. Such observables include a country’s electoral system, breakdown of partisan support, and underlying propensity to turn out.
Results
We start by simply examining the trends in turnout and inequality overtime. Figure 1 plots the average level of turnout and inequality since the 1960s in our sample of 30 countries. Whereas there has been a steady decline in turnout; income inequality, particularly since the 1980s, has increased. For example, in the United States wages for the top 1% increased by 138% since 1979, while wages for the bottom 90% grew by just 15% (Mishel et al., 2015). On the face of it, this would imply a negative correlation between the two variables, which is consistent with the expectations derived from relative power theory (insofar, as it predicts a negative relationship between the two). Yet, these aggregate trends may mask a lot of variation at the country level, and—taken in isolation—shed little light on why inequality may depress turnout or whether the mechanisms that link the two are consistent with the expectations of relative power theory or conflict theory.
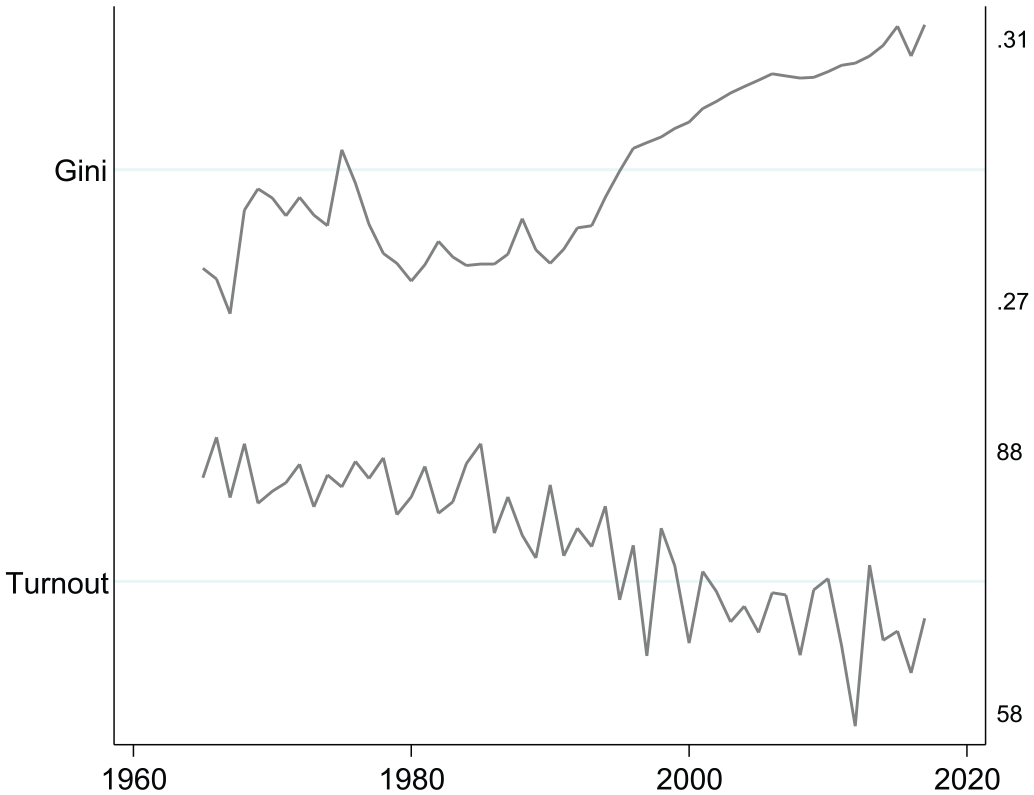
Average Levels of Turnout and Inequality (Gini) Overtime.
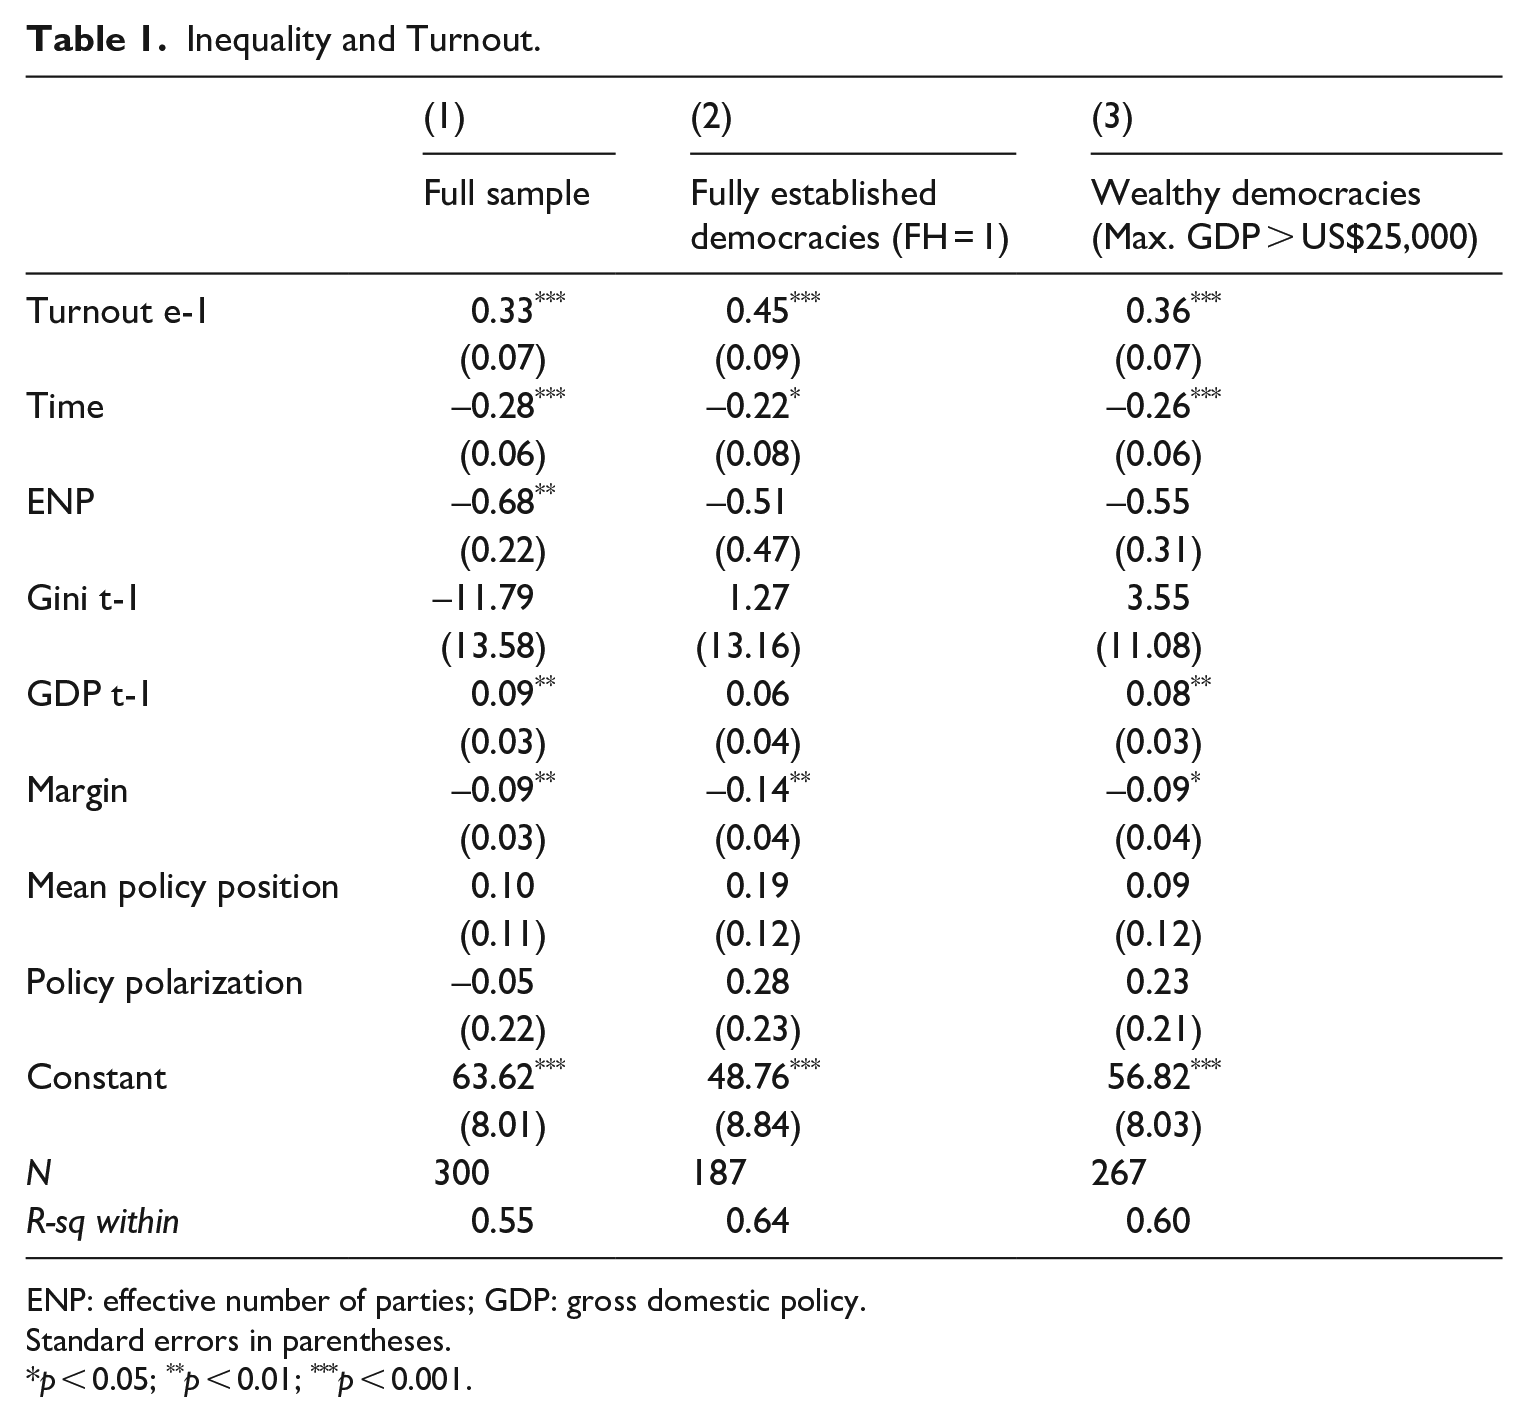
Next, we estimate baseline models, explaining turnout by means of a lagged dependent variable and our economic indicators of interest; GDP per capita and Gini, as well as our other controls. Turnout levels might differ between countries for many reasons, some of which can be accounted for by means of country-level variables, and others not (e.g. a country’s political culture). Our longitudinal dataset, however, is sufficiently large to allow including country fixed effects. Doing so implies that we are analyzing within-country variation. That is, we focus on the link between changes in income equality on changes in turnout. These initial results appear in Table 1. All models are estimated using ordinary least squares (OLS) and country-level fixed effects with robust standard errors. Because of the fixed effects specification, we do not include any variables that do not vary overtime within a country. First, we consider the full sample, including all the countries in our dataset. Second, we consider the democracies that have continuously enjoyed full political rights (scoring the maximum of 1 on Freedom House in each given election year), and third, we consider the wealthiest democracies (with a maximum GDP per capita of over US$25,000 per annum).
Inequality and Turnout.
ENP: effective number of parties; GDP: gross domestic policy.
Standard errors in parentheses.
p < 0.05; **p < 0.01; ***p < 0.001.
Reassuringly, the results from this baseline model are largely as expected. Turnout increases when prior turnout was higher (Turnout e-1) and turnout decreases overtime (Time) and when elections are uncompetitive (Margin). Turnout tends to increase when GDP is higher (GDP t-1). The coefficient for the ENP is negative, but only significant in the full sample. The two policy measures are not significant. Finally, there is some evidence that there is a negative relationship between inequality (Gini t-1) and turnout in the full sample, although this is not statistically significant. However, the coefficient is not negative in either of the sub-samples. All in all, these results are broadly consistent with past research, which has also tended to find mixed/null results.
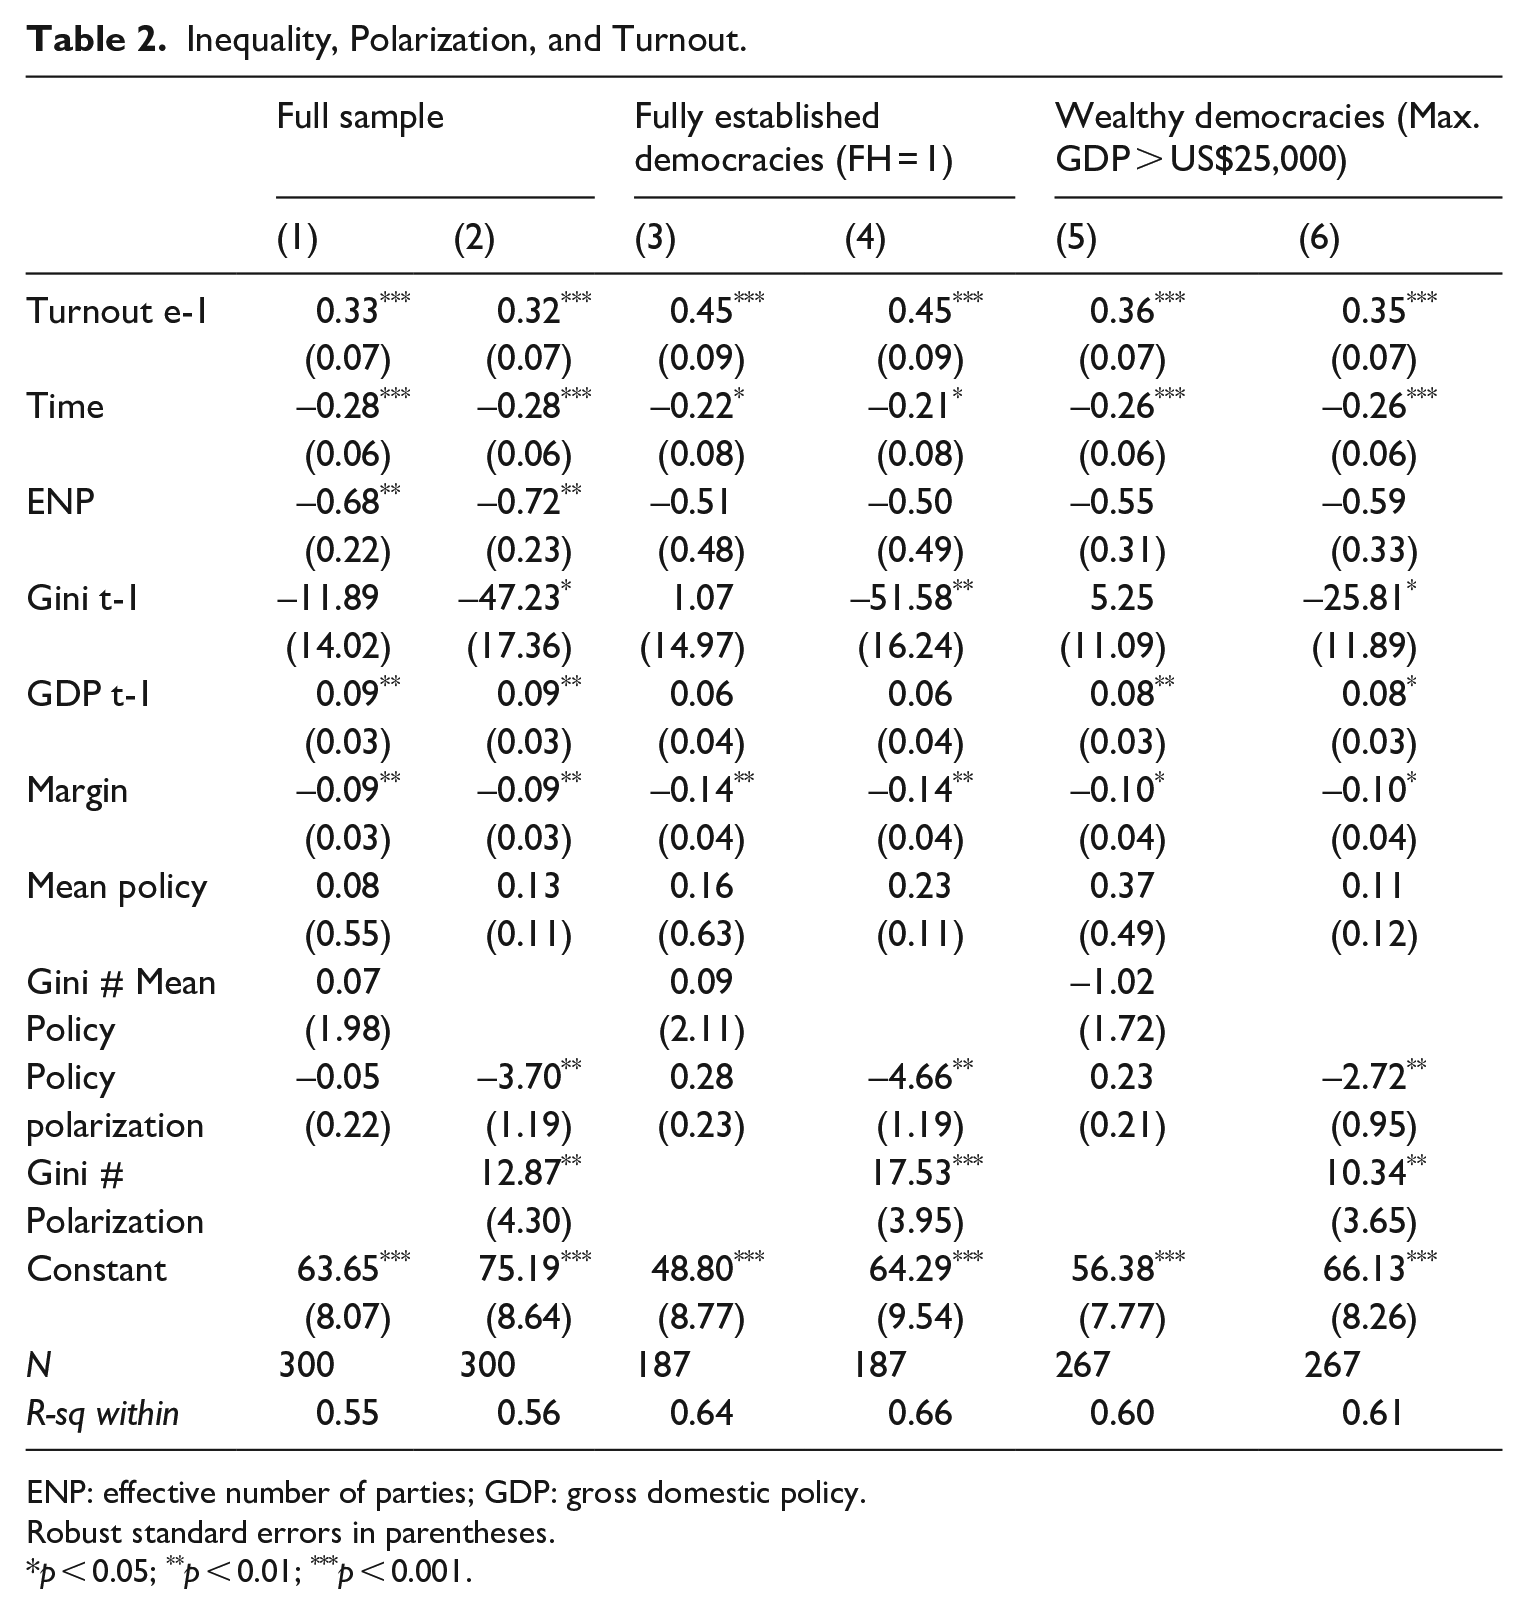
We next estimate models to test our key hypotheses of interest, including the interaction terms between inequality and our measures of the policy space. To test the relative power hypothesis, we specify an interaction between inequality and the parties’ mean policy position. According to the hypothesis, when parties represent the interests of the wealthy and are situated to the right of the ideological spectrum, ordinary voters will respond to increased inequality by abstaining. We do not find any evidence to support this hypothesis: the interaction term is not significantly different from zero, either in the full sample or the sub-samples (see models 1, 3, and 5 in Table 2).
Inequality, Polarization, and Turnout.
ENP: effective number of parties; GDP: gross domestic policy.
Robust standard errors in parentheses.
p < 0.05; **p < 0.01; ***p < 0.001.
However, we do find strong evidence in support of the conflict hypothesis. To test this hypothesis, we specify an interaction between inequality and party system polarization. The results appear in Table 2. The first thing to notice is that when we specify the interaction, the main effect of inequality is significant and negative across all models (see models 2, 4, and 6). Moreover, and more interesting from a theoretical perspective, the interaction term is positive and significant across all models (see model 2, 4, and 6), meaning more polarization mitigates the negative effect of inequality on turnout. This implies that if, in times of inequality, parties converge and all offer much the same policy response turnout declines. But by contrast, if they present conflicting economic programs, turnout tends to be higher.
This finding is robust across each of the different samples, and is particularly strong in the sub sample which focuses just on those democracies that have continuously enjoyed full political rights (model 4).
We present the substantive impact of these interactions in graphical terms in Figure 2, which plots the average marginal effects of inequality at varying levels of polarization, along with 95% confidence intervals for the full sample from model 2. To ease interpretation, we standardize the gini coefficient so it has a mean of 0 and a standard deviation of 1. The figure indicates that when party systems are depolarized, inequality has a negative impact on turnout. However, as party systems exhibit greater levels of policy polarization, the negative effect of inequality on turnout is mitigated, and at high levels of polarization, the impact of inequality on turnout is positive.
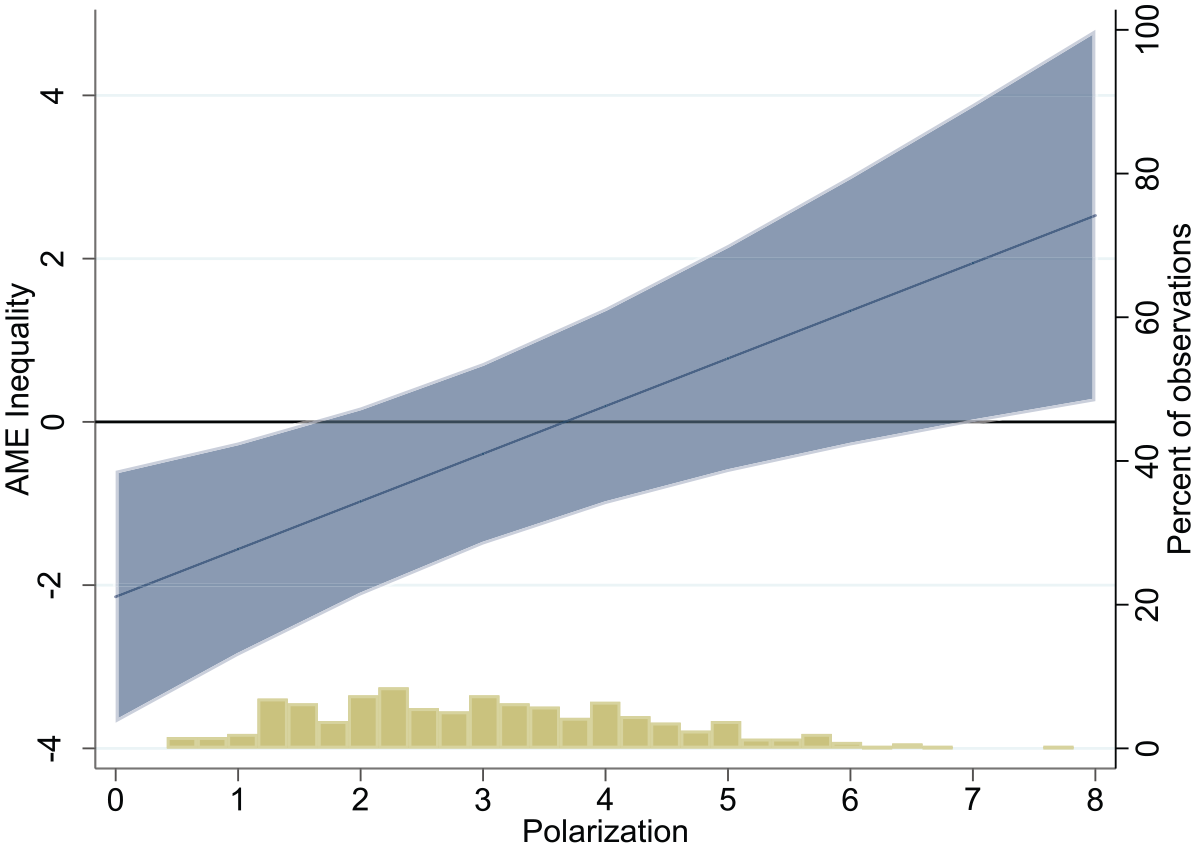
Marginal Effects of Inequality on Turnout by Polarization.
What is the substantive impact of the results? At low levels of polarization, one standard deviation below the mean (1.5), a one standard deviation increase in inequality is associated with a 1.25 percentage point decrease in turnout. And at high levels of polarization, one standard deviation above the mean (4.5), a one standard deviation increase in inequality is associated with a 0.5 percentage point increase in turnout. As polarization increases the negative impact of inequality is attenuated. These represent substantial changes. To put these effect sizes in context, a one standard deviation increase in the election’s margin of victory (eight percentage points) is associated with a 0.75 percentage point decrease in turnout. Moreover, nearly 20% of the elections in our dataset were decided by margins of less than 2 percentage points, meaning that even small increases or decreases in turnout can swing some races if turnout changes disproportionately benefit one party. These results point to a consistent interaction between inequality and polarization on turnout that is substantively meaningful in the context of within-country variation.
Robustness Tests
The findings are also robust to additional controls and alternative model specifications. As a robustness check, we introduce an additional control for union density, which might influence both turnout and inequality (see Table A3 in Appendix 1). Data on union density are taken from the ICTWSS Database Version 5.1. 9 Since recent data are not available for a number of countries, the sample size for the full sample is somewhat reduced. Nonetheless, the main results still hold and are almost identical.
To guard against the possibility that including a lagged dependent variable, Turnout e-1, on the right-hand side of the model suppresses the effect from other independent variables, we also apply a Prais-Winsten transformation. This corrects for first-order autocorrelation, while at the same time allowing use of the full sample (Gujarati and Porter, 2009: 443; Plümper et al., 2005). The results are presented in Table A4 in Appendix 1. Again, the main results hold.
We also examine alternative measures of policy polarization based on the range of policy options, based on the difference between the policy positions of the two most extreme parties in the party system (at 5% and 10% electoral thresholds, respectively) and the difference between the policy positions of the two most competitive parties in the party system. The results are presented in Table A5 in Appendix 1. The main results hold.
In addition, we also test for any non-linearities in the interaction term. As recent work by Hainmueller et al. (2019) show, multiplicative interaction models assume that the interaction effect is linear. However, this assumption of linearity often fails in empirical settings because many interaction effects are not linear and some are not even monotonic. 10 To investigate these issues, we run several diagnostic tests suggested by Hainmueller et al. (2019). First, we employ the binning estimator, which groups the conditioning (politicization) variable into terciles and estimates a separate coefficient for each bin. The results of this analysis indicate that we can accept the linearity assumption at p = 0.523 using the recommended Wald test. Second, we employ a kernel smoothing estimator. This approach provides a flexible estimate of the functional form of the marginal effect across the full range of the moderator, rather than at just a few evaluation points. The result from the kernel estimation shows that the Linear Interaction Effect (LIE) assumption is supported by the data. The magnitude of the inequality effect increases at an approximately constant rate with higher polarization (see Figure A6 in Appendix 1).
Finally, to make sure that our results are not driven by the inclusion of any one country in particular, we carry out a jackknife analysis. The results of these additional analyses, reported in Figure A7 in Appendix 1, indicate that the estimated interaction between Gini and polarization is extremely stable, and hence, not driven by a single outlier country in the dataset.
Conclusion
Past research has identified mixed results on the relationship between inequality and turnout. Whereas some studies find a negative association, others find a null effect. We suggest that one reason that may account for these mixed findings is to do with the contingent nature of the impact of inequality on turnout, which depends upon the political context. When party systems in established democracies are not polarized, inequality has a negative impact on turnout. But, as party systems polarize, this negative impact lessens, until it is effaced.
Moreover, past research has tended to assume that the negative relationship between inequality and turnout supports relative power theory, even though the mechanisms underpinning this hypothesis have not been directly tested. By examining the policy space of party systems, we are able to provide a more direct test of both relative power theory and conflict theory. Our results are supportive of the latter but not the former. When parties do not take distinctive policy positions on matters of redistribution, latent conflict within the electorate over rising inequality has no means to express itself, and so, voters respond by abstaining. However, when party systems are more polarized, conflict can be expressed at the ballot box and so turnout is higher.
These findings have a number of important implications. Our research clearly shows how political parties respond to increases in inequality shapes how people participate in the political process. But how parties react, both within and across party systems, can vary (Tavits and Potter, 2015). According to the Meltzer-Richard model, democracies should be expected to respond to greater economic inequality by increasing redistribution (Meltzer and Richard, 1981), yet, this does not always happen. Rather than prompting distributional struggles which increase polarization, inequality has, in a number of cases, led to a convergence between parties, particularly, since inequality mainly shifts parties on the left to the right (Barth et al., 2015). Thus, the protection offered by the welfare state has been weakened by the same economic forces that it was meant to protect against (ibid: 576). As we show, when this occurs, the pool of disenfranchised voters increases. Yet when parties do take distinctive stances, turnout is higher. As an illustrative example, in the most recent UK general election, the center-left party (Labor) moved substantially to the left on matters of redistribution, and the resulting policy difference with the Conservatives was the greatest since 1992 (Allen and Bara, 2019). In a country with one of the highest levels of inequality in the west, turnout reached a 20-year high.
In some respect, our findings are refreshing for normative visions of democracy. Combatting inequality poses a number of distributional challenges, which can create both winners and losers. The central implication of our research is that policy choice matters. Elections are frequently seen as an institutional means for resolving conflict, but if they do not serve this purpose then the long-term health of democracy may be diminished, and bonds of electoral accountability may be weakened. At a time when political elites are frequently seen as “out of touch” with the policy concerns of voters, a failure to articulate the distributional struggles that are associated with rising inequality may affect public support for various other aspects of the political system. For example, support for political institutions is lower when policymaking is out of step with the public’s policy mood, either because it is “too liberal” or “too conservative” given people’s policy preferences (Jones and McDermott, 2010; Ramirez, 2013), and satisfaction with democracy is higher when there is ideological congruence between voters policy preferences and parties’ policy positions (Klüver and Spoon, 2016). One fruitful line of enquiry for future research is to examine whether inequality exacerbates these effects, and whether there is a link between democratic dissatisfaction and the policy responses to inequality.
Footnotes
Appendix 1
Figure A5 presents the conditional marginal effect estimates from the kernel estimator. The optimal bandwidth is selected by cross-validation. The result from the kernel estimation shows that the Linear Interaction Effect (LIE) assumption is supported by the data. The magnitude of the inequality effect increases at an approximately constant rate with higher polarization.
Acknowledgements
The authors would like to thank participants for their helpful comments and feedback. In particular, they would like to thank Christopher Anderson, Constantin Bosancianu, Howard Clarke, Frederick Solt, and Piotr Zagorski.
Authors’ Note
Previous versions of this article were presented at the EPOP Annual Conference held at Royal Holloway, University of London, and the Politics and Inequality Conference held at Warsaw.
Declaration of Conflicting Interests
The author(s) declared no potential conflicts of interest with respect to the research, authorship, and/or publication of this article.
Funding
The author(s) received no financial support for the research, authorship, and/or publication of this article.