
Abstract
This study analyses the impact of the seasonal mobility of populations on the emergency response times (ERT) of the police. The concept of multi-locality increases the mobility of people but, however, the public service structures of the society and different administrative systems do not sufficiently account for that. The results of the mixed-model regression demonstrate the challenges in the police resources allocation when people are acting in different areas than expected. Emergency response times was lengthened as the seasonal population increased and spatially dispersed over the regions during the seasons. We suggest that the seasonal mobility should be involved the future planning process of police resource allocation.
Introduction
In the simplest definition, multi-local living means that a person or family has more than one residence or place to stay for a longer period (Lehtonen et al., 2019). The concept of multi-locality is a current and global phenomenon (Haukkala, 2011). In addition to Finland, multi-local processes related to second home mobility also occur in other Nordic countries and elsewhere (Adamiak et al., 2016). It has been estimated that half of the population of the Nordic countries has access to a second home, and these are increasingly used year-round. Hence, instead of making permanent moves, people increasingly opt for sharing their lives between an urban permanent residence and a rural second home (Adamiak et al., 2015). Officially, in the Nordic countries, statistics on registered populations show the continuity of the population concentration in urban areas (Heikkilä, 2003; Lehtonen and Tykkyläinen, 2009; Adamiak et al., 2016).
In Finland, multi-local living has become common during the last few decades (Lehtonen et al., 2019). However, limited attention has been directed at including it in the planning of public services, such as police services. This is because multi-local people are missing from the official population statistics which are based on housing data from population registers where the individuals are tied to one regular apartment and thus, one place of residence (Dittrich-Wesbuer et al., 2015). Therefore, the planning and public service structures of society and different administrative systems do not sufficiently account for the increasing mobility of people caused by multi-locality. Indeed, large-scale population studies have ignored the fact that the changes in the number, distribution and patterns of use of second homes transform the whole settlement system and lead to the increasing dispersion of population statistics. The public services and resources, such as police resources, are planned and allocated mainly based on the permanent settlement structure and population statistics.
The largest group of people with multiple places in Finland are people with a multi-local identity, that is, people who feel that they have both rural and urban identities (Haukkala, 2011). The biggest multi-local and statistically invisible population group comprises residents of summer cottages, a seasonal population in rural areas. The number of summer residents has multiplied within the past few decades (Adamiak et al., 2016) and it has been estimated that about 2.4 million out of the total of 5.5 million Finns regularly spend their time in rural areas (FCG Finnish Consulting Group Oy, 2016; Adamiak et al., 2016). Multi-local living challenges the basic structure of society as the single-locality society is shifting to a place-independent society. Over one-third of working-age Finns have already lived in a different place than where they work (Haukkala, 2011). However, people nowadays have increasing opportunities to work remotely and, more often, they may not be based in their regular place of residence. The multi-local living supposedly changes the regional demand for police services because people are spending more time in different areas than they have been assumed to be in permanent population statistics. It has been suggested that the number of police assignments should be decreasing outside big urban cities, and vice versa, police assignments should be allocated according to the same distribution as settlement concentrates on the largest urban areas of the country and rural areas continues to reduce. (National Police Board of Finland, 2019). The challenges of the police resource allocation are caused by the fact that people are acting in different areas than expected in the resource allocation which is based on official population statistics which ignore seasonal mobility.
The main aim of this article is to respond to the needs of a changing society and to analyse the impact of the seasonal mobility on the emergency response times (ERT) of the police. The ERT of the police refers to the time from receiving an assignment until the police are ready to act at the emergency site (National Police Board of Finland, 2020); it is an indicator that measures the success of the police at their work (Police of Finland, 2020b). We assume that seasonal mobility and changing the number of the population in the sparsely populated regions increases ERTs in Finland because police resources are currently allocated without information about seasonal populations and their mobility. We approach this assumption by asking to what extent the police resources are allocated for regions according to their permanent population and what the consequences of this allocation are for ERTs throughout the year. If the assumption is correct, it means that ERT, especially in sparsely populated rural regions, increase during the summertime when the seasonal use of summer cottages is highest. The assumption is tested with a mixed-model regression.
Several important aspects justify the approach of this study and the use of Finland as a case study in analysing the impacts of seasonal population mobility on police resource allocation. First, the large scale of second home mobility and the seasonal variations in population figures in the sparsely populated rural areas have led to a strong counter-urbanisation. Second, the strong and spatially concentrated urbanisation process that the country is going through and the related weakening development prospects of small industrial towns and rural areas has increased the concentration of police officers in urban areas. Third, the availability of unique grid-based geographic information system (GIS) databases and multi-local living survey data that enable a detailed quantitative study of seasonal mobility of populations to be performed; and fourth, out of Europe, there were lowest number of police officers per 100,000 inhabitants in Finland (137.8) on average 2017–2019 (334 in the EU) (Eurostat, 2022).
Changing operating environment and the allocation of police resources in Finland
The phenomenon of multi-local living and the growing mobility patterns of people and place-independent work have positively challenged the ‘old ways’ of observing, organising and governing society and its functions, such as the allocation of the police resources. The dynamic demographic information also highlights the need for information management and the use of new dynamic data sources in the planning and allocation processes. We advocate taking seasonal and temporary populations into account when planning and allocating police resources so that police services can be used equally to the ‘permanent’ registered population. Although not being registered as residents, seasonal dwellers also use local resources, infrastructures and services, and thus their demand for services should be considered in service planning.
Unfortunately, the dynamic demographic information of a society is not measured nor followed properly in official statistics due to their high complexity and lack of synthesis data (Adamiak et al., 2016). Therefore, they may not have been fully integrated into resource allocation at the local or regional level. At the same time, official statistics, for instance the registered population, do not reliably describe the number of people in the area, which can lead to a seasonal or temporal bias in right-sizing local or regional police resources. In this study, we assume that the dynamic demographic information, here operationalised with average population estimates, can be helpful in scaling and managing police resources, although it has not been the focus of resource allocation.
In recent years, the main drivers of the police resource allocation in Finland have concentrated on the changes in the surrounding society as the urbanisation and demographic transition have been changing the focus of police resource allocation (see National Police Board of Finland, 2020; Hiltunen, 2020). In recent decades, migration to the country’s largest urban areas has been even faster than expected, and in line with that, the resources of the security authorities have been transferred to areas with a high population density. Population development sets a challenge for the allocation of police resources because the number of police departments and police resources must correspond to the needs of a changing operating environment (National Police Board of Finland, 2020).
Policing is changing in many Western countries; rapid organisational, technological and societal developments, calls for increased efficiency and effectiveness, as well as appeals for more openness and accountability regarding human rights, have led to continuously repeating cycles of reforms (see more in Schaap, 2021). The dynamic population has not been the focus of organisational development. According to Loveday (2008), the professional solution to new challenges has appeared to be based on ever larger units of policing. The major problem in the size of the police agency debate is that there is ‘little evidence of any assessment of costs/benefit analysis’ or ‘statistical evidence presented in support of mergers’ or non-support of mergers (Loveday, 2008). In Finland, local policing has been strengthened in the reforms by increasing the size of the police units (Ministry of the Interior, 2012). Despite the radical demographic change, urbanisation and seasonal counter-urbanisation, dynamic populations and their outcomes have not been evaluated or considered in police reforms in Finland. In addition, the reforms have not focused on the data-driven planning of the police resource allocation because the focus has been set on the structural development of police organisations.
In general, the research evaluating the impacts of seasonal mobility on police resources is limited. The use of second homes has largely been ignored in the operational allocation of police resources since the planning has been based on registered permanent population figures. Similarly, the police stations, as well as driving or response times are largely overlooked by policing and criminological research (see Millie, 2012; Smith and Somerville, 2013). Terpstra (2021) studied the local consequences of the introduction of the Netherlands’ National Police in 2013 and found that the driving time of patrols increased in rural areas. The results of a study by Stassen and Ceccato (2019) showed that, despite regional differences in population density, a large majority of the official population has less than a 20-min drive to the nearest police station. However, residents of remote areas may have to travel more than 2 h to access uncommon services (Stassen and Ceccato, 2019). In Finland, the physical infrastructure of society is more densely packed than ever, but the average estimated distance between respondent’s homes and the nearest police station is getting longer (Vuorensyrjä and Rauta, 2020).
Data and methods
Police resources and emergency response times
The data used in this study on ERT and the number of police forces were collected from the official statistics database of the Police of Finland (Police of Finland, 2020a). The ERTs used here include processing time of the emergency centre, in addition to the time between the police receive and accept an assignment and are ready to act at the alarm site. Thus, ERTs are viewed from the customer’s perspective. The number of police officers across Finland has decreased roughly from 7,600 to 7,300 over the last two decades (Figure 1). The numbers do not include police students/trainees and police officers of the Finnish Security Intelligence Service which have not been part of the police since January 2016. About 19% of all police officers were located in the Helsinki area in 2017. Annual average of number of police officers in Finland 2000–2019.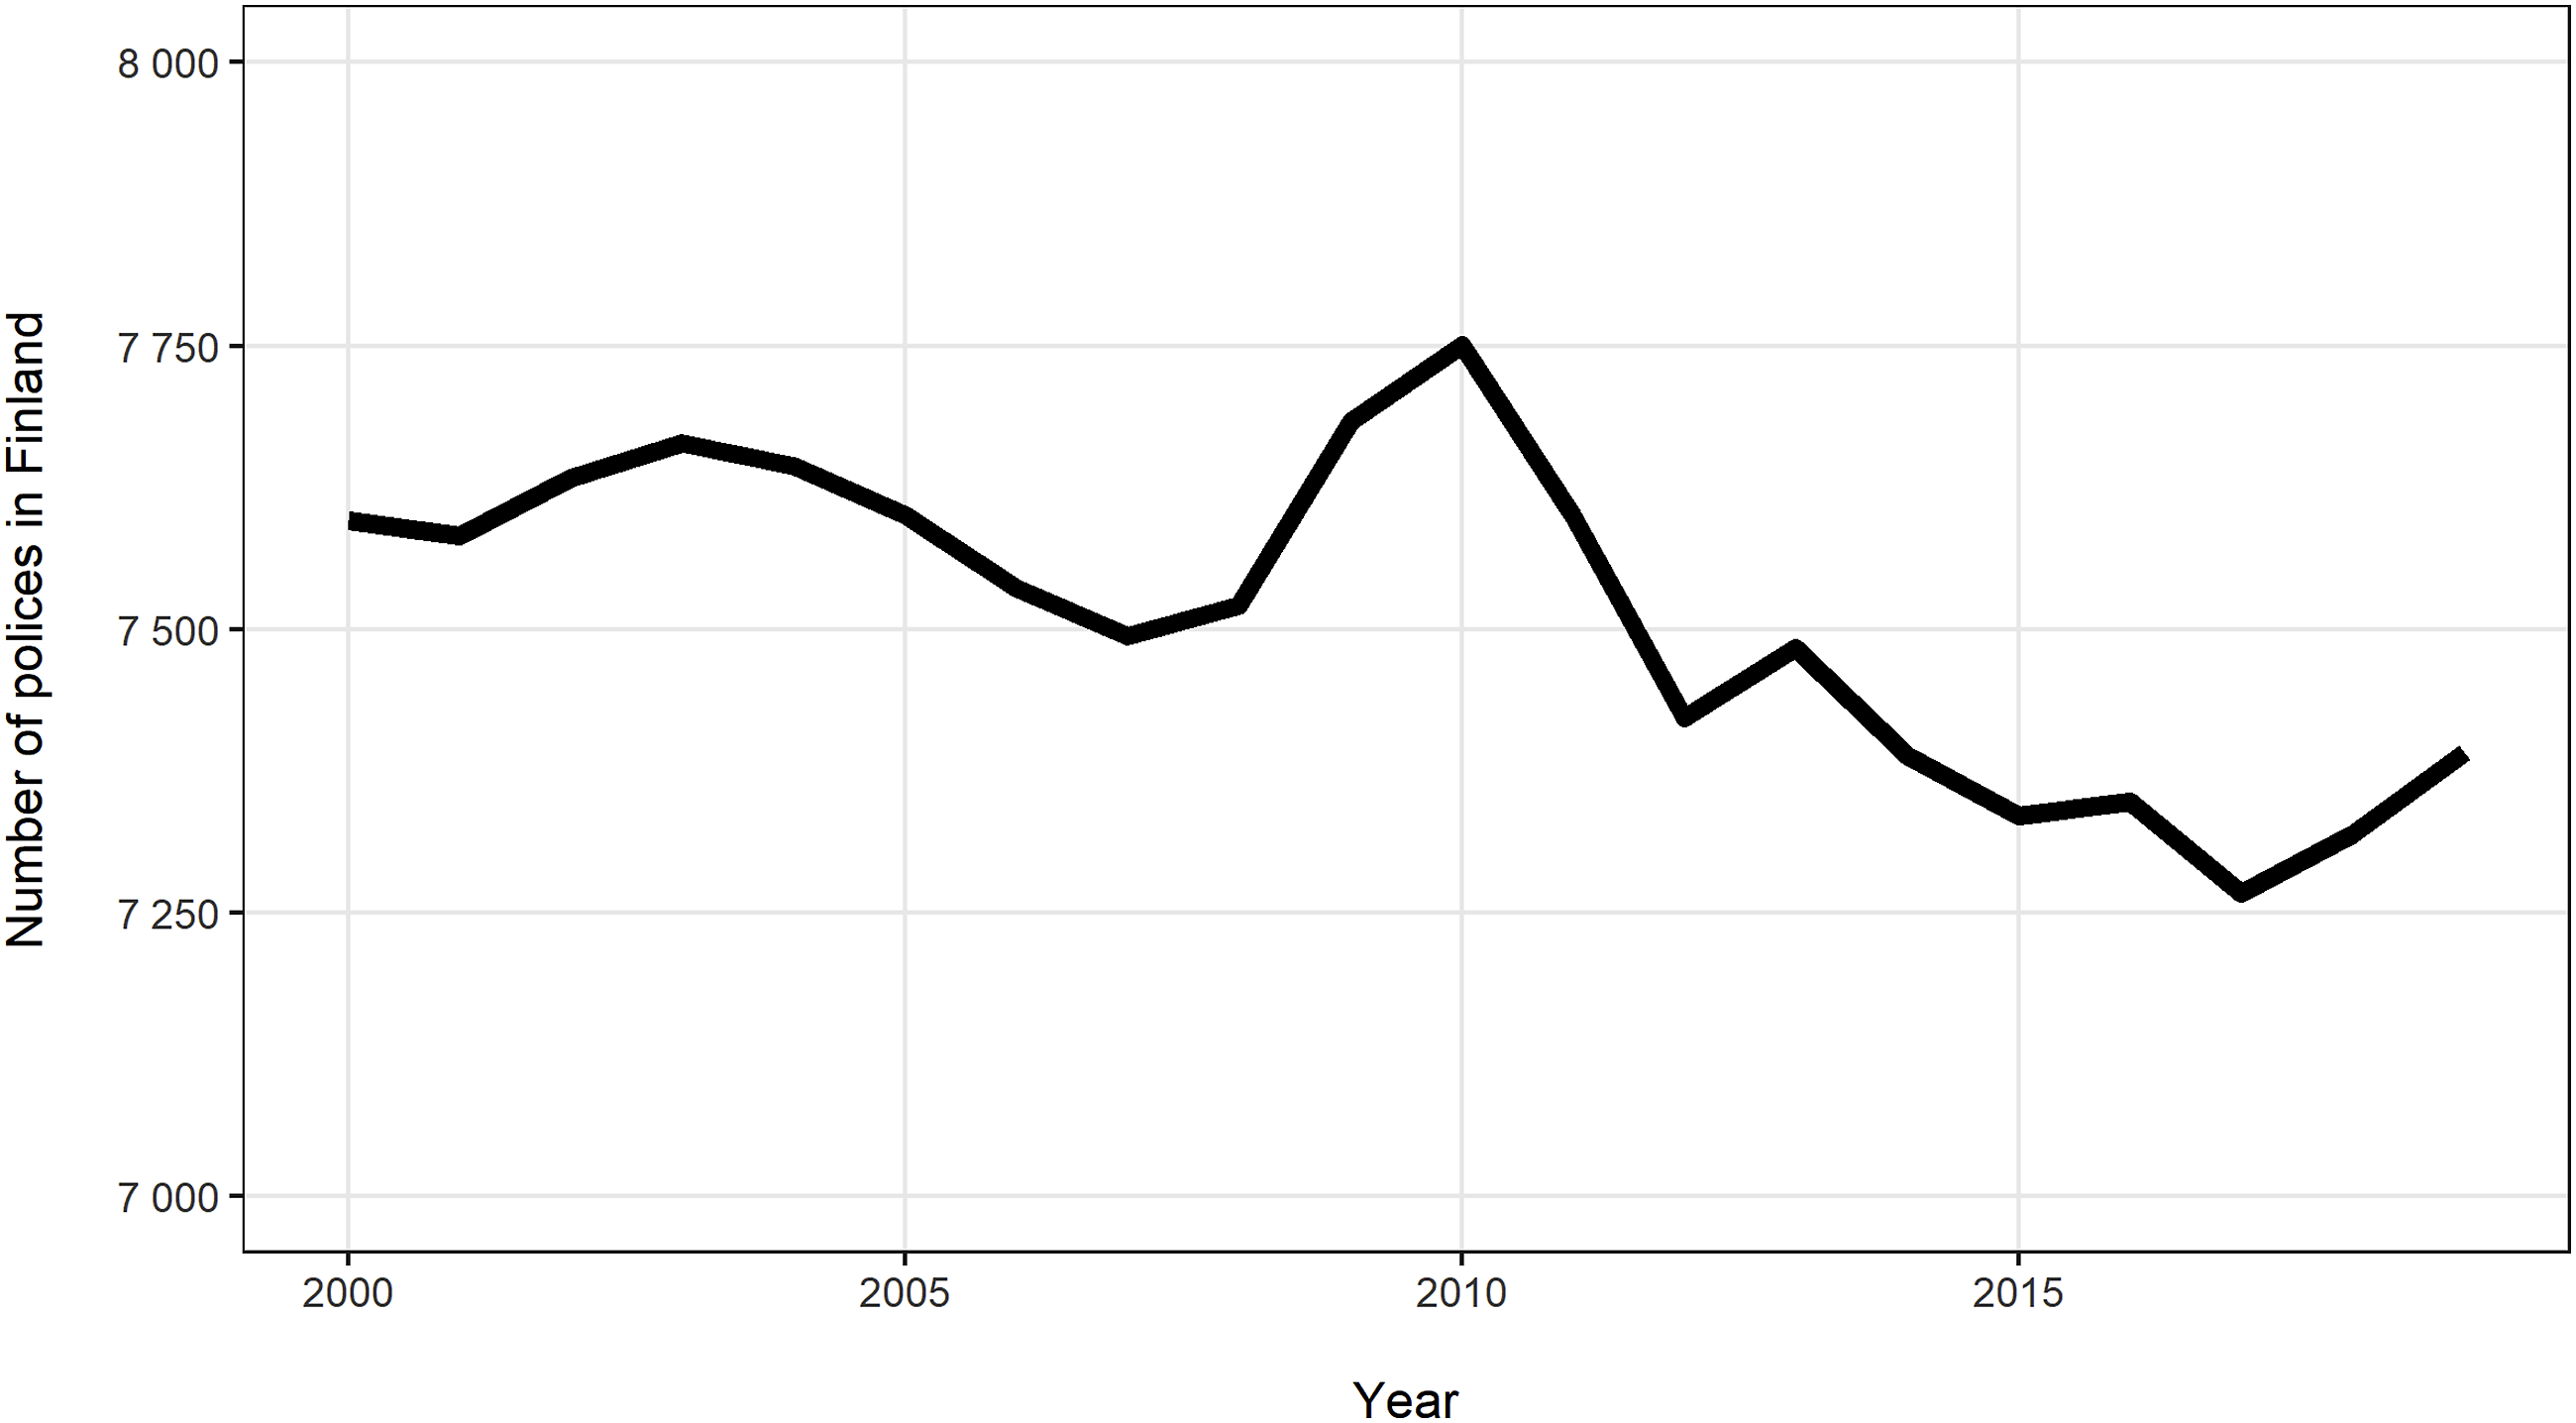
The ERT is described as a key measure of the availability and speed of police alarm services as an average in minutes. The ERT of the police is measured by the alarm assignments transmitted by the emergency centre (assignment classes 0–4) for A-urgent and AB-urgent assignments. These are the assignments of the police requiring immediate action. A category A emergency is a high-priority assignment which must be carried out immediately and must not be put on hold without good reason. This is usually an ongoing criminal activity or other event directly affecting life, health, environment or high-value property. A category B emergency is an intermediate-priority assignment should be handled promptly. In B assignments, tasks requiring police action are generally concerned with the integrity of the person, the protection of property or public order and safety. The task is potentially life-saving or prevents further major damage (National Police Board of Finland, 2020). The urgency classification of an alarm assignment sets a time temporal obligation for handling the assignment and, therefore, it has a significant effect on the day-to-day policing and the use of resources. The national average target times for police ERT (from the police perspective) are measured in A and AB assignments. The target times were 10 min in A assignments, and 18.5 min in A + B assignments in 2018. Actual ERTs vary greatly across the country but the average ERT has remained rather constant during the recent decades. (National Police Board of Finland, 2019). Vuorensyrjä (2018) found that ERTs in category A assignments have remained the same or even decreased a little during the police reform years, but that category B assignments have increased. There are several factors that affect the ERTs of the police, such as the number of patrols to be used, the location of the patrols (in relation to the emergency address), and the quantity and quality of alarm assignments in the area.
In 2017, realisation of the average police ERT was 12.2 min for category A assignments, and 26.2 min for category B ones. In the same year, there were about 69,000 category A assignments and 311,000 category B assignments. The peak of the assignments was in July when there were about 38,000 assignments (A+B). The number of police officers correlates negatively with ERTs which indicate that ERTs are smaller in regions with higher amounts of police resources (ERT task A: −0.499, t = −8.426, p-value <0.001; ERT task B: −0.175, t = −2.604, p-value <0.009). The trend patterns of monthly ERTs of category A assignments are presented by regions in 2010–2019 in Figure 2. In some regions, such as North Savo, the trend has been decreasing, that is, ERTs have become better in recent years. However, in South Savo and Kainuu, for example, ERTs have increased. The peaks in the end of the time series in many regions are caused by the introduction of the new emergency call information system (Erica). The increase of ERTs is partly due to the fact that the current information system makes the alarms easily urgent A category, whereas in the past, the overall assessment was used in a more flexible way in the assessment of urgency. Police patrols will not arrive as quickly as before if there are more alarms recorded as urgent than before. Because of this issue, the year 2017 was selected for the analyses, which was also comparable with the population statistics. Trend patterns of average monthly emergency response times (ERTs) of A category assignments by region in 2010–2019.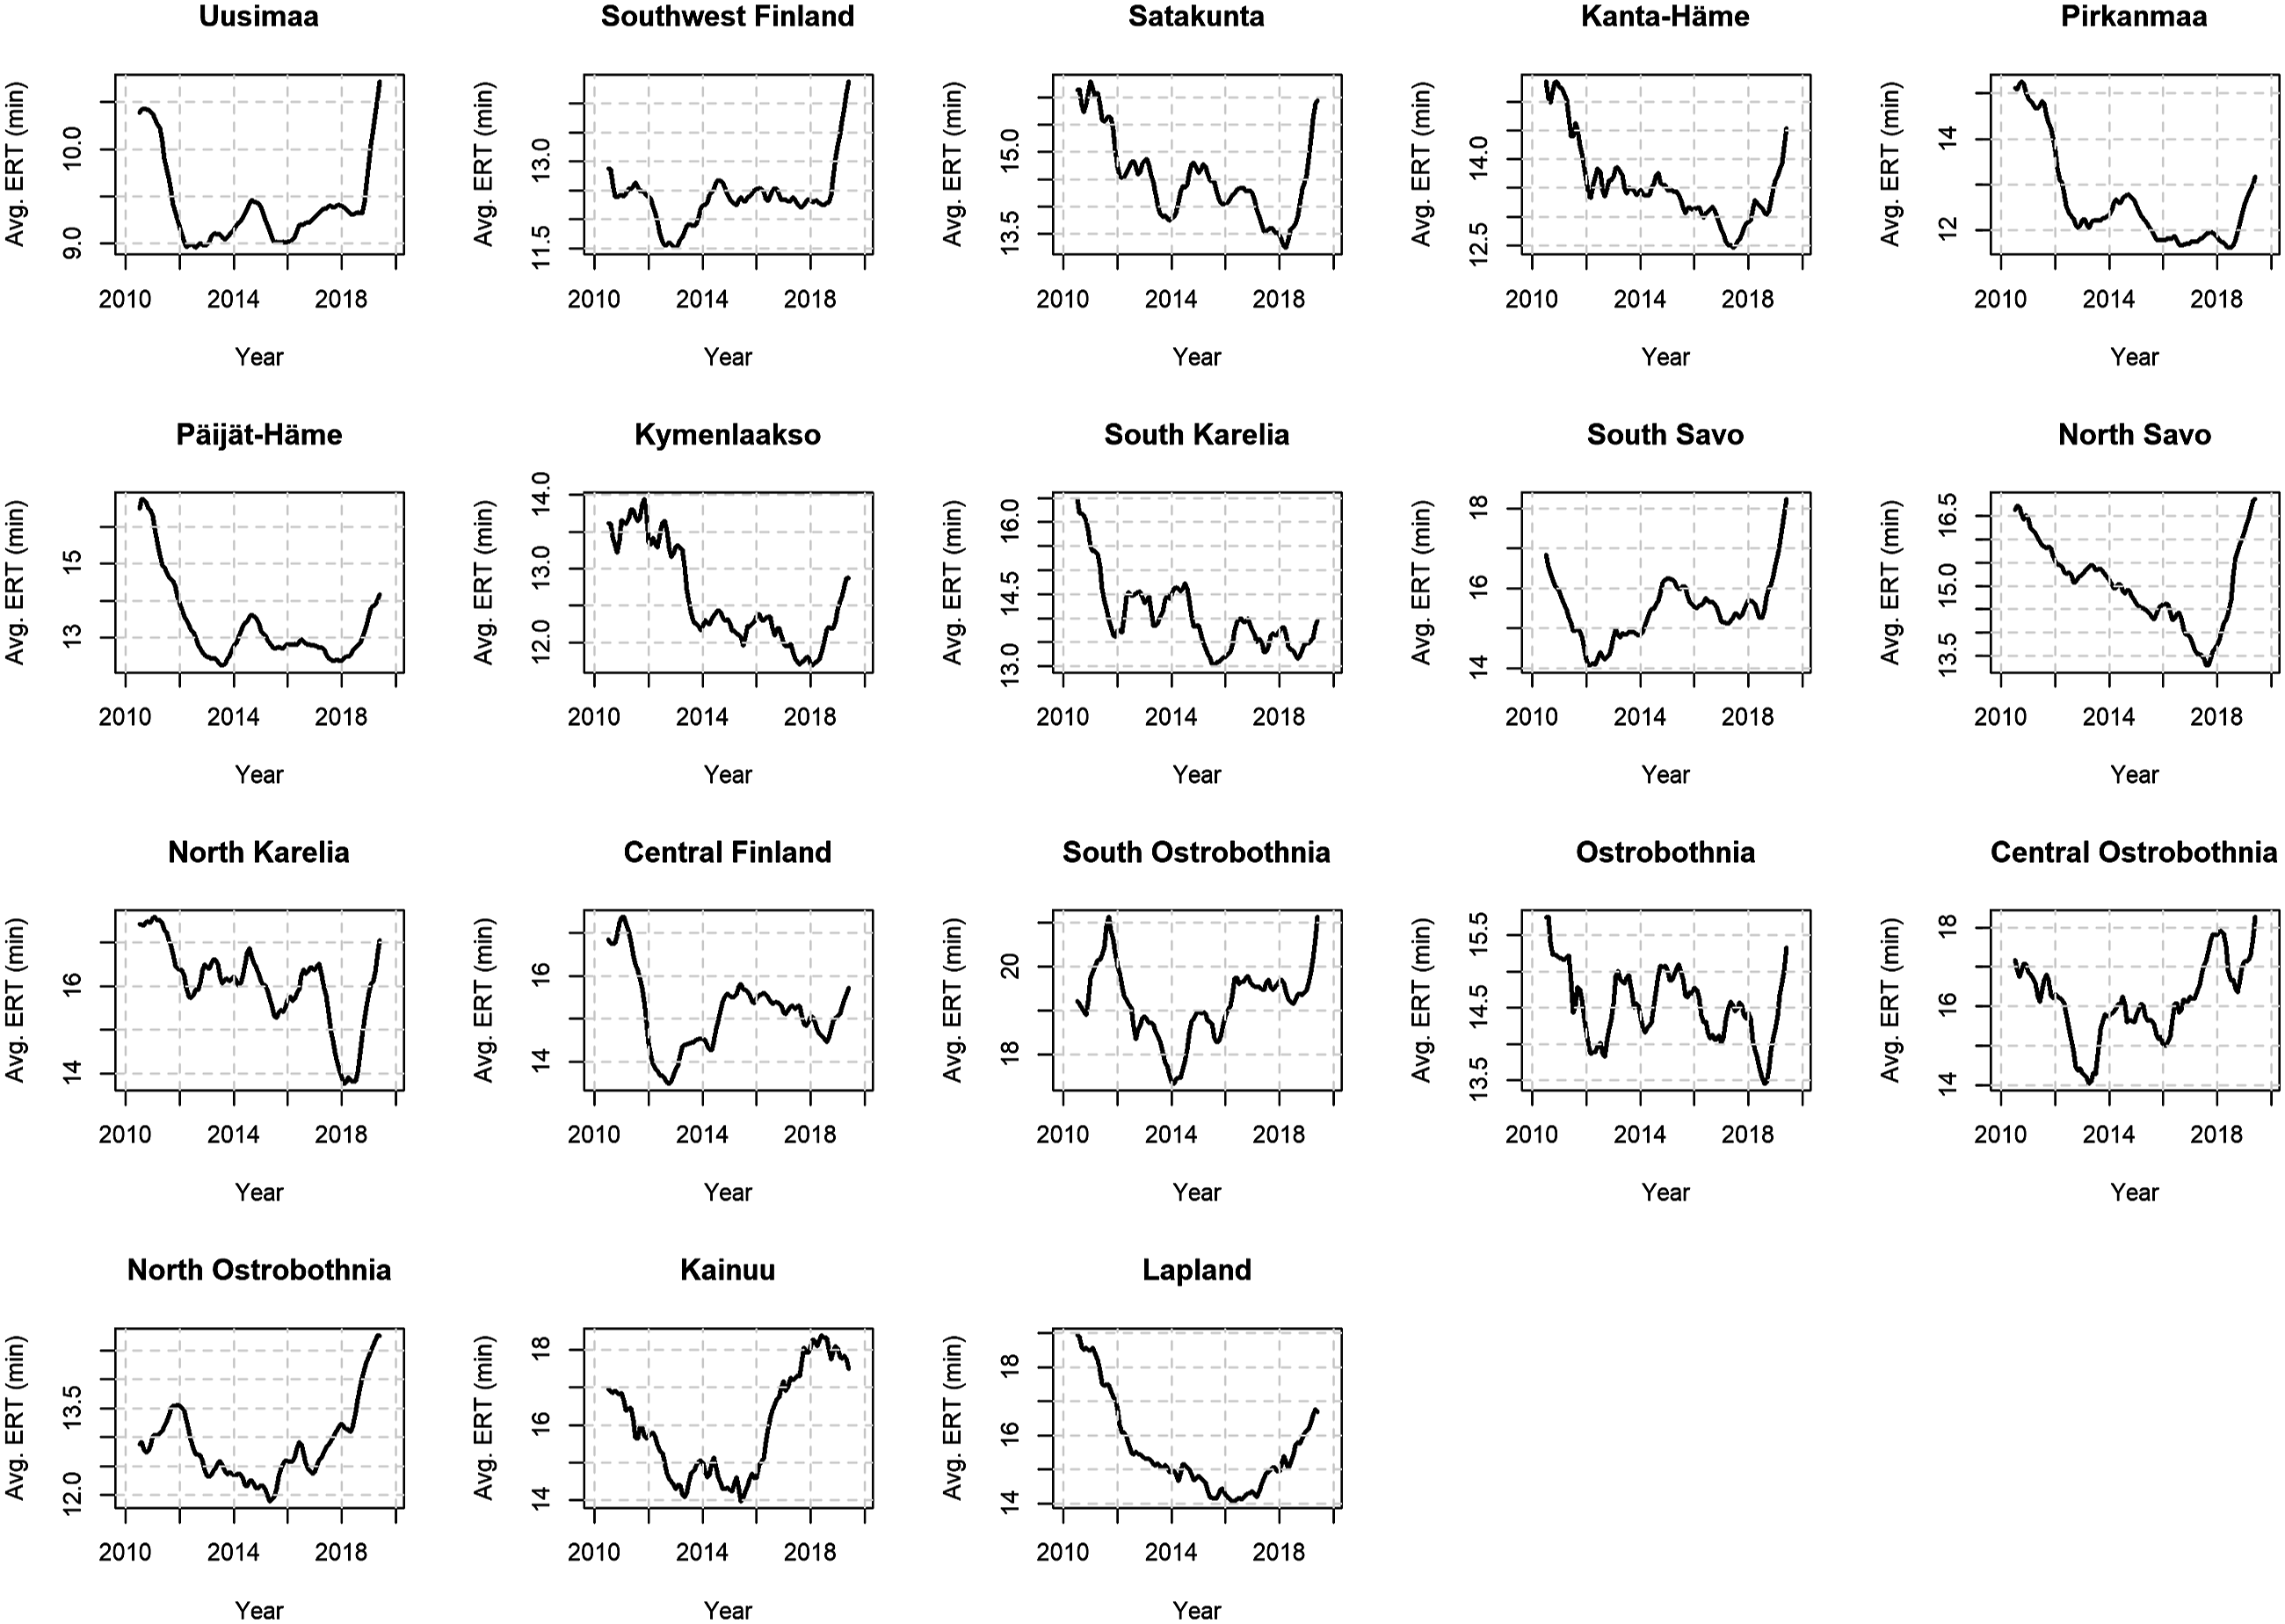
Estimation of average population
A GIS database was compiled from the YKR database (Monitoring System of Spatial Structure and Urban Form) which is one of the most advanced georeferenced statistical databases in the world enabling the performance of nationwide analyses using GIS (geographic information system) methods. The YKR database is created and maintained by the Finnish Environment Institute, and it comprises data on population, housing, workplaces and travel to work from the year 2017 for each of 16,111 square-shaped grid cells (5 km x 5 km) into which the territory of Finland is divided. This grid database was used to estimate the volumes of the seasonal populations by regions.
The average monthly population (AP
m
) describes the population after considering the monthly use patterns of primary homes and summer cottages. For 2017 it was calculated as • the variable AP2017
i,m
represents the monthly average population of a given grid cell i in the year 2017. • RP2017
i
describes the registered population in a similar way. • The variable sh2017
i
stands for the number of summer cottages in cell i in 2017. • The constant users denotes the average number of people using one summer cottage, which is 4.2, according to the LVVI study (2010). • The variable access 2010 denotes the shares of grid cell populations that had access to a summer cottage in 2010 and based on the LVVI study (2010) it was set to 0.40. • The variable use describes the monthly use of the summer cottage.

The variables users and access are based on the year 2010 because the most recent studies on these themes were performed then. The last Longitudinal National Outdoor Recreation Survey (LVVI, 2010) was conducted in the years 2009–2010 and targeted to a random sample of almost 9000 Finns.
The spatial patterns of measures of population described above differ significantly between permanent populations and average population in July (Figure 3). Permanent registered populations are concentrated in large urban areas, mostly located in southern Finland (Helsinki, Tampere and Turku) and regional cities in the central and northern parts of the country (e.g. Jyväskylä, Oulu); the rest of Finland is less or sparsely populated. The spatial patterns of average populations in July show a different picture (Figure 3). Apart from urban areas, the seasonal populations are concentrated on the coast and archipelagos on the Baltic Sea, in the Lakeland region covering the southern and south-eastern interior of the country, as well as in some tourism centres in northern Finland (e.g. Kuusamo, Levi and Vuokatti). These areas are the most popular second home areas in Finland (Figure 3). The map indicates that in a significant part of the country second home users outnumber permanent residents during high season in July. In fact, in 14 regions in July, the average population was bigger than the registered population. On average, in these regions the difference between average population in July and registered population was 19,683 inhabitants. The highest values are found from Etelä-Savo (87,797), Keski-Suomi (32,215) and Lapland (30,686). Due to seasonal mobility in Etelä-Savo, the population was 60.4% higher than the registered population in July. The population decline was the biggest in Uusimaa region where the difference was 278,823 inhabitants (corresponding to 17.5% of the registered population). Population statistics and their spatial characteristics.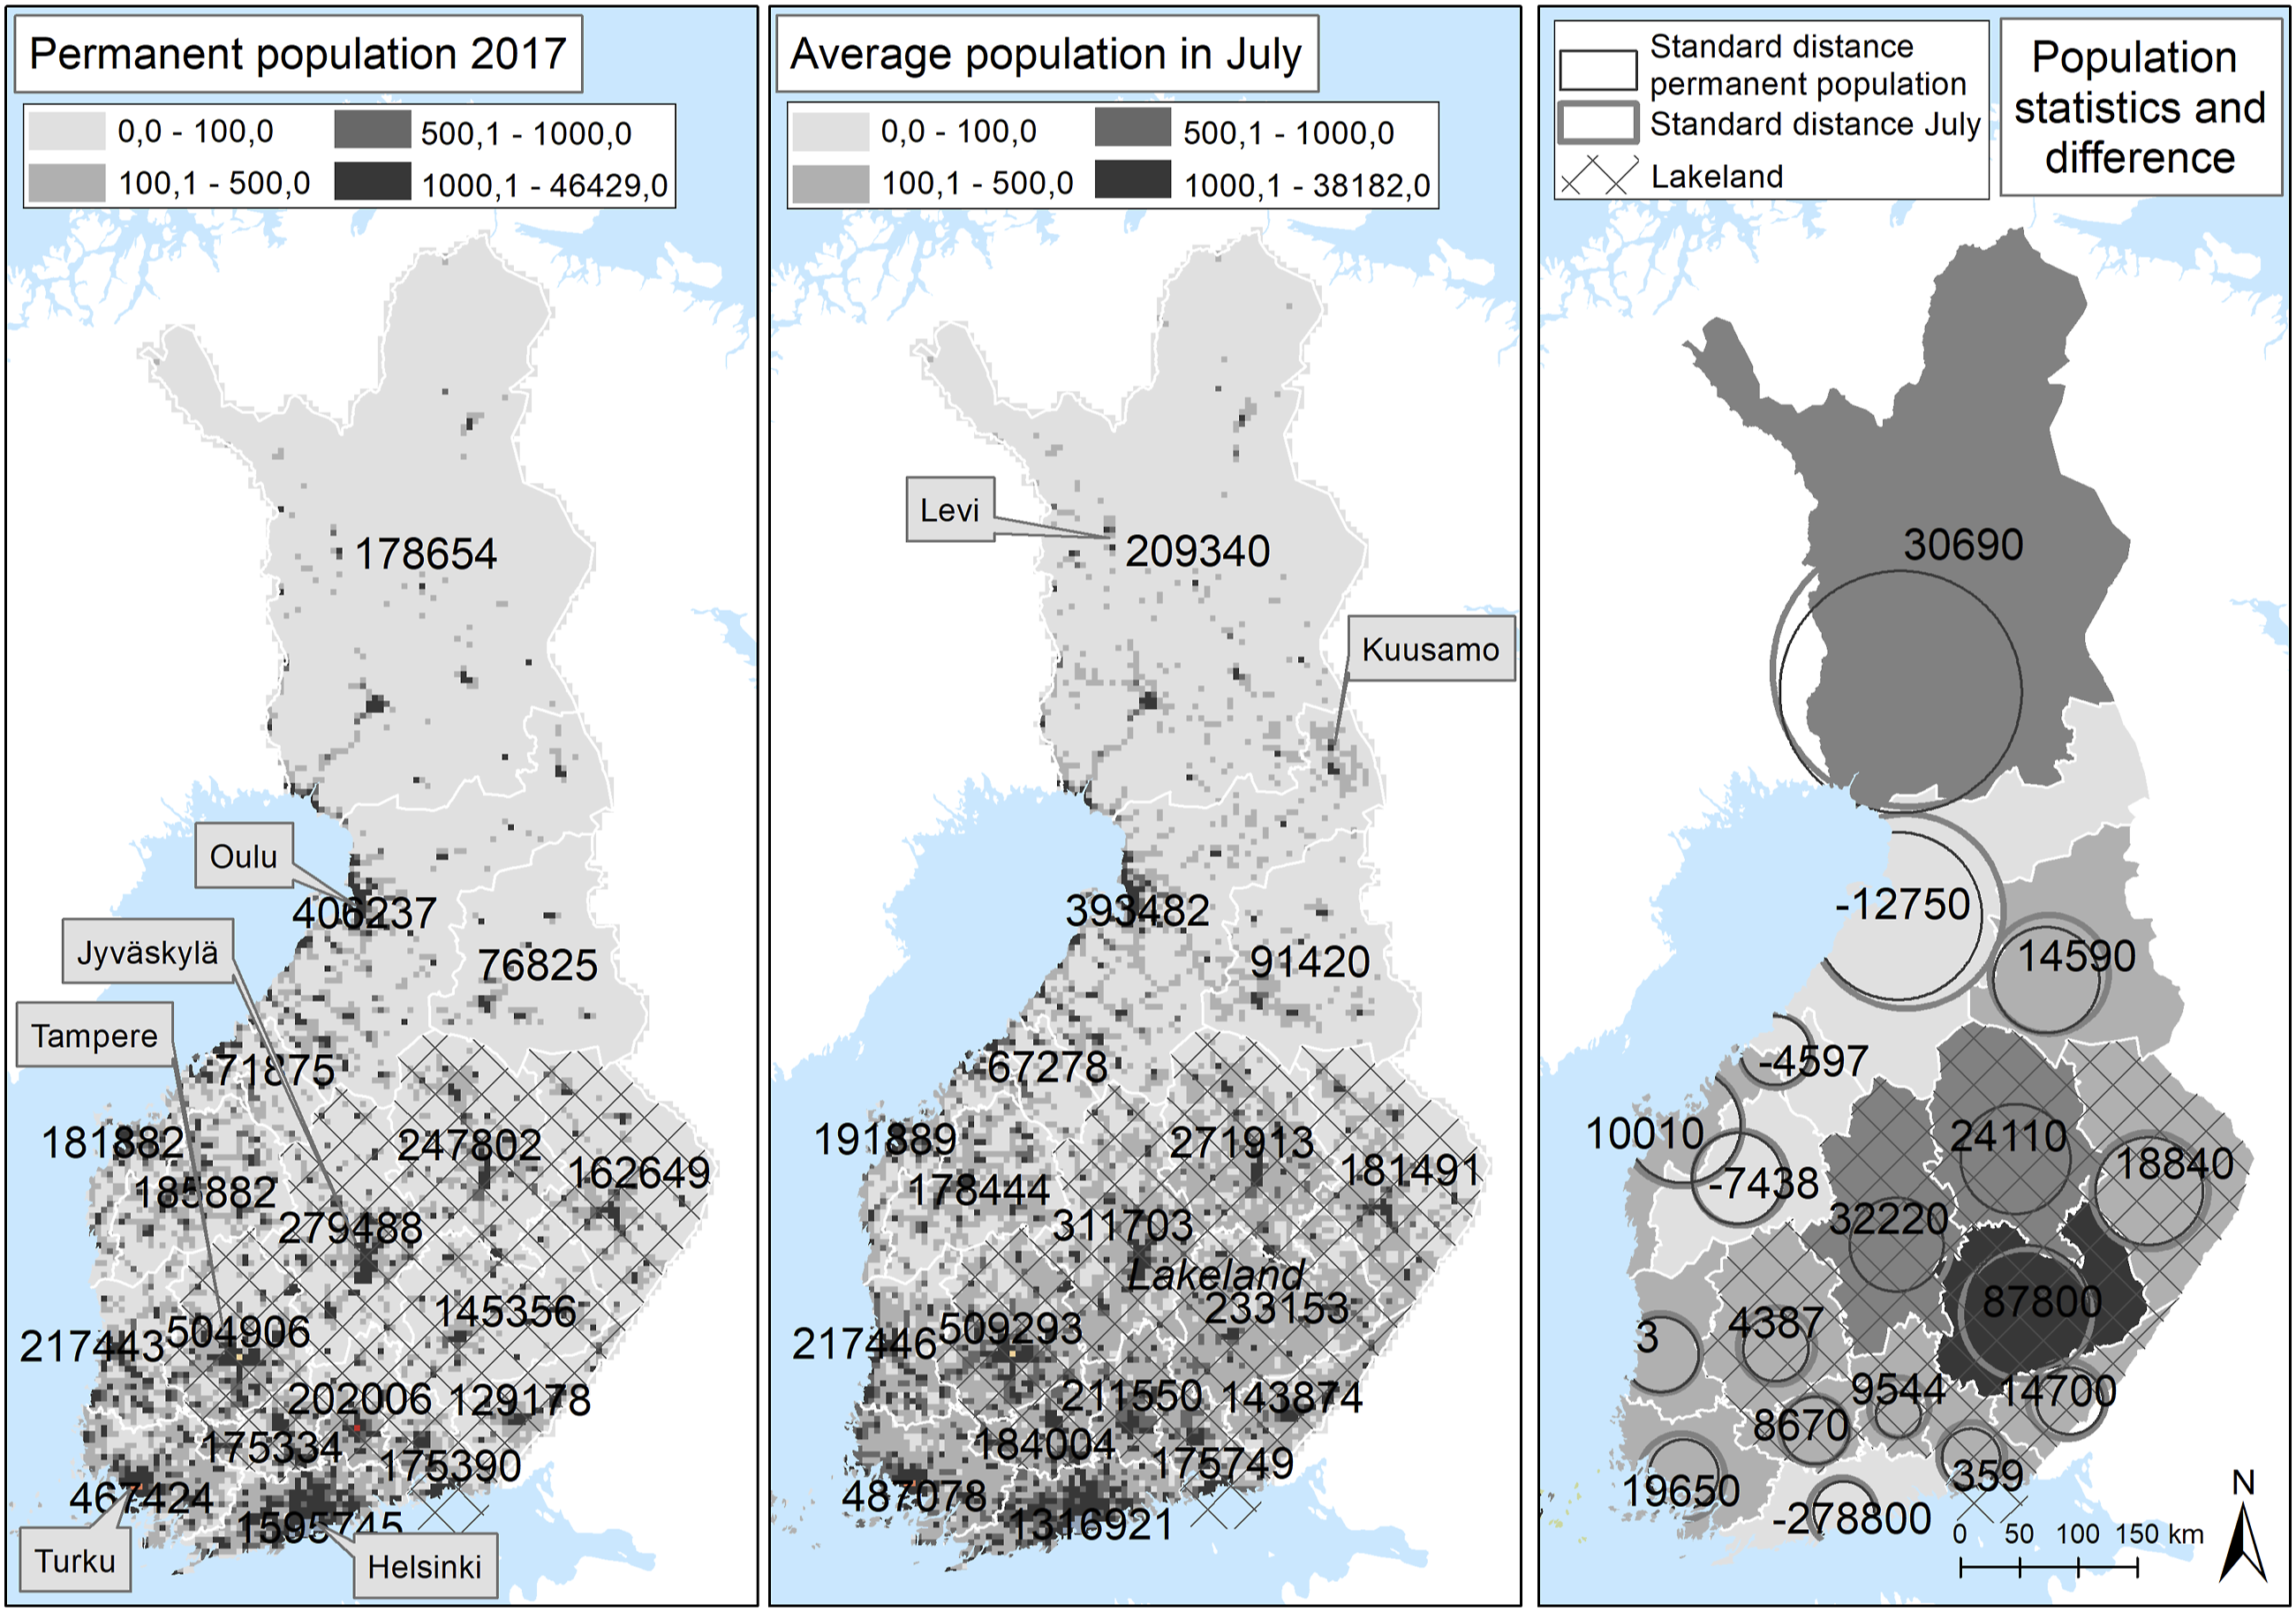
The spatial characteristics of the population concentrations and their dispersion were analysed with several indices by regions from the population grids. The median centre point identifies the location that minimises the overall Euclidean distance to the population grids, and thus, is a measure of central tendency. The median centre point was calculated for the average population every month which allowed the monthly distance difference between the average population median point and the permanent population median point to be calculated. The spatial dispersion of the population was also evaluated with the standard distance which measures the degree to which population grids are concentrated or dispersed around the geometric mean centre. The standard distance is a useful statistic as it provides a single summary measure of feature distribution around their centre (here one standard deviation circle polygon was used). These spatial statistics are described by the region in Figure 1.
Empirical implementation of modelling
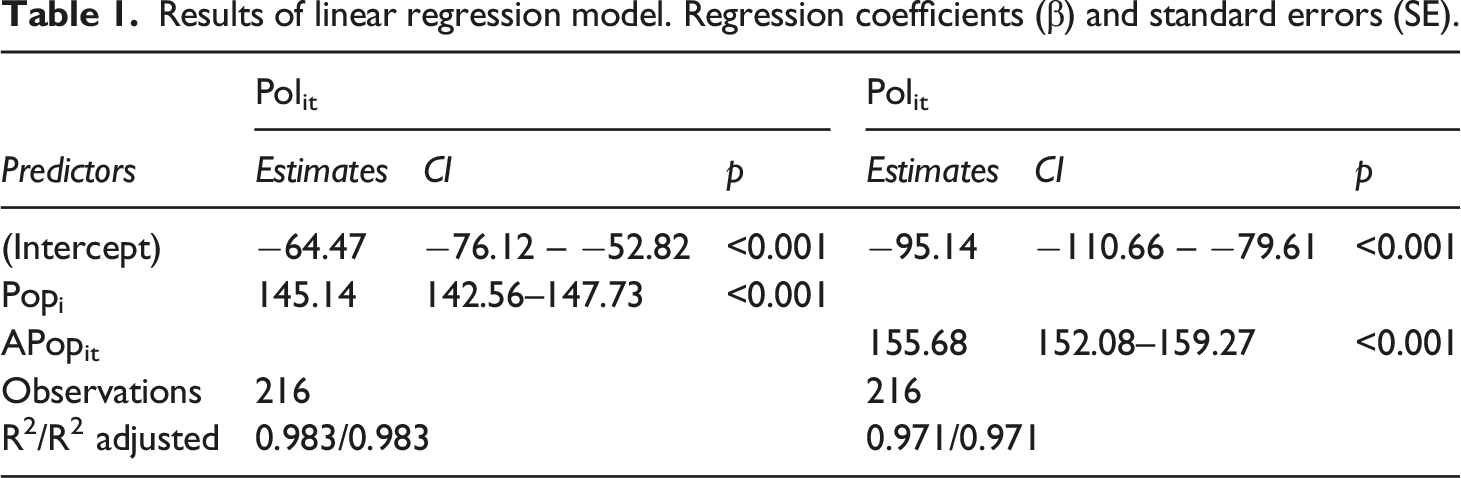
The allocation of police resources for the regions were analysed with a simple regression model where the number of police officers (Pol) in a region are explained by the permanent population (Pop). The regression model can be expressed as • Polij denotes the number of police vacancies in the region i during month t in the year 2017. • Popi denotes the permanent registered population in the region i during the year 2017. • APopij denotes the average monthly population in the region i during month t in the year 2017. • ei denotes the error term in region i during month t.


The regression model was estimated with a linear regression model using the Stats package in R.
The impact of seasonal mobility on the response time during the year was analysed with a regression model where monthly ERT is explained with the variables that describe the changes in the monthly population (∆Pop) and monthly population dispersion of the area (SD). The regression model can be expressed as • ERTit denotes the monthly average ERT of the police in the region i during month t as minutes in the year 2017. • ∆Popit denotes the difference between the average population and the permanent population as a percentage in the region i during month t in the year 2017. • ∆SDit denotes the change in the standard distance as a percentage in the region i during month t in the year 2017. • ((∆Popit*∆SDit) denotes an interaction term of the difference of the population and the standard distance in the region i during month t. • SDit denotes the standard distance of the average population from the centroid of the region i during month t. • eit denotes the error term.

The regression model is of great interest because it is directed towards the regression coefficients β:s and their signs. These coefficients measure the impact of population growth and spatial dispersion on the response times. If the signs of these parameters are positive, the seasonal growth of the population and its dispersion in the area increase the response time. This indicates that the mobility of the seasonal population should be considered in the allocation of police resources. The negative sign of the regression coefficients β:s would suggest a shortening response time due to increased seasonal mobility. In other words, the negative regression coefficients indicate that the spatial pattern of the emergency calls is not changing in the regions even though the population in the regions is evolving.
The regression model is fitted as a random mixed model by using restricted maximum likelihood estimates with random intercepts for areas because the population development in the project areas can be heterogeneous over time, for instance, having an impact on population development. In addition, the use of the random model can be justified because the selection of the broadband project areas can be considered random due to the variably available the information from the project areas. The mixed model was estimated by using the lmer function from the lme4 package of the R program (Bates et al., 2015). The mixed model regression technique is explained in more detail in, for example, in Venables and Ripley (2002).
Results
Seasonal mobility in Finland and police resource allocation
Results of linear regression model. Regression coefficients (β) and standard errors (SE).
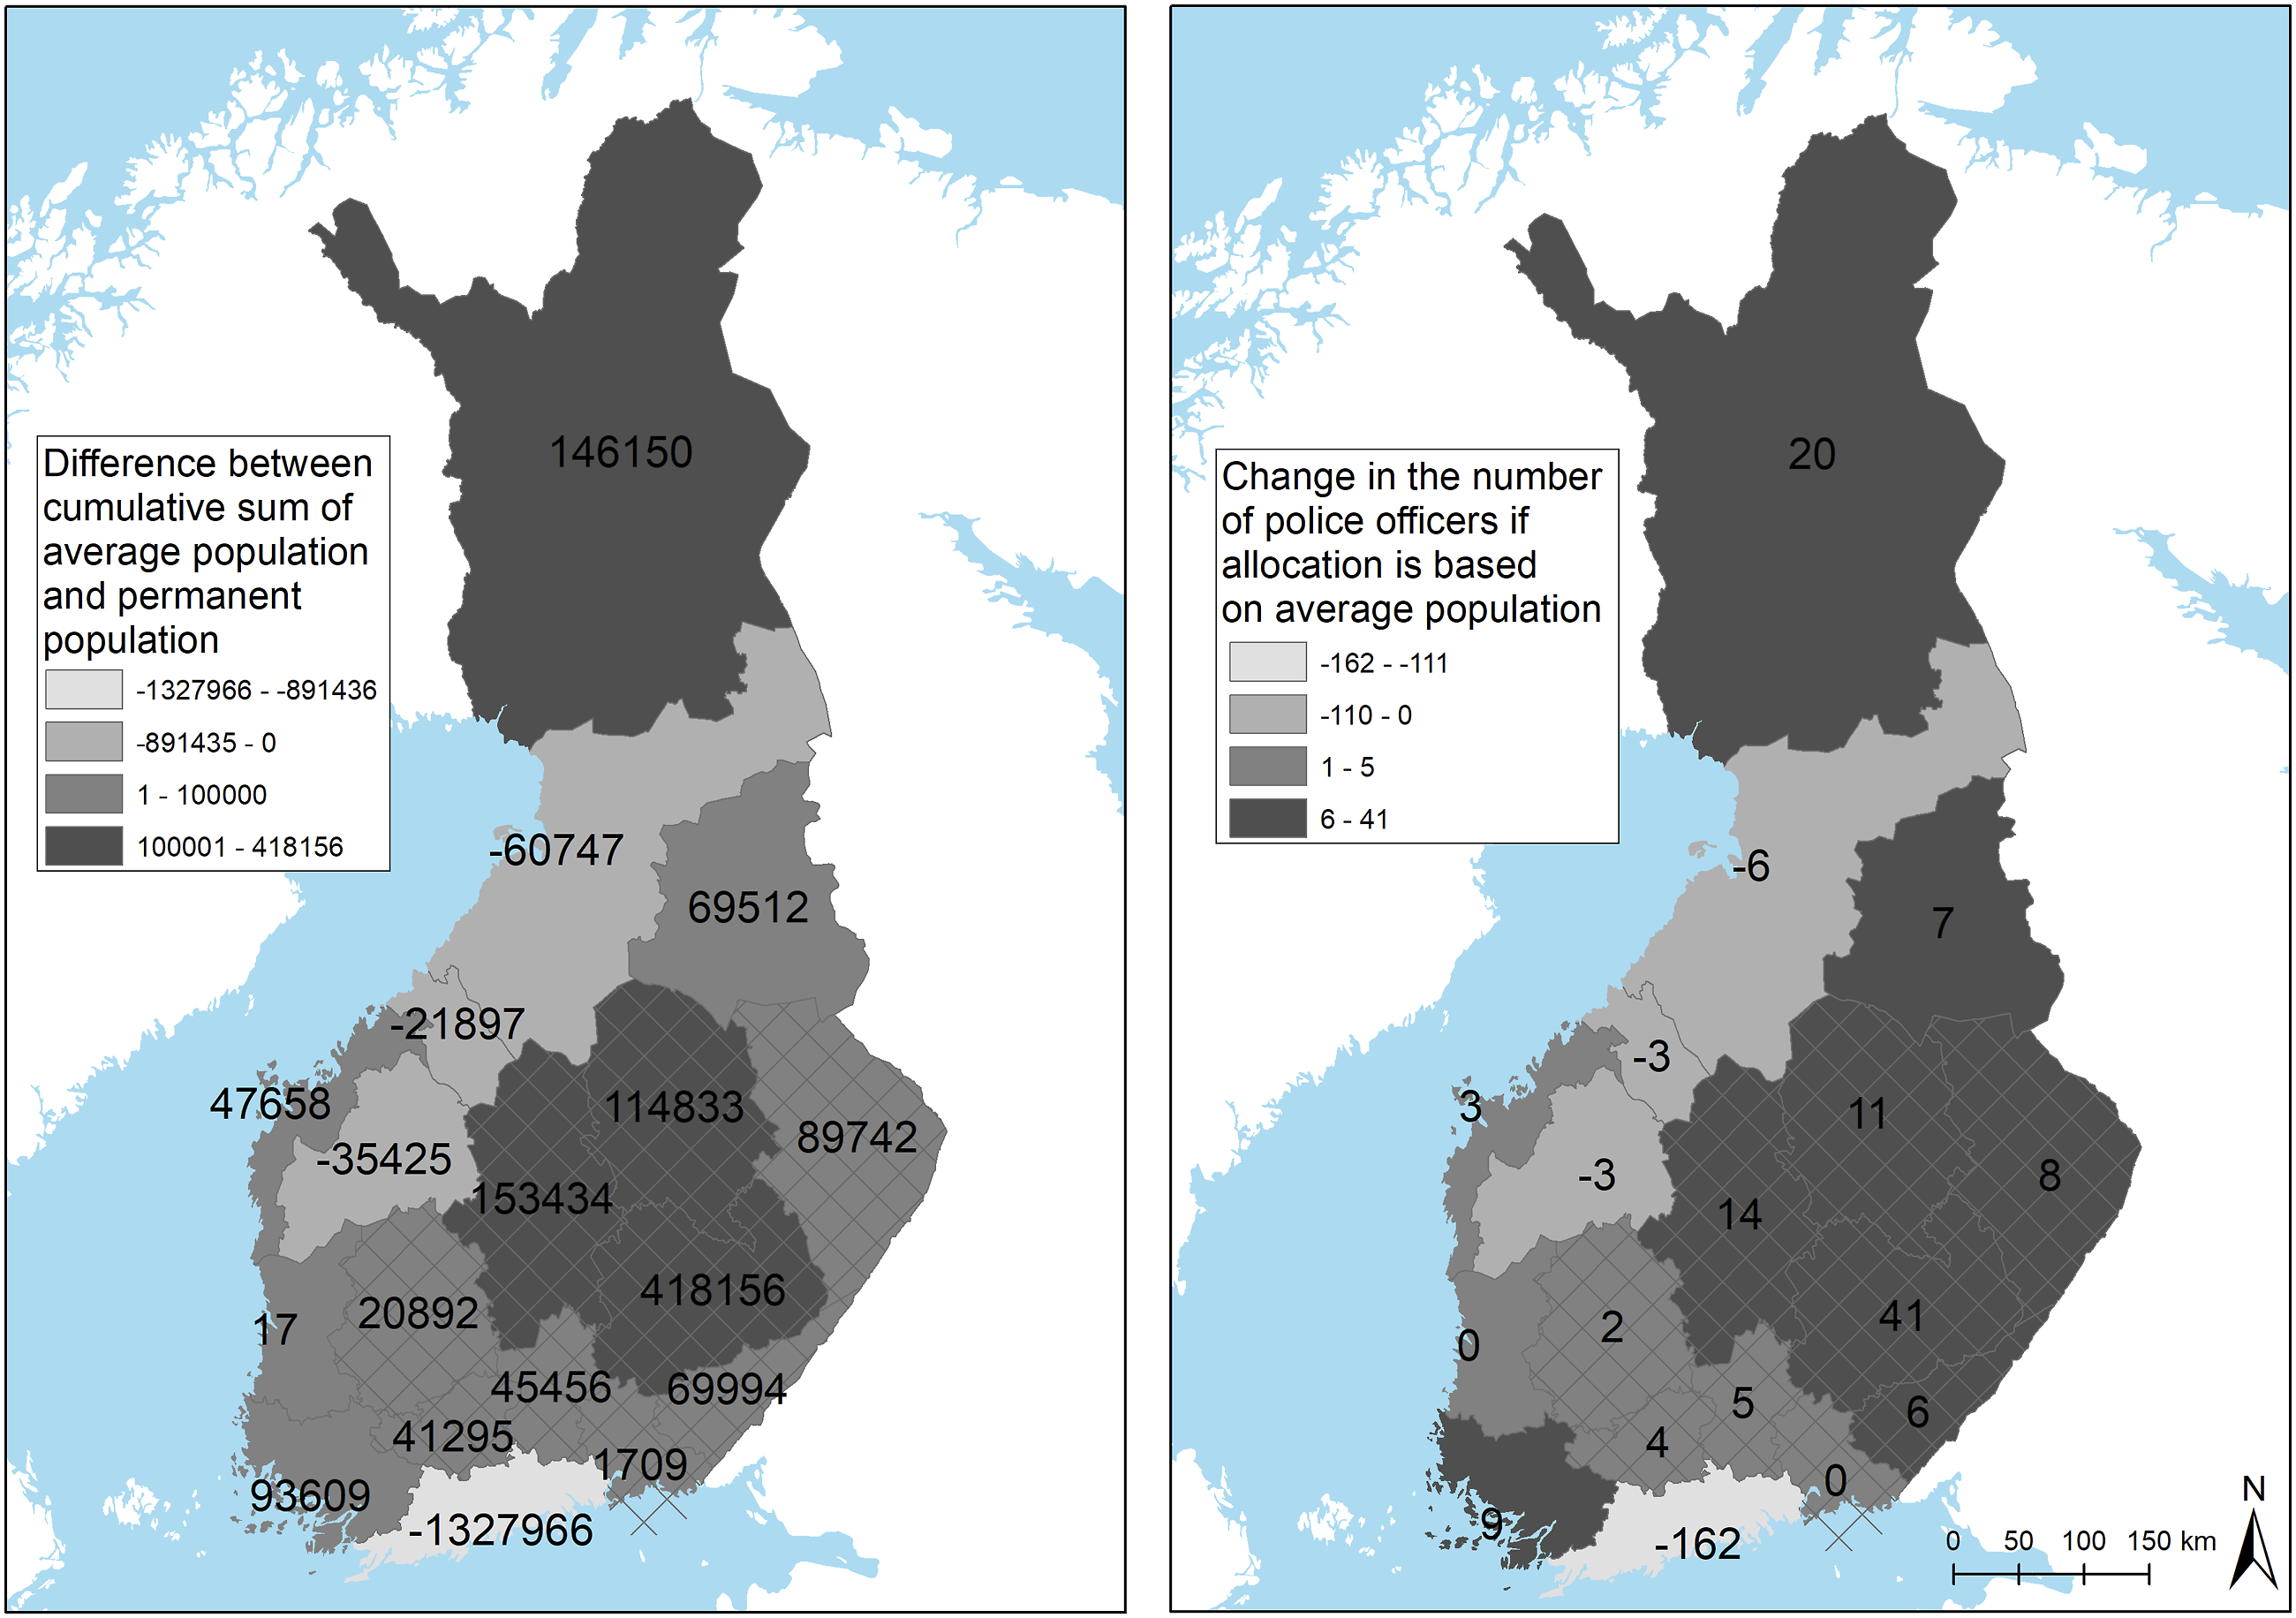
Cumulative sum of the average population and change in the number of police allocations in different regions.
The impact of seasonal mobility on emergency response times
Regression results of the random effect model.
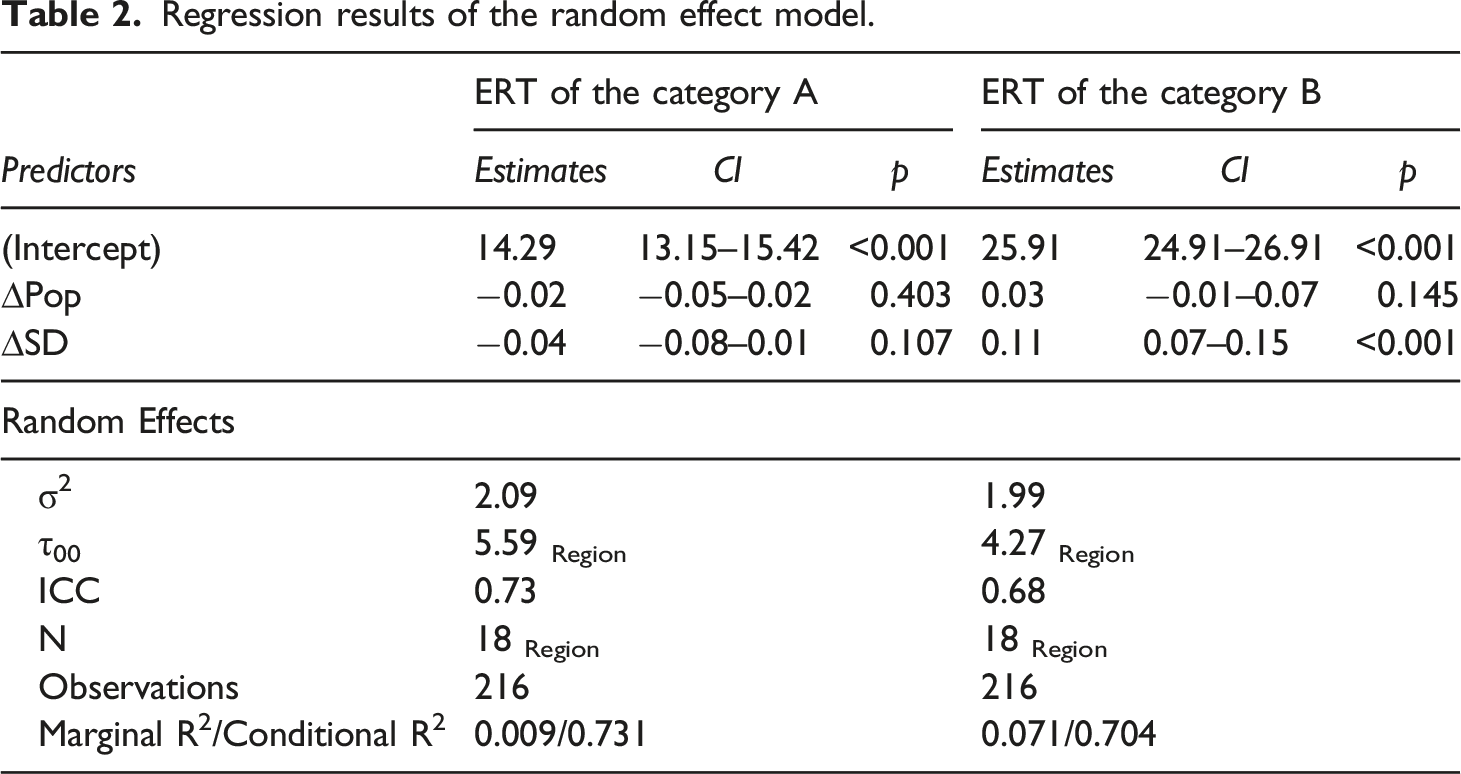
However, the ERTs of category B occurrences are strongly associated with the spatial dispersion of the monthly average population and weakly with the monthly change in the population (Table 2). Positive estimates for regression coefficients demonstrate that ERTs of category B are the highest when the monthly population and its spatial dispersion increase the most. According to the regression coefficients, for instance, if the spatial dispersion increases in the region by 5%, the response time will increase by 33 s. The comparison of the regression coefficients shows that the impact of the spatial dispersion is much higher than the impact of the monthly population growth on ERTs of category B. The regression coefficient of the spatial dispersion is 3.6 times bigger than the regression coefficient of population growth (Table 2). The R2 of the fixed effects in the regression model, marginal R2, is 7.1% and the R2 of the fixed and random effects, conditional R2, is 70.4% (Table 2).
Geographically, the monthly differences in ERTs between different regions are remarkable. In Lakeland, the police’s response times increase especially during the summertime in July (Figure 5). On the coastline and in the North, the increase of the estimated ERTs is moderate. In January, the highest increase in the ERTs of category B event was found in the Päijät-Häme region where the increase was 0.5 min. Seasonal variations are highlighted since the increase of ERTs in July is over 6 times quicker than those in January as the response time increases by 3.8 min due to seasonal mobility. Other regions with a remarkable increase in ERTs were Central Finland, South Savo and North Karelia (Figure 5). Impact of the seasonal mobility on ERTs of category B in January and July 2017.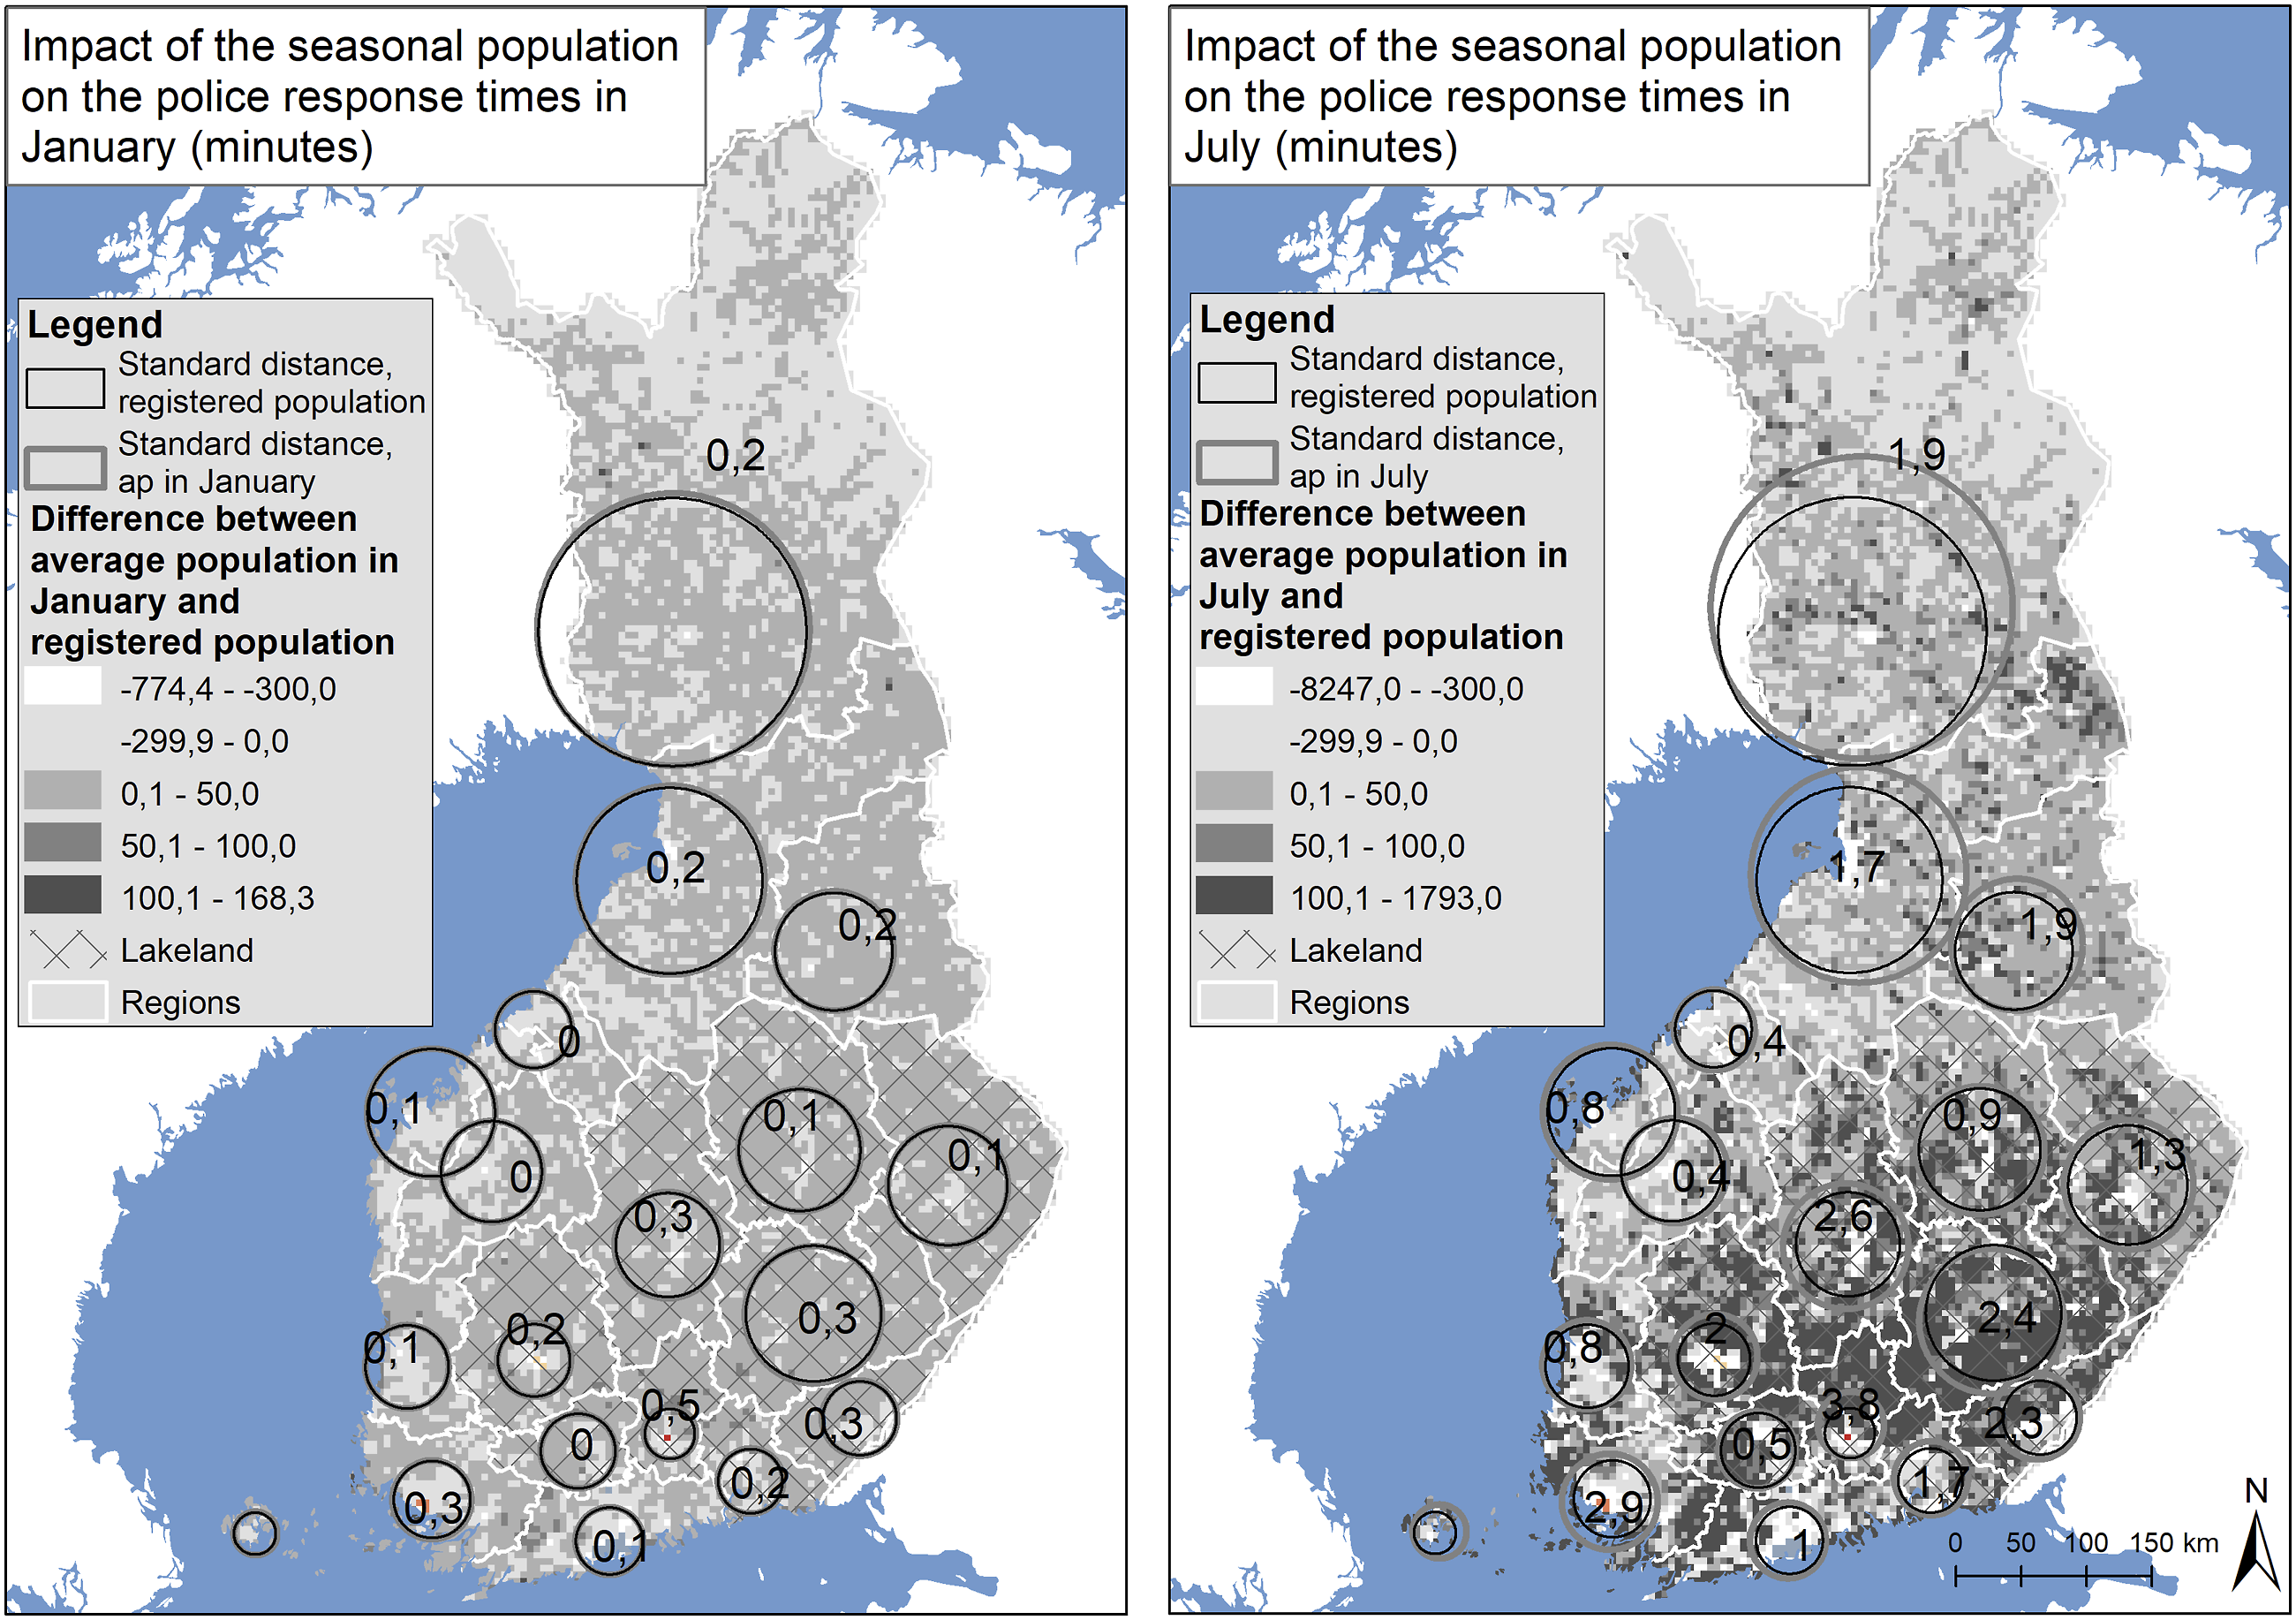
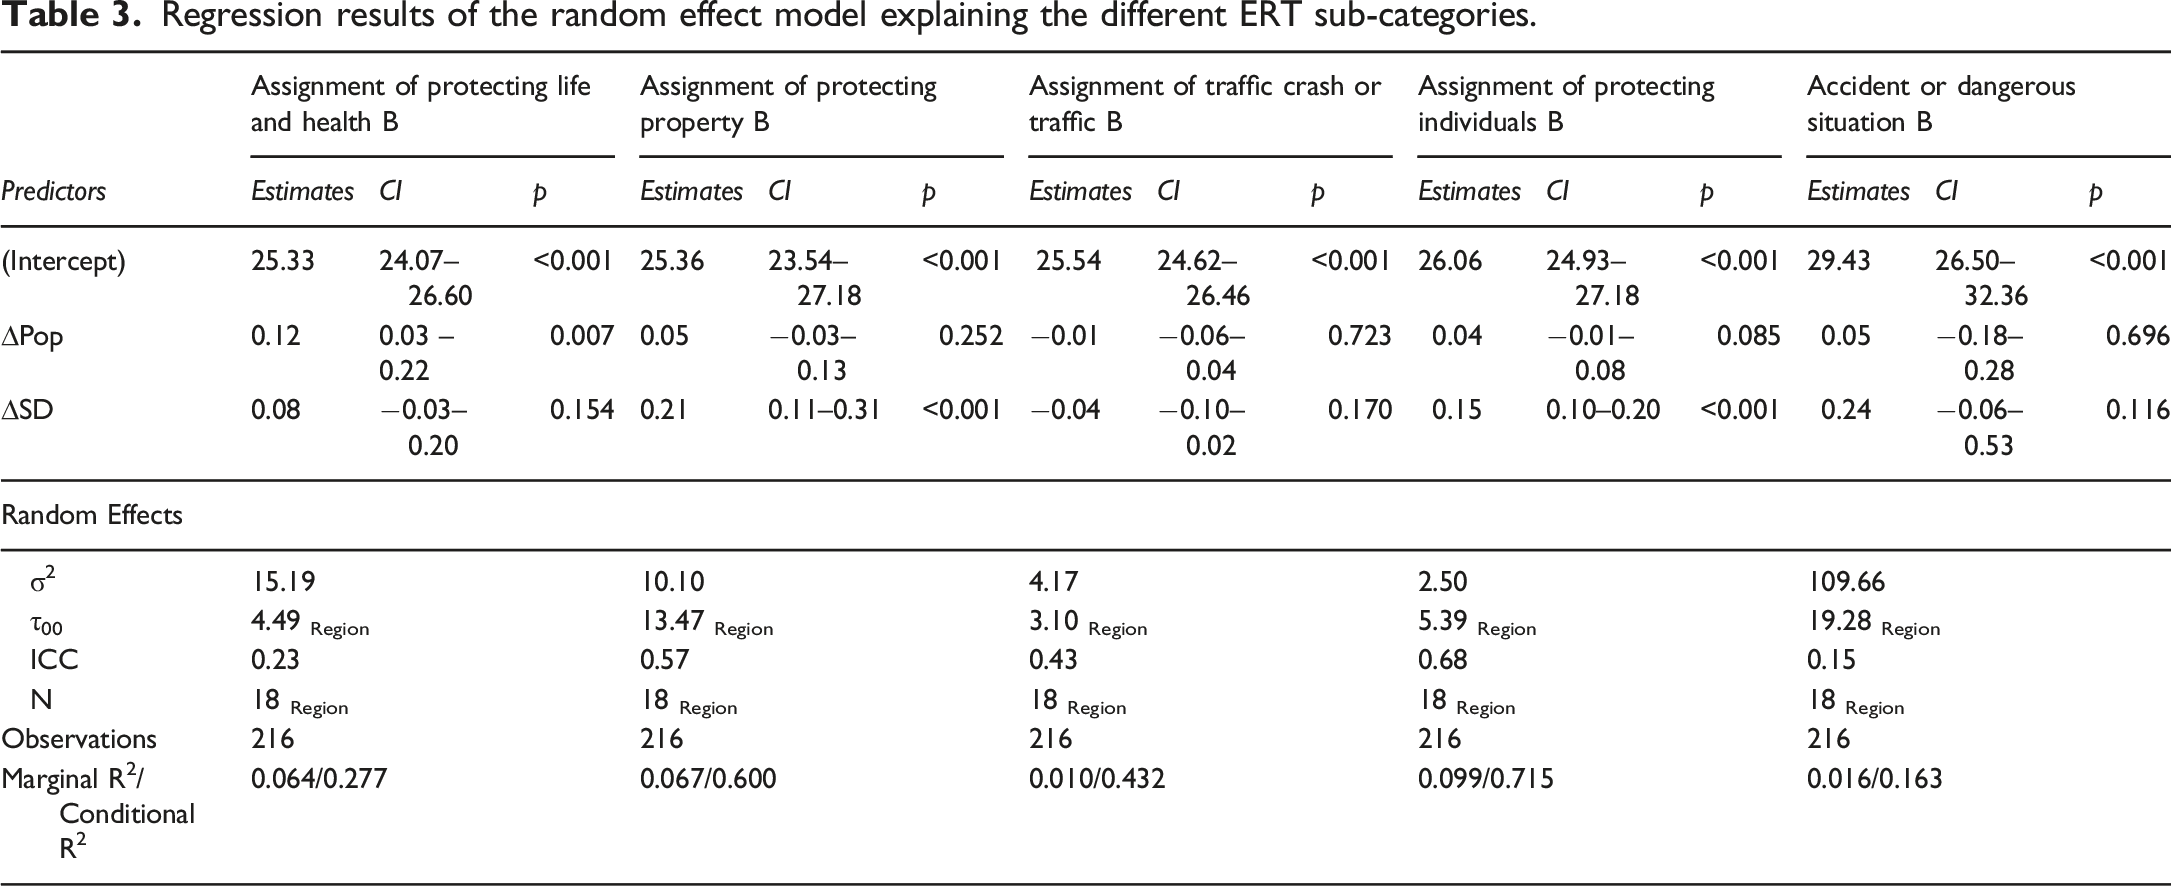
Regression results of the random effect model explaining the different ERT sub-categories.
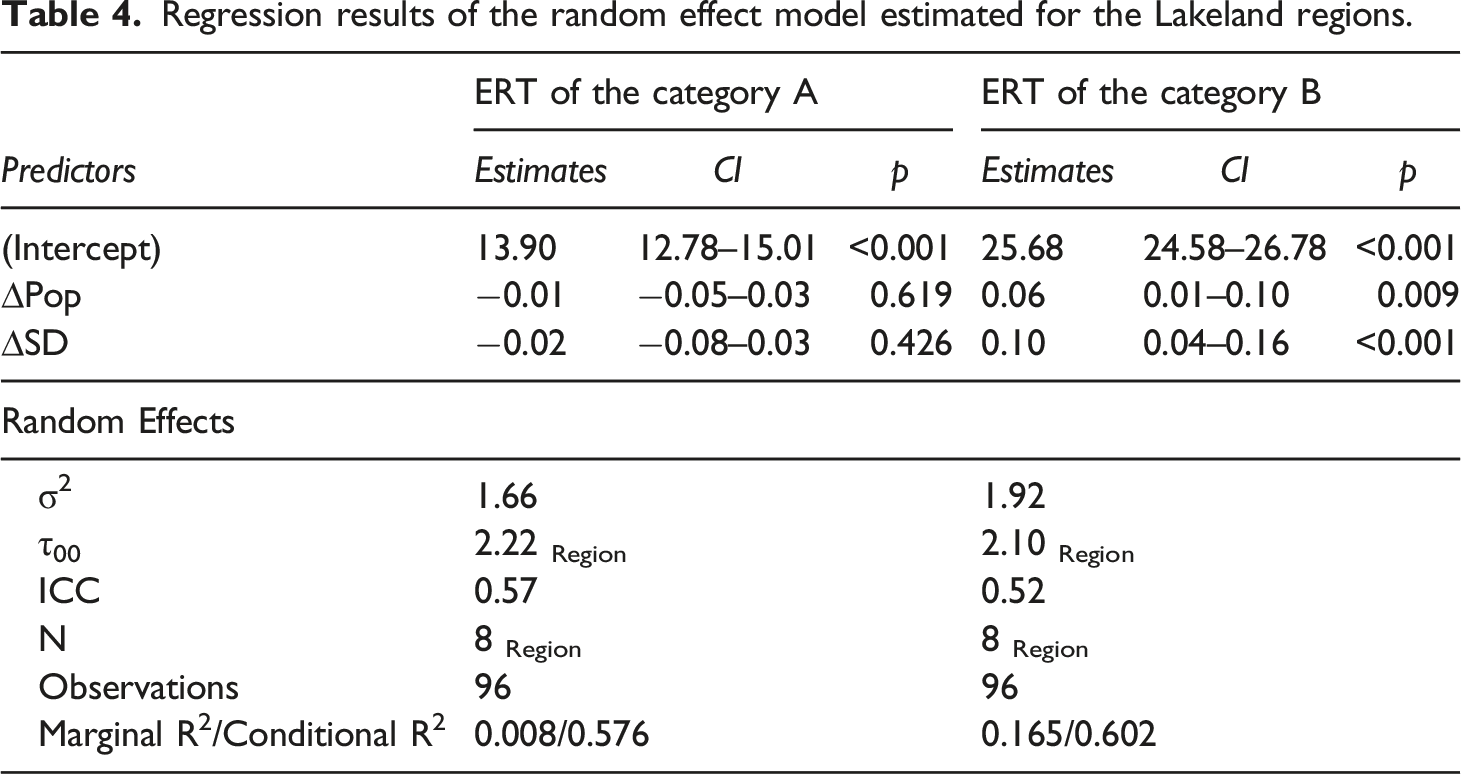
Regression results of the random effect model estimated for the Lakeland regions.
Discussion and conclusion
The results of the article demonstrate that in the ERTs of category A assignments, there were no associations between the growth of the seasonal population and its spatial distribution within the regions. Hence, regions seem to have enough police resources for conducting the category A assignments during all seasons. However, the ERTs of category B assignments show a clear association with both population variables since the ERT was lengthened as the seasonal population increased and spatially dispersed over the regions during the seasons. This finding indicates slight lack of seasonal resources especially in the Lakeland area and Lapland where the increase in the seasonal population is the strongest and the loss of the registered population is compensated by a seasonal population increase. Thus, sizing the regional police resources based on the permanent population does not correspond to the equality of the regional ERTs. The findings of the article, therefore, underline that police resources in the regions are mostly allocated based on the permanent population which is a biased indicator of the number of people using the region in different seasons. Furthermore, the results provide support for the assumption that police resources should be allocated based on ERTs and the seasonal populations, not just based on the number of permanent populations. This would also help the dynamic planning of the allocation of the police resources within and between regions.
The results of this study have highlighted two main seasonal population components that are associated with ERT and the further allocation of the police resources and mobility. The changing seasonal scale and dispersion of the population challenge police resource planning and allocation which is currently mainly driven by registered populations and ‘single-locality’ thinking. Of these two mobility properties, the effect of a structural element of seasonal population dispersion can be multiple in comparison with the effect of a seasonal scale. Particularly in those regions where the structural element of population dispersion changes strongly seasonally, the change in the population centre is large during the summer which also increases the ERTs of category B assignments. The results underline that the seasonal mobility of populations should be involved the future planning process of police resource allocation.
This study highlights the importance and role of temporary mobility in urban-rural population dynamics and their implications for police resourcing. Based on the findings, we advocate taking seasonal population into account when planning and allocating on police resources as it can prolong ERTs of category B in rural areas. Thus, multi-locality represents changes in the society highlighting the need for new resource allocation principles. In Finland, multi-local living relates to the urbanisation process and research has shown that intensifying urbanisation increases seasonal populations and mobility in Finland (Alasalmi et al., 2020); this undermines the use of the current allocation principles in the future allocation of police resources. The multi-local living and growing mobility patterns of people and place-independent work have positively challenged the ‘old ways’ of observing, organising and governing society and its functions.
The dynamic demographic information highlights the need for information management and the use of new dynamic data sources in the future allocation of police resources. In the modern mobile world, temporary mobility should be treated as an integral part of regional populations, and ignoring it hampers the complete understanding about population processes in different regions and their service needs. The main limitation of this study is related to the calculation of the seasonal population. To improve accuracy, future studies should use cellular data to assess more accurate population movements. In the future, for example, negative natural population growth in most of the urban and rural areas will pose further challenges for resource allocation as the share of the seasonal population in the regular population increases. Finnish police and society in general must tackle these challenges through smart adaptation and identify cost-efficient solutions for spatially heterogeneous areas in the ongoing decade. These solutions must also be supported by relevant and efficient data-driven planning with improved situational awareness of the dynamic society.
Footnotes
Declaration of conflicting interests
The author(s) declared no potential conflicts of interest with respect to the research, authorship, and/or publication of this article.
Funding
The author(s) received no financial support for the research, authorship, and/or publication of this article.