
Abstract
In 2017, hot spot policing interventions were implemented in four cities in Argentina: La Plata, Morón, Santa Fe and Tres de Febrero. Each intervention was similarly designed, organized and implemented. Results differed between cities. La Plata experienced the largest decreases, including a significant 31% decrease in robbery (while controlling for geographic displacement), whereas in other cities, a mix of non-significant decreases and increases in robbery and theft were observed. No displacement was observed to assaults or vehicle crime. The differences in impact between cities were likely to be associated with differences in the project management of each intervention.
Introduction
Numerous studies from North America, Europe and Australasia have shown that hot spot policing can have a significant impact in decreasing crime (see Braga et al., 2019 for a review of 65 hot spot policing programmes from these continents). To date, the application and evaluation of hot spot policing in Latin American settings has been limited. Cities in Latin America experience crime levels that are often 10 times greater than those in most other settings (UNODC, 2017) and experience higher spatial concentrations of crime (Chainey et al., 2019). This suggests that hot spot policing is an intervention that has potential for decreasing crime in Latin American urban environments.
In this paper, we report on the results from a quasi-experimental evaluation of the first multi-city hot spot policing programme implemented in Argentina. As there have been very few implementations of hot spot policing in Latin America, this study provides one of the first evaluations of this type of policing in the region. The study also contributes to the research evidence on hot spot policing by examining if the impact of the interventions were consistent over the duration of each intervention, if crime type displacement was observed and considers how differences in the project management of each intervention influenced the results.
Hot spot policing and programme implementation
Hot spot policing involves the deployment of police officers to specific places where crime is observed to highly concentrate. Hot spot policing aims to reduce crime by countering the geographically concentrated nature of crime (Braga and Weisburd, 2010). Evaluations have shown that hot spot policing can significantly decrease robberies (Chainey et al., 2020; Sherman and Weisburd, 1995), violent crime (Ratcliffe et al., 2011; Rosenfeld et al., 2014), crimes against property (Andresen and Lau, 2013; Weisburd and Green, 1995) and drug offences (Lawton et al., 2005). Evidence from these evaluations has also shown that crime does not significantly displace from the areas where hot spot policing is deployed (Braga et al., 2019).
Deterrence is a key principle to how hot spot policing works (Weisburd and Telep, 2014). The deployment of police patrols to crime hot spots aims to discourage would-be offenders from committing crime because of the greater certainty of being caught. Additionally, increases in police activity in hot spots (such as increases in stop and frisks) and improved community awareness that reduces vulnerability to crime may also contribute to crime reduction in hot spots (Ratcliffe et al., 2011). Hot spot policing can also improve the public’s perception of security (Collazos et al., 2020), and when combined with wider problem-solving efforts, the impact on crime reduction has been greater and more sustainable (Taylor et al., 2011).
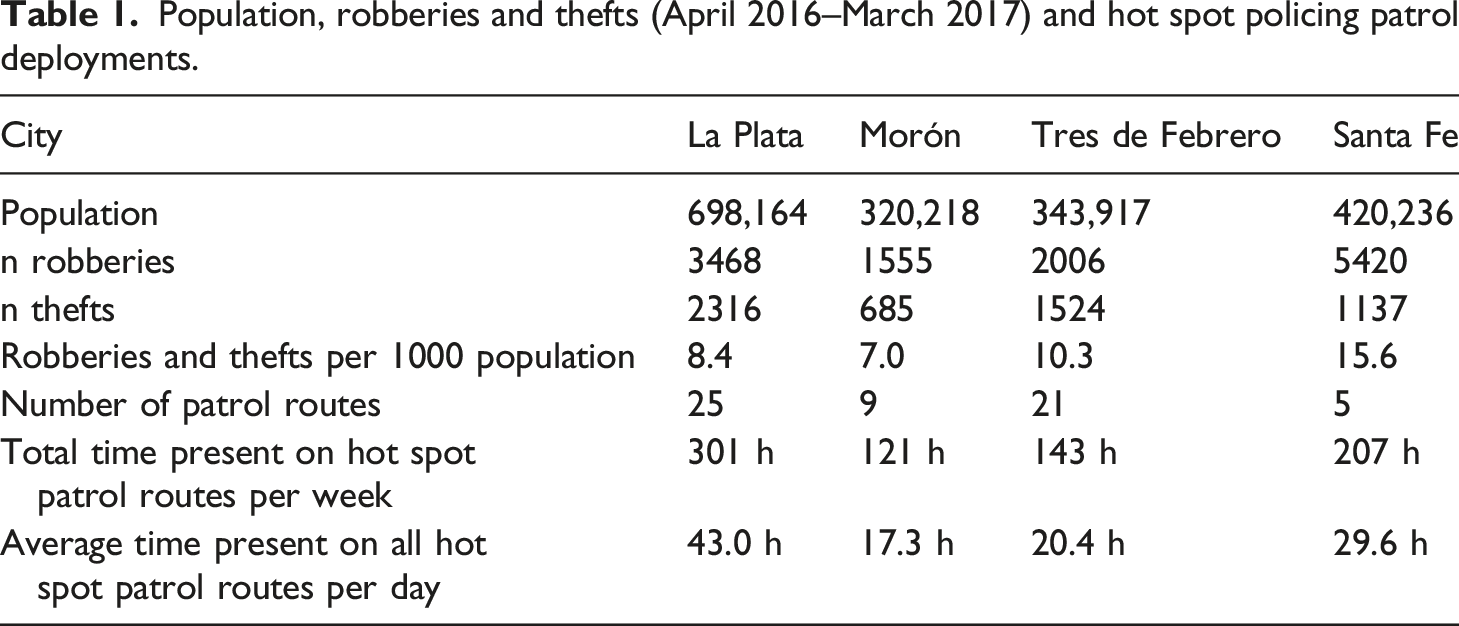
In 2017, a hot spot policing programme was introduced in four cities in Argentina: La Plata, Morón, Tres de Febrero and Santa Fe. These cities were chosen because of the interest of key stakeholders from these cities in trialling hot spot policing. La Plata, Morón and Tres de Febrero (located in the Province of Buenos Aires) have populations of about 700,000, 320,000 and 345,000, respectively. Santa Fe (in Santa Fe Province) has a population of about 420,000. Each intervention was oriented towards reducing robberies and thefts against pedestrians because of priorities to decrease these crimes in each city. An initial analysis of robbery and theft data 1 was conducted to identify the street segments in each city that cumulatively accounted for 25% of all robberies and thefts (following Weisburd’s (2015) method for identifying crime concentration). We refer to these street segments as hot segments. The Gi* statistic (Ord and Getis, 1995) was used to identify statistically significant clusters of robberies and thefts.
Foot patrols rather than patrols in vehicles were used for the programme in each city because this type of patrol was considered to be more suitable for preventing crimes against pedestrians. Patrol routes were drawn by researchers and police officers knowledgeable of each city to cover the hot segments. Often, these hot segments were not coterminous but were located close to each other. The Gi* analysis results were used to draw patrol routes that connected hot segments between streets that were within the areas of significant robbery and theft clustering, with the length of each patrol route being limited to include four to eight street segments. Figure 1 illustrates this process for an area in Morón showing the hot segments for robberies and thefts and the Gi* areas of significant clustering of these offences (Figure 1(a)). Figure 1(b) shows the patrol routes that were drawn using the analysis findings. The robbery and theft data for each patrol route were further examined to identify the day of the week and time of day when these crimes most occurred to determine when foot patrols should be deployed to the patrol routes. Visits were made to each patrol route to ensure they were safe areas for foot patrol. (a) Street segments that accounted for a high concentration of robberies and thefts and where these offences were significantly clustered and (b) proposed foot patrol routes.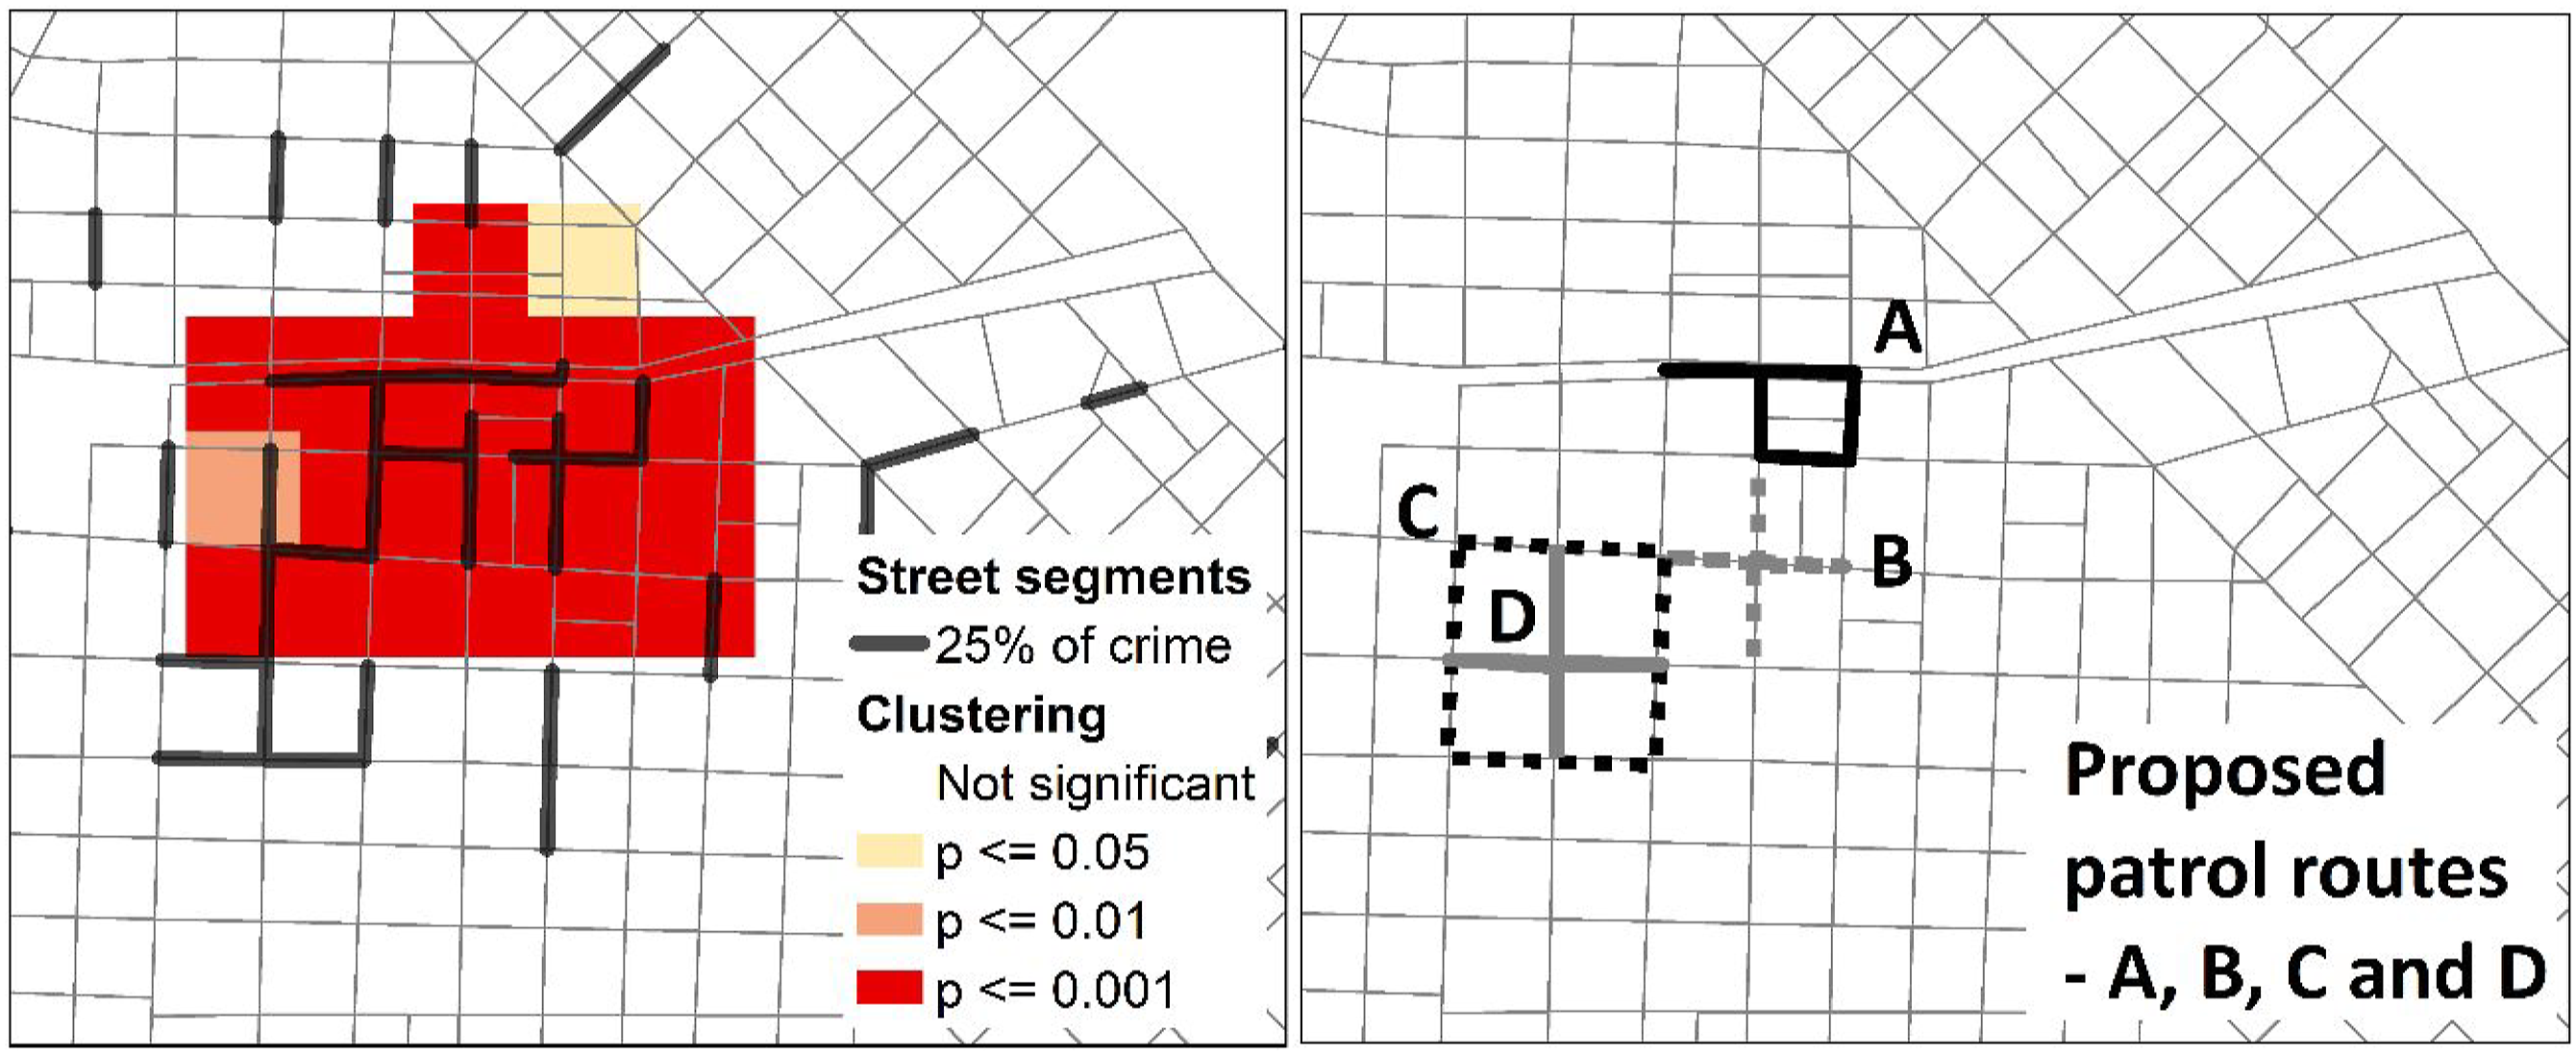
In La Plata, 25 hot spot patrol routes were created; in Tres de Febrero, 21 were created; nine patrol routes were created in Morón and five were created in Santa Fe. The differences in the number of patrol routes in each city were a reflection of city size and the concentration of robberies and thefts in each city. For example, in La Plata (the largest of the four cities) and Tres de Febrero, there were more robbery and theft hot spots than in the other two cities, but with these locations only being hot spots on certain days and at certain times. In Morón and Santa Fe, robberies and thefts were concentrated into a smaller number of hot spots, with high levels of crime persisting in these areas on many days of the week and for long durations of time. Hence, although fewer patrol routes were created in Morón and Santa Fe, these were visited more frequently and for longer than the routes in La Plata and Tres de Febrero.
In each city, police patrols consisted of a pair of police officers assigned to specific patrol routes. Patrol routes were organised into groups of two or three, with patrol pairs rotating between patrol routes in their group. For the duration of a hot spot policing assignment, each foot patrol spent 1 hour performing multiple circuits of a single patrol route and then walked to the next patrol area in the group where another patrol had been present. Figure 2 illustrates this process for a single group of three patrol routes in La Plata. The patrols were deployed for between two to 5 hours in most cases to each patrol route. Table 1 shows the average hours per day that were spent patrolling hot spots in each city, with the differences reflecting the number of crimes in city size. (a) Hot spot patrol routes in the Casco Urbano hot spot in La Plata and (b) the rotation route between each patrol. Population, robberies and thefts (April 2016–March 2017) and hot spot policing patrol deployments.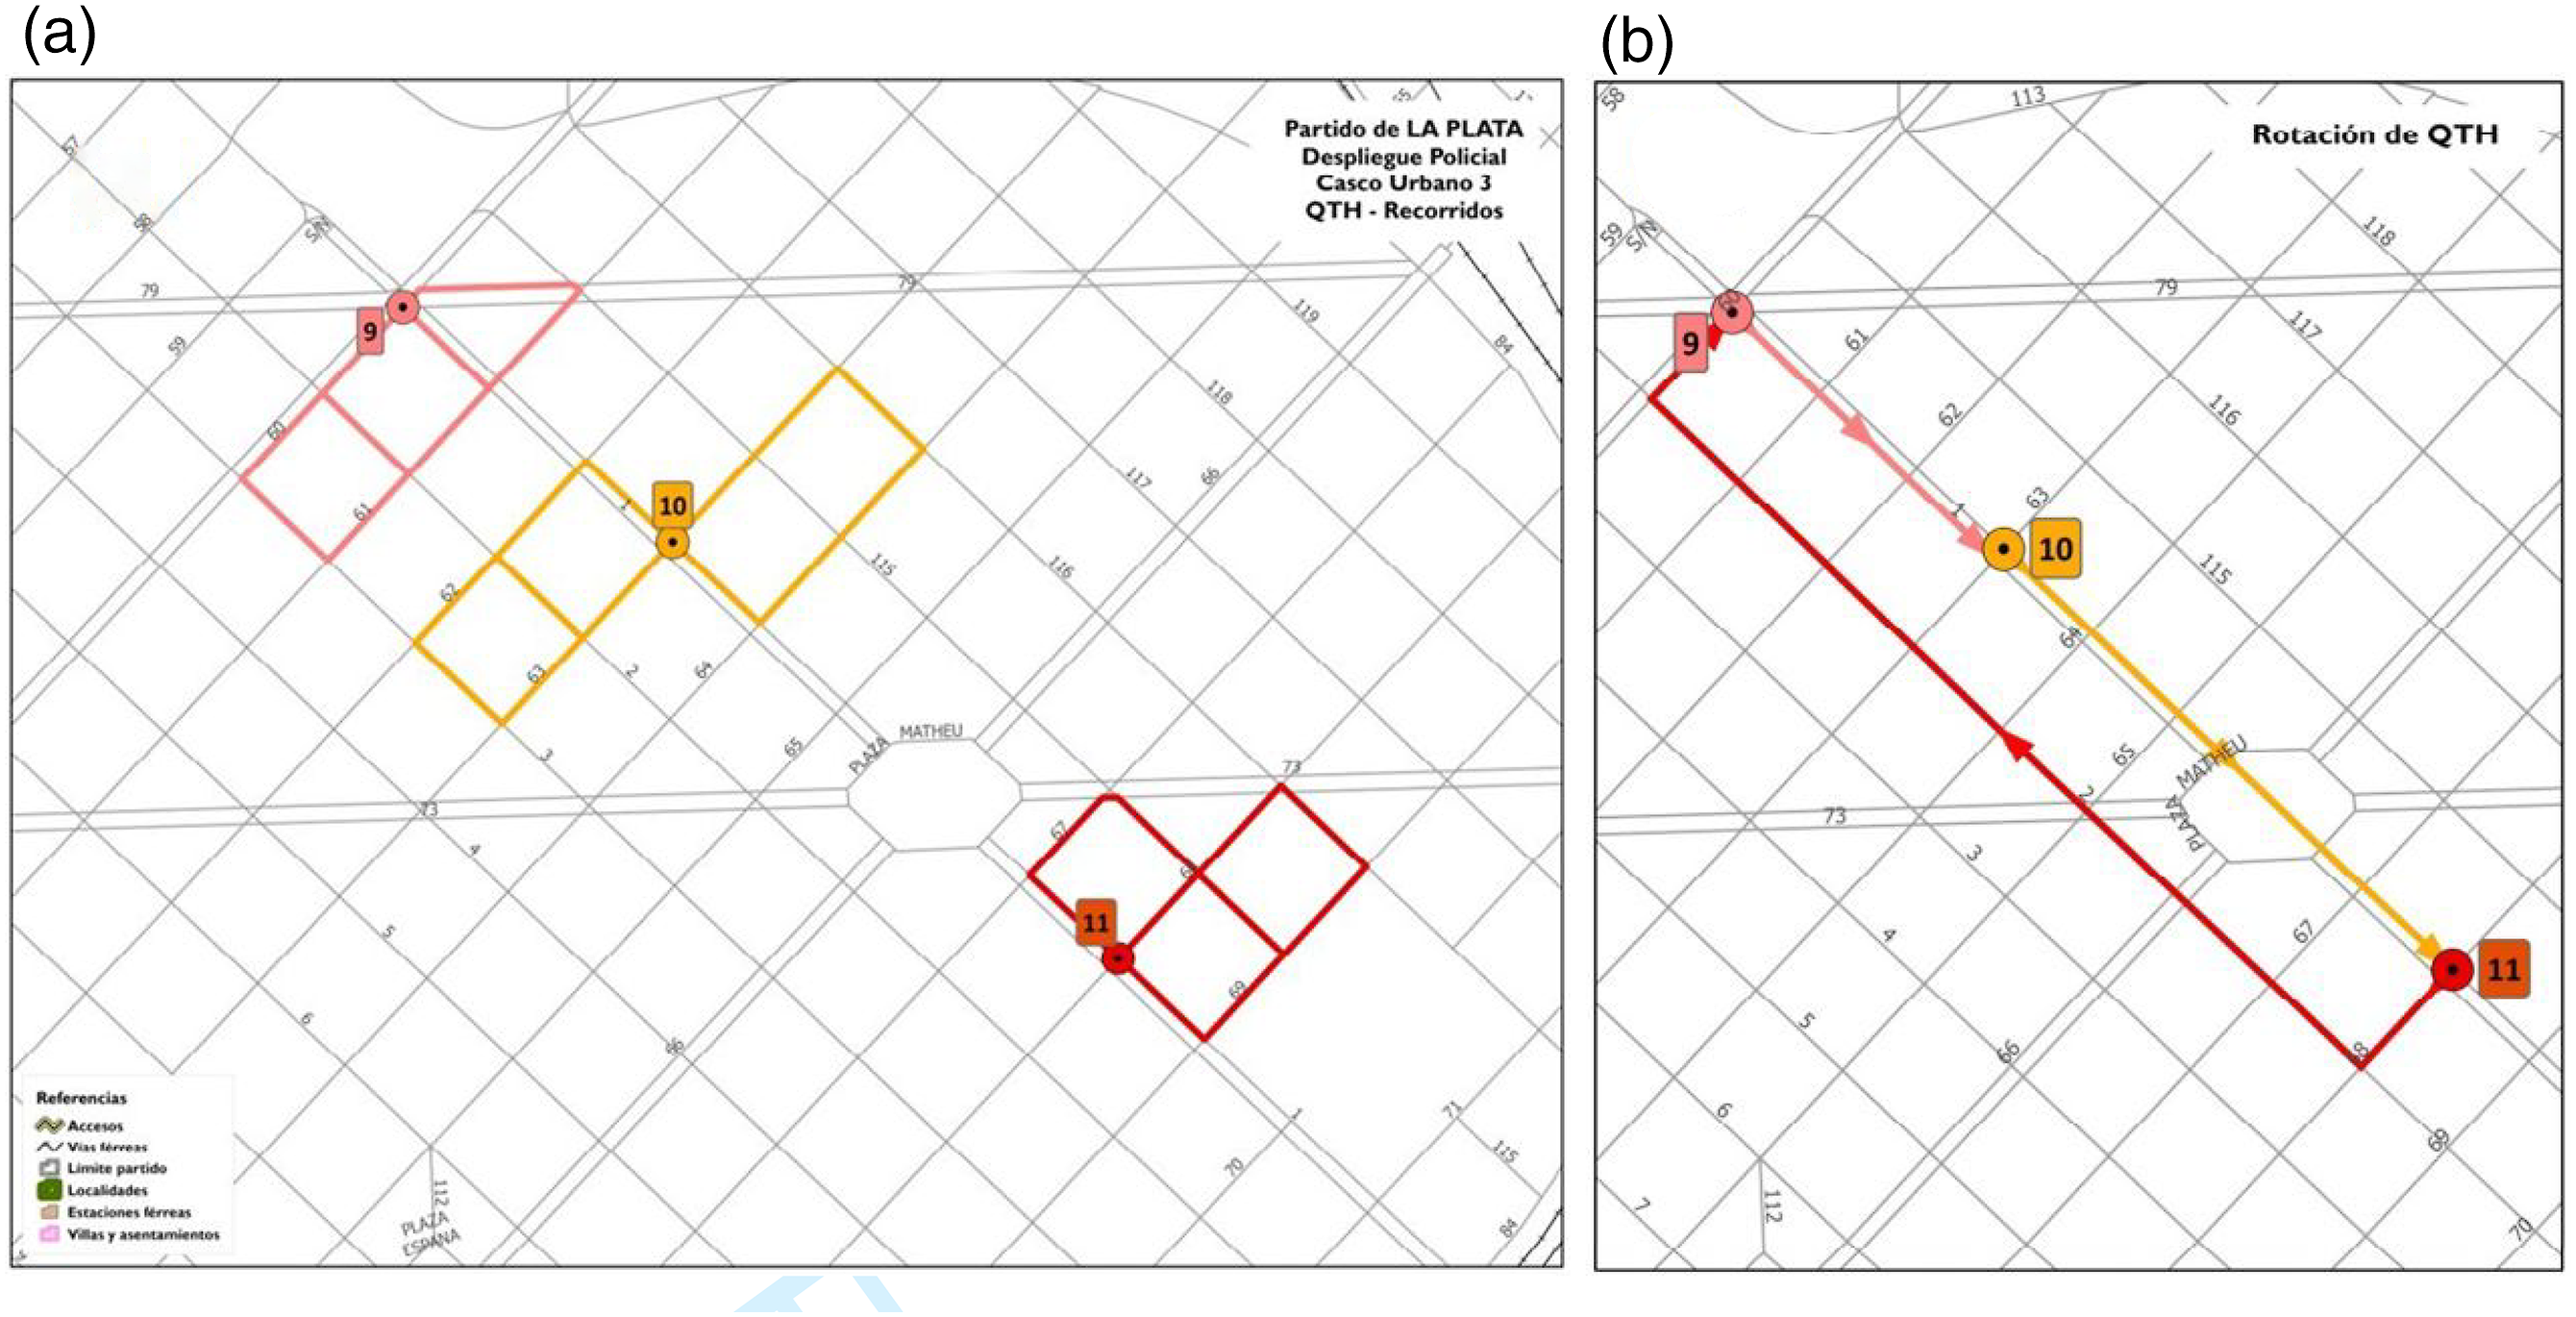
In the week prior to the implementation of each hot spot policing intervention, the police officers assigned to the intervention were trained in hot spot policing. The training explained the objectives of the interventions, discussed the patrol routes and prepared the patrol officers for what they were required to do while patrolling. This included explaining that the main objective of their patrols was for them to be visible in the areas where they were deployed. The officers were encouraged to talk to people while they were on patrol and to perform their law enforcement duties as normal (e.g. only to perform stops and frisks if there was reasonable suspicion to do so).
To date, studies that have examined the impact of hot spot policing have been about single study areas and have rarely commented on how the management of the programme could have impacted on the results. In our study, the process that was used to determine where, when and how many patrol routes were required in each city was the same, all patrol officers in each city received the same training and were deployed in the same way. This meant that the impact of the hot spot policing interventions could be compared and if differences were observed we could speculate on the reasons for this. We return to this topic in the discussion section. The interventions began on 1 October 2017, with the exception of Santa Fe, where delays in resource allocation meant the intervention began on 1 November 2017. Each city committed to operating the intervention for 6 months.
Data and methods
Panel datasets used for the evaluation.
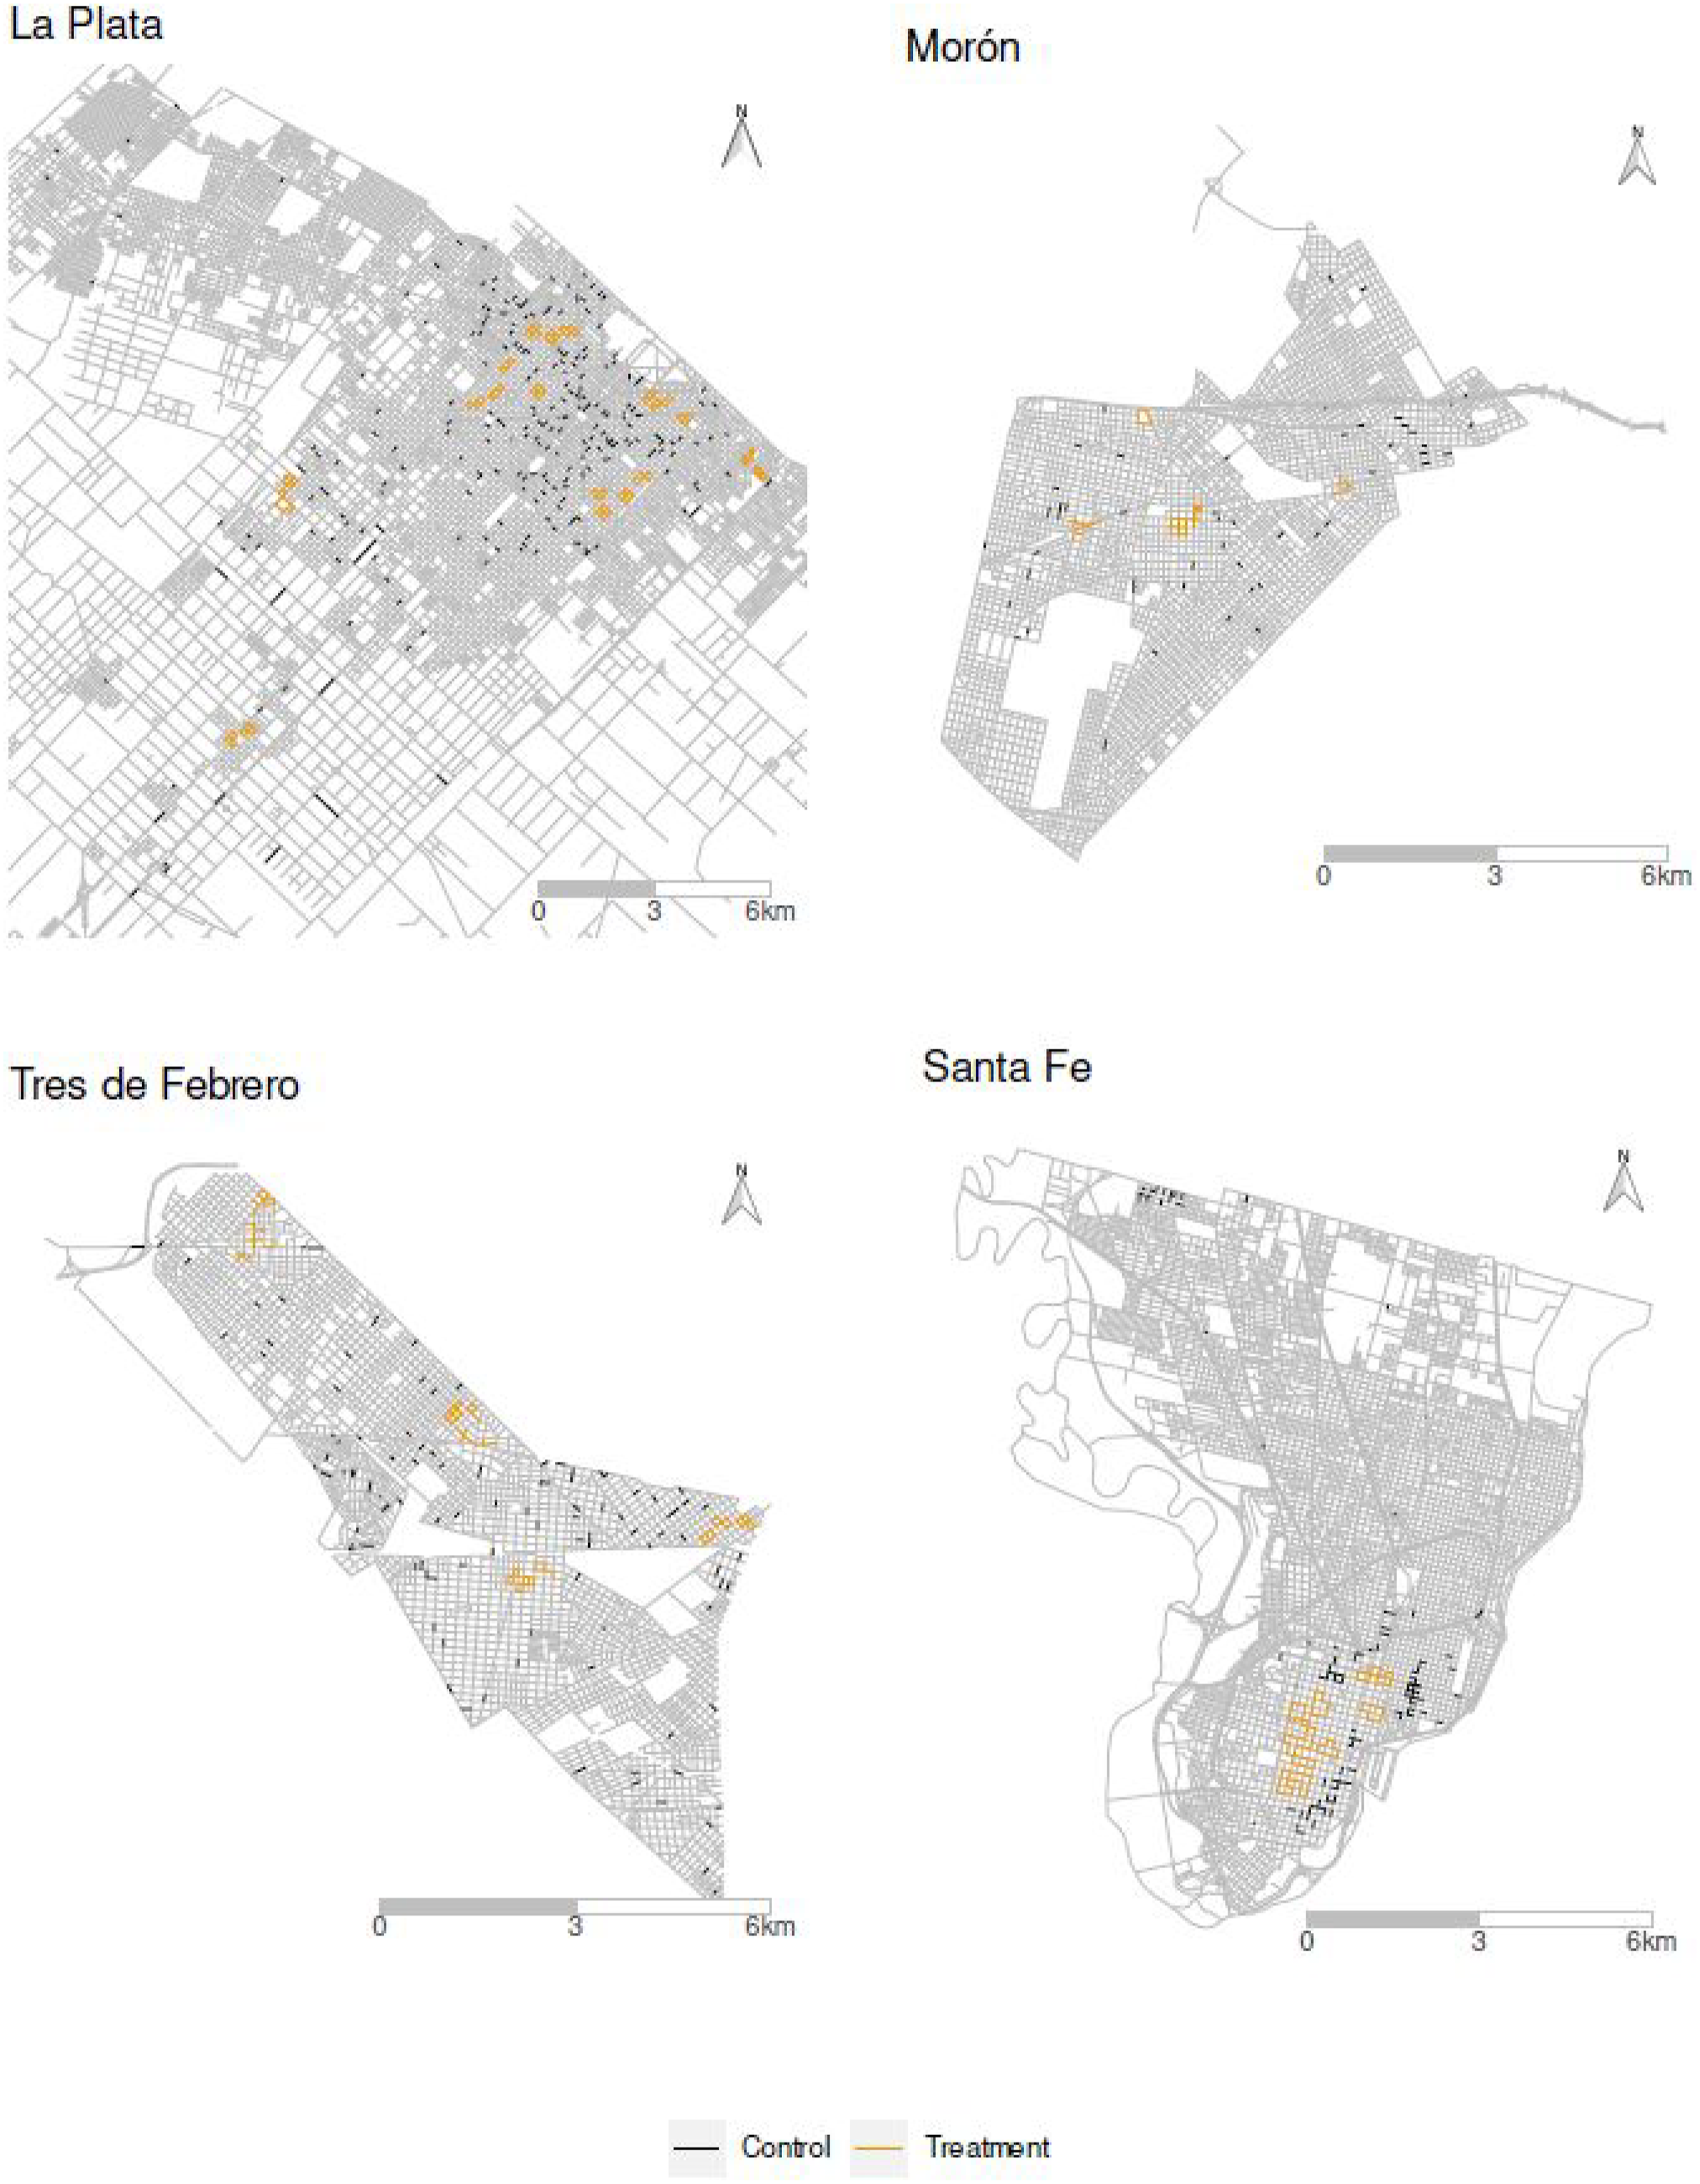
Treatment units and control units in each city.
Crime type displacement is an under-researched observation in hot spot policing (Weisburd and Telep, 2014). To examine crime type displacement, we also applied our methods to assaults and vehicle crimes. Assaults and vehicle crimes were chosen because these offences mainly occur in street settings (i.e. the settings where the police patrols were being implemented) and were crimes of high volume. We hypothesized that these types of crime would not be affected by the hot spot policing patrols in the treatment areas because they were likely to occur on specific street segments that were not covered or only partly covered by the police patrols and because they occurred at different times to robberies and thefts against pedestrians (and hence different times to when the patrols were present). Other high volume crimes such as thefts in shops were not included because these took place within buildings (and were less likely to be affected by street patrols) and low volume crimes such as sexual offences were not examined because of concerns of low statistical power. The analysis of assaults and vehicle crime in Santa Fe was not possible because of issues with data recording for these crime types.
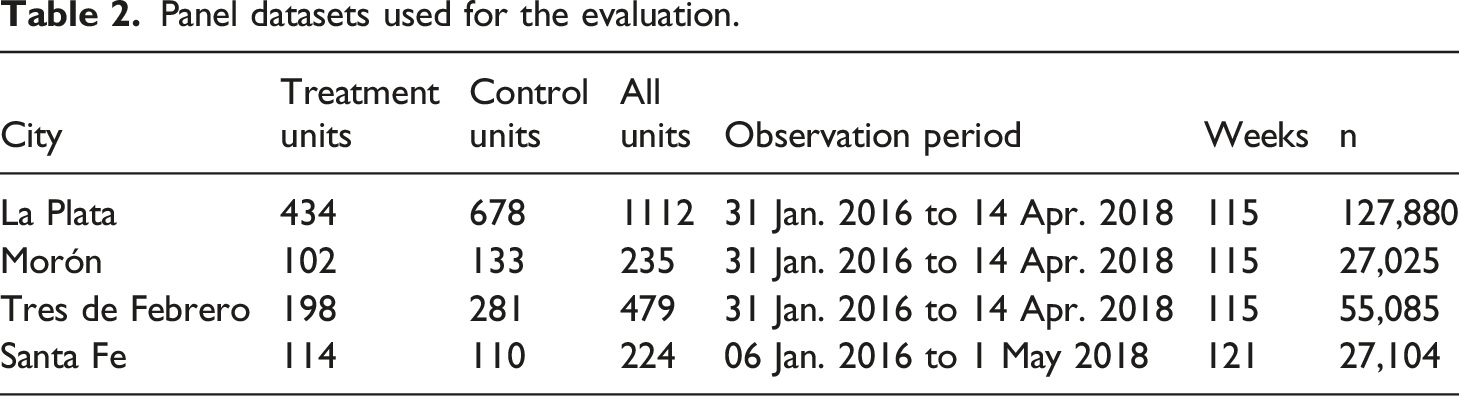
Weekly datasets were created for each treatment and control unit, and each crime type, aggregating counts of crime per unit with respect to the date before or from the start of the intervention. For example, for interventions that began on 1 October 2017, week 0 included crimes that took place between October 1 and 7, week 1 corresponded to October 8 to 14 and so on; week −1 corresponded to September 24 to 30, week −2 to September 17 to 23 and so on. The observation periods and the number of unit-time observations for each city is listed in Table 2.
Often, interventions can experience issues that may delay full implementation (Brown and Scott, 2007) and which in turn can affect the results on their impact. Interventions can also be subject to programme fatigue, with their impact decreasing over time (for an example see Chainey, 2021). To date, most studies of hot spot policing have examined the impact of these interventions for no more than 3 months, with only a few studies examining the longer term impact of hot spot policing (e.g. Koper et al., 2021). In the current study, we also examined differences in impact between the first 3 months and the second 3 months of each intervention.
The WDD Z statistic is defined as follows (equation (1))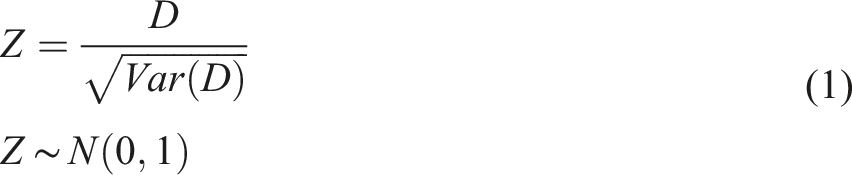
We implemented the DID regression as a growth curve model (Mirman, 2017; Singer and Willett, 2003) of unit-level crime levels with time-specific errors. The model for the mean event count for every unit 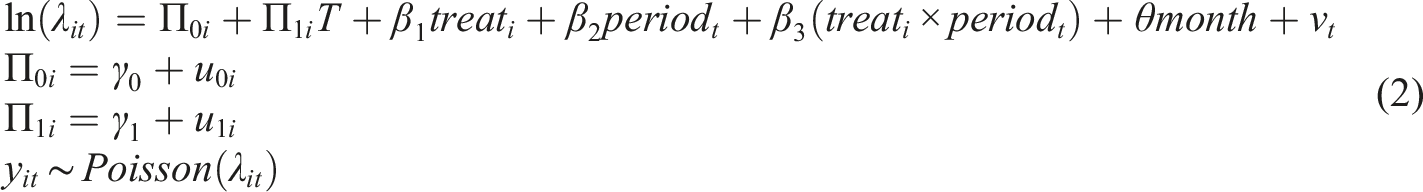
The presence of the
Modelling of crime data usually violates distributional assumptions of ordinary least squares, as crimes are discrete counts with a lower bound of zero. Thus, count data models are usually preferred. We used a standard Poisson model (Cameron and Trivedi, 2013) as the data did not exhibit overdispersion. Count models usually employ a log-link, which means that interpreting the DID estimator requires exponentiating
The DID growth curve model with time-specific errors sought to exhaustively control for sources of heterogeneity at the unit and time level to mitigate potential sources of confounding. However, this model was not suitable for all cities and crimes because it was overparametrised. Thus, we also estimated a simpler specification of the growth curve model without random slopes (i.e. excluding the
Considering that the four interventions were also a collective programme for examining the use and impact of hot spot policing in Argentina, we used fixed effects meta-analysis to pool the DID estimators from all cities (Rydberg et al., 2018). To ensure this, pooling of DID estimators was valid we conducted moderator tests to assess whether there were significant differences between cities and crime types in the overall effects. The meta-analyses were conducted using the ‘metafor’ package (Viechtbauer, 2010) for R.
For hypothesis testing of the treatment effect, we set the critical threshold at
Results
Change in crime and WDD Z statistic results
Figure 4 shows how crimes in the four cities changed before and during the intervention period. The plots show that the weekly incidence of crime for some cities was quite low, with many observations with zero counts. This meant that potential decreases in crime incidence per unit-time were likely to be limited by a floor effect because crime counts cannot be negative. Weekly counts of crime during the study period for all cities, with LOESS smooth trend. Vertical dotted lines indicate the start of the intervention. Shaded areas represent the pre and post periods used in the Z difference test statistic.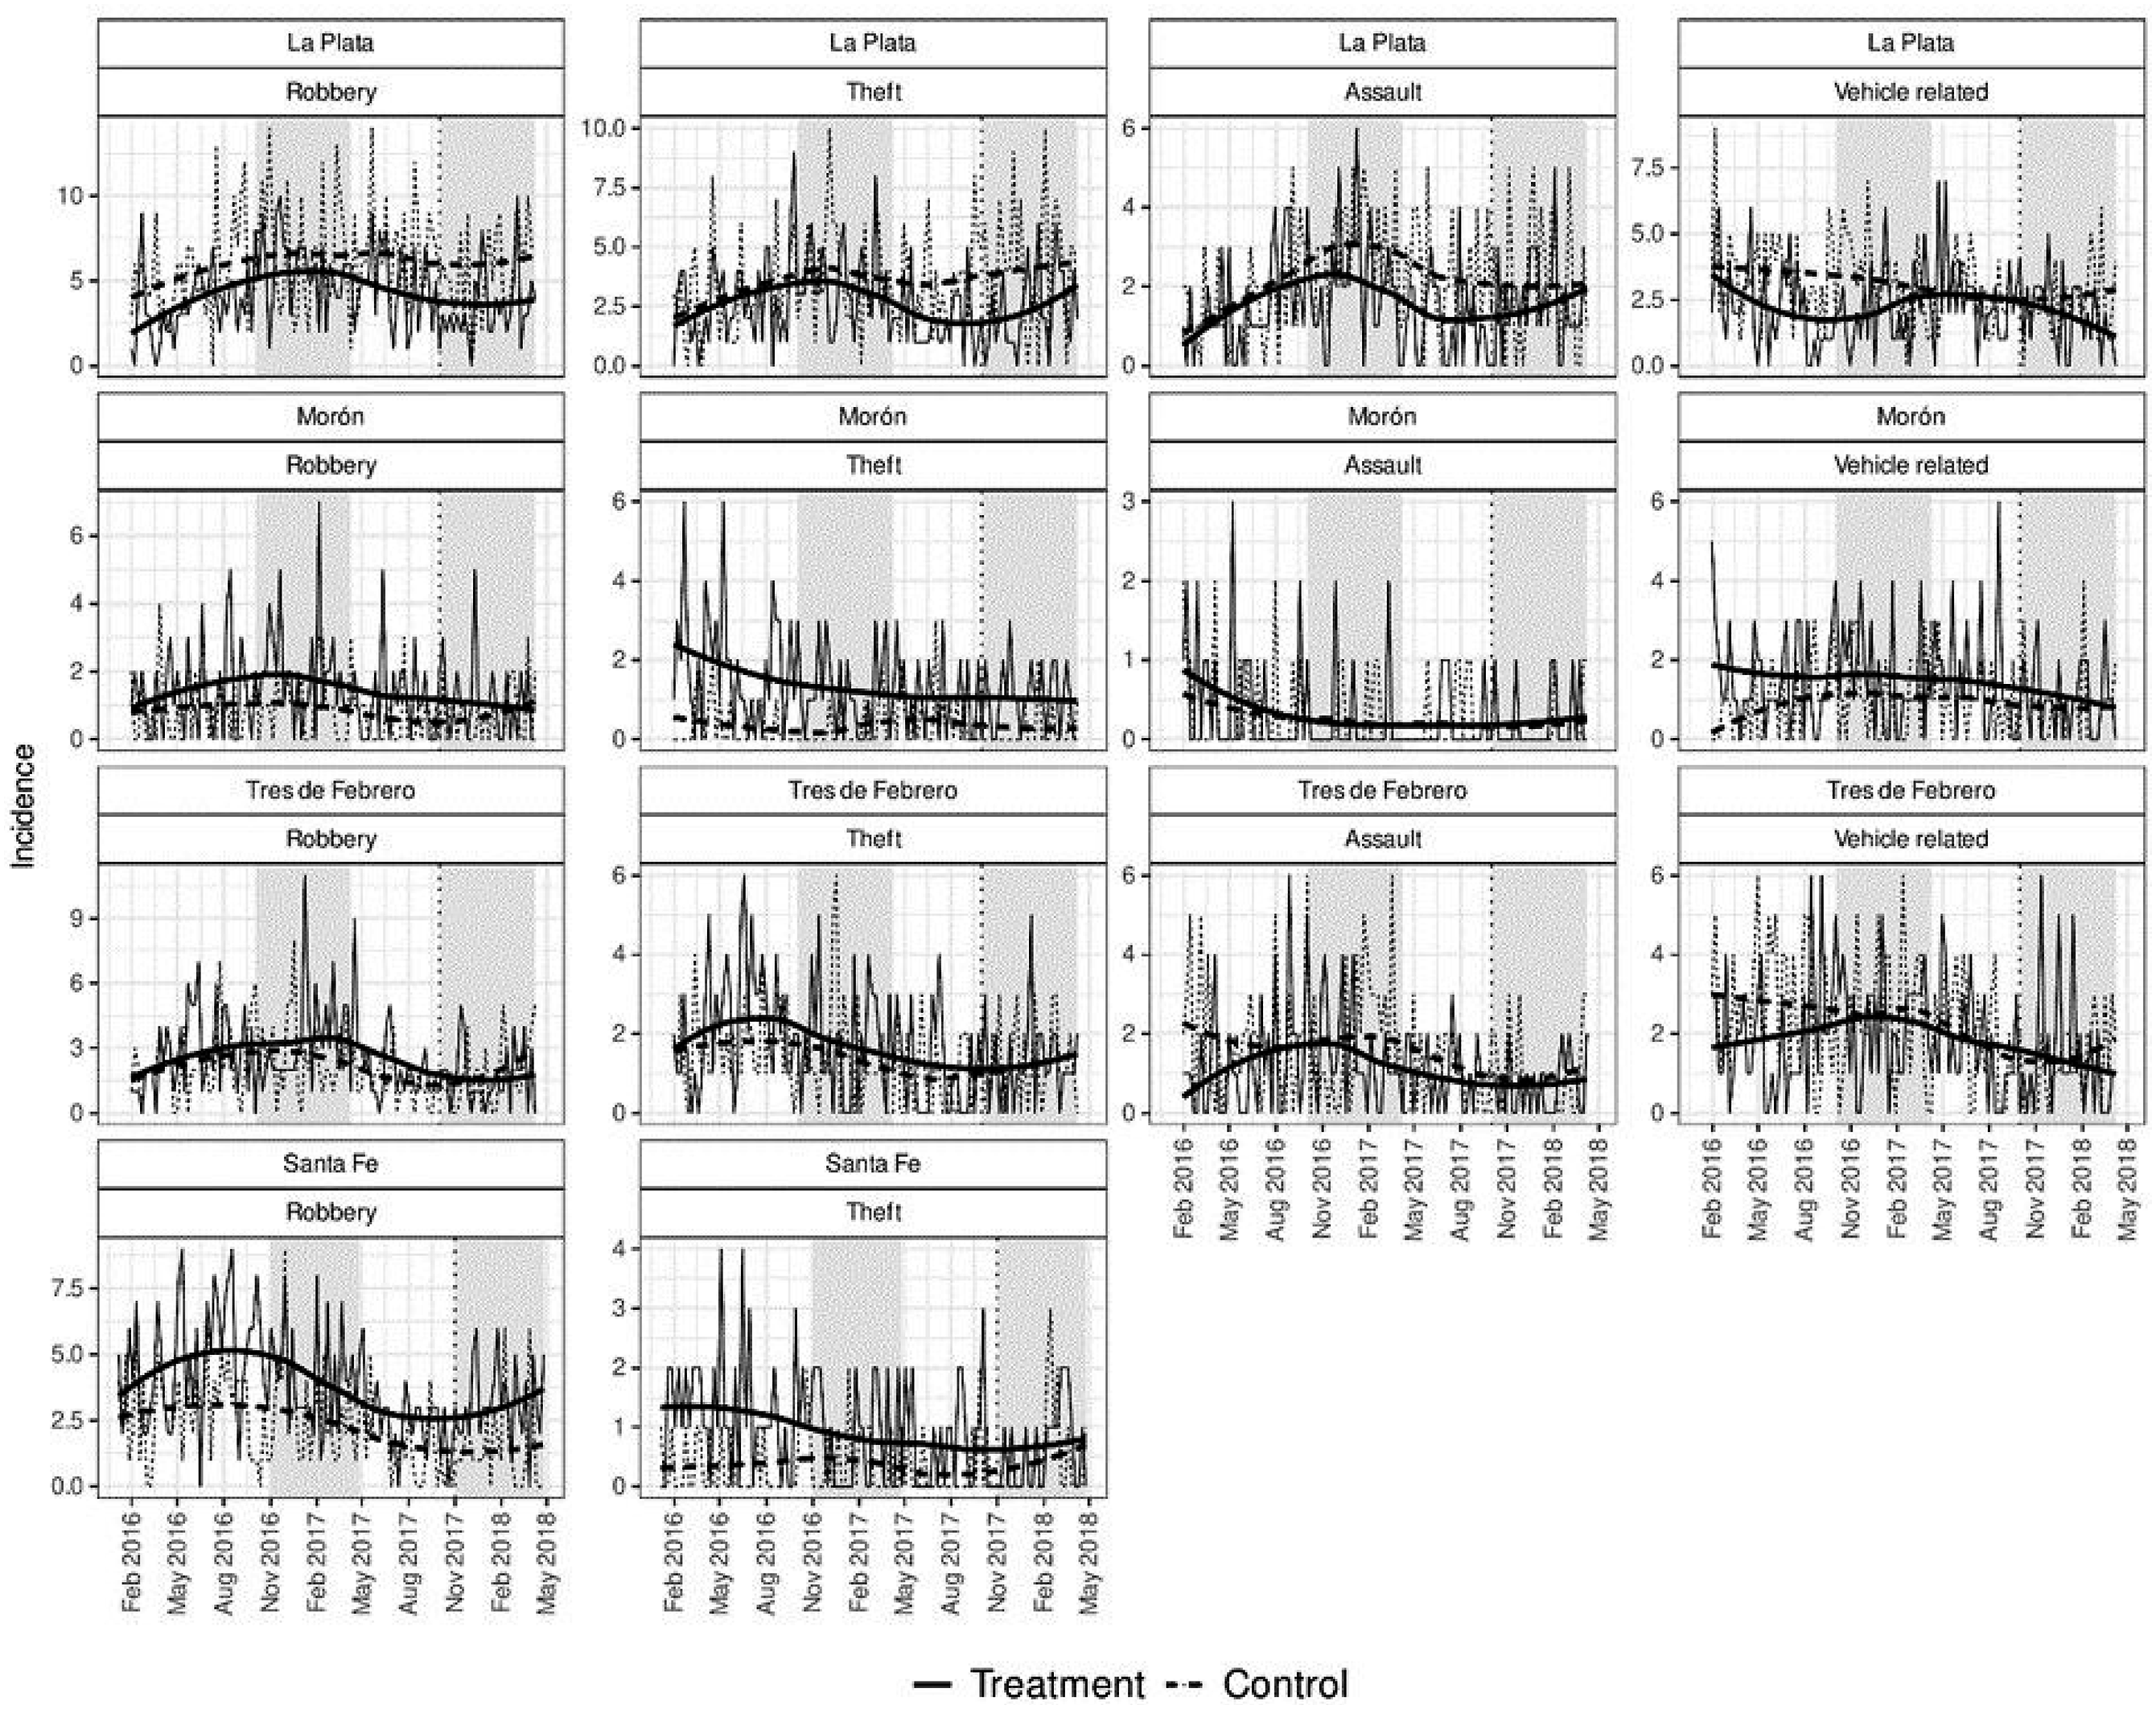
Changes in crime in treatment and control units, between pre and post intervention periods.
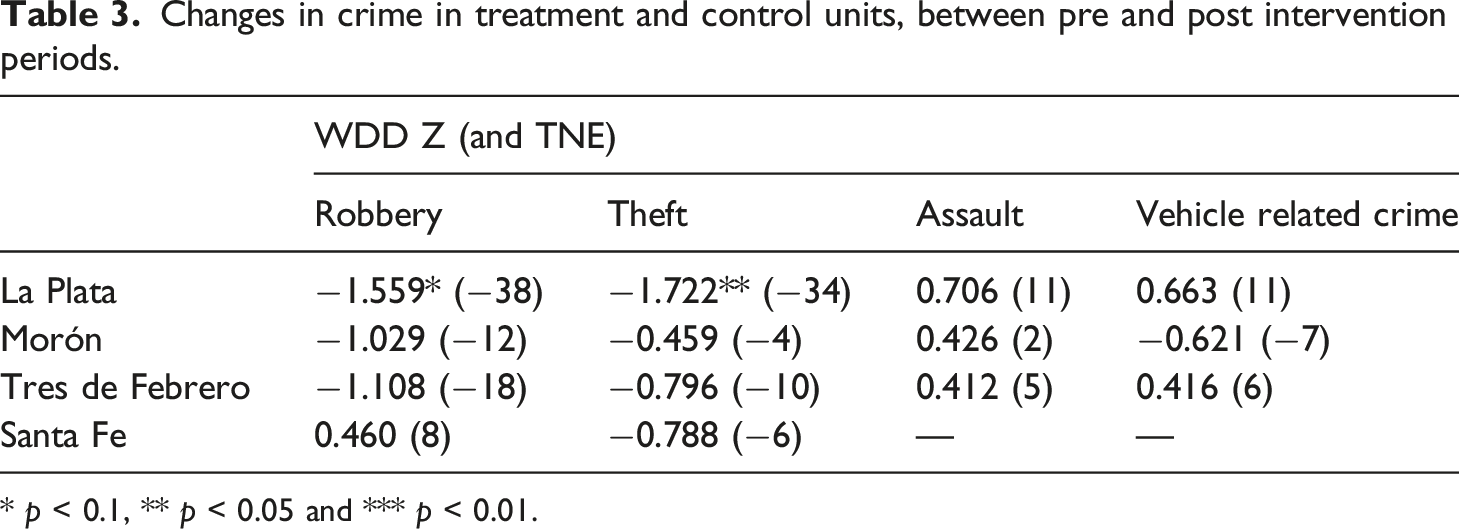
* p < 0.1, ** p < 0.05 and *** p < 0.01.
Changes in crime between first half of pre- and post-intervention periods.
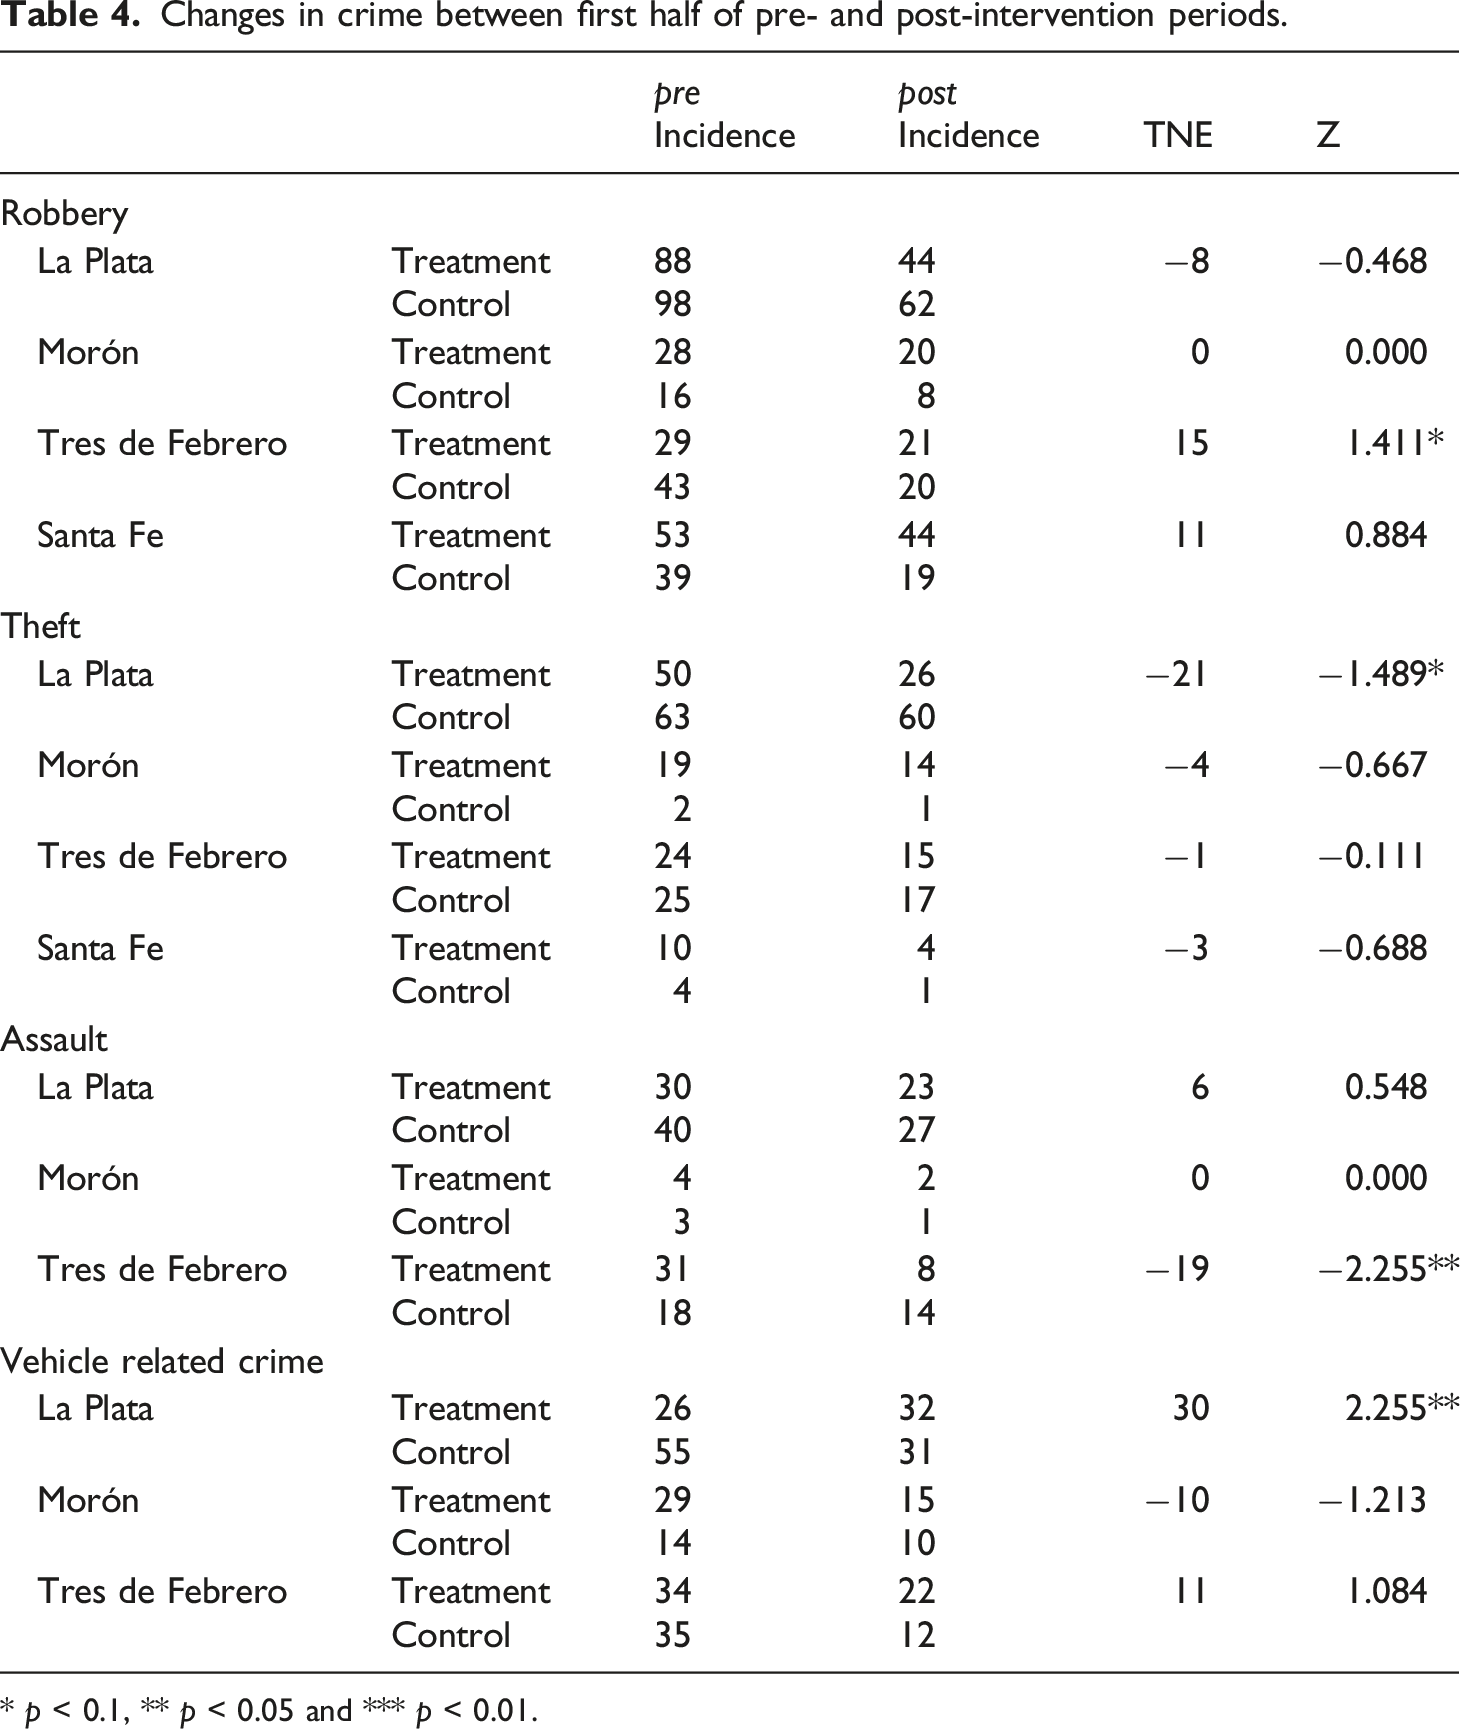
* p < 0.1, ** p < 0.05 and *** p < 0.01.
Changes in crime between second half of pre- and post-intervention periods.
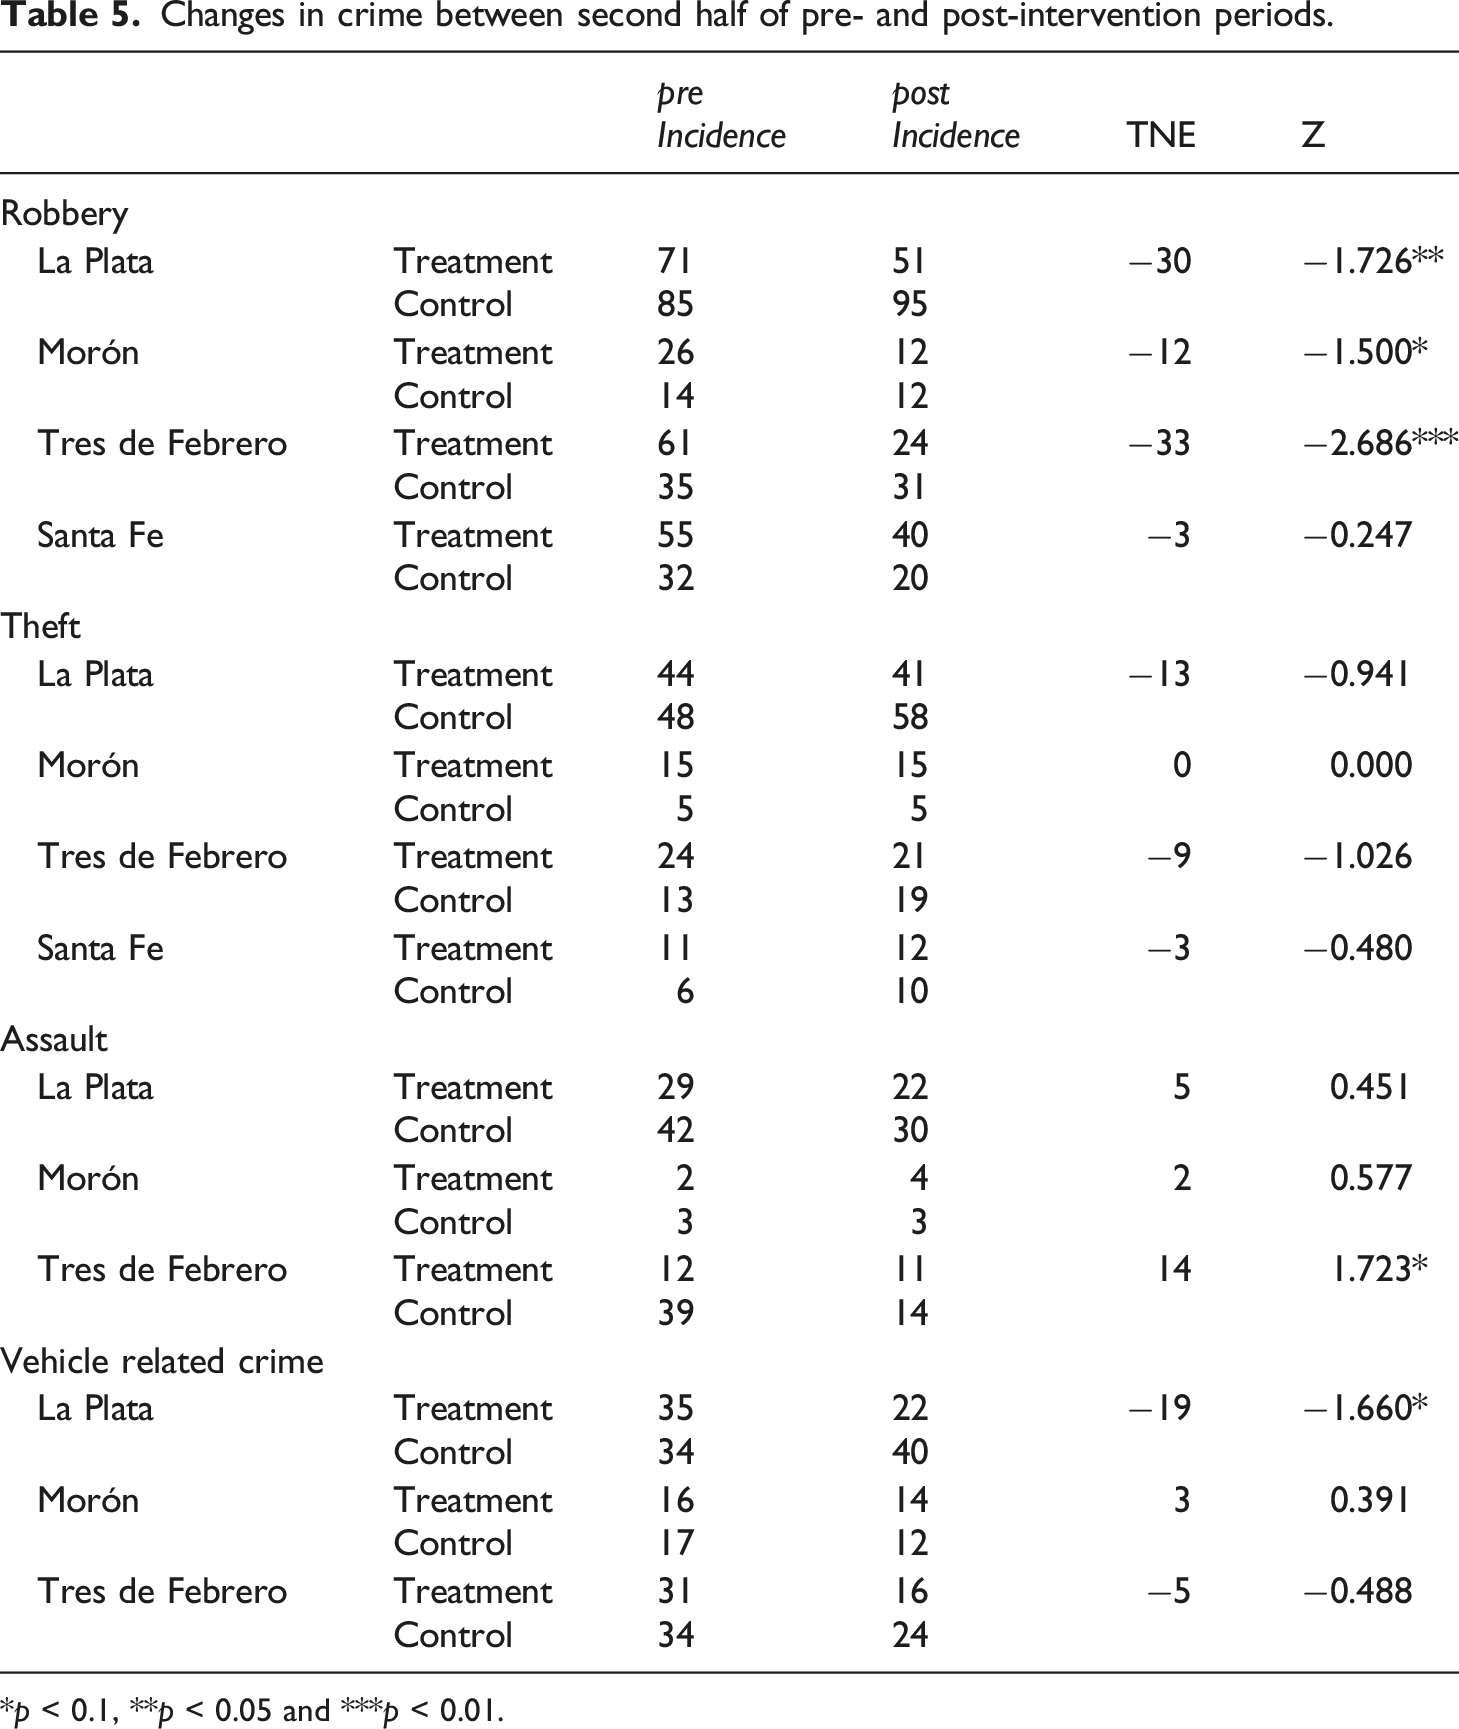
*p < 0.1, **p < 0.05 and ***p < 0.01.
There was a mix of increases and decreases in assaults in each city during the first and second halves of the interventions, but these changes were only significant for the decreases in assaults in Tres de Febrero during the first half, and for the increase in assaults in the same city during the second half of the intervention. Changes in vehicle crimes were not significant in any of the cities for either halves of the intervention period, except in La Plata where a significant increase was experienced in the first half and a significant decrease was experienced during the second half.
Difference-in-differences estimates
The results for the goodness of fit statistics for the growth curve models were significantly better than intercept-only models. 4 Approximately half of the models fitted used our preferred specification with unit random intercepts and slopes, while the other half used unit random intercepts only as random slopes were not significant.
Figure 5 shows the DID estimates (indicated as IRR values) and meta-analyses for the complete 6-month intervention period. For robbery, the IRR value for La Plata was 0.79 (suggesting a 21% decrease in robbery in the treatment areas while controlling for all other variables), for Morón was 0.93 and in Tres de Febrero was 0.75 but none of these decreases were significant.
5
In Santa Fe, the IRR was 1.35 suggesting an increase in robberies; however, this result was not significant. For theft, the overall results across the four cities were for decreases (of between 49% and 18%); however, none of the changes were significant. When pooling robberies and thefts across all four cities, the fixed effects (FE) estimate was 0.86 and significant with no significant differences between the cities, suggesting that the hot spot policing programme across the four cities was responsible for a significant 14% decrease in robbery and theft. Results for assaults and vehicle crime suggested there was neither a displacement nor diffusion of benefits effect to these crime types over the intervention period. Difference-in-differences estimates and meta-analysis for the complete intervention period.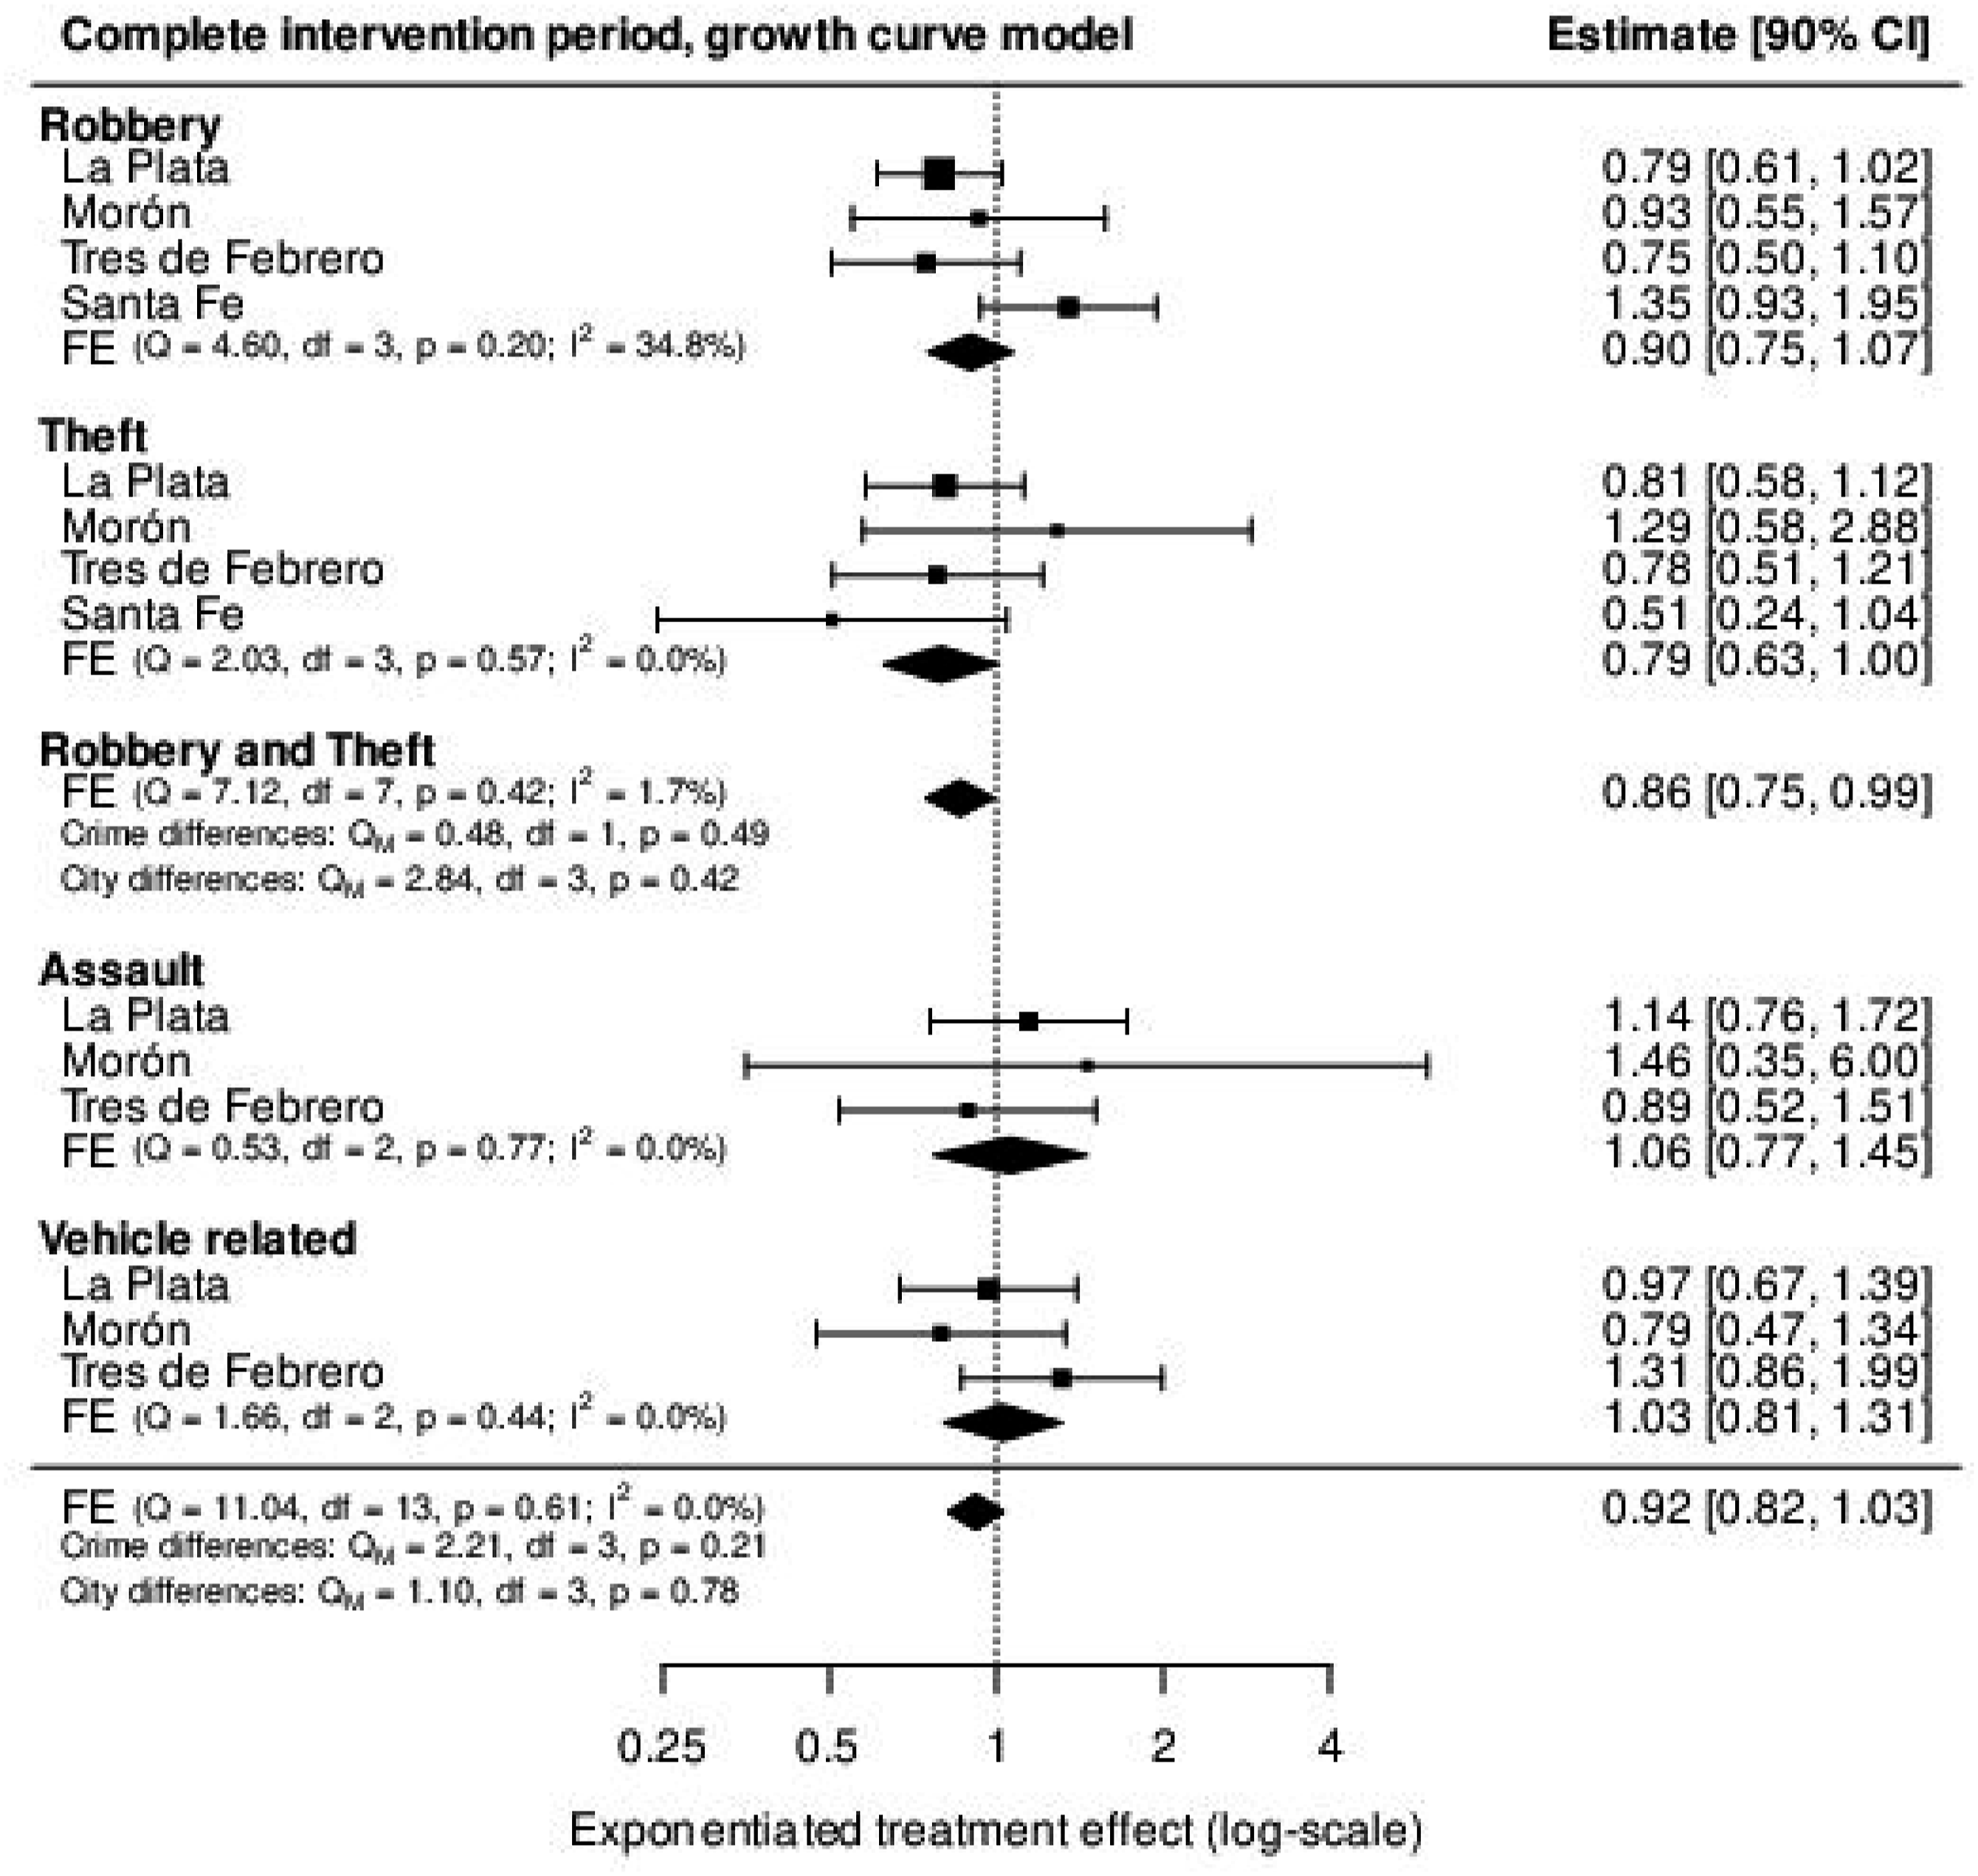
Figure 6 shows the DID results for the first half of the intervention period. Decreases in robbery were observed in La Plata and Tres de Febrero and increases in Morón and Santa Fe; however, none of these results were significant. The robbery decrease in Tres de Febrero was different to that observed from this city’s WDD Z result (that indicated an increase) because the DID method controlled for trends in crime prior to the intervention. Thefts significantly decreased by 39% in La Plata during the first half of the intervention. Changes in thefts were not significant in the three other cities for this period; however, similar to the DID results for robbery, increases in theft were observed in Morón and Santa Fe whereas decreases were observed in Tres de Febrero. City and pooled estimates for assaults and vehicle crime were not significant with the exception of Tres de Febrero where a significant 128% increase in vehicle crime was observed. Difference-in-differences estimates and meta-analysis for the first half of the intervention period.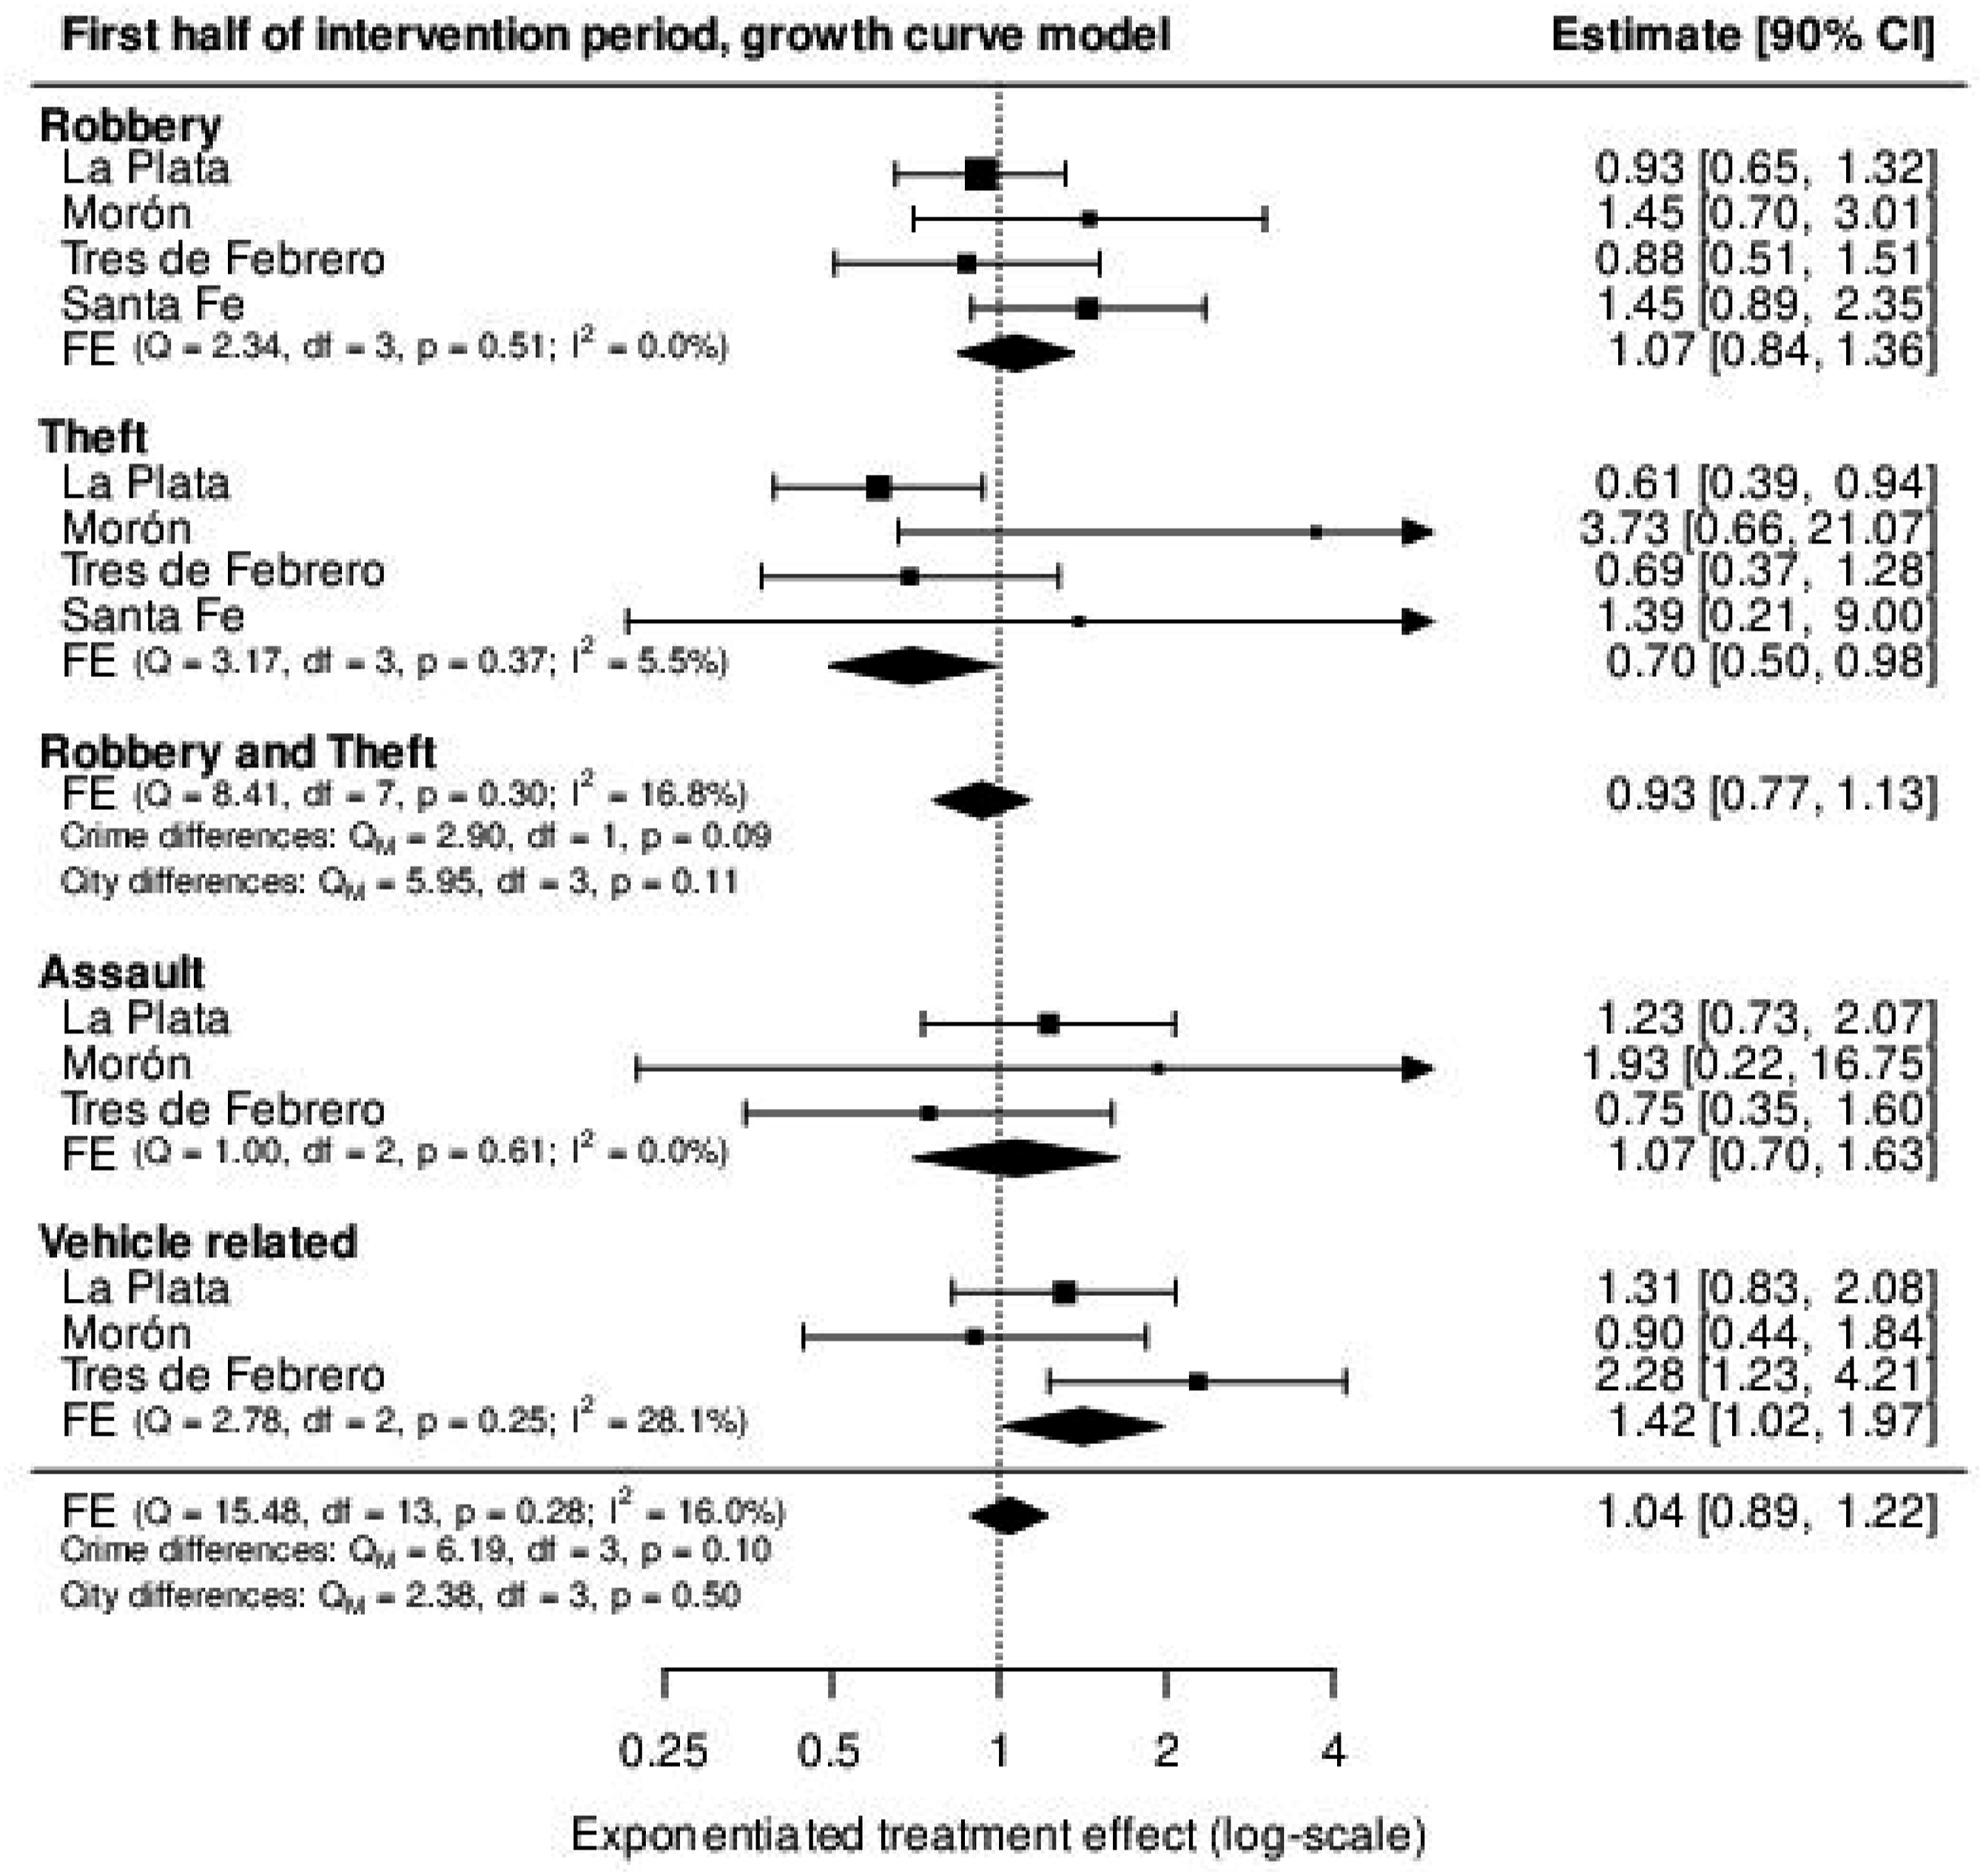
Figure 7 shows the DID results for the second half of the intervention period. None of the city level results were significant, except for La Plata where a significant 31% decrease in robbery was observed and in Santa Fe where a significant 58% decrease in thefts was observed. Most results for robbery and theft in each city suggested decreases in these crimes, with the FE estimate suggesting the hot spot policing programme had an overall effect of decreasing robberies and thefts by a significant 20% during the second half of the intervention. City and pooled estimates for assaults and vehicle crimes for the second half of the intervention were not significant. Difference-in-differences estimates and meta-analysis for the second half of the intervention period.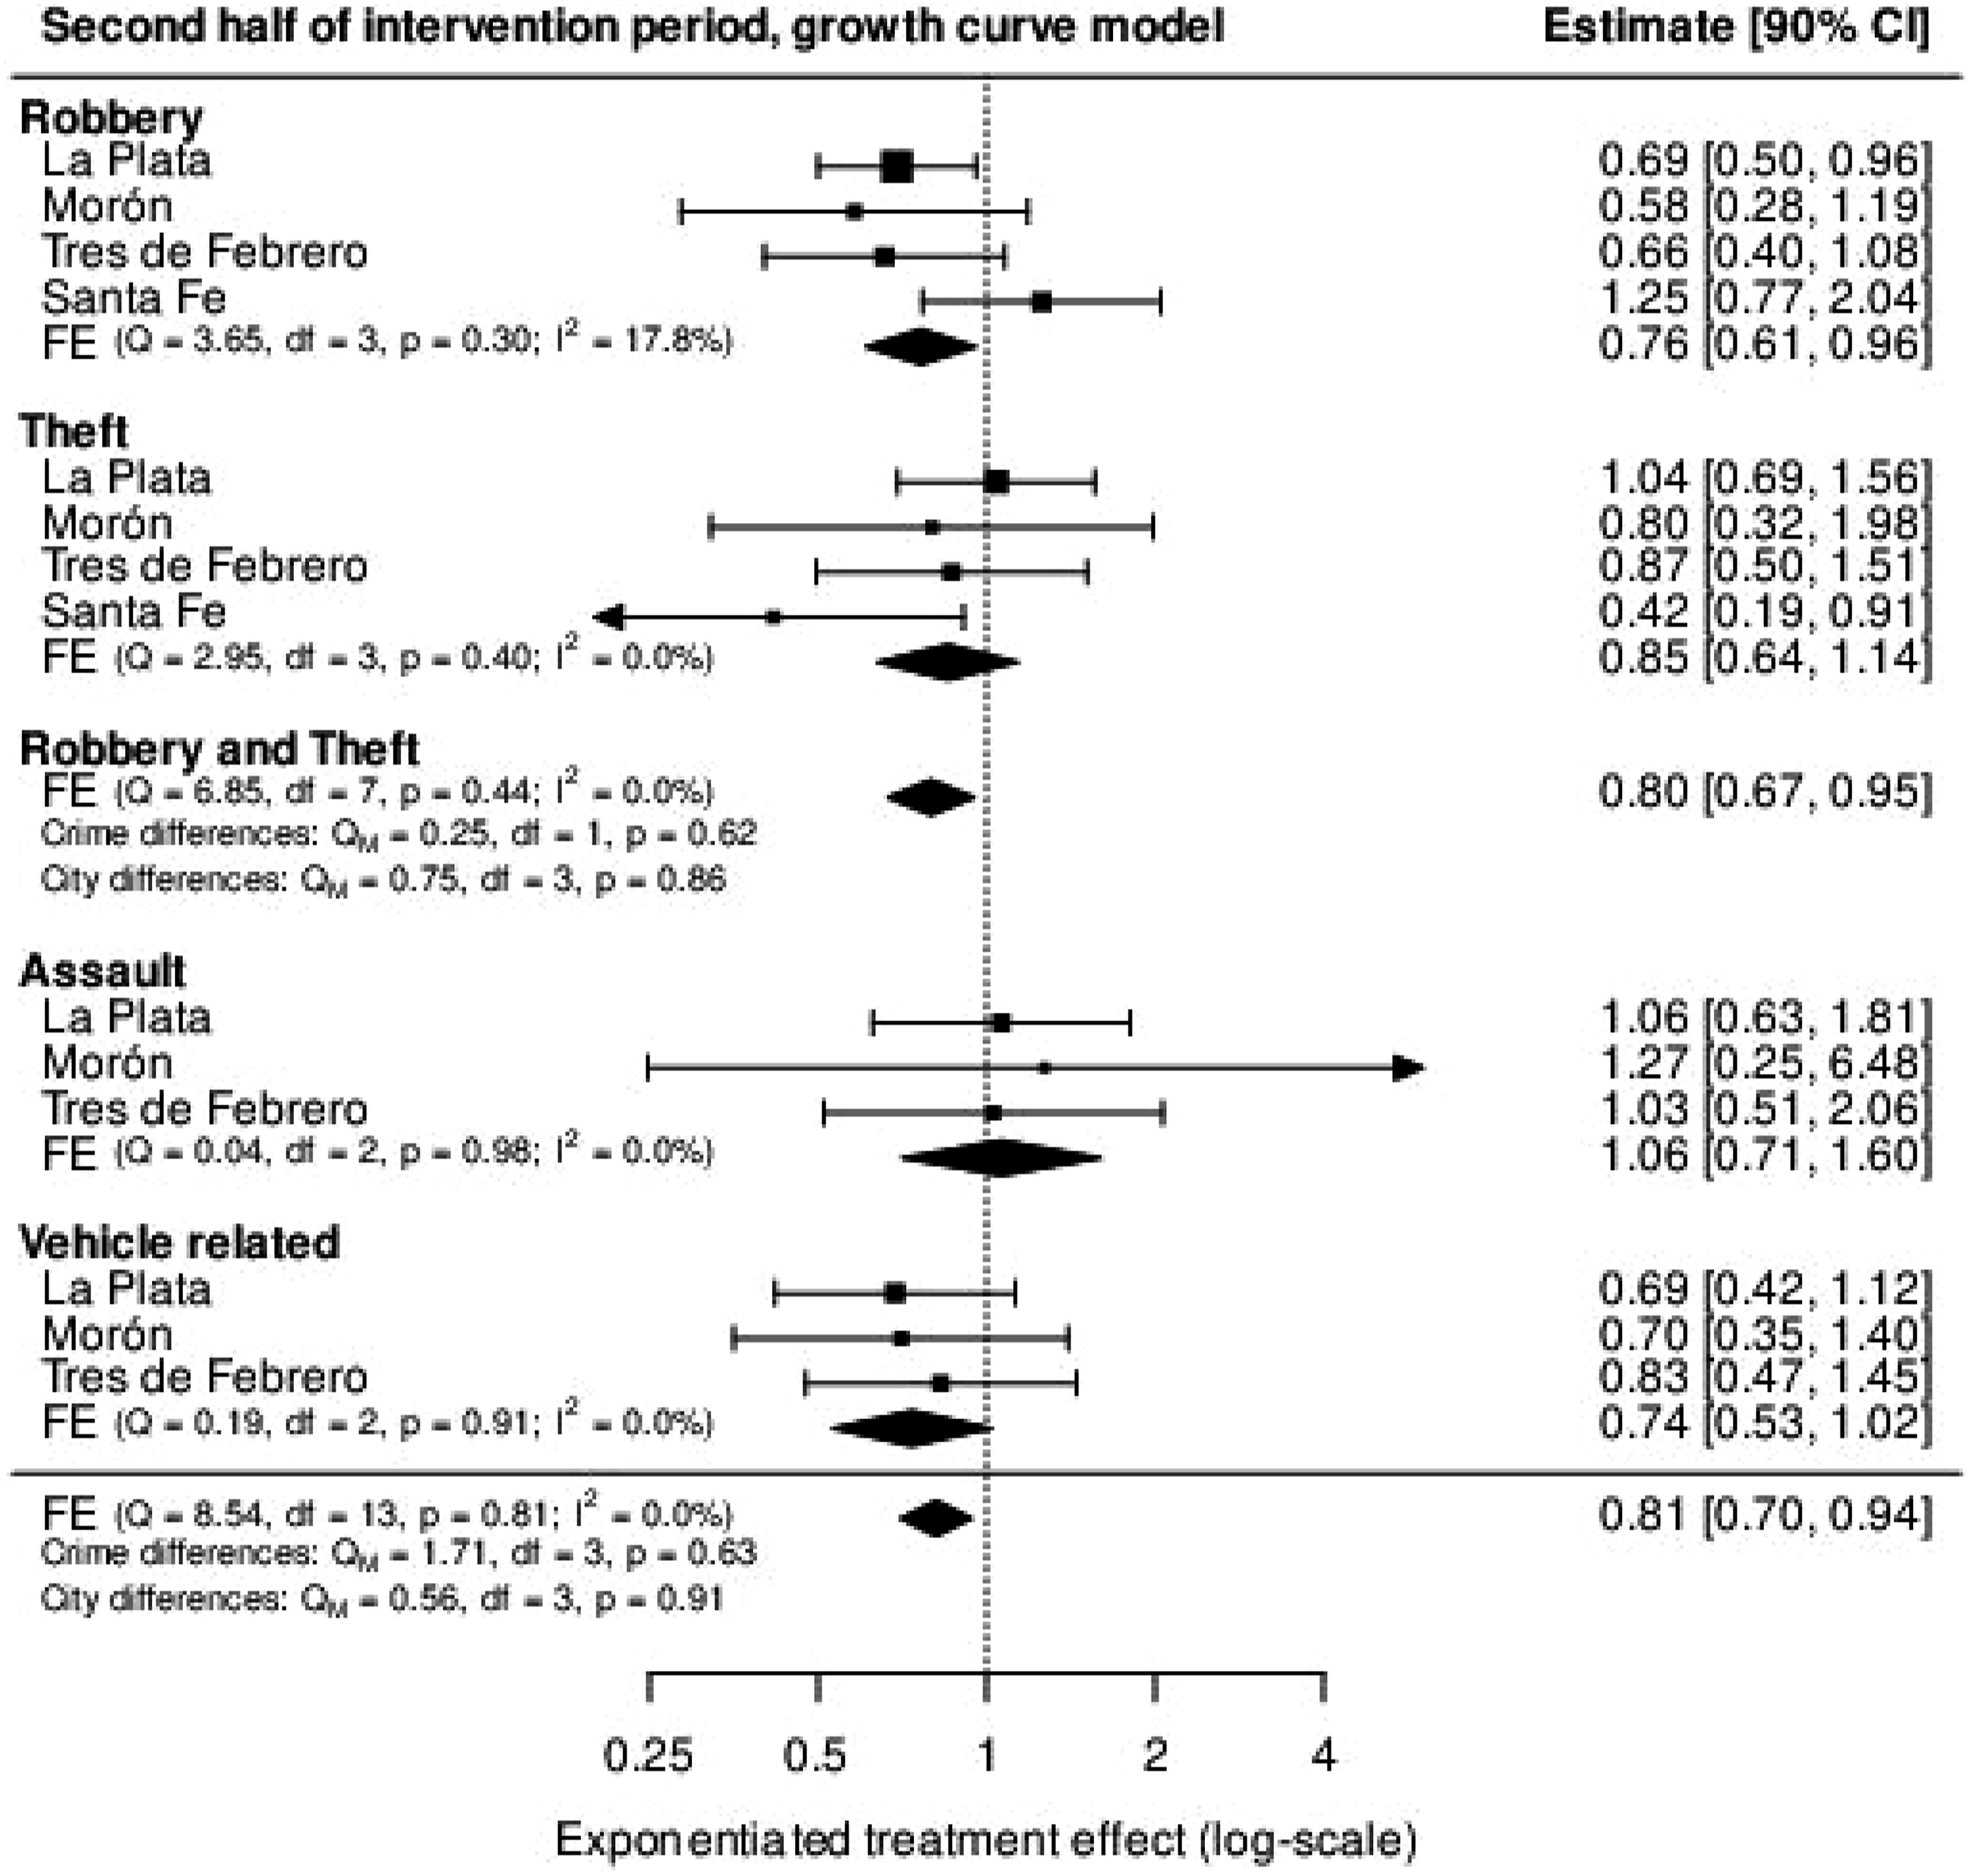
Discussion of results and programme implementation review
The impact of the hot spot policing interventions in the Argentinian cities of La Plata, Morón, Santa Fe and Tres de Febrero was mixed. Although all cities experienced some net decreases in robberies or thefts in hot spot policing treatment areas, the results were only significant in some cities and for specific periods during the 6-month interventions. La Plata experienced the largest decreases, including a significant 31% decrease in robbery during the second half of the intervention (adding to decreases, albeit not significant, from the first half of the intervention), and a significant 39% decrease in theft during the first half of the intervention. Morón experienced increases in robbery and theft during the first half of the intervention (when trends prior to the intervention had been controlled for) but then experienced decreases in these offences during the second half of the intervention. In Tres de Febrero, decreases in robberies and thefts were observed in each half of the intervention period but these results were not significant. Santa Fe experienced some of the smallest effects from the intervention. Across the programme’s full duration, there was no significant change in the level of assaults or vehicle crime, suggesting the hot spot policing interventions did not cause any crime type displacement nor a diffusion of benefit effect to these types of crime.
Santa Fe was the city that implemented the fewest number of hot spot patrol routes, with only five patrol routes compared to 25 in La Plata. In Santa Fe, these patrol routes received policing patrols for multiple durations on most days of the week (e.g. 3 hours in the morning, an afternoon patrol and a night-time patrol). In La Plata, each hot spot patrol route received patrols for shorter periods and often only on certain days of the week (e.g. Thursdays, Fridays and Saturdays, between 22:00 and 02:00). The patrol deployment in La Plata was more similar to the crackdown-backoff rotation strategy for hot spot policing patrols suggested by Sherman (1990), and as a result may have contributed to the better impact of the intervention in La Plata. Determining optimal hot spot policing patrol dosage in settings that experience higher crime levels to those from which the 15 min per hour dosage was proposed by Koper (1995) is a recommended area for further research.
As part of the implementation of the hot spot policing interventions, each intervention received project management oversight by a team of independent researchers. The researchers performed site visits to each city to observe the interventions, attended monthly meetings with representatives from each city before and during the interventions and used a systematic note taking process to capture details about each intervention. Impact evaluations often overlook how the implementation of an intervention affects the results. Process evaluation aims to determine whether the activities that constitute the parts of an intervention were implemented as planned. A hot spot policing intervention can require significant project management, including the resourcing of police patrols assigned to hot spot patrol duties and supervision of these patrols to ensure they comply with patrol route deployment. If the processes involved in the implementation of a hot spot policing intervention are not reviewed, it can be difficult to determine whether the implementation of the intervention affected its impact.
Although a full process evaluation was not conducted for each city’s hot spot policing intervention, we determined that the notes that were recorded by the researchers could be used to compare the implementation of each intervention. Naturally, process evaluations involve a level of subjectivity because they draw upon observations and experiences of implementation. However, when observations and experiences of different interventions are captured in the same routine manner, comparisons can be made between different interventions (Eck, 2017). The researchers’ notes were organized into three categories: programme planning, programme implementation and programme monitoring. The programme planning category captured information about the commitment of key stakeholders to the programme, the quality of analysis to determine hot spots and control areas and if sufficient patrol and supporting personnel resources were dedicated to the programme. The programme implementation category captured information about whether the hot spot policing patrols were implemented as planned, whether the patrol officers were provided with sufficient briefing about the purpose of the patrols and whether supervision resources were dedicated to patrol deployment. Information on programme monitoring included whether adjustments were made when necessary (e.g. replacement of personnel because of sick leave), whether routine monitoring of crime levels was conducted and if patrol deployment was being monitored by supervisors to ensure compliance with route assignments. We then coded this information using a four-point scale to grade the quality of the activities performed under each category: high quality (score = 3), medium quality (2), low quality (1) and non-existent (0).
Programme planning, implementation and monitoring in each city based on coding of notes taken before and during the interventions.
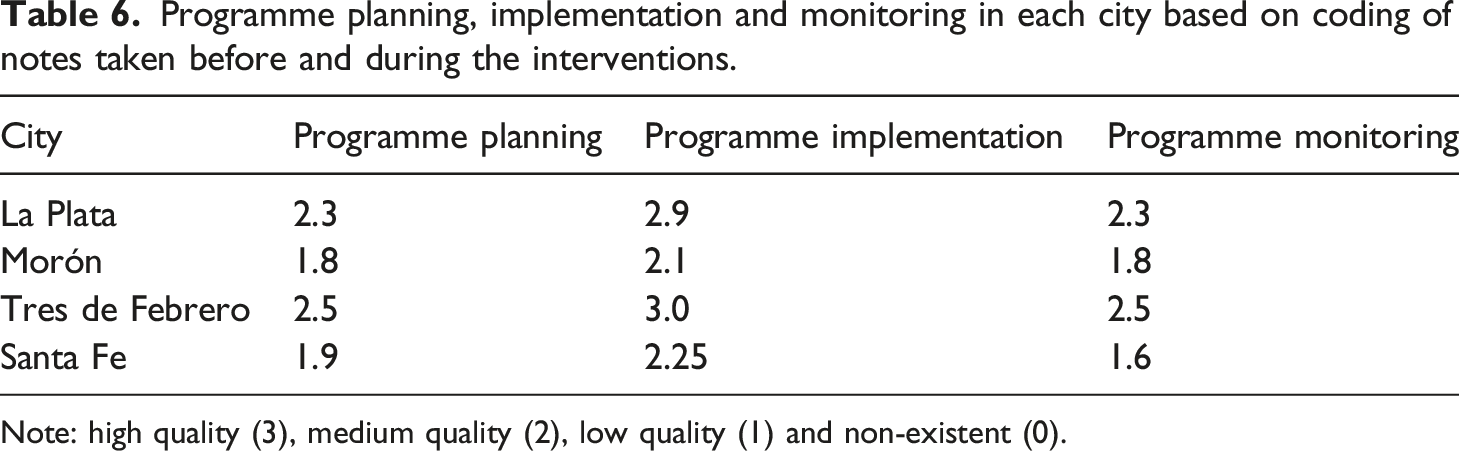
Note: high quality (3), medium quality (2), low quality (1) and non-existent (0).
Process evaluations are useful instruments for assessing how an intervention was implemented, but are retrospective, are not used as routine and do not assist those responsible for intervention implementation while the intervention is active. Although simple and open to issues of subjectivity, the measurement of project management of the four hot spot policing interventions was useful for revealing differences in the operation of each and why certain cities were more successful with their interventions than others. We propose the use of a qualitative implementation assessment tool that builds on the simple measure we report on above for use while an intervention is active and assists in the intervention’s design and project management. Data recorded using this tool can then be used to improve the overall evaluation of a crime reduction intervention. We are aware of similar tools used in implementation management research and have drawn from this discipline to design a qualitative implementation assessment tool that is to be trialed in new hot spot policing interventions.
The four city hot spot policing programme was a trial to introduce authorities in Argentina to new approaches for decreasing crime in preparation for a larger national programme on improving police effectiveness. 6 As a direct result of the current study, hot spot policing programmes have been implemented in over 20 other cities in Argentina, a new Crime Analysis Department has been created and hot spot policing is now taught on the Leadership and Strategic Command Course at the police command school.
Limitations
Early in the programme, it was decided that the research team and representatives from each city would carry out the impact evaluation jointly – with the objective of strengthening the evaluation skills of the agencies involved. La Plata, Morón and Tres de Febrero used a statistical matching approach to select controls, whereas Santa Fe used an approach based on crime data and expert judgement. Although this means that our confidence in the robustness of Santa Fe’s results is weaker, the modelling approach used mitigates these shortcomings. The use of random intercepts and slopes (where applicable) captured unobserved heterogeneity at the unit level, mitigating confounding to an extent. Furthermore, the slopes of fixed effects are unlikely to be severely affected when selection biases occur at the cluster level (Grilli and Rampichini, 2005), as was the case for Santa Fe.
The parallel trends assumption was met for all combinations of cities and crime types, except for thefts and vehicle crimes in La Plata. This means that the estimated effects for these crimes in La Plata were likely to be overestimated. This assumption can be difficult to meet for all crime types in evaluations of crime reduction interventions because of the phenomenon of crime concentration (Chainey et al., 2020), but can be mitigated by using a randomized control experimental approach. This approach was not used because the stakeholders involved in each city wanted all the proposed patrol routes to receive attention, rather than deploying patrols to only areas that were selected at random.
Our study examined the geographic displacement of crime to control areas rather than to areas that surrounded where patrols were deployed because of concerns with intervention contamination. Studies of hot spot policing suggest that rather than displacement occurring to neighbouring areas, a diffusion of benefit effect is often observed. This may have been the case with each intervention because of the rotation routes that patrols took between patrol routes, and hence the impact of the interventions may have been underestimated.
A common concern with evaluations of targeted interventions is low statistical power. Our analysis results may be underpowered for three reasons. First, the true effect size of hot spot policing interventions is likely to be small (Braga and Weisburd, 2020). Small effect sizes are harder to detect, and thus studies with low power are more likely to fail to reject a false null hypothesis of no effect of the intervention (Weisburd and Britt 2014). Second, sample sizes were generally small. Small effect sizes require larger samples to detect significant results; thus, the small number of units contributed to low power. Third, crime counts for some crime types and cities were low. Low counts are affected by a floor effect (Hinkle et al., 2013; McCleary and Musheno, 1981), meaning that for some crime types there was little scope for decreases in crime. We addressed low power by combining our results using fixed effects meta-analysis and by using a 90% confidence level for our inferences. While the latter increases the risk of falsely rejecting a true null hypothesis, it was a reasonable compromise to make because we had no control over the true effect size of the intervention, the number of units under study or the low incidence observed for some crime types.
Conclusions
Hot spot policing has decreased crimes in many urban settings across the world, but to date its application in Latin American settings has been limited. Between 2017 and 2018 the first multi-city hot spot policing programme was implemented in Argentina, in La Plata, Morón, Tres de Febrero and Santa Fe. Results differed between the four cities. All cities experienced some decreases in robberies and thefts, but these were only significant in certain cities and for certain periods of time during the 6-month intervention period. La Plata experienced the largest decreases including a significant 39% decrease in theft during the first half of the intervention period and a significant 31% decrease in robbery during the second half of the intervention. Overall, no significant displacement to assaults or vehicle crimes was observed in any of the cities. Differences between cities on the impact of hot spot policing were judged to be because of differences in the deployment and project management of each intervention. The current study adds to the evidence-base on hot spot policing and the potential of this type of intervention for decreasing crime in settings other than western industrialized cities.
Dedication
This article is dedicated to the memory of Oscar Terminiello who died of Covid-19 in 2021. Oscar worked at the Department of Public Safety in La Plata city where he led the hot spot policing intervention. His enthusiasm and commitment to the hot spot policing intervention in La Plata was a key reason for its success. He will be greatly missed.
Footnotes
Declaration of conflicting interests
The author(s) declared no potential conflicts of interest with respect to the research, authorship, and/or publication of this article.
Funding
The author(s) received no financial support for the research, authorship, and/or publication of this article.