
Abstract
World market prices for food and fertiliser have increased significantly, leading to concerns about the impact of high food prices on food security. Therefore, the article investigates the effect of increased nitrogen fertiliser prices on optimal fertiliser use decisions for maize under irrigation, considering the uncertainty regarding maize crop yield response to nitrogen fertiliser application in different production years. The results showed that as the fertiliser price increases from 5 to 19 ZAR/kg, the amount of fertiliser applied decreases from the maximum of 220 kg/ha to around 100 kg/ha. Increased N fertiliser prices would decrease the amount of fertiliser applied, although the response is determined by the combination of fertiliser price, soil used, fertiliser application method and risk behaviour. The expected yields estimated for the optimal nitrogen fertiliser levels showed flat yield responses to decreased fertiliser application levels. The reduction in crop yields due to reduced fertiliser use is never more than 300 kg/ha. The results suggest that the soil used for production does not greatly impact the crop response since the optimal fertiliser decision is adjusted to ensure the maximum possible expected yield. However, the decision to use a single or split application does impact the optimal fertiliser use decision with higher application levels for a split application and a slightly lower crop yield response. The main conclusion is that increased nitrogen fertiliser prices would decrease the amount of fertiliser applied; however, the effect on expected crop yield would be minimal.
Introduction
The pressure on agriculture to meet the food demand of a growing world population is increasing, especially in parts of Africa where the food demand exceeds agricultural production (Setsoafia et al., 2022). South Africa plays an important role in ensuring food security within the Southern African Development Community (SADC) since more than 50% of the region’s maize imports originate from South Africa. South African agriculture is, therefore, under pressure to sustain and even increase food production to ensure food security.
Agricultural intensification activities such as irrigation and improved fertiliser recommendations have been identified to increase crop production, thereby increasing the ability to feed the growing world population (Ickowitz et al., 2019; Van Ittersum et al., 2016). Consequently, nitrogen fertiliser often represents the majority of the variable cost of production (Kabir et al., 2021; Monjardino et al., 2013) since it is one of the key factors influencing crop productivity (Berbel and Martinez-Dalmau, 2021). The problem is that world market prices for food and fertiliser have increased significantly (Hebebrand and Laborde, 2022) which creates concerns about the impact of high prices on food security. South Africa imports about 66% of its fertiliser demand (Ledger, 2017) and is therefore directly affected by world market fertiliser price increases. The South African price of Urea has increased by 224.5% (from ZAR5 813/ton 1 to ZAR18 862/ton) from May 2016 to May 2022 (NAMC, 2022). While potassium chloride (KCl) increased by 161.1% (from ZAR7 330/ton to ZAR19 136/ton), and mono-ammonium phosphate (MAP) increased by 150.9% (from ZAR9 455/ton to ZAR23 718/ton) during the same period. These fertiliser price increases have renewed the importance of predicting farmers’ response to price increases and the impact thereof on crop production and food security within South Africa and SADC.
Several studies have considered the effect of N prices on the N use decision (e.g., Angus and Grace, 2017) and concluded that relatively low N prices could lead to higher N application rates. Based on the expected N use response to changed prices, several researchers have investigated the effect of implementing a tax on N-prices to reduce N-use and, thereby, agricultural nonpoint source pollution (Finger, 2012; Ren et al., 2022). While Newbould (1989) argued that fertiliser prices would have to increase by 100–200% before fertiliser savings would occur, other researchers (e.g., Finger, 2012) found that increased N-prices would result in lower N applications. However, the N-use response of the decision-maker to increased N-prices is influenced by uncertainties the decision-maker faces during production (Finger, 2012).
Several papers investigated how production risk and uncertainty affect farmers’ fertiliser use decisions (Meyer-Aurich and Karatay, 2019; Monjardino et al., 2013; Paulson and Babcock, 2010 to name a few). Research has shown that producers tend to over-apply fertiliser based on crop-yield expectations. Abedullah and Pandey (2004) and Houser (2022) argued that the over-application of fertiliser results from the self-protection behaviour of farmers or because they wish to ensure maximum on the off chance that optimal growing conditions would occur. While Paulson and Babcock (2010) reason that over-application may also occur when uncertainty exists about the amount of soil nitrogen available to the crop. Rajsic and Weersink (2008) argued that over-application is justifiable because over-application costs are low compared to the gains from yield increases in years with favourable conditions.
Estimating irrigation farmers’ response to fertiliser price increase on fertiliser application rate decisions and the resulting impact on crop yield is complex and requires integrating information on weather, soil, crop, water availability, other management practices, input prices and output prices simultaneously. The complexity of the decision-making problem increases under production risk because the marginal crop responses to fertiliser applications are affected by different states of nature (i.e., production years) (Meyer-Aurich and Karatay, 2019). The complexity of the problem makes it very difficult to conduct controlled field trials across different states of nature to investigate the irrigation farmers’ fertiliser application rate decisions. Consequently, many researchers have resolved to the use of validated crop growth simulation models in their analyses (Finger, 2012; Monjardino et al., 2013).
This article contributes to the literature by investigating the effect of the recent dramatic increase in nitrogen fertiliser prices on risk-efficient fertiliser use decisions using South African maize production under irrigation as a case study. The results of the complex problem are decomposed into fertiliser application rate responses, crop yield responses and the cost of higher fertiliser prices. Key to the analysis is quantifying the crop yield response to changes in fertiliser application rates on irrigated crop yield for different soils, fertiliser application strategies (i.e., single vs. split applications) and irrigation management for different weather conditions. We use a validated crop growth simulation model to quantify these interactions which is summarised using plateau transformation functions to define the decision-maker's perception of the likelihood that a weather state will eventuate and the crop yield that will be realised in a particular year (Meyer-Aurich and Karatay, 2019). The transformation functions were incorporated into a utility maximisation model to determine the impact of fertiliser price increases on risk-efficient N fertiliser application rates, production levels and profitability risk-neutral and risk-averse decision-makers.
Data and procedures
Data simulation
Crop growth modelling effectively describes relationships between crop and environmental factors governing crop growth, for example, water and nutrient availability. These models can adequately simulate the influence of these factors on crop yield when field data are lacking (Weersink et al., 2002). The soil water balance (SWB) model is used in this research to generate the necessary data to quantify the relationship between applied nitrogen and crop yield. Annandale et al. (1999; 2000) validated the model for several irrigation strategies for crop production, while Van der Laan (2009) validated the nutrient sub-routines.
The SWB model uses solar radiation to estimate daily evapotranspiration (ET) and dry matter development. Owing to yearly differences in solar radiation, potential crop yield in each year will be different under no water or nitrogen stress conditions (Lollato et al., 2019). SWB simulates water stress as a dimensionless index based on actual daily transpiration, leaf area index and potential evapotranspiration. Actual daily transpiration is estimated as the daily changes in soil–water content for all soil layers except the uppermost soil layer, which is used to simulate evaporation. Nitrogen uptake is modelled as the minimum between crop demand and the potential uptake, where potential nitrogen uptake is determined by the amount available and an adsorption coefficient. Nitrogen stress is modelled using a grain stress factor that affects the daily nitrogen crop partitioning, while the grain stress factor is estimated as a ratio of nitrogen availability to crop demand. Since nitrogen stress reduces the canopy cover the leaf area index and potential transpiration rates are reduced. Consequently, irrigation water demand is reduced while satisfying reduced crop water demand.
Nineteen years of weather data obtained from a meteorological station near Glen 2 were used to simulate crop growth with SWB. Quasi-experimental data for maize production was simulated with the validated SWB simulation model for late monoculture maize (planting date 15 December) under irrigation on a sandy clay loam (SCL) and a sandy clay (SC) soil at Glen. The assumed soil texture of the SCL soil is 74% sand and 19% clay, while the SC soil is characterised by 45% sand and 39% clay. Maize yield response to nitrogen fertiliser and the associated irrigation water applied were simulated for the 19 years, assuming 33 kg N/ha of initial soil nitrogen. The assumption was that all other nutrients were available at optimal levels in the soil and were never constraining to crop growth. Therefore, only nitrogen fertiliser could constrain crop growth. In accordance with the FSSA (2009), nine levels of nitrogen fertiliser ranging from 20 to 220 kg N/ha, increasing by increments of 25 kg N/ha, were applied either in a single application on the planting date or in two separate applications. A split application of N may result in economic and environmental gains for producers (Kabir et al., 2021) due to possibly enhanced N use efficiency. Consultation at the time of the study revealed that producers who apply N in a split application follow a fixed schedule where two-thirds of the desired nitrogen level was applied on the day of planting, while the remaining third was applied seven weeks later (Du Preez, 2014). Only applications above 70 kg N/ha were applied with a split application, as it is typically too costly to apply lower N levels in a split application. The irrigation management decision modelled entailed refilling the soil profile to field capacity once soil water content reached a depletion level of 40% of field capacity, therefore, water was also never constraining to crop growth.
Estimating nitrogen response functions
The uncertainty effect of optimal N is subject to the interaction of yield variance with variance of weather; therefore Meyer-Aurich and Karatay (2019) stated that information on year-to-year yield responses is necessary when investigating N response. And since yield potential is specific to a season because of temporal variability, that is, rainfall, temperature and relative humidity (Lollato et al., 2019) the study estimates a yield response to N fertiliser decisions for each of the 19 production years. Every production year represents a specific combination of rainfall, temperature and solar radiation. Irrigation water was not considered when estimating the nitrogen response functions because the simulations were set up such that nitrogen is the most limiting production factor while satisfying crop water demand through irrigation applications. Consequently, crop yield is never reduced due to water stress during data generation. However, crop water demand was reduced when nitrogen stress was modelled due to a reduced canopy cover. Other variables, such as initial soil nitrogen levels, are controlled within the simulation setup. A separate set of state-specific response functions is estimated for each soil–fertiliser application method (i.e., single or split applications).
Several studies (e.g., Berbel and Martinez-Dalmau, 2021; Carew et al., 2009; Karatay and Meyer-Aurich, 2020; Koundouri et al., 2009) used Cobb Douglas, quadratic or linear-plateau production functions to determine fertiliser–crop yield functions. Tumusiime et al. (2011) argued that plateau functions such as the Mitscherlich tend to fit crop response data best. The Mitscherlich function is an exponential function that allows yield to increase at a decreasing rate and asymptotically approaches a maximum as the application rate of fertiliser increases (Tumusiime et al., 2011). A modified Mitscherlich function (Harmsen, 2000) is specified as follows:
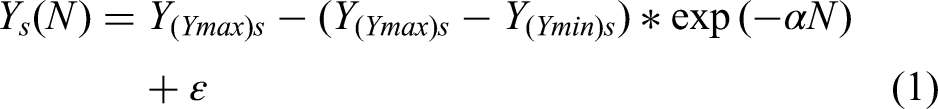
The modified Mitscherlich function implies that the efficiency with which nutrients are used is proportional to the difference in potential and actual yield (Harmsen, 2000). Harmsen (2000) argued that, in practice, environmental conditions such as photoperiod, temperature and rainfall could increase the crops’ yield potential. Therefore, the maximum yield that could be obtained in a specific production year with unique environmental conditions was used as the crops’ yield potential (
The Mitscherlich functions were estimated using the nonlinear mixed procedure in SAS (SAS, 2014). The likelihood function integrals were approximated and the function was maximised using the dual quasi-Newton optimisation algorithm. The Mitscherlich production functions estimated for crop yield are given in Figure 1.
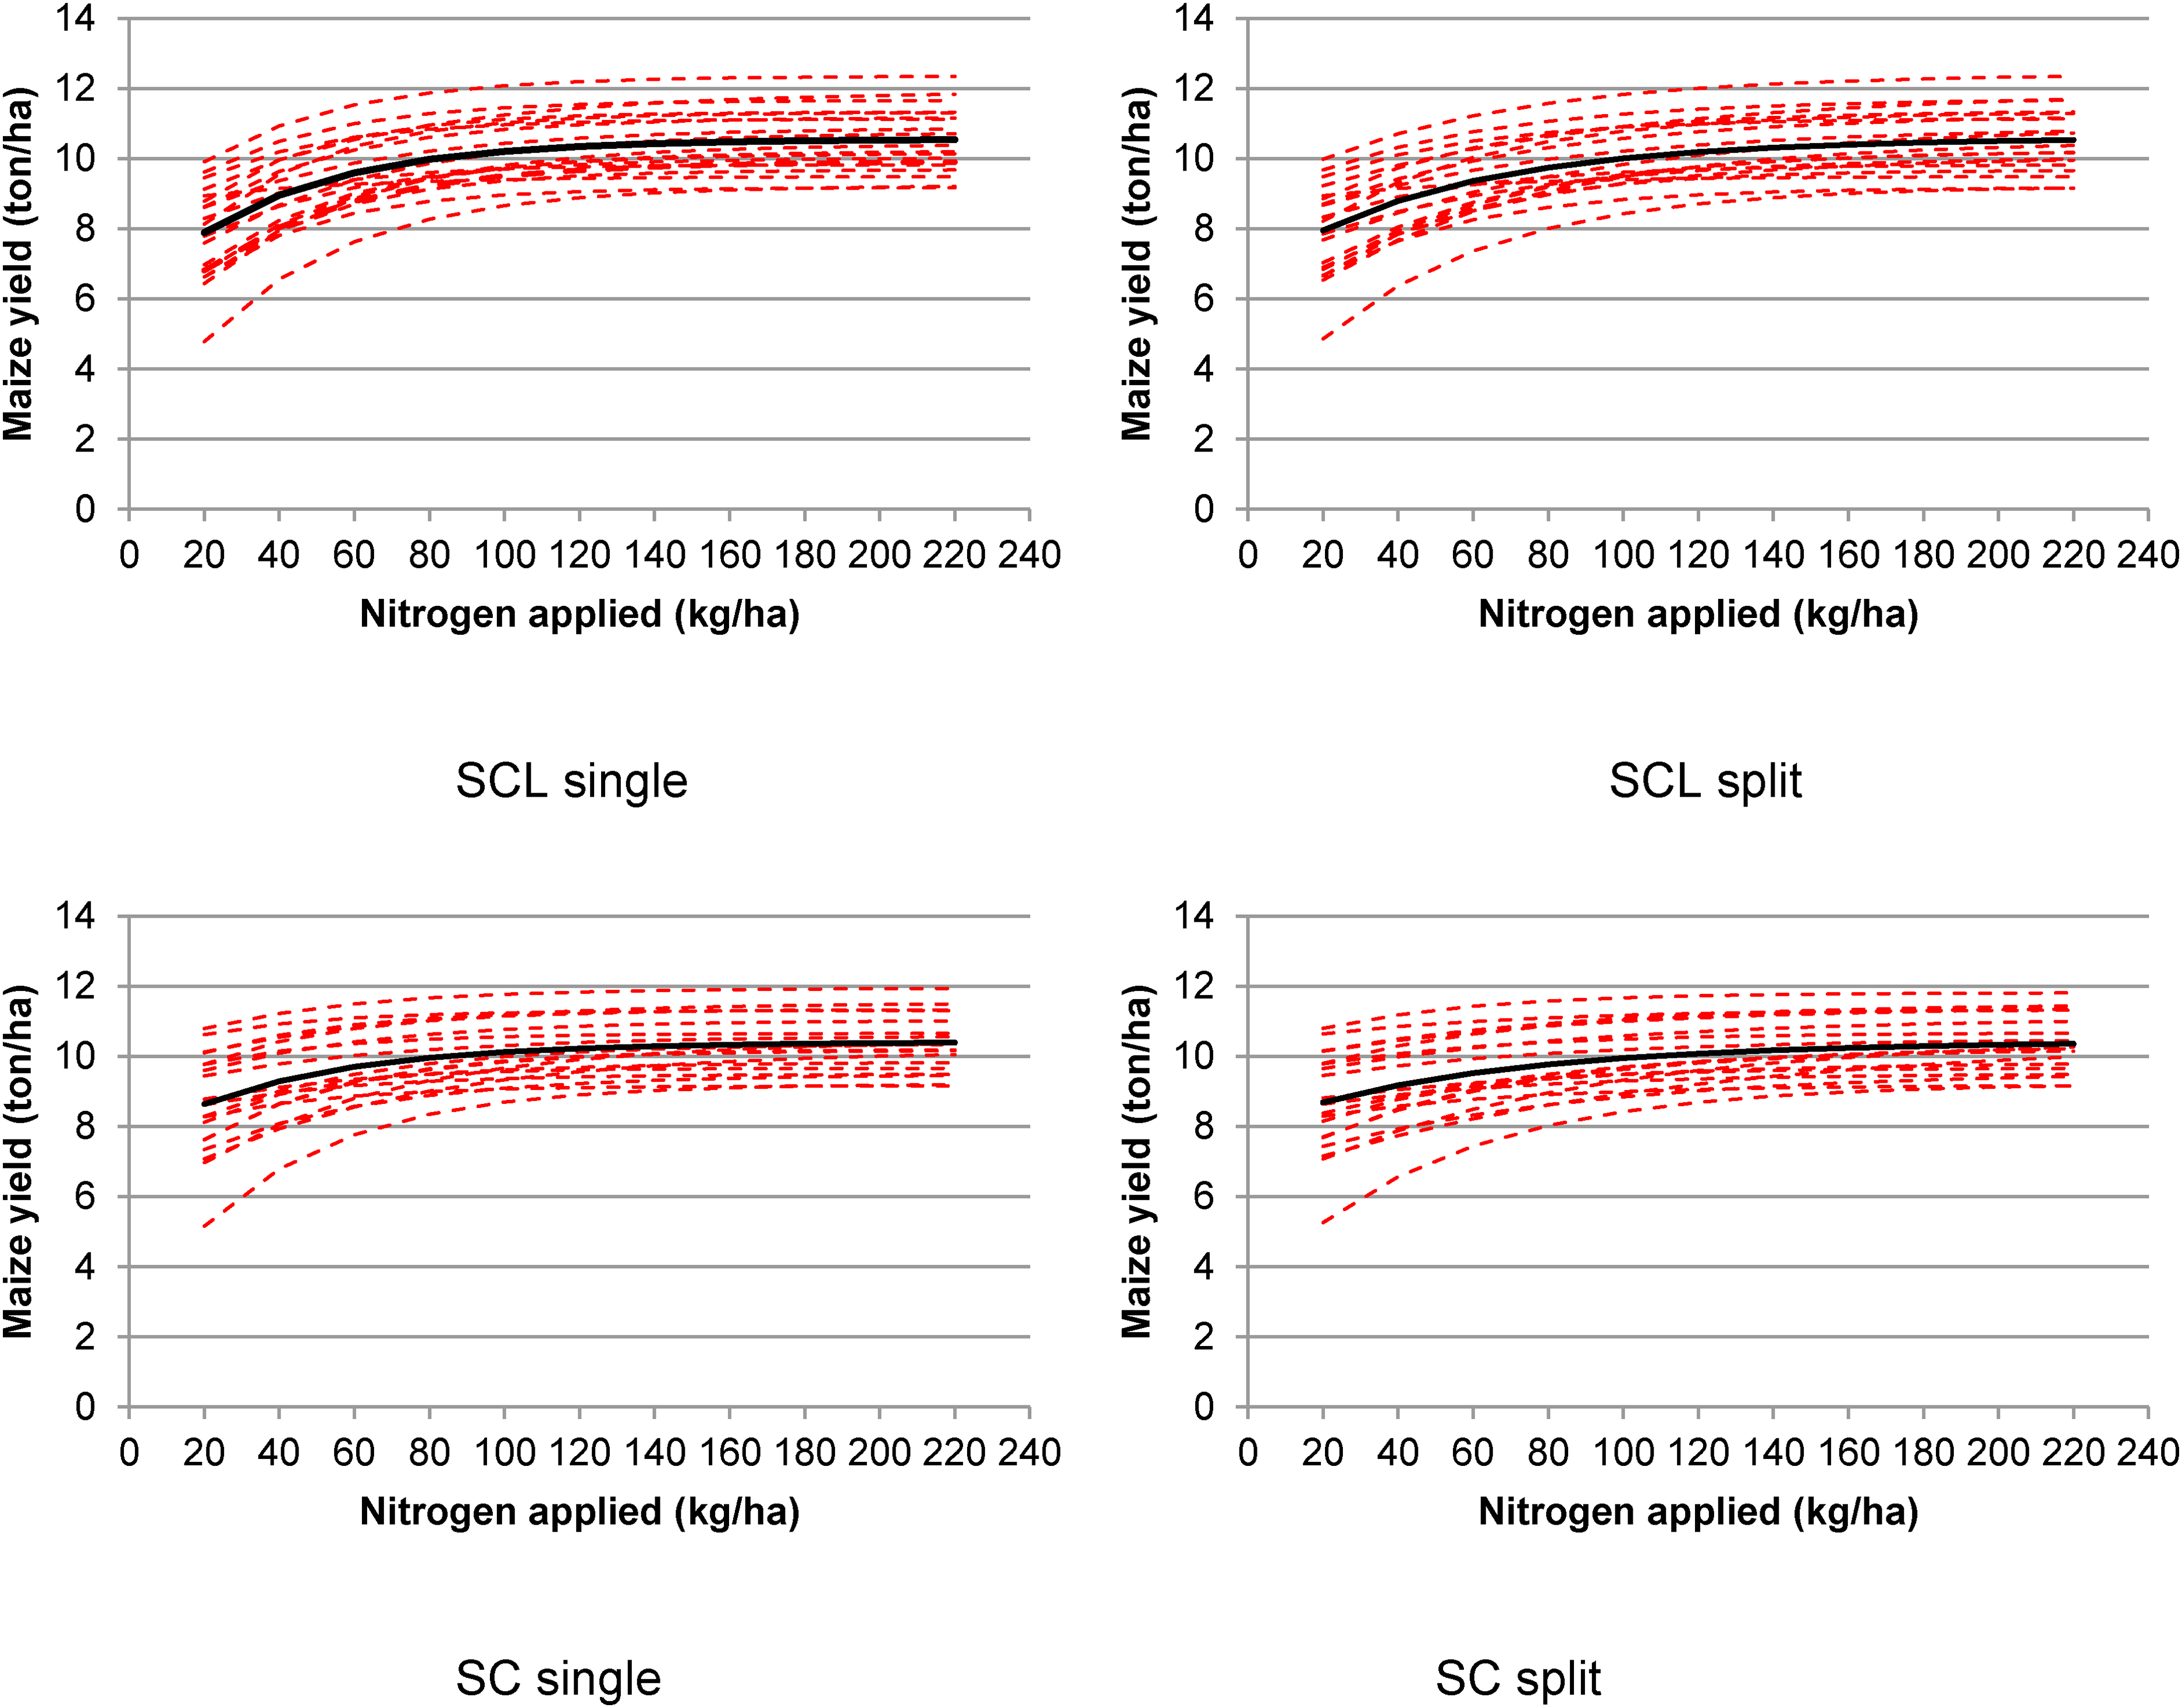
Nitrogen fertiliser–maize yield response function on a SCL soil and a SC soil for a single and a split nitrogen application. Note. The solid black lines indicate the average yield while the dashed red lines are used to indicate the yearly yield response to nitrogen application.
The average yield (solid black line) depicted in Figure 1 shows that the average maize yield is not very responsive to increased fertiliser use, as the average yield response appears flat. Average maize yield on SCL soil ranges from 8.2 to 10.7 ton/ha for a single fertiliser application and 8.1 and 10.6 ton/ha for a split application. For SC soil, the average crop yield ranges from 8.8 to 10.5 ton/ha for a single application and 8.8 to 10.4 ton/ha for a split fertiliser application.
The yearly yield response (dashed red lines) to nitrogen application shows the maize yield variation due to changed yield potential in the various production years. At relatively lower fertiliser application levels (60 kg/ha on an SCL single), the variability in yield response (7.6–11.5 ton/ha) is greater compared to relatively higher fertiliser levels (e.g., 200 kg/ha with a yield response ranging from 9.2 to 12.3 ton/ha). This reduction in the yield distribution at higher fertiliser application levels is due to several reasons. Firstly, the Mitsherlich function assumes declining marginal productivity as the amount of fertiliser applied increase. Secondly, given the simulated yield response to the fertiliser decision the marginal productivity decreased rapidly at lower fertiliser levels thus yield levels near to potential yield is obtained at relatively lower fertiliser levels. However, the maximum yield obtained is seldom the same between years because of the yield potential differ between the years.
The variation of maize yield as a function of nitrogen application on SCL and SC soil follows the same general trend. Maize yield variation on SC soil is lower than on SCL soil, irrespective of the nitrogen application method if nitrogen application levels above 70 kg/ha are considered. On SCL soil maize yield variation reaches a minimum at a lower nitrogen use level than on SC soil. Thus, the decision-maker has greater potential to reduce yield variability on SC soil by increasing nitrogen applications irrespective of the fertiliser application method.
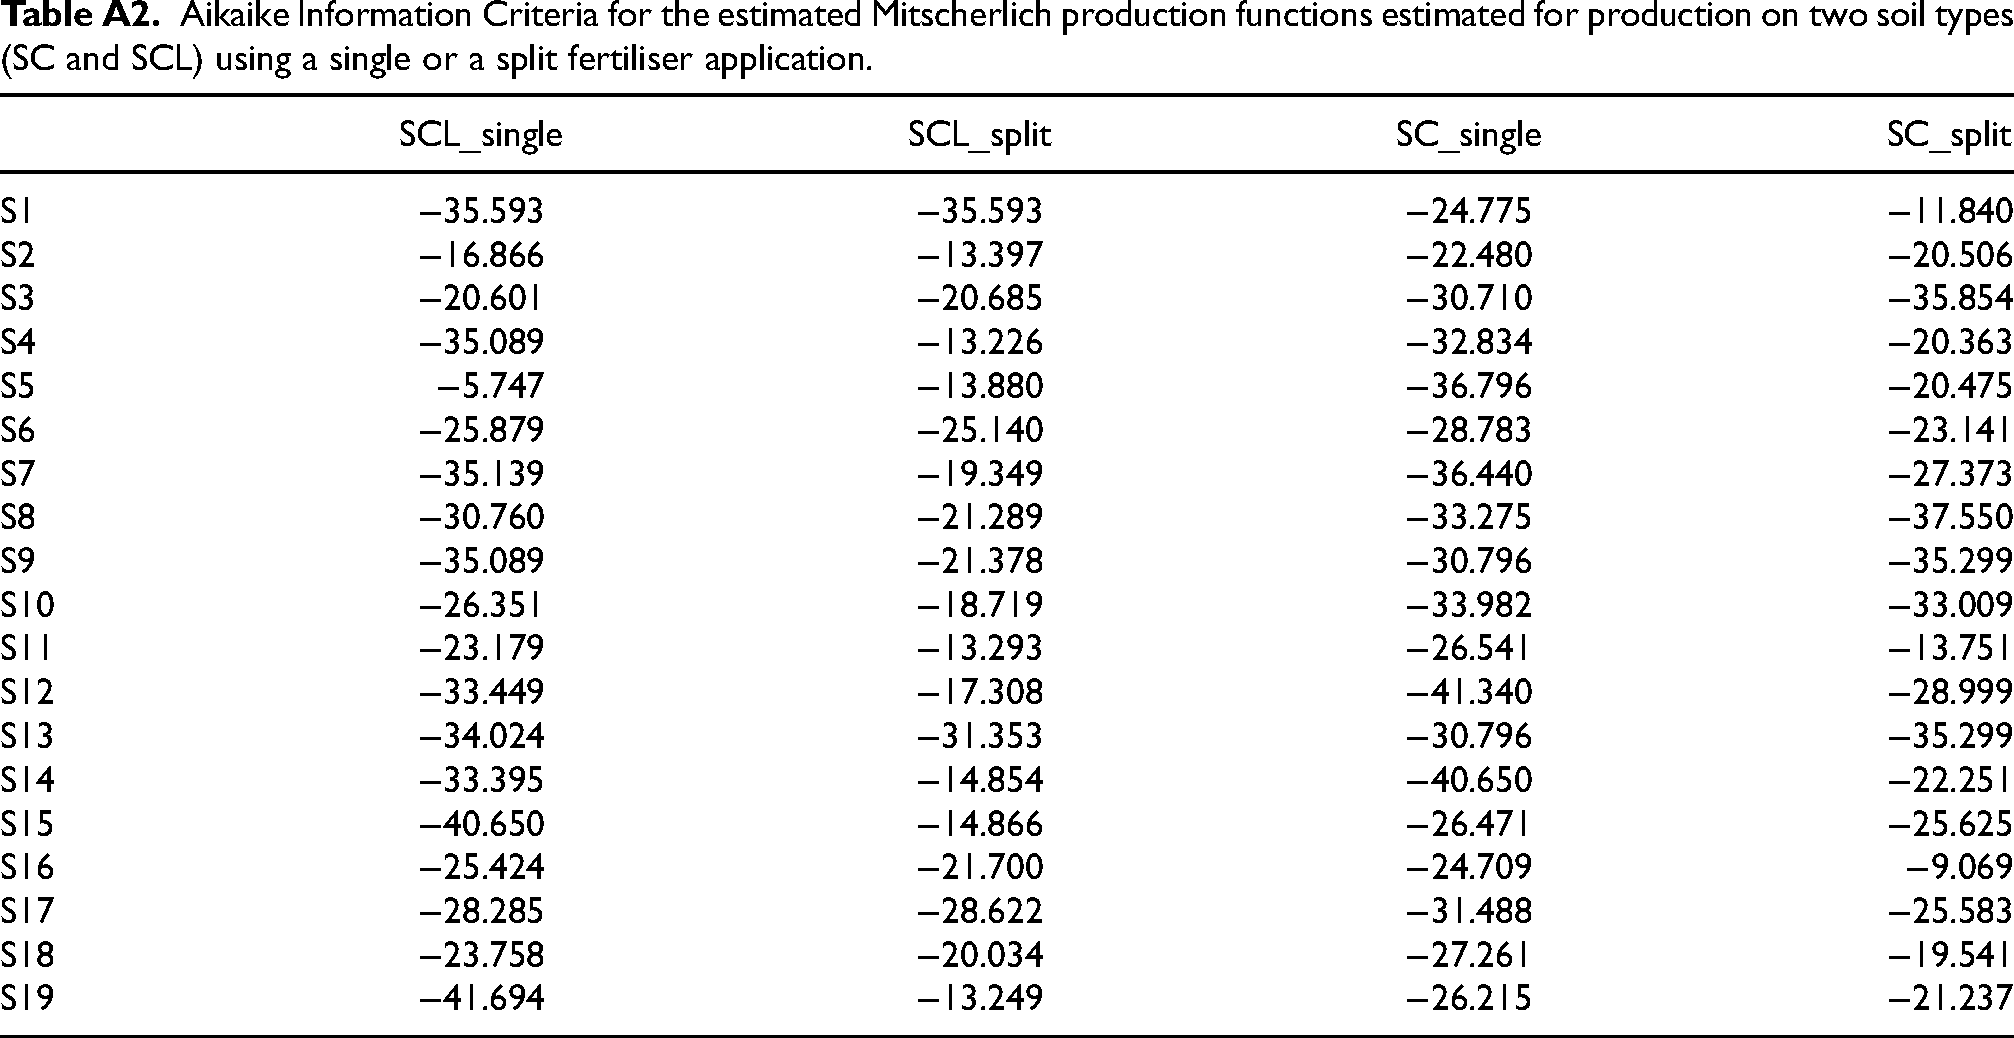
The regression results and Akaike Information Criterion (AIC) for the Mitscherlich response functions are shown in the appendix.
Determining optimal input use levels
A utility maximisation programming model was developed to evaluate risk-efficient fertiliser use decisions at alternative fertiliser prices for each soil-fertiliser application method combination. The model was developed in GAMS (Brooke et al., 2013) and solved with MINOS (Murtagh and Saunders, 2003). The model specification is as follows:
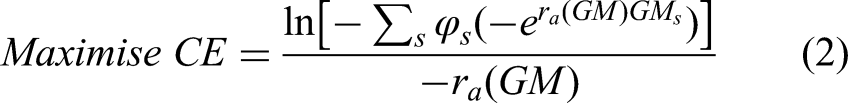


where
Maximising certainty equivalent is the same as maximising utility. A negative exponential utility function is used to estimate certainty equivalents to rank the alternatives in equation (2). Choice of the negative exponential utility function is based on constant absolute risk aversion (CARA). Constant absolute risk aversion is justified if the risky prospect is small relative to the overall wealth of the decision-maker, as is the case in our analyses (Hardaker and Lien, 2007). The selection of an appropriate coefficient of absolute risk aversion to represent the risk aversion of the decision-maker is not trivial. The invariance property of arbitrary linear transformations of the utility function does not apply to arbitrary rescaling of the outcome variable (Hey, 1979). Consequently, the risk-aversion level cannot be inferred from the magnitude of the coefficient of absolute risk aversion if the magnitude and dispersion of the risky outcomes are different. Babcock et al. (1993) provide interpretations of absolute risk aversion, allowing for consistent risk aversion representation when using CARA utility functions. Based on their recommendations, an absolute risk-aversion coefficient (RAC) of 0.00063 represents a high level of risk aversion. The chosen risk-aversion level corresponds to a probability premium of 92% and 89% 3 while, respectively, assuming a binomial gamble (Babcock et al., 1993) or a normally distributed risk (Barry et al., 2009).
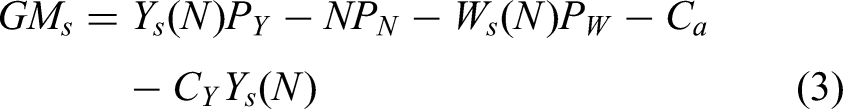
The main objective of the model is to maximise the utility that a risk-averse decision-maker derives from applying nitrogen fertiliser through the maximisation of certainty equivalent (CE). The underlying assumption is that the decision-maker decides on the level of fertiliser before knowing which production year will occur. Consequently, the nitrogen application rate is the same in each year, but the yield response in a specific year is quantified with the Mitscherlich response function to characterise risk across production years. The resulting empirical distribution of crop yield variability is used in conjunction with output price and costs to construct a distribution of gross margin variability (equation (3)).
The data showed that irrigation water demand varied because of variations in maximum potential transpiration and rainfall within a specific year and the induced reduction of potential transpiration due to nitrogen stress. The year effect of rainfall and potential transpiration is captured by estimating a separate response function for each year. Therefore, irrigation water demand is included in the model as a function of applied nitrogen to capture the effect of nitrogen stress on reduced crop water demand. The assumed quadratic relationship between N applications and applied irrigation water was captured as follows:

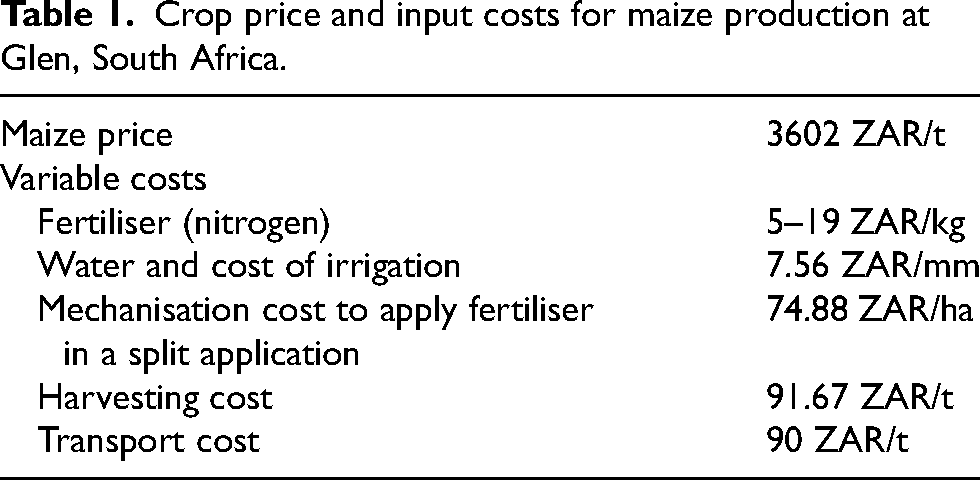
Gross margins were estimated using production cost data and input prices for 2022 obtained from Griekwaland-Wes Cooperation (GWK Ltd), South Africa (GWK, 2022). The crop price and the input costs used in this paper are shown in Table 1. Decision-makers who apply fertiliser in a split application face increased production costs due to the second fertiliser application. The additional cost associated with a split application is accounted for in the estimation of the gross margin. Although the amount of irrigation water applied is not a decision variable, the quantity of irrigation water applied is determined based on the level of fertiliser applied within a specific year. Cultivation cost, represented by
Crop price and input costs for maize production at Glen, South Africa.
Empirical results
The results presented consists of three sections demonstrating the impact of a fertiliser price increase from the normal price of 5 ZAR/kg to the abnormal prices of 19 ZAR/kg experienced during 2022. The first section presents the risk-efficient nitrogen input application rates for increased nitrogen input prices using a single and split fertiliser application on SCL and SC soil. The second section presents the crop yield response to changes in the optimal fertiliser application rate decisions while the last section presents the profitability analysis.
Optimal nitrogen input levels under price uncertainty
The risk-efficient nitrogen application rates optimised for a risk-neutral and risk-averse producer using a SCL or a SC soil while following a single or split (total of the two applications) nitrogen application strategy are shown in Figure 2. It should be noted that the response functions used in the optimisation model were estimated assuming a maximum fertiliser application rate of 220 kg/ha. At low N prices, the optimisation model is constrained to applying the maximum fertiliser level of 220 kg/ha, although the model would choose to apply more if possible. The edge effects due to low N prices are shown as the vertical part of the response as shown for production on a SCL soil using a single and split application. These edge effects were more evident in the sandier (i.e., SCL) soil, where nitrogen can more easily leach from the soils and decision-makers tend to over-apply fertiliser to ensure enough fertiliser is available for crop production.
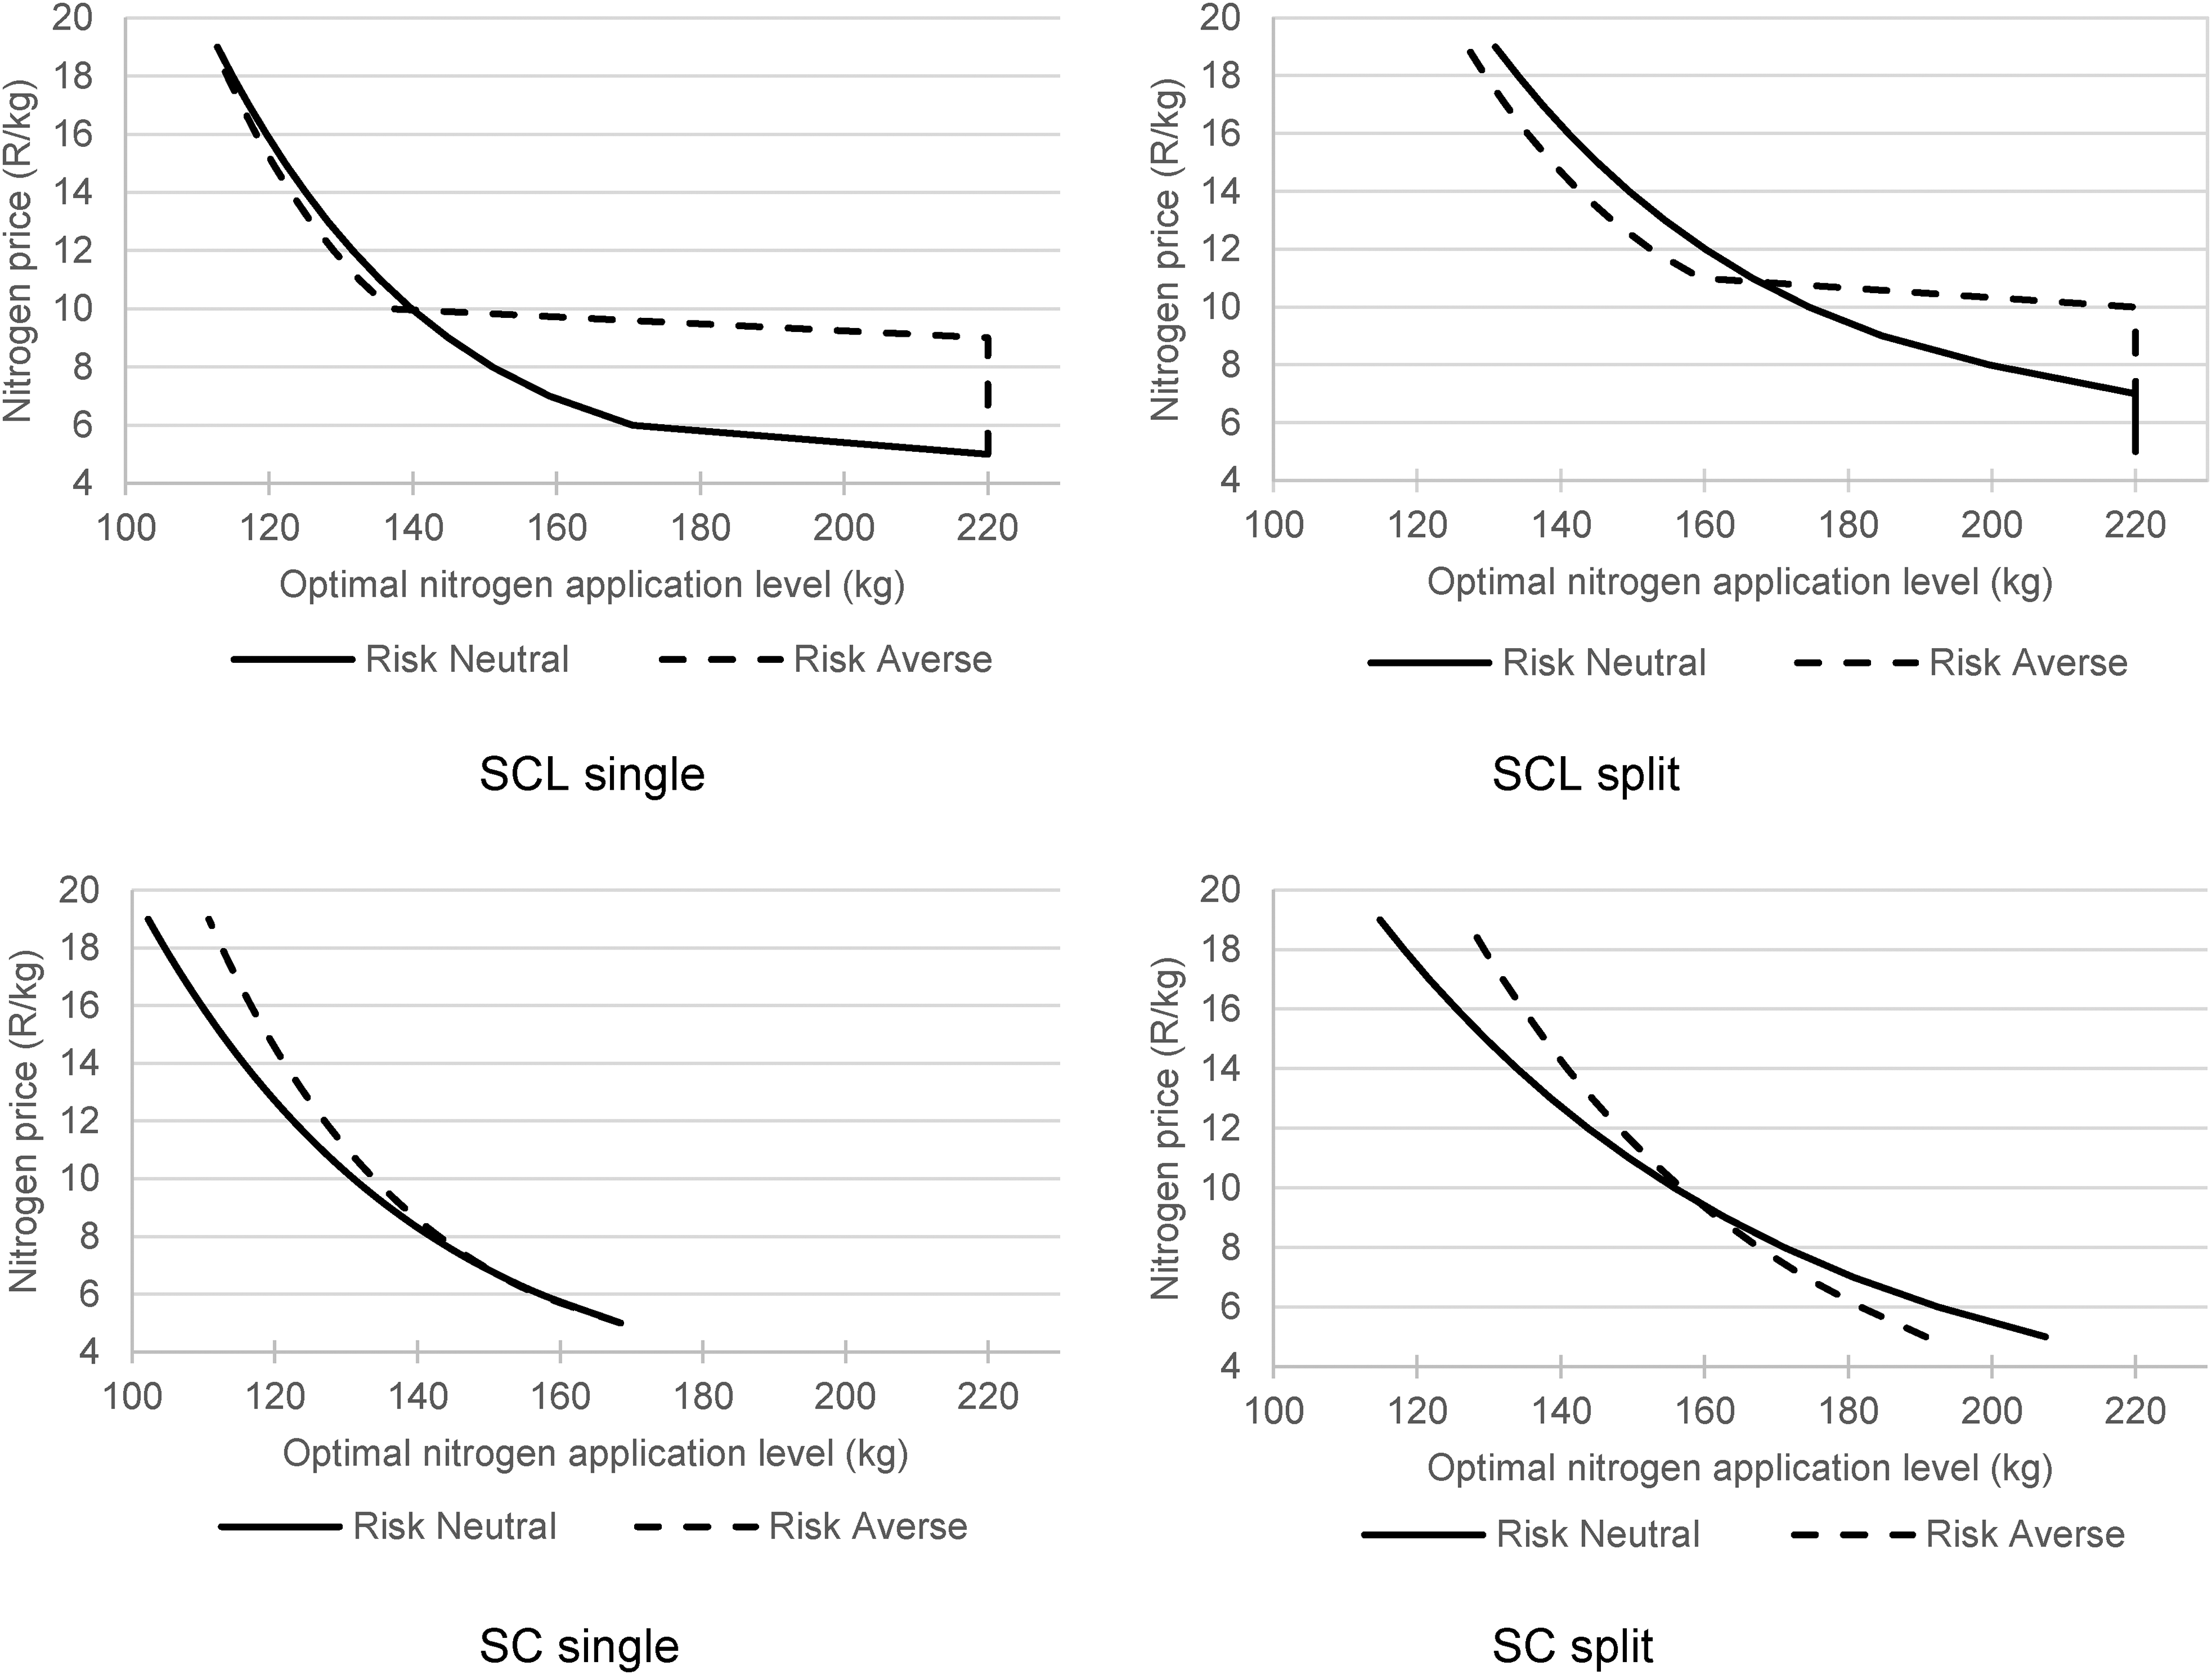
Optimal nitrogen fertiliser levels (kg/ha) for increased nitrogen prices (ZAR/kg) for single and split nitrogen application on SCL soil and SC soil, assuming a risk-neutral and risk-averse producer.
The results for a risk-neutral producer on the SCL soil show that the single fertiliser application rates decrease from a maximum of 220 kg/ha at 5 ZAR/kg to a minimum of 112 kg/ha at 19 ZAR/kg. While the use of a split application strategy decreases application rates from 220 kg/ha at 5 ZAR/kg to 131 kg/ha at 19 ZAR/kg. Edge effects occurred if the fertiliser price was lower than 7 ZAR/kg for the split fertiliser application strategy. The results for the SC soil show similar trends to the SCL soils. However, in general, the SC soils require lower fertiliser application rates compared to the SCL soils. The increase in fertiliser price from 5 to 19 ZAR/kg results in decreased fertiliser application rates from 169 to 102 kg/ha for a single fertiliser application strategy and 207kg/ha at 5 ZAR/kg to 115 kg/ha at 19 ZAR/kg for a split fertiliser application strategy.
The results for the nitrogen application rates for a risk-averse producer shown in Figure 2 indicate that production on SCL soils show significant edge effects because a risk-averse decision-maker applies more fertiliser at relatively low N prices to ensure that enough fertiliser is available for crop production. Consequently, a risk-averse decision-maker will reduce fertiliser application rates only if the price increases above 9 and 10 ZAR/kg, respectively, when using a single and split fertiliser application strategy. At the maximum fertiliser price, fertiliser application rates will be reduced to 112 kg/ha when using a single application and 127 kg/ha when using a split application. The risk of nitrogen losses due to leaching is less on a SC soil and risk-averse decision-makers will be more responsive to price increases. The increase in fertiliser price from 5 to 19 ZAR/kg results in decreased fertiliser application rates from 169 to 111 kg/ha for a single application and a decrease from 191 to 127 kg/ha for a split application strategy.
Yield response to increased fertiliser prices
The expected crop yields obtained for increased fertiliser prices for risk-neutral and risk-averse decision-makers are given in Figure 3. The crop yields shown in Figure 3 show the same edge effects as the optimal fertiliser levels. The expected crop yields for a risk-neutral producer using an SCL soil and a single fertiliser application decreases from a maximum of 10.5 ton/ha at 5 ZAR/kg to a minimum of 10.3 ton/ha at 19 ZAR/kg. The expected crop yields for the split application strategy decreased from 10.5 to 10.3 ton/ha at 19 ZAR/kg. The reduction in crop yield on an SCL soil due to the increase in fertiliser price is about 200 kg/ha. This relatively small decrease in crop yield suggests a fairly flat crop response to the increase in fertiliser prices. The results for the SC soil follow similar trends, although the expected crop yields realised are slightly lower than for production on a SCL soil. An increase in fertiliser prices would reduce expected crop yield from 10.3 ton/ha at 5 ZAR/kg to 10.1 ton/ha at 19 ZAR/kg for a single application and from 10.3 to 10 ton/ha for a split application.
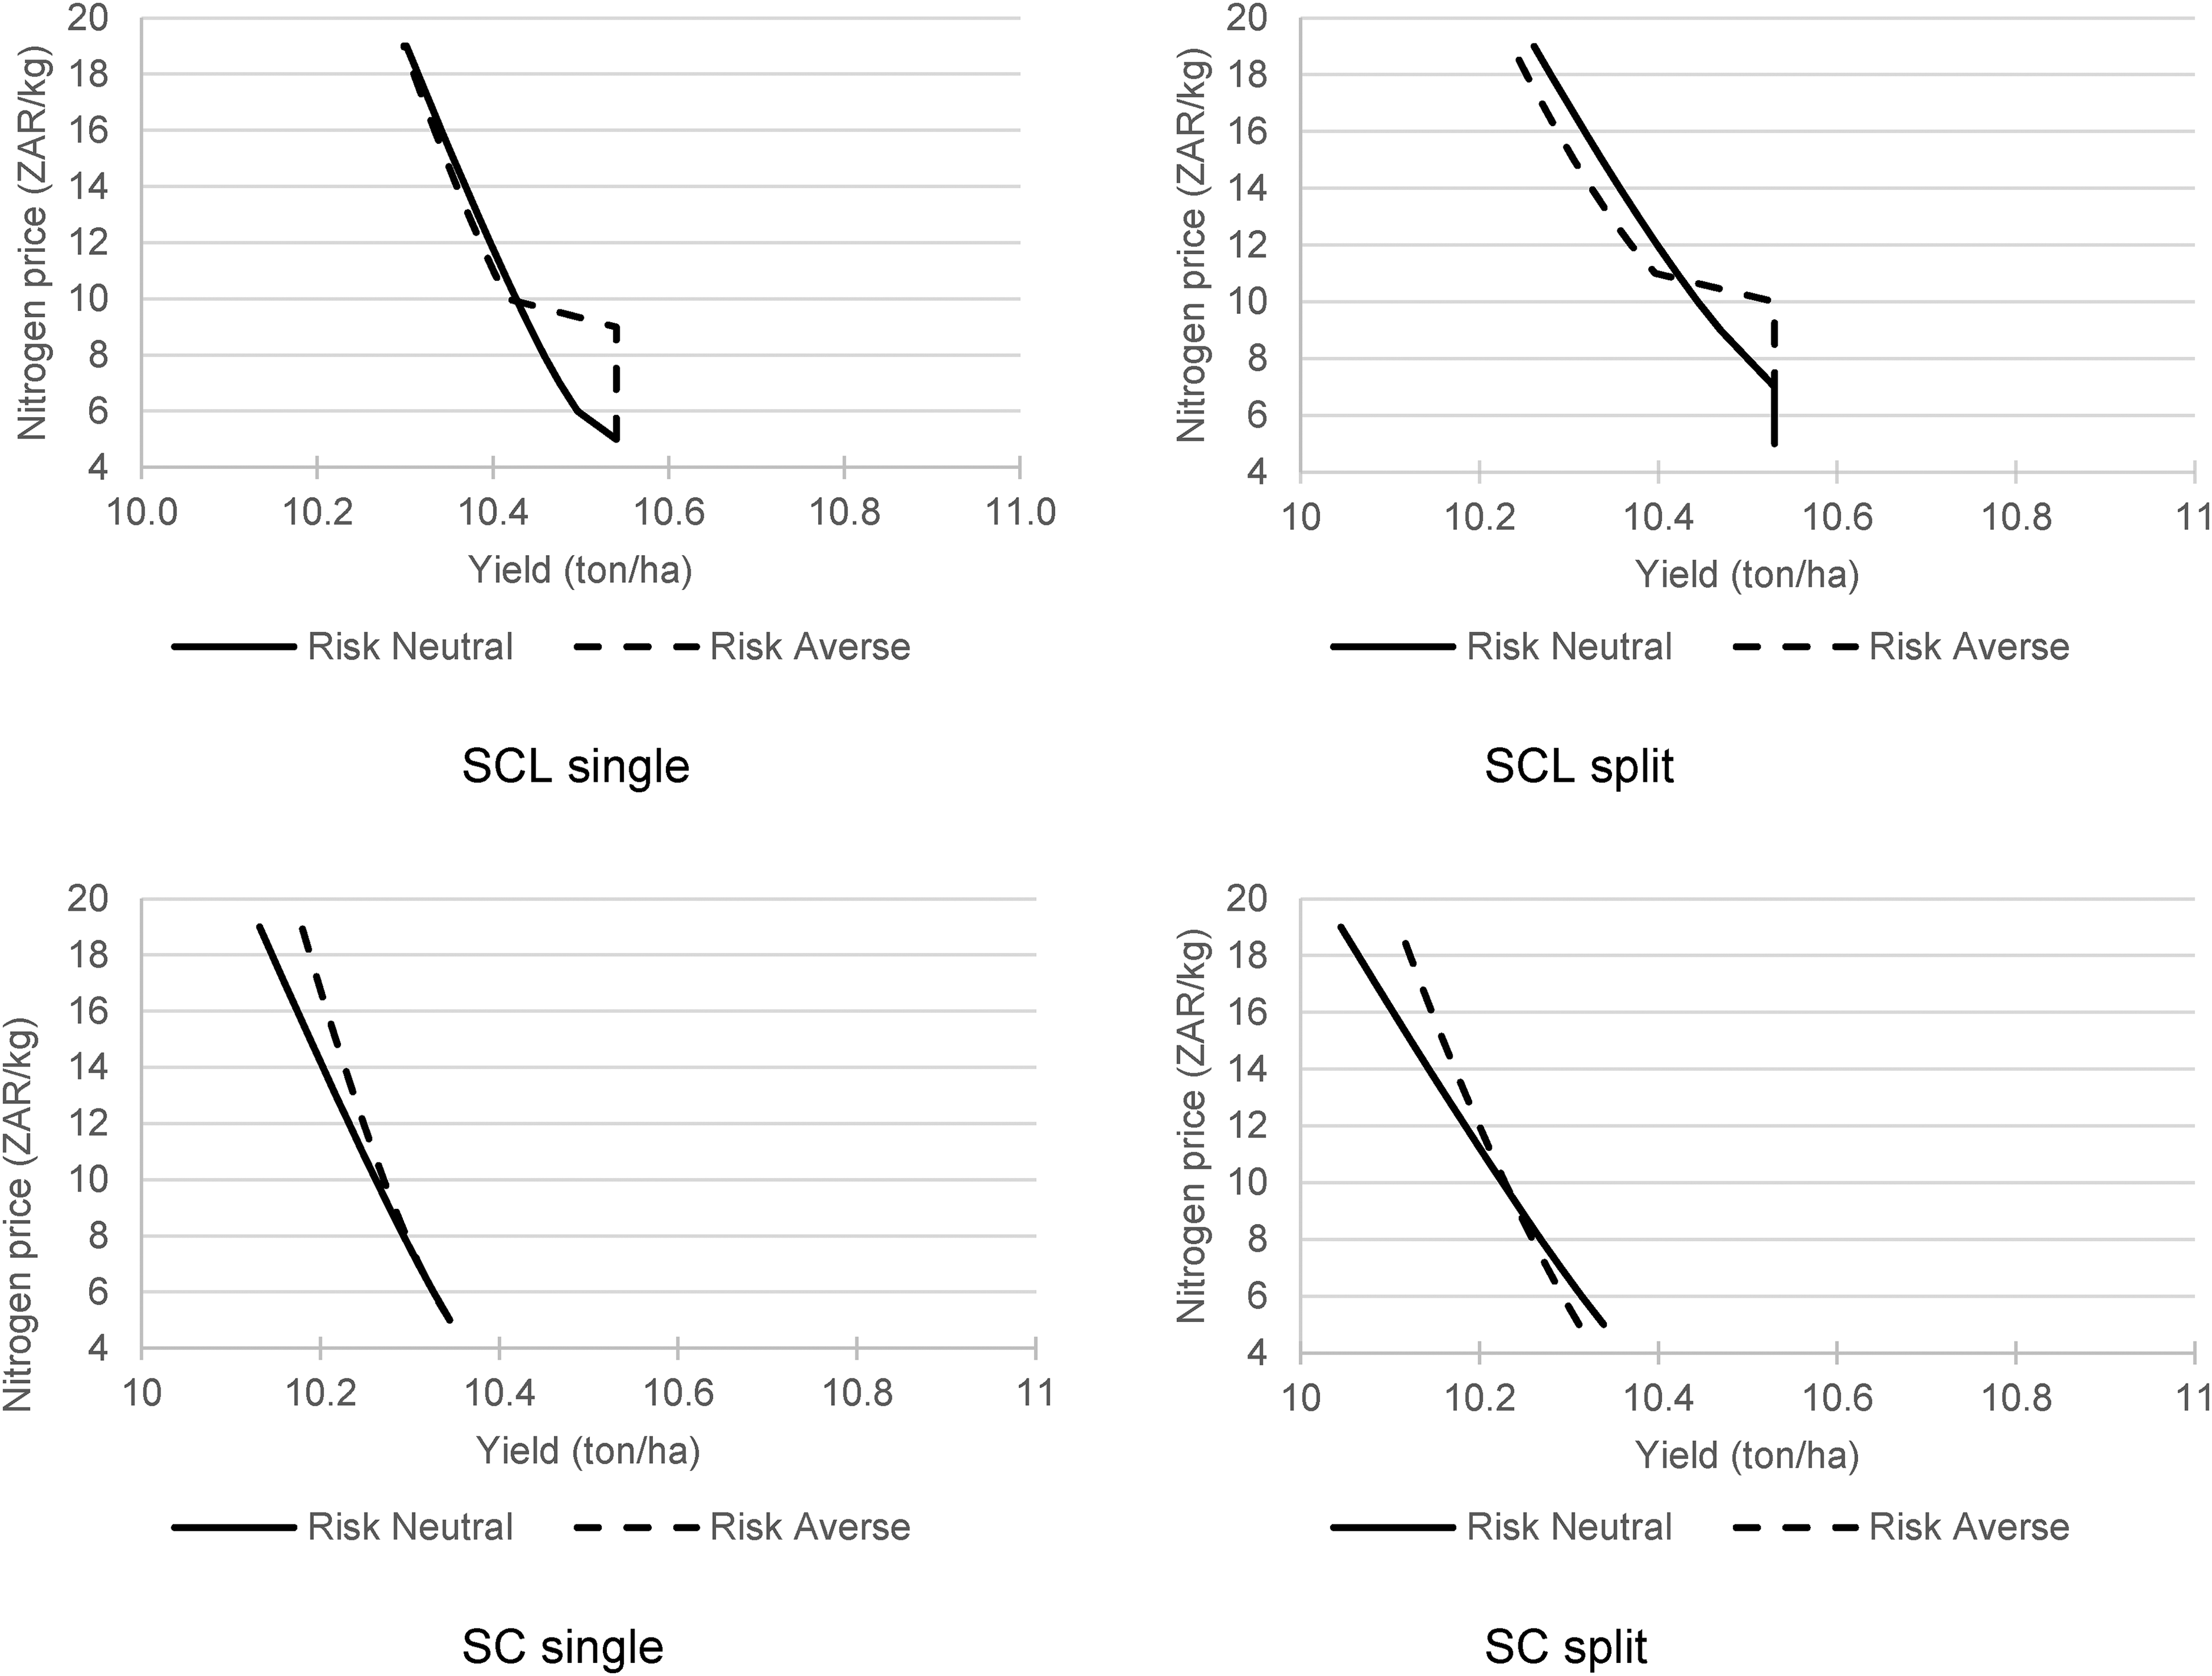
Estimated crop yields (ton/ha) for increased nitrogen prices (ZAR/kg) for single and split nitrogen application on SCL soil and SC soil, assuming a risk-neutral and risk-averse producer.
The expected crop yields due to increased fertiliser prices for a risk-averse producer (in Figure 3) show the same responses that were observed for risk-neutral producers. Production on a SCL soil result is slightly higher expected crop yields. The estimated crop yields on an SCL soil decreased from 10.5 ton/ha at 5 ZAR/kg to 10.3 ton/ha at 19 ZAR/kg for a single fertiliser application. While production using a split application shows a slightly higher yield reduction from 10.5 ton/ha at 5 ZAR/kg to 10.2 ton/ha at 19 ZAR/kg. Production on an SC soil results in lower crop yields compared to the SCL soil. The estimated crop yield for production using a single fertiliser application decreased from 10.3 ton/ha at 5 ZAR/kg to 10.2 ton/ha at 19 ZAR/kg. A split application resulted in slightly lower expected crop yields. The crop yield estimated for production with a split application ranged from a maximum of 10.3 ton/ha at 5 ZAR/kg to 10.1 ton/ha at 19 ZAR/kg.
The cost of higher fertiliser prices
The results presented in this section show the benefits to producers who purchase N fertiliser at the lower price of 5 ZAR/kg instead of 10, 15 or 19 ZAR/kg. The results for the calculated benefits could be interpreted as the producer's willingness to pay to purchase N fertiliser at lower N prices. The calculated benefits for production on an SCL and SC soil using a single and split fertiliser application are shown in Figure 4.
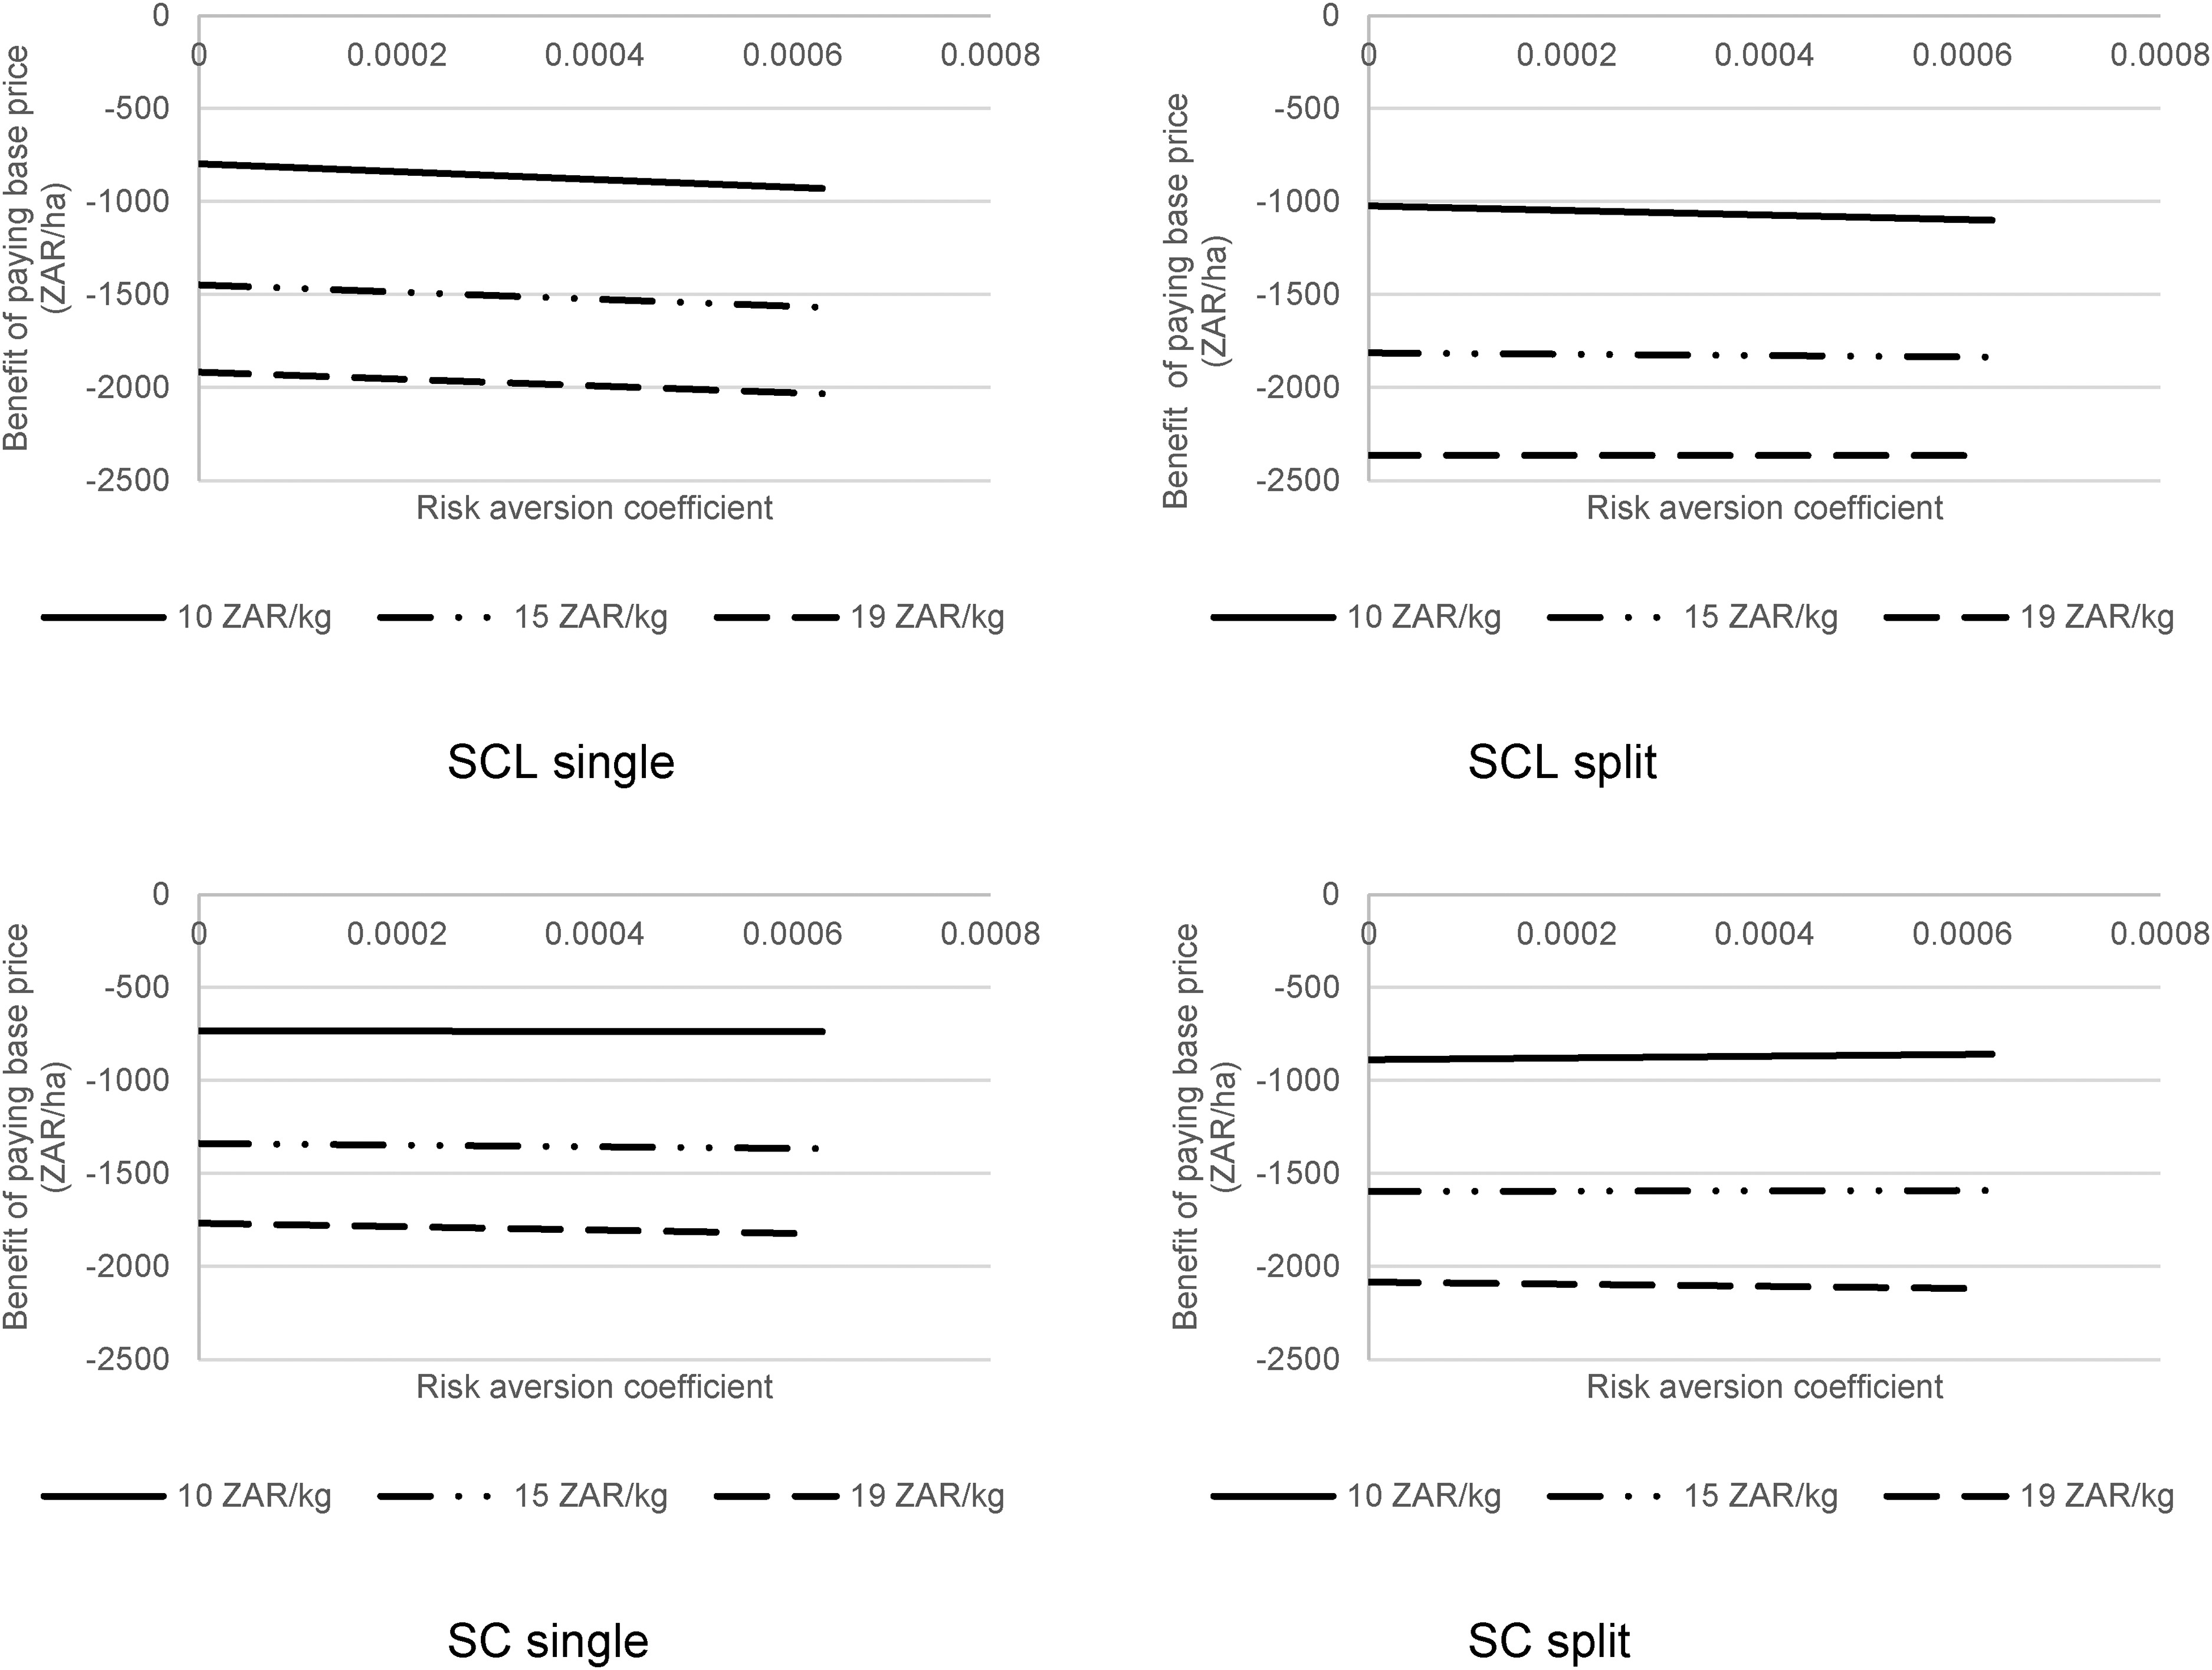
Benefit of purchasing N fertiliser at a lower prices (ZAR/ha) calculated for risk-neutral (RAC = 0) and risk-averse (RAC = 0.00063) producers assuming an N fertiliser price of 10, 15 and 19 ZAR/kg for production on SCL soil and SC soil (Base N fertiliser price is 5 ZAR/kg).
The benefits calculated for production on SCL soil using a single fertiliser application show that a risk-neutral producer would be willing to pay 796 ZAR/ha to continue production at a fertiliser price of 5 ZAR/kg and not face a higher price of 10 ZAR/kg. A risk-averse producer would be willing to pay 929 ZAR/ha to avoid higher price of 10 ZAR/kg. As the price of N fertiliser increases, the size of the producers willingness to pay to avoid the higher fertiliser price increases. The willingness to pay of a risk-neutral decision-maker increases to 1448 and 1917 ZAR/ha when the price increases to 15 and 19 ZAR/kg, respectively. Risk-averse producers are willing to pay more than risk-neutral decision-makers. The willingness to pay increases to 1568 and 2033 ZAR/ha, respectively, when the price increase to 15 and 19 ZAR/kg. The benefits calculated for production using a split fertiliser application result in higher willingness to pay compared to the single application. A risk-neutral producer would have a willingness to pay of 1023, 1813 and 2363 ZAR/ha to avoid paying a fertiliser price of 10, 15 and 19 ZAR/ha. While a risk-averse producers’ willingness to pay is higher at 1100, 1835 and 2365 ZAR/ha, respectively, for a fertiliser price of 10, 15 and 19 ZAR/ha.
The calculated benefits for production on SC soil using a single and split fertiliser application follow a similar trend to that of SCL single. The benefits calculated for production on a SC soil are consistently less than the benefits calculated for production on SCL soils. A risk-neutral producer using a single application would, respectively, be willing to pay 733, 1338 and 1767 ZAR/ha, while risk-averse producers would be willing to pay 737, 2366 and 1825 ZAR/ha to avoid a higher fertiliser price of 10, 15 and 19 ZAR/kg. Similar to the benefits estimated on the SCL soil, a split application leads to higher benefits. A risk-neutral producer would be willing to pay 888, 1596 and 2084 ZAR/ha to avoid paying a fertiliser price of 10, 15 and 19 ZAR/ha, respectively. The willingness to pay of a risk-averse producer would be higher at 858, 1591 and 2119 ZAR/ha, respectively, for a fertiliser price of 10, 15 and 19 ZAR/ha.
Discussion
The results showed that an increase in the price of fertiliser would decrease the amount of fertiliser used to produce maize. Depending on the soil and application method used, the amount of fertiliser applied decreased from the maximum application to a minimum of 102 kg/ha. The reduction in fertiliser applied is surprising given the fairly flat yield response functions. A possible reason could be because of the maximisation of the gross margins. The optimisation model would be willing to accept the minimal reduction in production income due to a small reduction in yields while saving on production costs (reduced fertiliser and water costs due to reduced fertiliser and water use). The reduced nitrogen use due to increased nitrogen prices aligns with recent literature on taxes to reduce the environmental impact of producers’ fertiliser use decisions. Finger (2012) and Meyer-Aurich et al. (2020) found that nitrogen taxes reduce N fertiliser levels and thus reduce N emissions from agriculture. While Villacis et al. (2020) found that the profit-maximising nitrogen rates ranged from 162 to 197 kg/ha for fertiliser prices of $0.72, $0.96 and $1.20.
The responsiveness of the N fertiliser decision to changes in N fertiliser prices is also relatable to the short-run price elasticity of −0.33 found in Sweden (Ingelsson and Drake, 1998). Berbel and Martinez-Dalmau (2021) in a study on a study on N decision-making under yield uncertainty argued that elasticity with respect to fertiliser prices is dependent on the crop sector that is considered. The responsiveness to price changes is greater when the prices are higher for both risk-neutral and risk-averse decision-makers. However, the responsiveness of risk-averse decision-makers is less than that of risk-neutral decision-makers. A potential reason for the lower responsiveness could be because nitrogen is a risk-decreasing input.
Although the decrease in fertiliser applied could reduce crop production, the expectation is that the yield effect would not be large due to two reasons. First, the maize price used in the study is relatively high. Therefore, given the produce price and input prices considered the producer would always produce closer to maximum yield because the value of the marginal product would always be more that the cost of the additional unit of input. Second, the reduction in crop yields due to decreased fertiliser levels does not seem significant because the expected crop responses show a fairly flat response to changes in nitrogen use. Meyer-Aurich and Karatay (2019) argued that the functional form of the production function has a sizable effect on the optimal fertiliser rate. The Mitscherlich response functions used to quantify the crop-yield response to fertiliser application showed a relatively flat response at fertiliser application levels greater than 100 kg/ha which is in line with the flat nitrogen payoff functions suggested by Pannell (2017).
The results suggest that the soil used for production does not greatly impact the crop response since the optimal fertiliser decision is adjusted to ensure the maximum possible expected yield. However, the decision to use a single or split application does impact the optimal fertiliser use decision with higher application levels for a split application and a slightly lower crop yield response. This single and split application effect is more visible for risk-averse producers. It is often argued that applying the right nitrogen supply at the right rate, time and place are strategies to improve nitrogen use efficiency. Kabir et al. (2021) in a study on split application with rate adjustments due to changed weather conditions found that split application resulted in higher crop yields because the N application rates better matched the crop needs. Similarly, Masso et al. (2017) found that the timing of fertiliser, including split applications, can improve crop yields. However, within this study, the split application seems to result in lower crop yields. A possible reason could be the timing of the split application. The split application is applied seven weeks after planting which could not be ideal timing for maximum N use efficiency. Alternatively factors that affect denitrification, leaching or volatilisation could have resulted in N losses. Davies et al. (2020) argued that the results on the relationship between N timing and maize grain yield as shown inconsistent results that are often site-specific.
A comparison of the fertiliser use decision between risk-neutral and risk-averse decision-makers showed that the fertiliser decision is affected by the fertiliser price, soil (SCL vs. SC) and application method (single vs. split). Overall, the results showed that risk-averse decision-makers use more fertiliser at higher prices and have a higher willingness to pay than risk-neutral decision-makers. This result suggests that nitrogen fertiliser is seen as a risk-reducing input. Previous studies on fertiliser use in irrigated production showed that nitrogen acted as a risk-decreasing input (Isik and Khanna, 2003), while acting as a risk-increasing input in dryland production (Monjardino et al., 2013). Furthermore, when applying fertiliser in a split application, more fertiliser is applied regardless of the soil used for production.
Conclusions
The article investigates the effect of increased nitrogen fertiliser prices on optimal fertiliser use decisions for maize under irrigation, considering the uncertainty regarding maize crop yield response to N fertiliser application in different production years. The results showed that an increase in the price of fertiliser would decrease the amount of fertiliser used to produce maize. The fertiliser application response is different depending on the soil (SCL vs. SC), fertiliser application method (single vs. split application) and the risk attitude of the producer. Although the N fertiliser use decreases, the resulting reduction in crop yield is minimal due to the flat response curves. The conclusion is that increased N prices would reduce the amount of fertiliser applied with minimal impact on crop yields. Therefore, the recent increase in fertiliser prices is expected not to impact food security.
Application of the approach requires careful consideration of the functional form, as the functional form has a significant bearing on the results. It should further be noted that the crop responses were simulated assuming optimal conditions. Since our dataset does not include biotic factors such as disease and pests, the results need to be tested against other datasets that include these random effects. Furthermore, it is important to acknowledge that the timing of the second N application for the analyses were kept constant. The impact of timing of the second application should be investigated.
Footnotes
Acknowledgments
The paper is based on research that was conducted as part of a solicited research project, development of an integrated modelling approach to prediction of agricultural non-point source (NPS) pollution from field to catchment scales for selected agricultural NPS pollutants [K5/1516/1/12] (Görgens et al., 2012), that was initiated, managed and funded by the Water Research Commission (WRC). Financial and other assistance by the WRC is gratefully acknowledged. The authors also wish to acknowledge the anonymous reviewer for his valuable input on a previous version of the paper.
Data availability
The data is available from the corresponding author upon request.
Declaration of conflicting interests
The authors declared no potential conflicts of interest with respect to the research, authorship, and/or publication of this article.
Funding
The authors disclosed receipt of the following financial support for the research, authorship, and/or publication of this article: This work was supported by the Water Research Commission (grant number K5/1516/1/12).
Notes
Appendix
Aikaike Information Criteria for the estimated Mitscherlich production functions estimated for production on two soil types (SC and SCL) using a single or a split fertiliser application.
| SCL_single | SCL_split | SC_single | SC_split | |
|---|---|---|---|---|
| S1 | −35.593 | −35.593 | −24.775 | −11.840 |
| S2 | −16.866 | −13.397 | −22.480 | −20.506 |
| S3 | −20.601 | −20.685 | −30.710 | −35.854 |
| S4 | −35.089 | −13.226 | −32.834 | −20.363 |
| S5 | −5.747 | −13.880 | −36.796 | −20.475 |
| S6 | −25.879 | −25.140 | −28.783 | −23.141 |
| S7 | −35.139 | −19.349 | −36.440 | −27.373 |
| S8 | −30.760 | −21.289 | −33.275 | −37.550 |
| S9 | −35.089 | −21.378 | −30.796 | −35.299 |
| S10 | −26.351 | −18.719 | −33.982 | −33.009 |
| S11 | −23.179 | −13.293 | −26.541 | −13.751 |
| S12 | −33.449 | −17.308 | −41.340 | −28.999 |
| S13 | −34.024 | −31.353 | −30.796 | −35.299 |
| S14 | −33.395 | −14.854 | −40.650 | −22.251 |
| S15 | −40.650 | −14.866 | −26.471 | −25.625 |
| S16 | −25.424 | −21.700 | −24.709 | −9.069 |
| S17 | −28.285 | −28.622 | −31.488 | −25.583 |
| S18 | −23.758 | −20.034 | −27.261 | −19.541 |
| S19 | −41.694 | −13.249 | −26.215 | −21.237 |