
Abstract
The adoption of cultivated forages in smallholder dairy systems offers a cost-effective way to increase the productivity of livestock. The Kenyan and Ethiopian governments have both stated an ambition to increase the use of forages in their dairy sectors; however, policies have failed to produce widespread results. Existing research tends to focus on local barriers to forage adoption and not the wider innovation environment. To fill this literature gap, this study uses a Tobit model to analyse village-level data from Kenya and Ethiopia in 2015. A potentially important relationship between milk buyers and forage intensity in Ethiopia, which has not previously been addressed in the literature, is identified. As the Ethiopian government dominates the forage sector, the results of this study indicate that private milk buyers may offer an alternative source of information. In the Kenyan context, this paper finds that informal institutions and farmer-to-farmer information transmission are important in adoption decisions and should be considered when designing extension strategies.
Introduction
Livestock innovations such as improved forages have the potential to increase dairy yields, resulting in higher income and better nutrition for smallholders. With food security and poverty being pressing issues across sub-Saharan Africa (SSA), the promotion of cultivated forages has been included in the agricultural development strategies of Kenya and Ethiopia (Ericksen and Crane, 2018; Turner et al., 2019). Despite the positive effect of forages on milk yields (Osele et al., 2018), uptake amongst smallholders has remained low with the underlying reasons not being fully understood. Previous studies have provided insights into technology adoption constraints linked to household and technology characteristics but have not given sufficient attention to the wider context that enables innovation processes (Kebebe et al., 2015). Studies that have looked at the wider context note the importance of building capacity across the whole innovation system and value chain (Ayele et al., 2012).
This study seeks to add to the literature on how wider contextual and institutional factors affect forage adoption. To achieve this, an Agricultural Innovation Systems (AIS) framework is employed which looks at innovation through a wide lens, capturing the institutional environment and the actors within it. Village-level data collected from Kenya and Ethiopia in 2015 is then used to answer the research question ‘what can the characteristics of villages in Ethiopia and Kenya tell us about the innovation system and its impact on dairy technology uptake?’
Agricultural innovation systems
AIS focus on the collective nature of innovation, emphasising the importance of co-evolutionary processes that involve a range of actors, organisations and institutions. These components of AIS interact and adapt over time, creating a complex and non-linear innovation process. Within innovation systems, the enabling environment is where the rules and norms that govern behaviour and interactions are set. These include formal and informal institutions. If badly designed formal institutions can have a negative impact on innovation. In Kenya, for example, the devolution of dairy policies to county governments led to policies and regulations being scattered, making it difficult for a single coherent and enforceable approach to dairy development to be identified (Rademaker et al., 2016). Informal institutions can be important in governing the use of communal resources, such as grazing lands for livestock, by creating rules around their usage (Yami et al., 2011). They can also lead to the creation of groups such as Iddirs, a form of informal risk-sharing institutions in Ethiopia. Iddirs were originally set up to provide mutual aid for funerals but have since expanded to provide loans for members when they experience economic shocks.
At the centre of AIS are the organisations, actors and networks that directly contribute to the innovation process. This study focuses on smallholders who are not a homogenous group and have individual needs, motivations and risk attitudes, which need to be accounted for when designing innovations. Gender must also be considered when assessing the innovations and the innovation system as female farmers in SSA make up a significant proportion of the labour force, yet are marginalised in terms of land ownership, information access and decision-making rights, amongst other things (Phiri et al., 2022). For AIS to be effective, they should be collaborative and allow smallholders to co-design context-appropriate innovations. This collaboration process can be facilitated and supported by bridging institutions, such as extension services and stakeholder platforms, that help to actively embed smallholders in the wider system.
Innovation in forage and dairy systems
In Ethiopia, public sector actors are heavily involved in the promotion of forage use and its related services. The government provides almost all the extension services which have been criticised for failing to empower farmers due to a lack of ‘actionable strategies’ making them unable to respond to user needs (Gebremedhin et al., 2006; Tefera et al., 2010). Narrow mandates have also meant the heavily government-funded research sector has struggled to focus on non-technical issues, limiting the impact forage research has had on dairy development (Järnberg et al., 2018; Kebebe et al., 2015; Tefera et al., 2010). These barriers to innovation are further exacerbated by the high levels of bureaucracy that prevent private sector actors entering into the system (Aranguiz and Creemers, 2019).
The use of cultivated forages within Kenya is generally higher than Ethiopia, mostly due to a long tradition of using local Napier grass to feed livestock (Duncan et al., 2016). However, a lack of livestock feed is still a significant issue within the dairy sector (Njarui et al., 2021). In Kenya, the government has supported a liberalised approach to dairy, leaving many elements of the sector to be dictated by market forces and non-government actors (Kaitibie et al., 2010). This has left gaps in the formal infrastructure, particularly in access to finance, as many private lenders see smallholders as too high risk. These gaps have led to an increase in informal institutions such as savings and credit groups (Wilkes et al., 2019). Some parts of the Kenyan agricultural sector experience, and benefit from, a higher level of state involvement. For example, formal forage seed systems are governed by well-developed legal and regulatory frameworks (Creemers and Aranguiz, 2019). As a result, the Kenyan forage seed sector has government research centres, seed certification schemes and has seen improvements in seed packaging and production (Creemers and Aranguiz, 2019). However, due to a large proportion of planting materials and seeds being exchanged informally between farmers, the positive effects of forage seed regulations are constrained as they tend to be mostly focused on large formal organisations (Maina et al., 2022).
Methods
Data collection
This study uses data collected by the International Livestock Research Institute (ILRI) in Kenya and Ethiopia in 2015. Village-level data is used as forage adoption often appears to be clustered and therefore adoption decisions are likely to be affected by contextual factors. Using household-level data may limit our understanding of the scale and reasons behind forage adoption.
The villages included in the data collection were selected based on their location as forage production in both countries is concentrated in certain domains. In Kenya, counties were used to identify forage production domains. Counties are the first administrative unit in the country and typically account for around 500,000 to 2 million people (Kenyan Bureau of Statistics, 2019). In Ethiopia, forage production is far more limited meaning woredas, the third administrative unit, were used to identify forage production domains. There were 769 woredas registered in Ethiopia in 2008 (Yilmaz and Venugopal, 2008), with an average of 108,000 people per woreda (The World Bank, 2022).
The location selection in Kenya began with identifying general areas of the country where sufficient forage was grown. Five regions were chosen: Upper Rift, Western, Nyanza, Central and Coast. The counties within these regions were then ranked based on their dairy density, which is a good indicator of forage demand. Various datasets were used to determine dairy density and a final list of 12 counties was identified. These were, from West to East, Homa Bay, Bungoma, Kisii, Kakamega,Nyamira, Trans-Nzoia, Nandi, Uasin, Nyandarua, Kiambu, Murang’a and Kilifi.
In Ethiopia, four regions were selected based on their forage production. These were: Oromiya, Southern Nations, Nationalities and Peoples Region (SNNP), Amhara and Tigray. Expert knowledge was then used to select 20 woredas within these regions that were most relevant for forage production. The woredas were, from West to East in each region, Diga, Sibu Sire, Ejerie, Ada’a, Walmara, Gerar Jarso and Chrio Zuria in Oromiya; Sodo Zuria, Bolossa Sore, Dale and Awasa Zuria in SNNP; Mecha, Bahir Dar Zuria, Yilmana Densa, Fogera, Farta and Dejan in Amhara and Kilte Awluaelo, Enderta and Atsbi Wenberta in Tigray. The 20 woredas contained 545 kebeles (peasant associations), the lowest administrative unit. In Kenya, villages were randomly selected from each county as group discussions on a greater level would not have yielded reliable results. In Ethiopia, kebeles were used as the final selection unit and are also referred to as villages in this study. According to local experts, kebele members would be able to provide responses regarding the whole kebele during discussions. To allow for comparisons between the different counties and woredas, an equal number of villages from each location were chosen from each. In total 360 villages were surveyed, 180 in each country. The locations of the villages are shown in Figure 1.
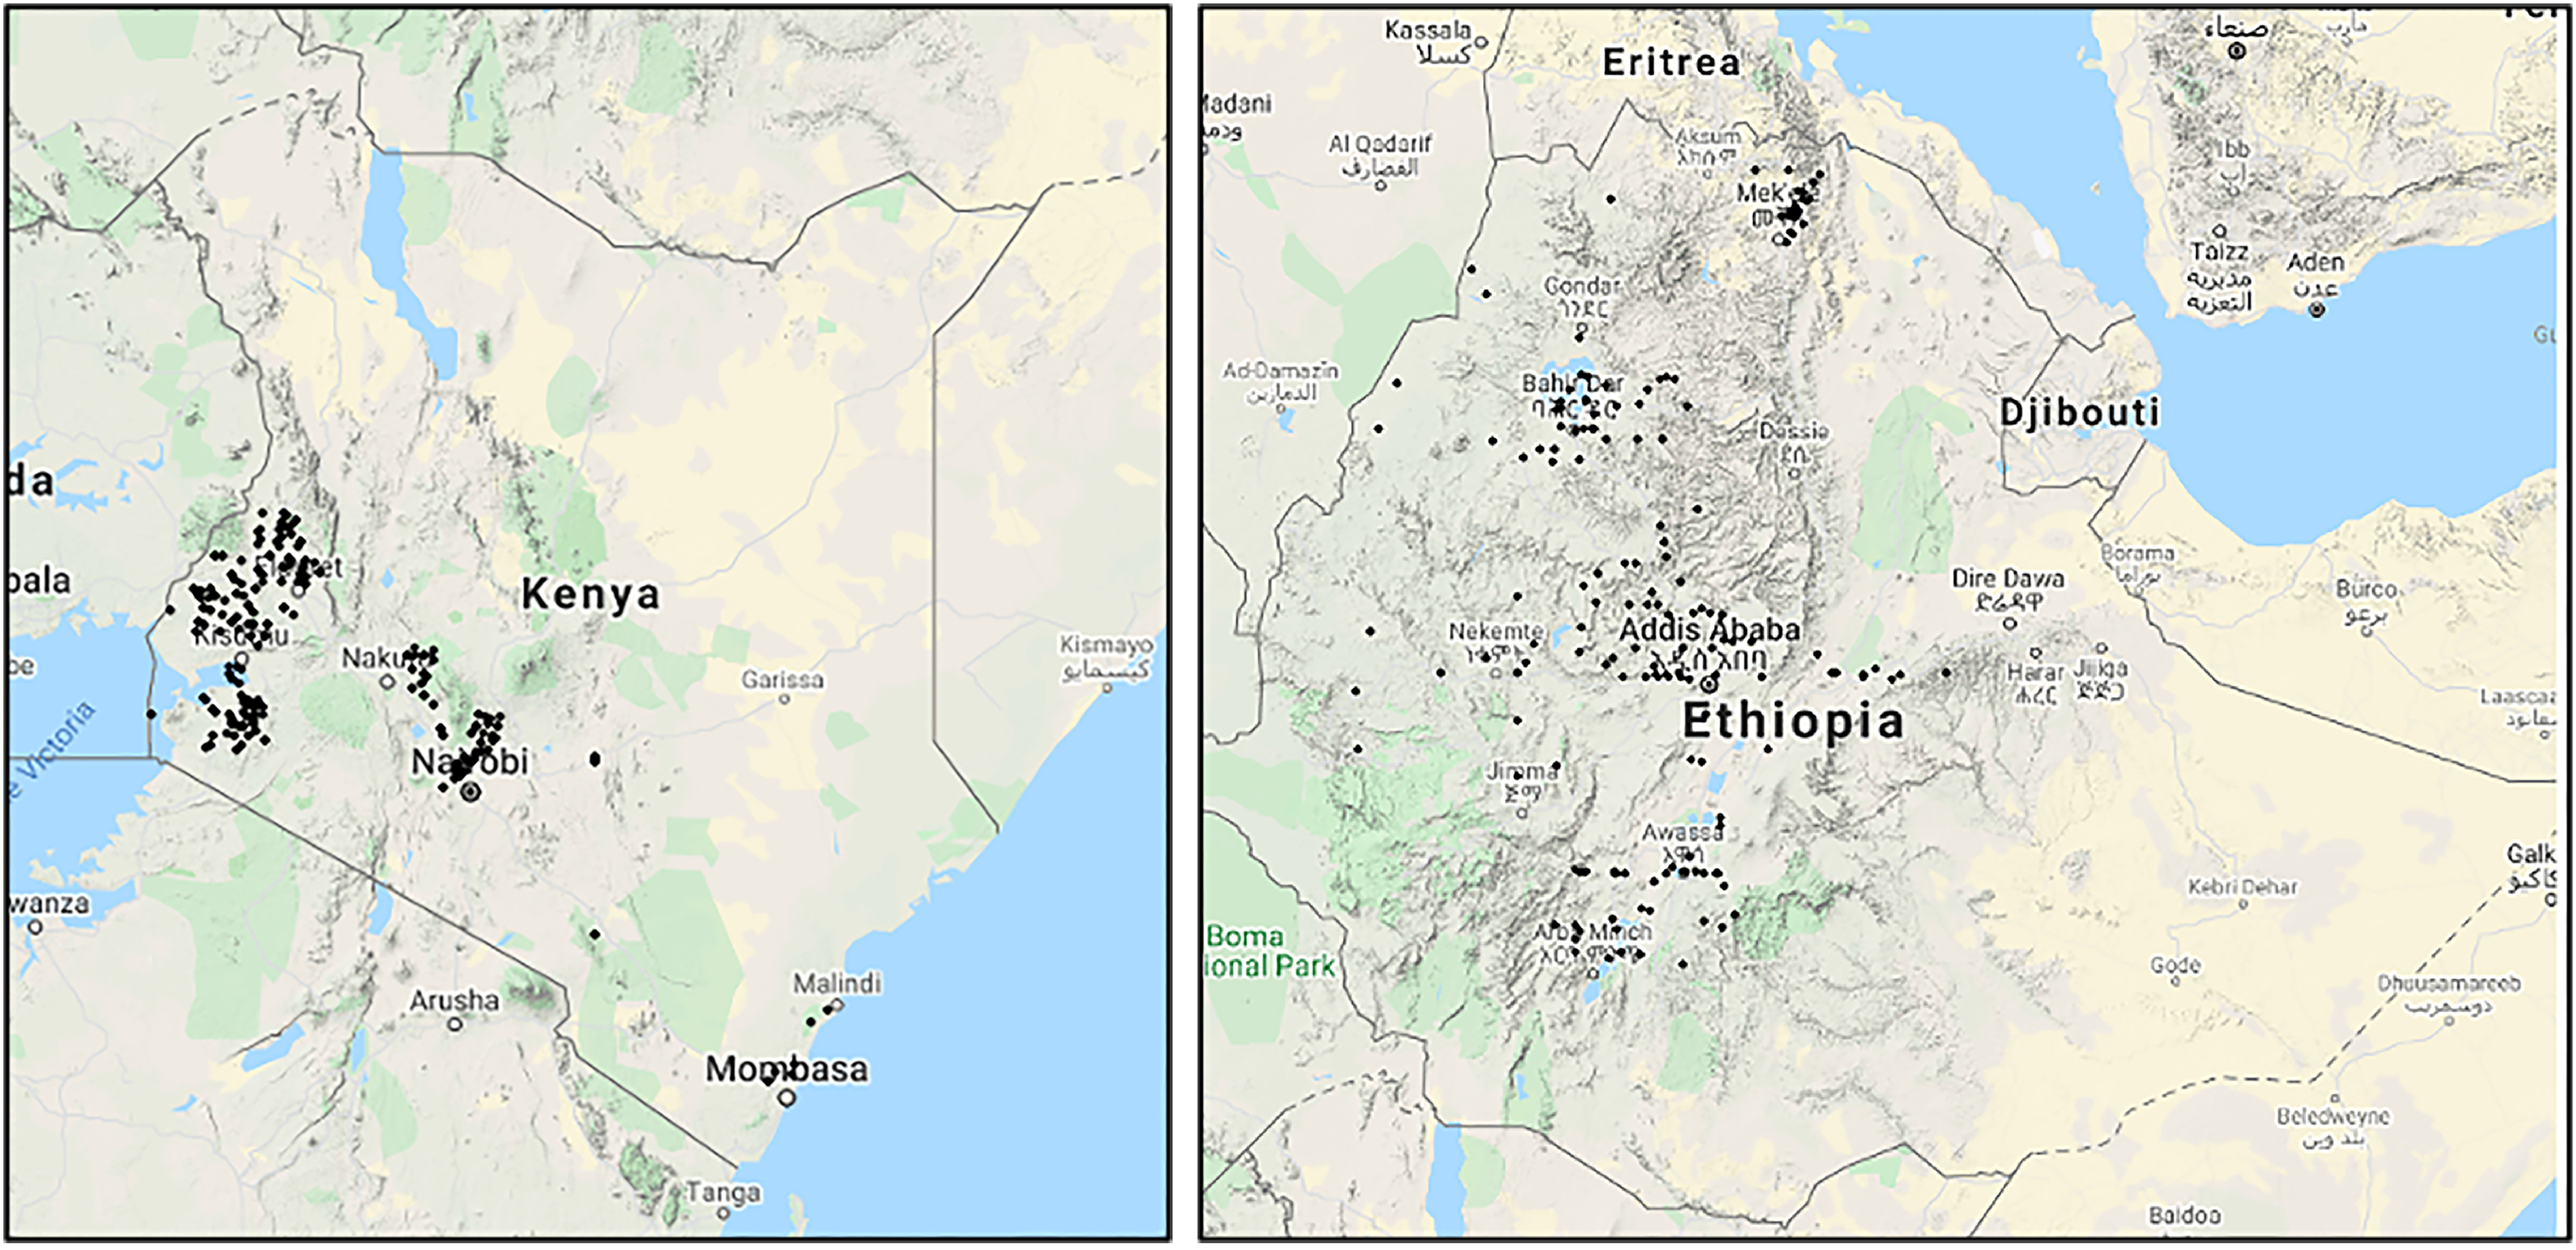
The locations of the data collection sites for this study.
In the selected villages, structured questionnaires were carried out with groups of villagers. When the villages were contacted to prepare for the group discussions, they were asked to assemble a group of 5–10 participants who had good knowledge of the village's farming matters but also were diverse in terms of gender, age, farm size and social status. Groups often included village elders and respected farmers. Expert facilitation was needed to ensure that several voices were heard during the workshop. Due to forage adoption being clustered, gathering village-level data in this way can provide a more accurate measure of forage intensity than individual household-level data. Additional questions on farming practices in the surveyed villages were also asked to provide insights into major differences in farming systems and therefore ensure that our measurement of forage intensity was relatively accurate given the wider farming context.
As the data specifically focuses on forage production areas within both countries, the results of the analysis may not be transferrable to the entire country, but it does allow cross-country comparisons.
Dependent and independent variables
To better understand the determinants of forage adoption, this study uses a Tobit regression model which is described in more detail below. The variable ‘forage intensity’ was created from the survey data to represent adoption and form the dependent variable in the subsequent statistical analysis. Forage intensity is the percentage of arable land per village that is dedicated to cultivated forages. Most static adoption models use binary independent variables that are categorised into ‘adopters’ or ‘non-adopters’. However, these models may lead to biased results as the adoption process does not necessarily have a defined endpoint. The forage intensity variable falls between 0% and 100% allowing for different levels of adoption to be captured. As the AIS paradigm emphasises that adoption is a process, it was important to select a variable that was able to capture this.
Figure 2 shows the distribution of forage intensity for Kenya and Ethiopia. In both countries, forage intensity is skewed to the left, with many values gathered around 0%.
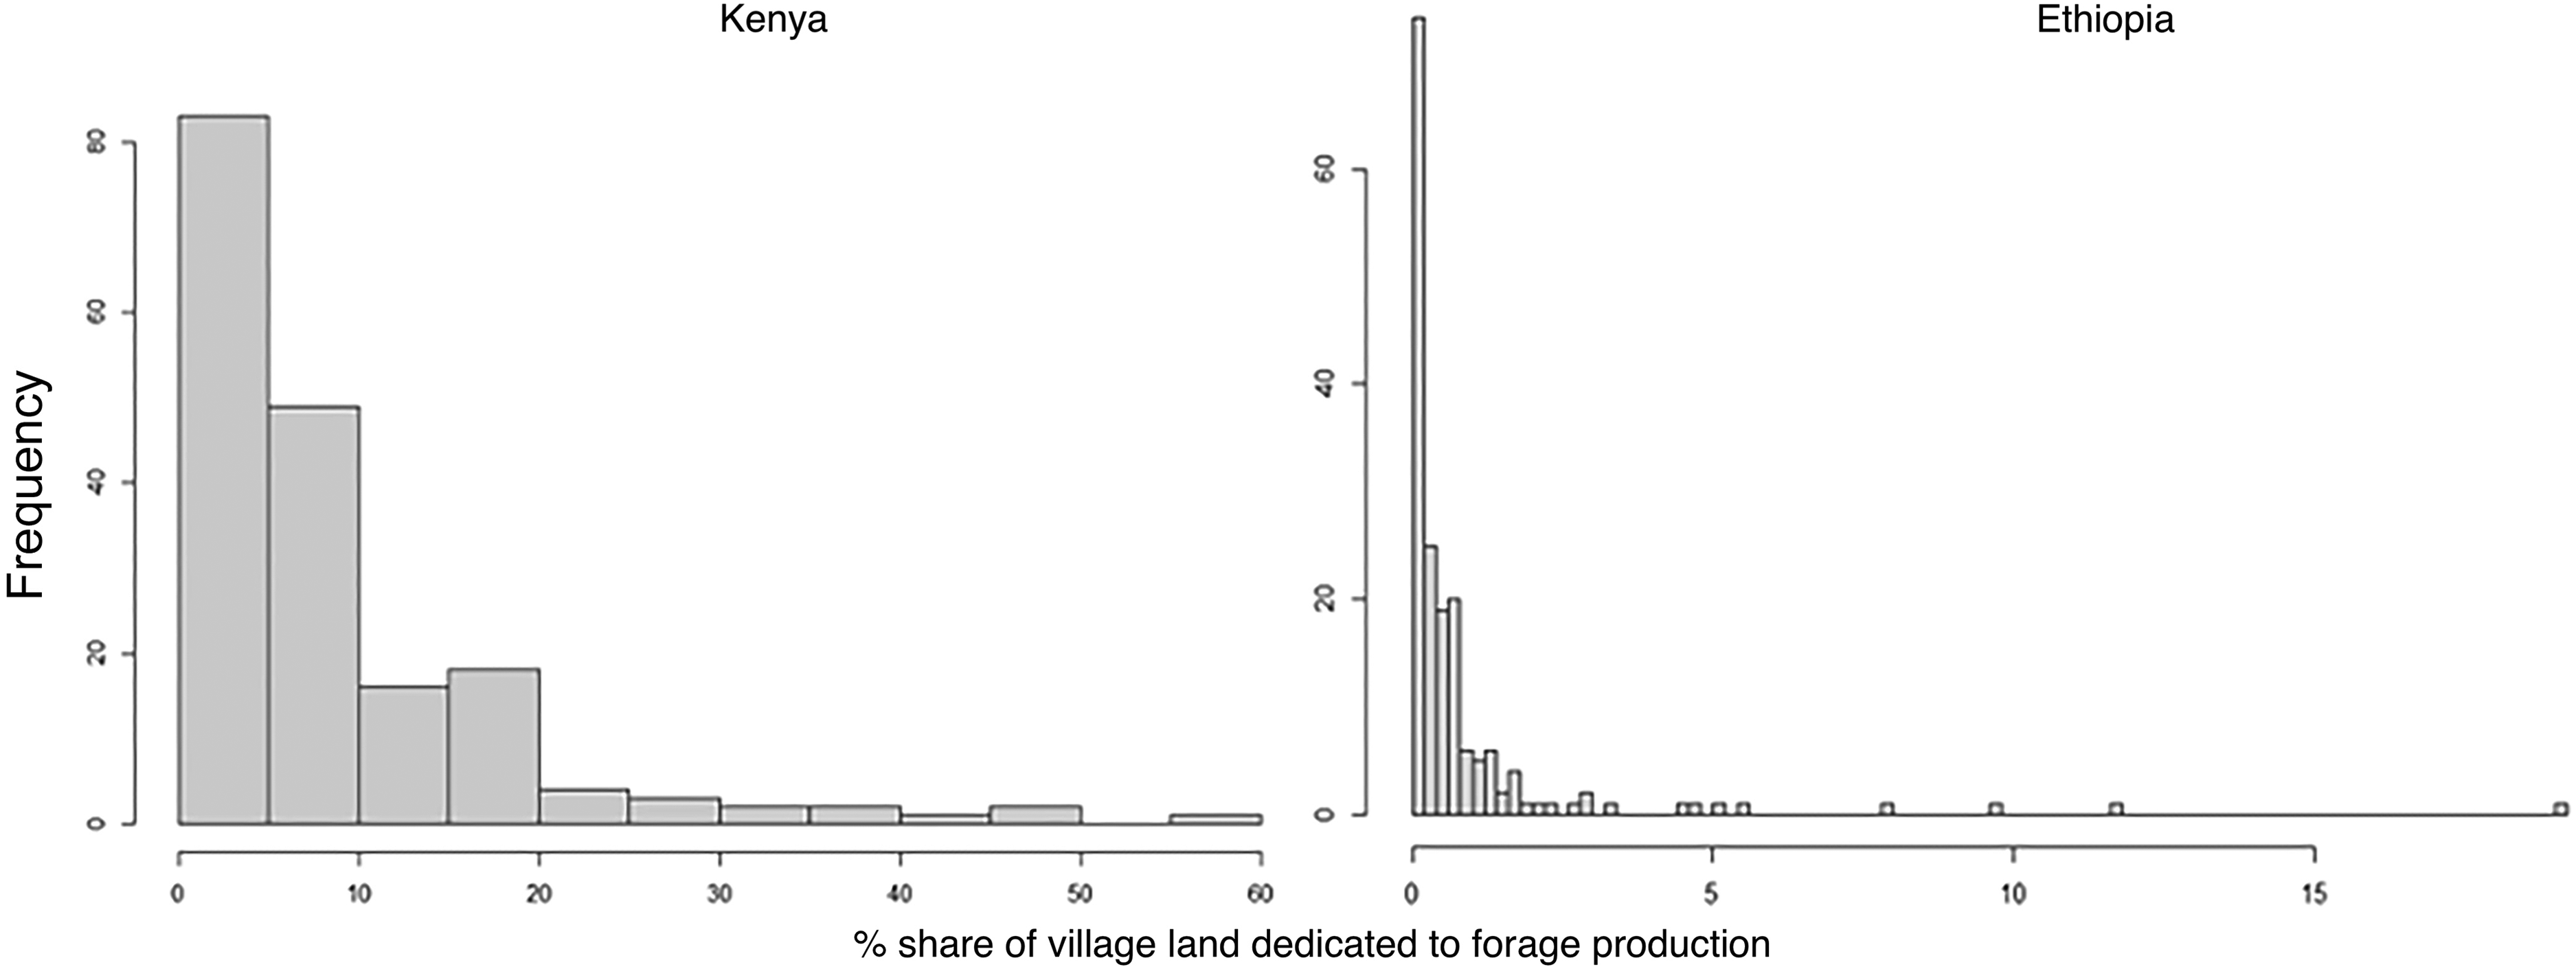
The frequency of forage intensity rates in the Kenyan and Ethiopian villages included in this study.
Eleven independent variables were selected to be included in the statistical analysis; these are detailed in Table 1.
Descriptions of the independent variables used in the statistical analysis.
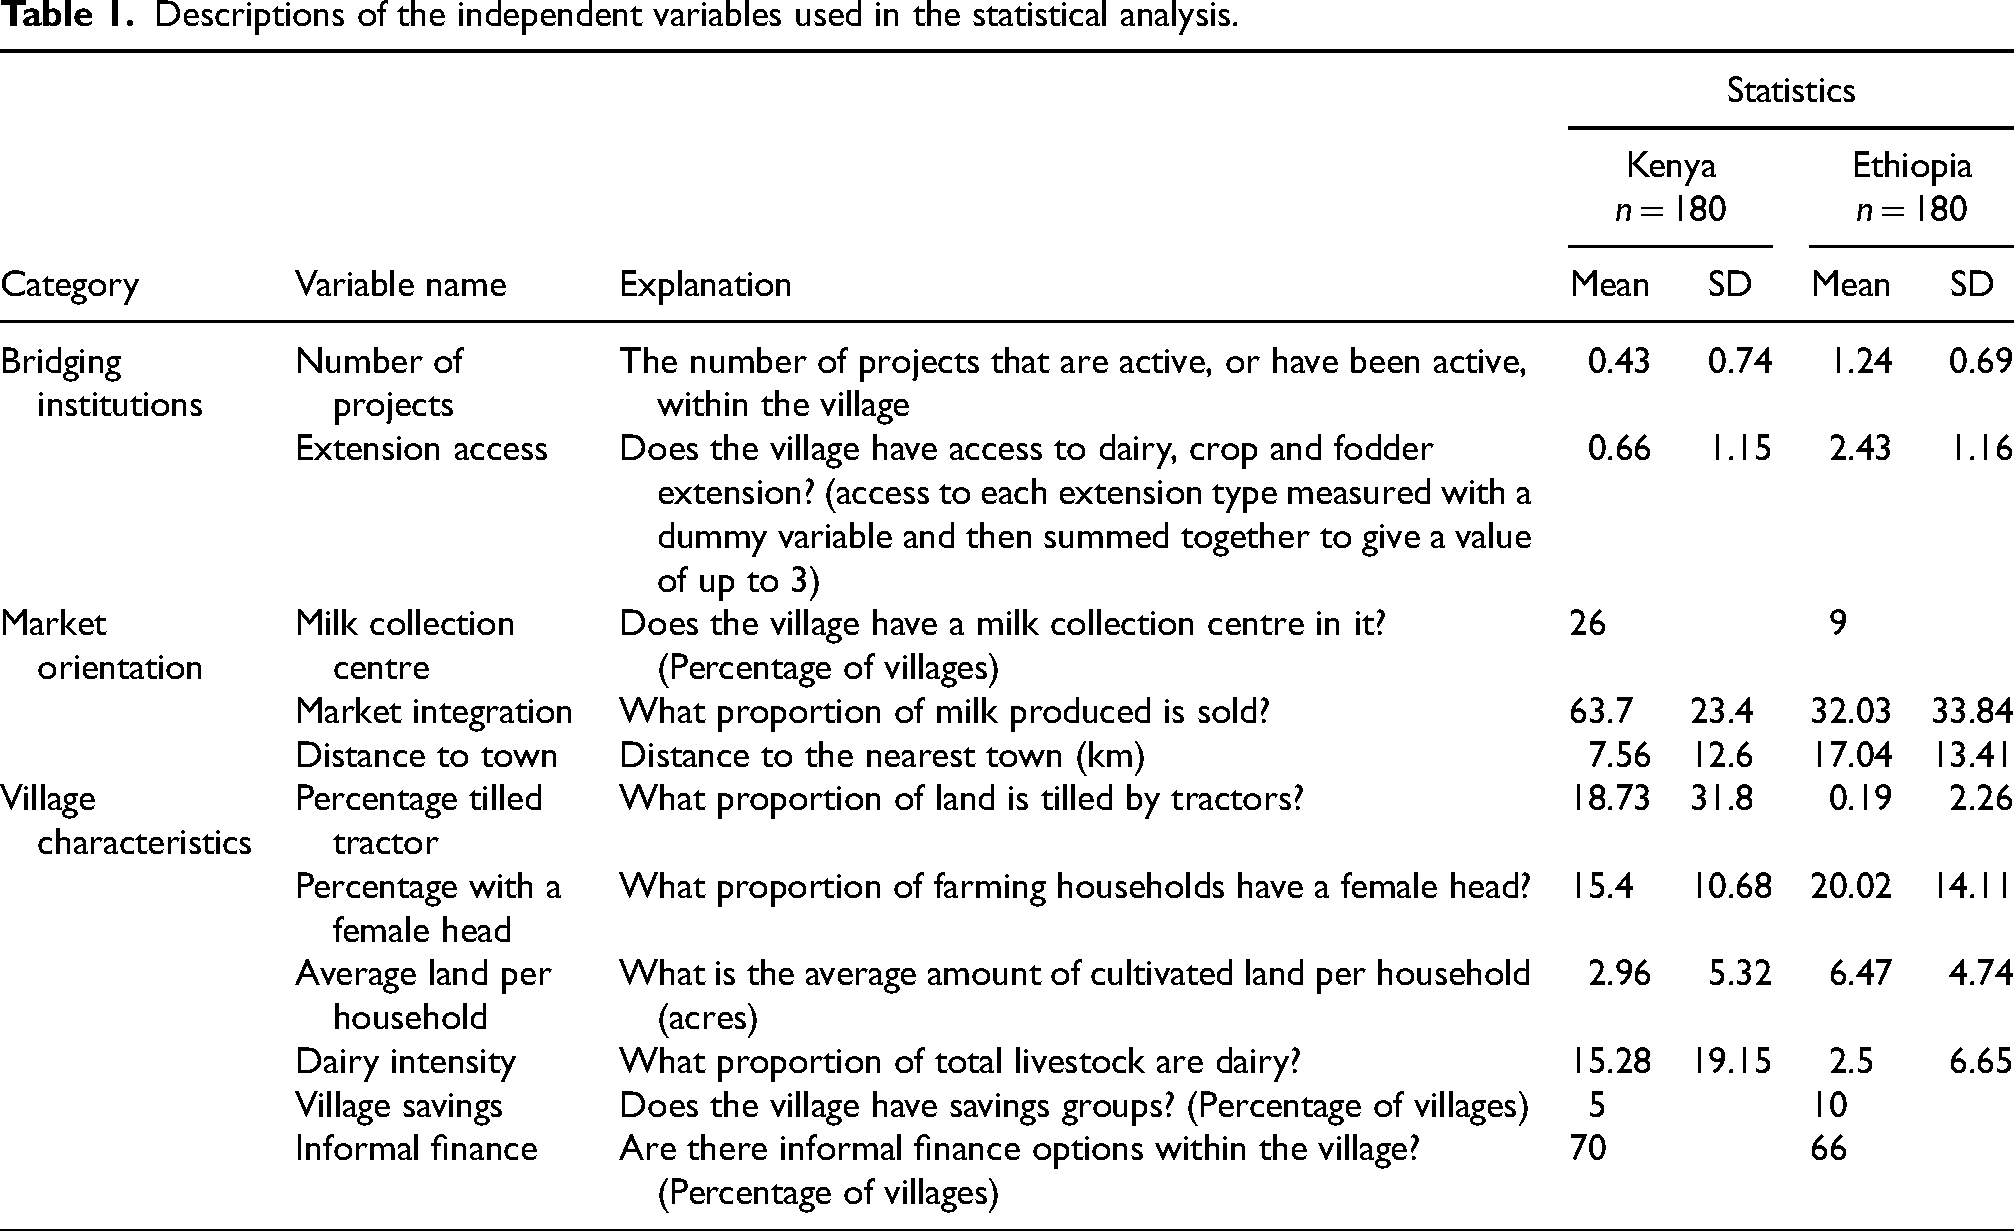
To provide insight into how market-orientated smallholders are, the variables market integration, access to a milk collection centre and distance to town centre were selected. A greater amount of market orientation increases the likelihood that farmers within the village will have access to other actors in the AIS. This can result in increased information sharing and knowledge of new innovations. The variables dairy intensity, percentage of land tilled by tractors, average land per household, percentage of households with a female head and access to informal finance and village savings were chosen to provide insight into villages and the informal institutions within them. A key element of AIS are the bridging institutions that aim to create links between smallholders and other actors within the innovation system. Due to the challenges of reaching rural populations, access to bridging organisations can differ based on location (Ergano et al., 2010). Access to extension officers and the number of forage projects in the village were both used as indications of how effective bridging organisations in the AIS were.
As well as the independent variables described in Table 1, regional dummies were included in the Tobit regression model to account for any differences in agroclimatic conditions. For Ethiopia, the country regions (i.e. SNNP) were used as dummies as most study sites were clustered close together within the regions and therefore had similar agroclimatic environments. In Kenya, study sites were divided into western, central or south-eastern regions as these areas have similar climatic conditions.
Empirical specification
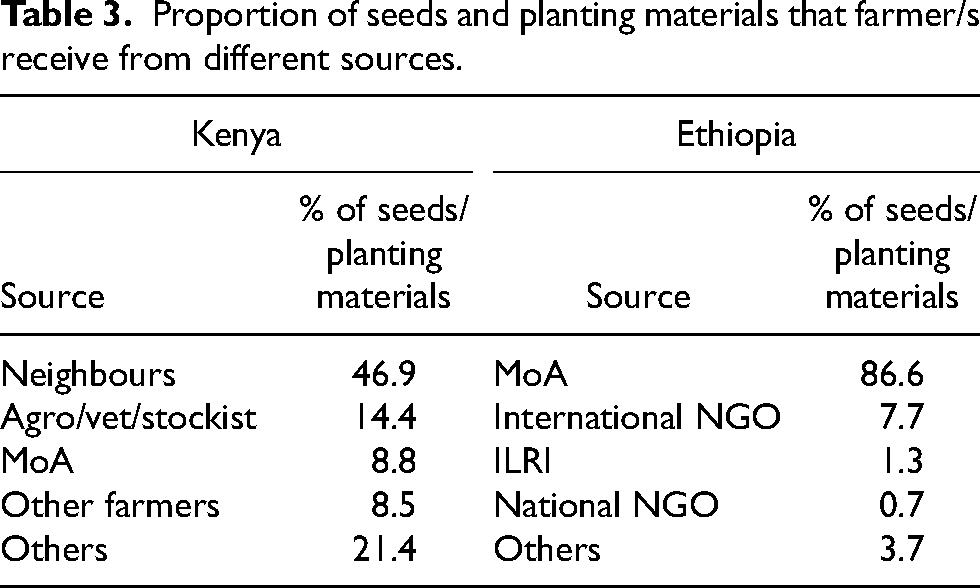
The statistical analysis uses a Tobit regression model to test which village characteristics affect the dependent variable, forage intensity. As forage intensity is measured as a percentage between 0% and 100%, it cannot fall below 0% which means that all non-adopters will be censored and will accumulate at this point. With data that is censored, it is appropriate to use a Tobit model as they are designed to estimate linear relationships between variables when there is either left or right censoring in the dependent variable. The structural equation of the Tobit model is shown below: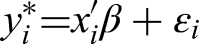
The observed values for y are defined by: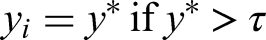
Separate Tobit regression models were estimated for Kenya and Ethiopia. As explained above, the differing characteristics and contexts of each country's innovation system require us to accommodate these in different models.
Tobit models are dependent on the assumptions of homoscedasticity and normality. Therefore, before running the models the independent variables were checked for the existence of multicollinearity using the variance inflation factor (VIF). A VIF value of over 5 can indicate the presence of multicollinearity. The highest VIF value for Ethiopia was 3.38 and for Kenya was 2.06, therefore multicollinearity is not a concern amongst the independent variables. Checks for homoscedasticity and normality where also carried out after the model was estimated and are discussed with the model results.
Results
Descriptive statistics
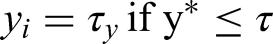
The villages surveyed contained an average of 175 households for Kenya and 1156 for Ethiopia. Within these villages, over 90% of households in both countries participated in some form of farming activity. A minority of households in both countries had access to electricity, only 18% in Kenya and 10% in Ethiopia. In Kenya, 8.7% of cropland was used to grow forages which made up 34% of the livestock feed. In contrast, only 1.6% of cropland in Ethiopia was used to grow forages which made up only 7% of livestock feed. Correspondingly, the share of farming households planting forages was higher in Kenya with 53% of households growing at least one species of forage, compared to 19% in Ethiopia (Table 2).
Descriptive statistics of study locations based on village-level aggregates.
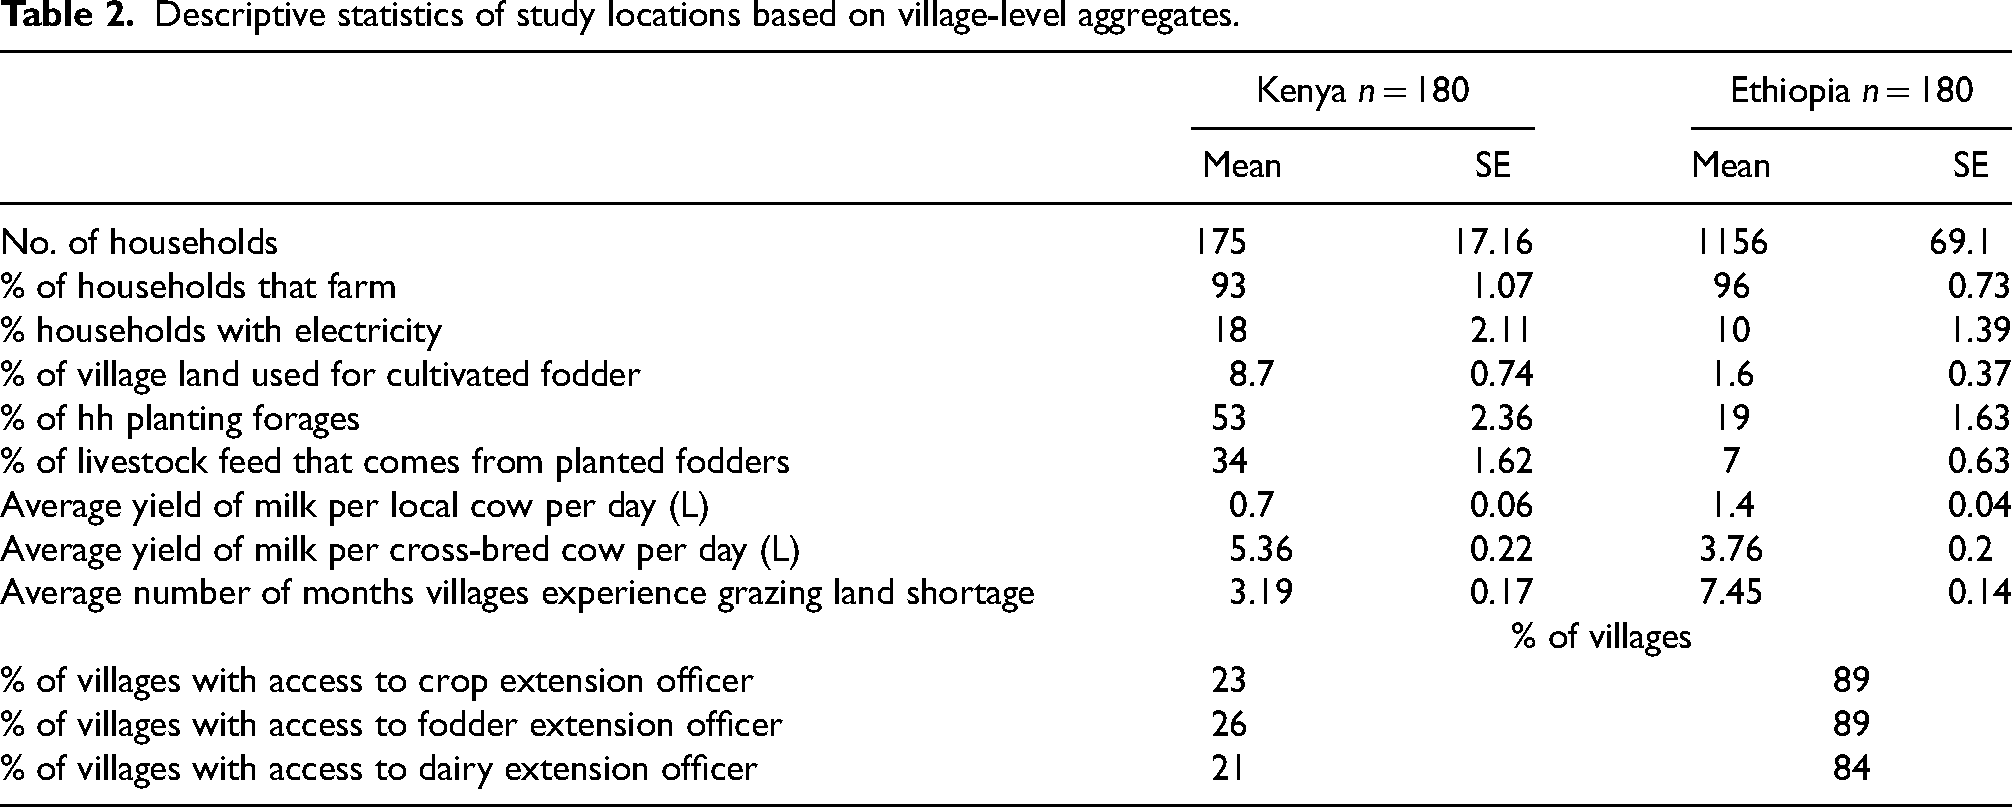
Villagers were asked where they obtained the seeds or planting materials for their cultivated forages. Some forages, such as Napier, are often shared vegetatively, that is, as splits, due to challenges of seed production and growing from seed. Table 3 shows the percentage of seeds and planting materials acquired from different sources. In Kenya, neighbours and private stockists/vets were the main sources. In contrast, in Ethiopia the Ministry of Agriculture dominated the provision of seeds and planting materials, supplying over 86%.
Proportion of seeds and planting materials that farmer/s receive from different sources.
The types of forage project organisations that are active, or have previously been active, in the villages surveyed are shown in the charts in Figure 3. International non-government organisations are the main implementers of forage projects in Kenya, whilst in Ethiopia the government runs 80% of projects.
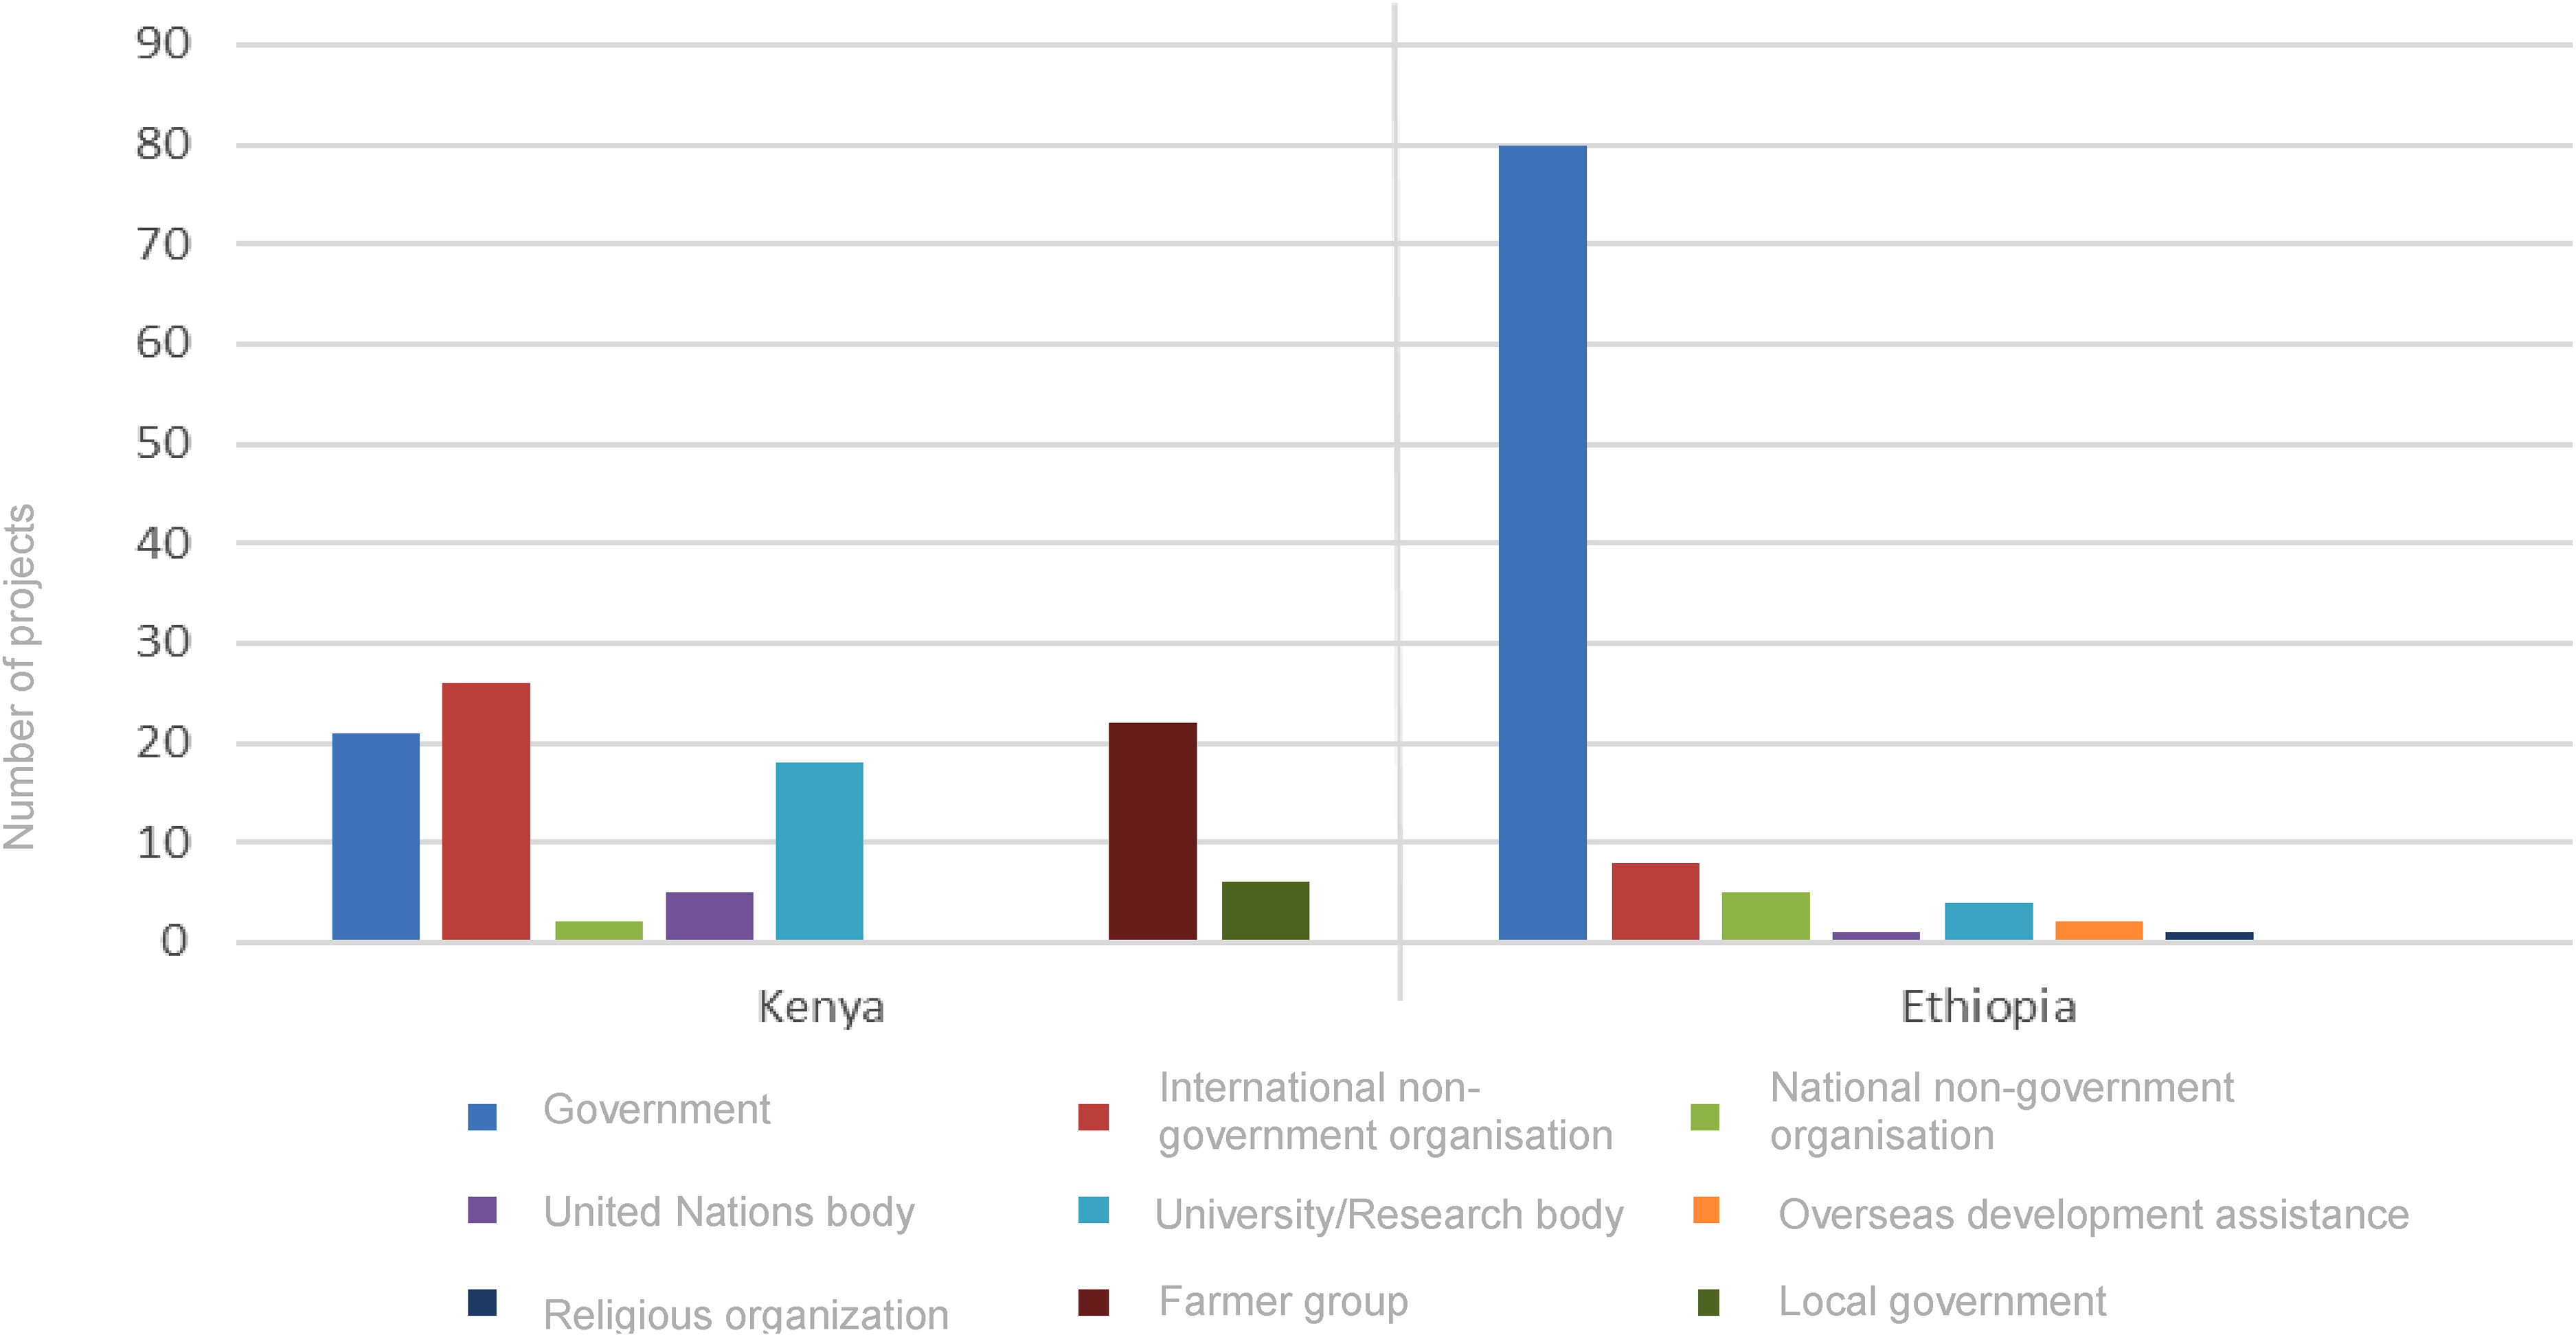
Proportion of forage projects that are run by different organisation types in Kenya and Ethiopia.
Model results
The results of the Tobit regressions are shown in Tables 4 and 5. To ensure the models met the normality requirements of a Tobit regression, the residuals of both regressions were plotted out in density plots. Both plots were skewed left, but roughly followed a normal distribution and were therefore determined to meet the normality requirement. To test for heteroscedasticity, Breusch-Pagan tests were used. The results show that heteroscedasticity was not a problem and therefore the data adequately met the criteria for a Tobit regression. The McFadden Pseudo
Tobit model results and their marginal effects for the dependent variable forage intensity in Kenya.
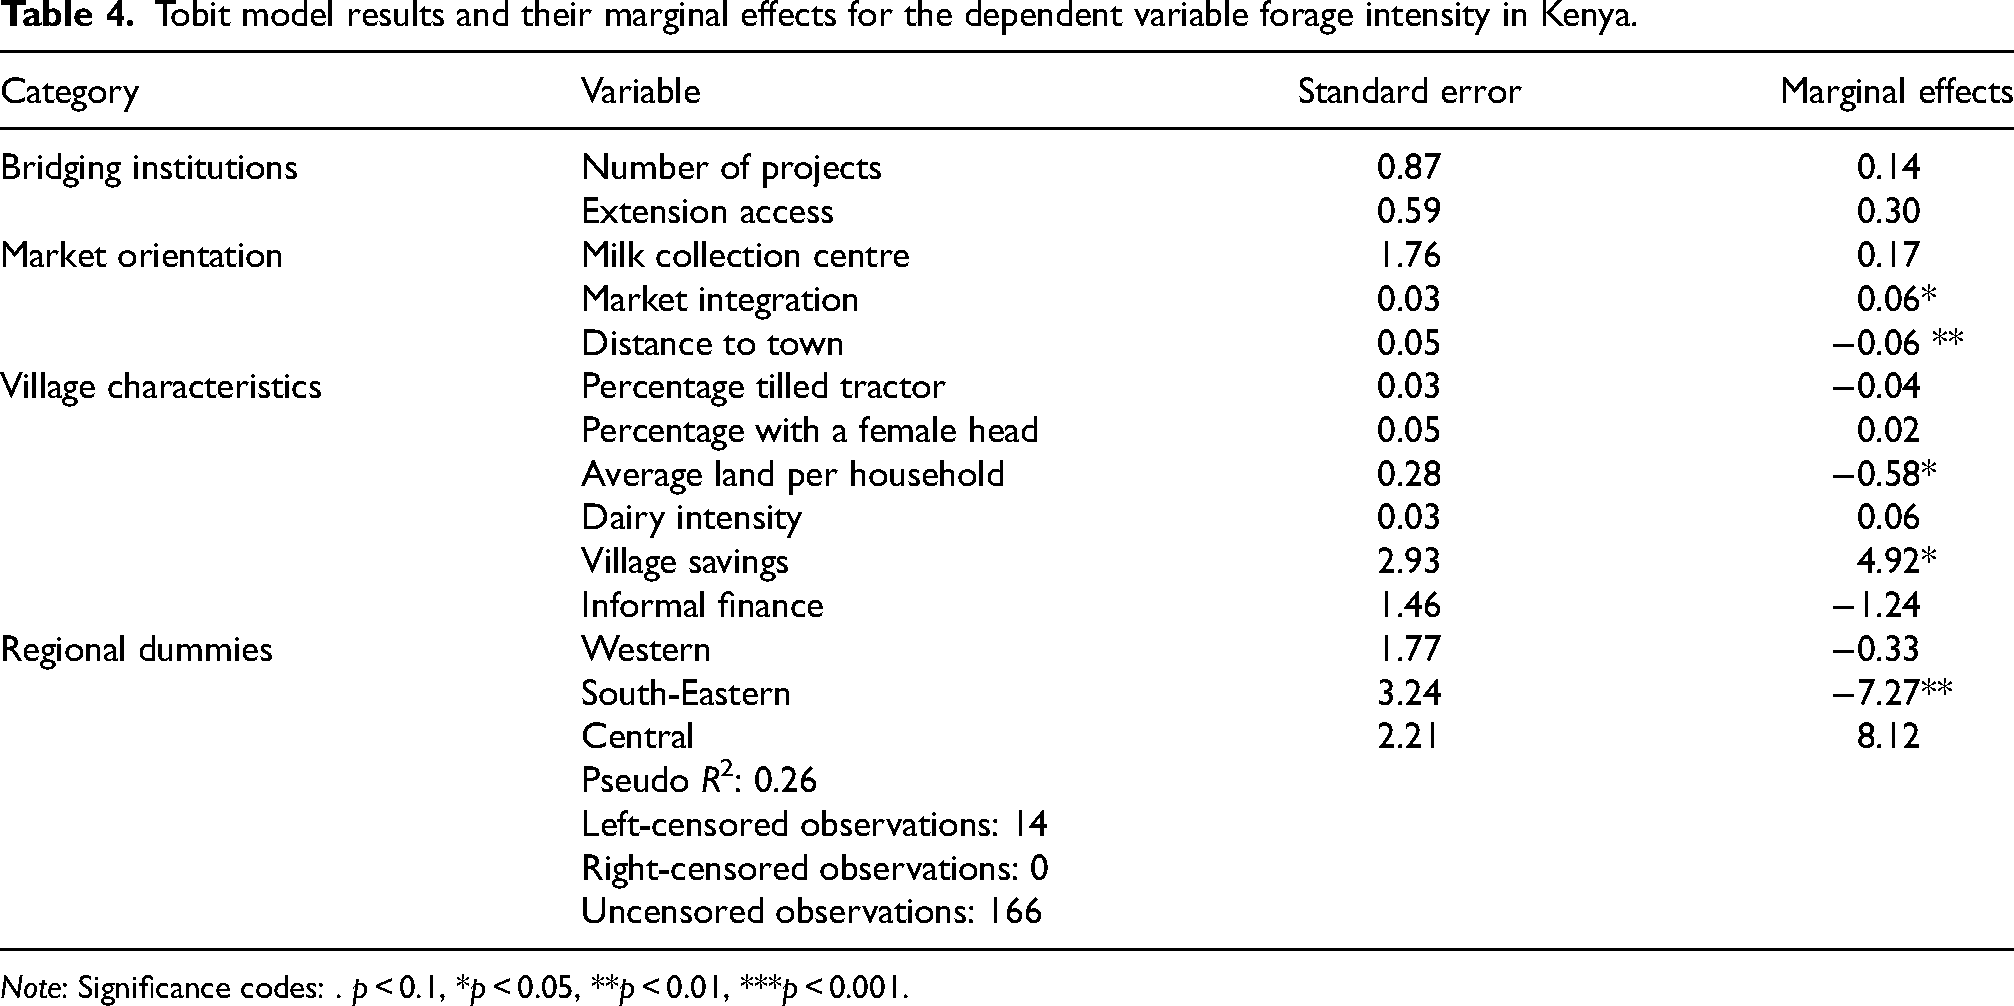
Note: Significance codes: . p < 0.1, *p < 0.05, **p < 0.01, ***p < 0.001.
Tobit model results and their marginal effects for the dependent variable forage intensity in Ethiopia.
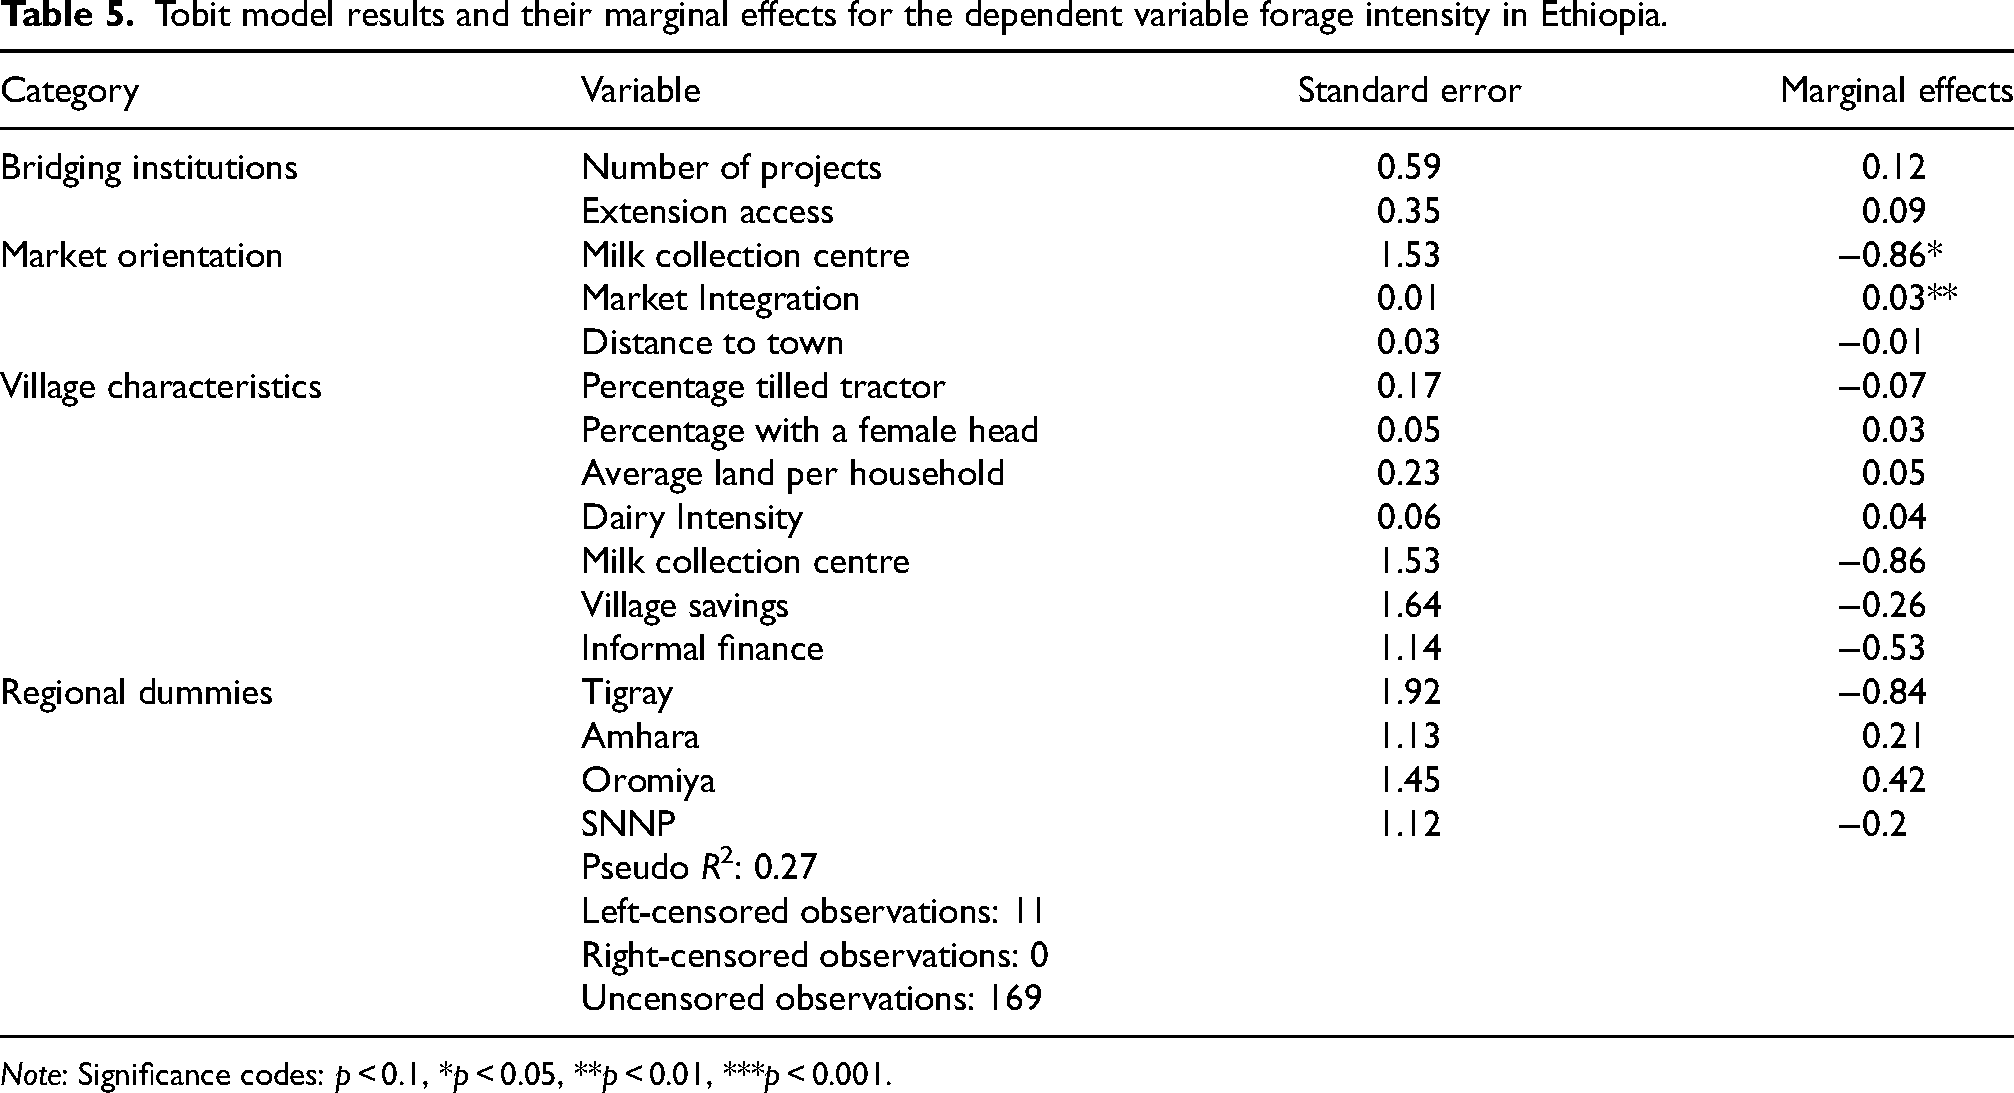
Note: Significance codes: p < 0.1, *p < 0.05, **p < 0.01, ***p < 0.001.
In Kenya, market integration and village savings were positively associated with forage intensity whilst distance to the nearest town, the average land per household and being located in the south-east of Kenya were negatively associated with forage intensity. In Ethiopia, market integration was positivity associated with forage intensity and the presence of a milk collection in a village was negatively associated with forage intensity.
The marginal effects show that in Kenya an increase of 1% of milk sold to buyers, which represents market integration, was associated with an increase of forage intensity of 0.06%. An increase in the distance to town by 1 km results in 0.06% lower forage intensity and an increase of 1 acre in the average amount of cultivated land per household results in a 0.58% decrease in forage intensity.
The marginal effects in Table 5 show that in Ethiopia, a 1% increase in market integration is associated with a 0.03% increase in forage intensity.
Discussion
Data from the survey shows that both countries are experiencing low milk yields and feed shortages. Previous studies have found that incorporating forage into livestock diets is one of the most important variables influencing the milk yield of dairy livestock (Osele et al., 2018) and that milk yields from cross-bred cows in Kenya and Ethiopia can go above 10 L/day given the right conditions (King et al., 2006; Tamiru and Amza, 2017). In the villages surveyed, average daily milk yields for cross-bred cows were far below this at around 5 L in Kenya and 4 L in Ethiopia. Shortages of fodder were experienced, on average, over 3 months a year in Kenya and more than 7 months a year in Ethiopia. An increase in planted forages can help overcome this. There is therefore evidence to support the need for effective forage adoption policies. This discussion section looks at the different elements of the forage innovation system and the effects they have on forage adoption. It concludes with how policies can be designed to effectively promote the uptake of forages in both countries in the future.
Bridging institutions
Extension services offer an important line of communication between smallholders and other AIS actors. In recent years there has been a shift towards farmer-to-farmer extension where a few farmers are trained and then expected to educate and train their peers themselves (Kiptot and Franzel, 2015). This approach to extension is in-line with the idea that for AIS to be successful, farmers and their needs must be at the centre. This study does not capture the effects of these newer extension approaches, instead, it focuses on access to traditional extension officers.
Access to extension officers was not a determinant of forage intensity in Kenya. Lower numbers of extension officers and preferences for alternative extension methods may explain this. For example, Table 3 shows that over half the seeds and planting materials for the forages in Kenya come from farmers or neighbours, suggesting a farmer-to-farmer extension approach may be effective as farmers already share information and materials. The reliance of farmers on their peers for information regarding forages was acknowledged by Wambugu et al. (2011) who stated that farmer-to-farmer information transmission is the main driving force behind forage diffusion in Kenya.
The fact that over 80% of the Ethiopian villages surveyed had access to fodder, dairy and crop extension officers supports previous claims that Ethiopia has one of the most extensive agricultural extension systems in the world (Berhane et al., 2018) with extension workers present in ‘every rural community’ (Berhanu and Poulton, 2014: 207). However, the regression analysis showed that access to extension officers did not have a significant impact on forage intensity. This result needs to be interpreted with some caution due to the high prevalence of extension officers and therefore little variation. The extension system in Ethiopia is dominated by the government, with the data showing that the Ministry of Agriculture provided over 80% of forage seeds/planting materials and ran over 80% of the forage projects. This strong government presence within the Ethiopian agricultural sector has been argued to have crowded out other actors (Spielman et al., 2010) increasing the reliance of farmers in rural locations on the public extension system. Albore (2018) argued that these extension services have failed, in part, due to institutional problems. Poor public extension services with limited alternative information sources may have contributed to the overall low levels of forage adoption in Ethiopia.
Development projects focused on forage promotion appeared to have had little effect on forage intensity, despite results indicating that they had provided a considerable share of seeds and planting material in Ethiopia and international NGOs being the most active type of institution providing seeds and planting material in Kenya. The clustered nature of forage adoption had been previously explained by the geographical concentration of individual development projects.
Market orientation
Distance from town centres is often used as a proxy for market access, meaning in Kenya lower levels of market access were associated with lower levels of forage intensity. This combined with the positive relationship between market integration and forage intensity indicates that in Kenyan villages where farmers are more market orientated, there tends to be more forage adoption.
The milk market in Kenya is governed by both formal and informal institutions and can bring together AIS actors to exchange both knowledge and milk. The informal milk market in Kenya accounts for around 80% of marketed milk (Blackmore et al., 2022). These markets operate on a trust-based system in relation to quality and safety (Blackmore et al., 2022). Information shared at these markets is likely to be more accepted because strong informal institutions already exist which reinforce the trustworthiness of other market participants. Knowledge of forage technologies may therefore be exchanged at markets resulting in higher levels of adoption. There is also a formal milk market in Kenya where buyers such as cooperatives and private companies purchase milk from smallholders if it passes formal safety checks. These types of buyers often offer smallholders training and access to inputs which may result in higher forage use. Being more market orientated also indicates a stronger focus on dairy production as a business, which may result in farmers being more willing to invest in forage technologies to improve their production.
In Ethiopia, market integration also had a positive effect on forage intensity, whilst the presence of a milk collection centre in a village had a negative effect. As previously discussed, the Ethiopian government dominates many of the bridging institutions via which smallholders receive farming information. Milk markets may offer smallholders the ability to interact with AIS actors that are not government affiliated and therefore act as an important and alternate information source. For example, formal buyers in Ethiopia such as private companies have been found to offer advice, training and credit to directly increase the capabilities of farmers (Vandercasteelen et al., 2021). It is also likely that, similar to Kenya, farmers who are selling more of their milk are more likely to invest in their milk production as a business, which may include dedicating more resources to forage production. The negative relationship between milk collection centres and forage intensity is counter-intuitive. It may be a result of the cooperatives, who usually run the collections centres, being a channel for government information transmission (Chagwiza et al., 2016), thereby reducing farmers’ exposure to private buyers and alternative knowledge sources. Therefore, the relationship between milk buyers and forage intensity, identified as a novel factor in this study, should be an area for future research.
Village characteristics
In Kenya, the average amount of cultivated land per household was negatively associated with forage intensity. This may be due to villages with greater amounts of cultivated land focusing more on the large-scale production of cash crops and therefore smallholders consider the opportunity cost of forage planting to be too high. The positive effect of village savings on forage intensity indicates that strong informal institutions exist within the village which may facilitate the sharing of trusted information and lead to high levels of adoption. Smallholders can also use the village savings to directly invest in forages and planting material.
The proportion of farming households with a female head was not a significant determinate of forage adoption in Kenya or Ethiopia. A female head indicates that the female is the main decision-maker when it comes to new technology. Previous evidence on whether female household heads are more likely to adopt innovations is mixed (Peterman et al., 2010; Lukuyu et al., 2021; Oyetunde-Usman, 2022; Njuguna-Mungai et al., 2022) with other contextual factors often being important. For example, a study in Malawi found that women were less likely to adopt seeds than men due them having less access to inputs, whereas in Zambia women had similar adoption levels to men as they benefitted from the commercialisation of farming (Djurfeldt et al., 2019). Whilst this study has tried to capture some of the contextual and institutional factors that affect forage adoption, it is far from comprehensive and does not specifically consider the interactions between these factors and gender. The use of village-level data in this study also limits our understanding of household-level dynamics which are important in understanding the role of gender. Further research is therefore needed to explore the relationship between gender and forage intensity in more depth and to understand how context affects the agency and ability of women to make adoption decisions.
Dummy variables to account for different agroclimatic zones were included in the regression analysis. These were not significant in Ethiopia, which indicates that forage adoption is low across the entire country and no specific regions have higher, or lower, levels. In Kenya however, the south-eastern region, which is made up of coastal lowlands, was negatively associated with forage intensity. Lower levels of forage adoption in this region have also been identified in previous studies (Njarui et al., 2016, 2017) and have been attributed to the larger areas of natural pastures in the region which farmers graze their livestock on.
Whilst this study is limited in the number of variables it could include and therefore does not consider every village characteristic, the absence of any relationship between the village characteristics and forage intensity in Ethiopia indicates that broader institutional factors may be more important. In line with previous discussions on the dominant role of the Ethiopian government, it may be that a lack of pluralism and the overbearing presence of a few public institutions are having a greater effect on forage adoption than village characteristics.
Conclusion
This study finds that in Kenya, market integration has a positive effect on forage intensity, whilst distance to town has a negative effect. Both these relationships indicate that farmers who are more market orientated are likely to have higher levels of forage intensity. Farmers are likely to exchange knowledge and resources at markets, which may have led to increases in forage adoption. This argument is supported by the evidence that a high proportion of forage materials are exchanged between peers. The positive relationship between village savings and forage intensity further confirms the importance of informal institutions and social interactions in adoption decisions.
This study also finds that villages located on the south-eastern coast of Kenya were less likely to adopt forages, as were villages with more average land cultivated per household. These relationships are likely due to there being more space for grazing livestock in south-east Kenya and a greater focus on cash crop production in villages with more cultivated land per household.
In Ethiopia, the positive effect of market integration on forage intensity suggests a previously unexplored relationship exists between milk buyers and forage adoption which should be a focus for future research. Private buyers may be offering an important alternative information channel for farmers. In a similar vein, the negative relationship between the presence of a milk collection centre and forage intensity may be a result of farmers who do not have access to a milk collection centre having to sell to markets and to private buyers. These findings raise questions about the effectiveness of the government's approach to forage promotion. Evidence in this study shows strong state involvement in forage projects, extension services and the provision of seeds and planting materials, yet the Ethiopian villages have lower levels of forage adoption and milk yields when compared to their Kenyan counterparts.
Whilst further research needs to be carried out to better understand some of the relationships identified in this study, and to further investigate the impact of the role of gender on forage adoption, some high-level policy conclusions can be drawn.
AIS should be pluralistic to ensure smallholders have access to multiple sources of information. Strong bridging institutions need to exist which link smallholders to other actors and which also facilitate discussions and co-learning as opposed to linear, one-way information transfers. Farmers themselves should also be encouraged to share information and knowledge with their peers; this can be done through the creation of more farmer-to-farmer extension projects or through farmer groups.
Whilst these current results directly apply to Kenya and Ethiopia, these policy conclusions are important in facilitating effective information transfer and innovation design in AIS and therefore can be applied to forage production areas across East Africa and SSA.
Limitations
The data for this research was gathered in 2015, before the COVID-19 pandemic. In the years since the data collection, it is possible that forage systems have progressed in both countries and this should be considered when interpreting the results of this study. The methods used to collect village-level data may not be entirely accurate as they rely on farmers recall and knowledge. Whilst we believe the accuracy of data gathered in this way is acceptable to draw conclusions from, it should be noted that there is scope for error. In future, multiple focus groups for each village could be carried out to reduce inaccuracies further.
This study is also limited in terms of its scope. The nature of AIS means that many actors, institutions and contextual factors are involved in innovation. This study does not consider all the actors and variables, but instead highlights some interesting relationships which are areas for future research. Finally, the use of the continuous variable forage intensity allowed a Tobit model to be estimated for the data. One of the main drawbacks of this approach is that the model jointly estimates the probability and intensity of adoption which means the same set of variables explain farmers' decisions to adopt, which is a binary, and the intensity of adoption. This may be misleading as these decisions may not be joint (Danso-Abbeam et al., 2019). Further research may want to explicitly separate these decisions and look at the determinants of each.
Footnotes
Acknowledgements
We would like to thank the farmers and villager who took part in this research. For the purpose of open access, the author has applied a CC BY public copyright licence to any Author Accepted Manuscript version arising from this submission.
Declaration of conflicting interests
The author(s) declared no potential conflicts of interest with respect to the research, authorship, and/or publication of this article.
Funding
This work was supported through a scholarship to Rosie Morrison by Scotland's Rural College and the University of Edinburgh's Global Academy of Agriculture and Food Systems. The work was also supported by the CGIAR Initiative on Sustainable Animal Productivity (SAPLING) and is supported by contributors to the CGIAR Trust Fund.