
Abstract
With only four years before the end date for the United Nations Decade of Action on Nutrition, the need to identify nutrition-sensitive and sustainable agricultural interventions that can address hunger and malnutrition cannot be more urgent. This paper assesses associations between sustainable intensification practices and dietary diversity in maize-based farming systems of Zambia and Zimbabwe. Using survey data from 1124 households, we apply an instrumental variable approach that allows to control for the fact that farmers self-select themselves into adopting sustainable intensification practices, making adoption endogenous. We also explore pathways from intensification to dietary diversity. We find significant positive associations between the adoption intensity of sustainable intensification practices (SIPs) such as minimum tillage, minimum tillage and crop rotation, and minimum tillage and intercrops and improved production and crop diversity and in turn, dietary diversity on average. These findings hinge on there being widespread adoption of SIPs. There is need for concerted efforts to address current bottlenecks that hinder widespread adoption and promote broader food group diversification to realize the nutrition related co-benefits associated with sustainable intensification.
Keywords
Introduction and background
As African agriculture transforms, there is need for intensified and climate-smart smallholder farming systems that can address the myriad of challenges, including declining soil fertility and land productivity (Jayne and Sanchez, 2021), population growth (Canning et al., 2015) and rising demand for food (van Ittersum et al., 2016), poverty, hunger and inequality, changing dietary preferences and climate risks (Hallegatte et al., 2016; IPCC, 2014; Lipper et al., 2014). Intensifying smallholder agricultural production is also necessary to achieve the 2030 sustainable development targets under the sustainable development goal (SDG) 2 of ending hunger; doubling agricultural productivity and incomes, implementing resilient agricultural practices; and providing nutritious, safe, and sufficient foods for all people (UN, 2015).
Sustainable intensification practices (SIPs) or climate smart agriculture options such as conservation agriculture (CA) practices are acknowledged as potential pathways to intensify and raise productivity of smallholder production systems (Corbeels et al., 2014, 2020; Droppelmann et al., 2017; Thierfelder et al., 2017), while delivering environmental, climate adaptation and mitigation, resilience (Braimoh et al., 2016; Pittelkow et al., 2014; Thierfelder and Wall, 2010; Thierfelder et al., 2017), and nutritional co-benefits (Mhlanga et al., 2021). Except for Mhlanga et al. (2021), much research has been devoted to assessing the livelihoods and climate benefits associated with SIPs, leaving the potential SIP-nutrition nexus under researched. We focus on the SIP-nutrition nexus in this paper and assess the extent to which (what) SIPs affect dietary diversity at the household level and explore the mechanisms to answer the how question.
Our analysis is motivated by a need to identify nutrition-sensitive agricultural interventions that can help deliver win-win outcomes in terms of sustainable productivity growth and quality diets. This is also in response to an urgent need to identify how agriculture and food systems can be more nutrition-sensitive (Sibhatu et al., 2015). We define SIPs in the spirit of Pretty et al. (2011) to include agricultural practices that raise productivity without causing negative environmental externalities. In essence, intensification can be achieved by improving input use efficiency, cropping intensity, and output-input ratios. Although SIPs vary in different contexts – and no SIPs are SIPs everywhere and all the time – options in maize-based smallholder farming systems of sub-Saharan Africa (SSA) include CA, agroforestry, improved seeds, inorganic and organic fertilizer, various integrated soil fertility management and other climate smart agriculture practices (Droppelmann et al., 2017; Jayne et al., 2019; Lipper et al., 2014; Thierfelder et al., 2017). We focus mainly on reduced or minimum tillage practices of planting basins, ripping and zero tillage which optimize input use, help build soil fertility. These tillage options are part of national policy in Zambia and Zimbabwe (Giller et al., 2015; Thierfelder et al., 2016), our focal countries. We are also interested in the role of improved seeds, inorganic fertilizers, crop diversity and crop rotation. Zambia and Zimbabwe have a long history of promoting CA among smallholders dating back to the late 1980s to early 1990s (Andersson and Giller, 2012; Haggblade and Tembo, 2003) and yet, both countries have poor scores on the global hunger index. 1
We hypothesize that SIPs like CA can influence nutritional outcomes in two main ways. First, SIPs can directly influence nutritional outcomes through productivity/production effects. If SIPs indeed raise productivity and diversification in some contexts as has been shown (Droppelmann et al., 2017; Mupangwa et al., 2017; Thierfelder et al., 2016), they can increase the availability of diverse foods from own production. If these foods are consumed by households, this in turn can improve dietary diversity, a measure of nutritional outcomes (Swindale and Bilinsky, 2006). In addition, improved crop productivity might free up land and allow for rotation and intercropping, which in turn may increase food diversity. Second, SIPs might indirectly contribute to improved dietary diversity through their secondary influence on household incomes. If there is surplus production that is sold, income from sales can be used to purchase more diverse foods. This is feasible given that SIPs improve both labor and land productivity, at least in the medium to long term. In addition, SIPs may contribute to dietary diversity by improving labor productivity. In theory, labor saved from adopting SIPs can be re-allocated to other farm or off-farm income generating activities. Incomes realized from these off-farm activities can be used to finance agricultural production (e.g., to buy improved inputs such as seed and fertilizers) or to purchase diverse foods. In sum, SIPs can directly contribute to crop-based production diversity and indirectly to commercialization, both of which can lead to better dietary diversity outcomes.
Untangling the pathways from SIPs through production diversity to consumption diversity is not trivial but possible because of the non-separability of production and consumption in smallholder agriculture. Markets play an important role (Mulenga et al., 2021; Sibhatu et al., 2015), but there are trade-offs. For example, increased production diversity might be achieved at the expense of foregone incomes from specialization (Ecker, 2018). Whether farmers diversify production or specialize will depend on market conditions and preferences, all else constant. Even if households increase sales, they may have low dietary diversity because substitution effects (driven by higher shadow prices of food) can outweigh the income effects from sales and reduce dietary diversity (Ntakyo and van den Berg, 2019). Thus, unravelling the association between SIPs and dietary diversity is an empirical question and will vary in different contexts. We focus on the direct pathway in this paper.
Several papers have assessed and found positive linkages on average, among production diversity, market participation and dietary diversity or food security in Malawi (Snapp and Fisher, 2015), Ghana (Ecker, 2018), Uganda (Ntakyo and van den Berg, 2019), Zambia (Mhlanga et al., 2021; Mofya-Mukuka and Hichaambwa, 2018; Mulenga et al., 2021), Zimbabwe (Mango et al., 2017; Mujeyi et al., 2021) and some cross-countries studies in Malawi, Mozambique, Ethiopia, Kenya and Tanzania (Mango et al., 2017; Sibhatu et al., 2015). Most of these studies use 7-day or 24-h recall periods with the latter preferred. They measure dietary diversity by asking if any member of the households consumed food from 12 pre-determined food groups during the recall period. The number of food groups consumed from the 12 is used to compute household dietary diversity scores (HDDS).
We follow a similar approach in measuring HDDS and add to previous studies in two main ways: First, to the best of our knowledge, this is the first paper that attempts to make explicit the link between CA-based SIPs and dietary diversity in maize based-farming systems at household level in Zambia and Zimbabwe using an instrumental variable approach that controls for the endogeneity of SIPs adoption. Second, beyond assessing the links between SIPs (production diversity) and dietary diversity as done in most papers, we go a step further to analyse the pathways following Ecker (2018) using Three Stage Least Squares (3SLS) as in Zeng et al. (2017).
The conceptual framework in section “Linking sustainable intensification and dietary diversity: a conceptual framework” formalizes links between SIPs and dietary diversity and section “Data and methods” discusses survey design, data sources and the empirical strategy. Results in section “Results” are discussed in section “Discussion” and the paper concludes in section “Conclusions”.
Linking sustainable intensification and dietary diversity: A conceptual framework
We identify two main pathways through which SIPs can affect nutritional outcomes (Figure 1). First, adoption and use of SIPs by farmers can directly contribute to improved dietary diversity by raising productivity and aggregate production. This in turn can improve production diversity or the number of food groups produced. SIPs raise productivity and production diversity by facilitating timely field operations such as planting and by optimizing input use, and by introducing diverse crop species through rotation and intercropping systems which, overtime, can help improve soil fertility (Thierfelder et al., 2013a, 2015b). Second, SIPs might indirectly contribute to improved dietary diversity through their secondary influence on household incomes and resilience. Admittedly, this pathway is somewhat linked to the productivity pathway. The main difference is that the productivity/production pathway is only based on crop production. SIPs improve both labor and land productivity (Thierfelder et al., 2013a, 2015a, 2015b), which can contribute to improved and diverse production, raise the chance that households might have marketable surpluses.
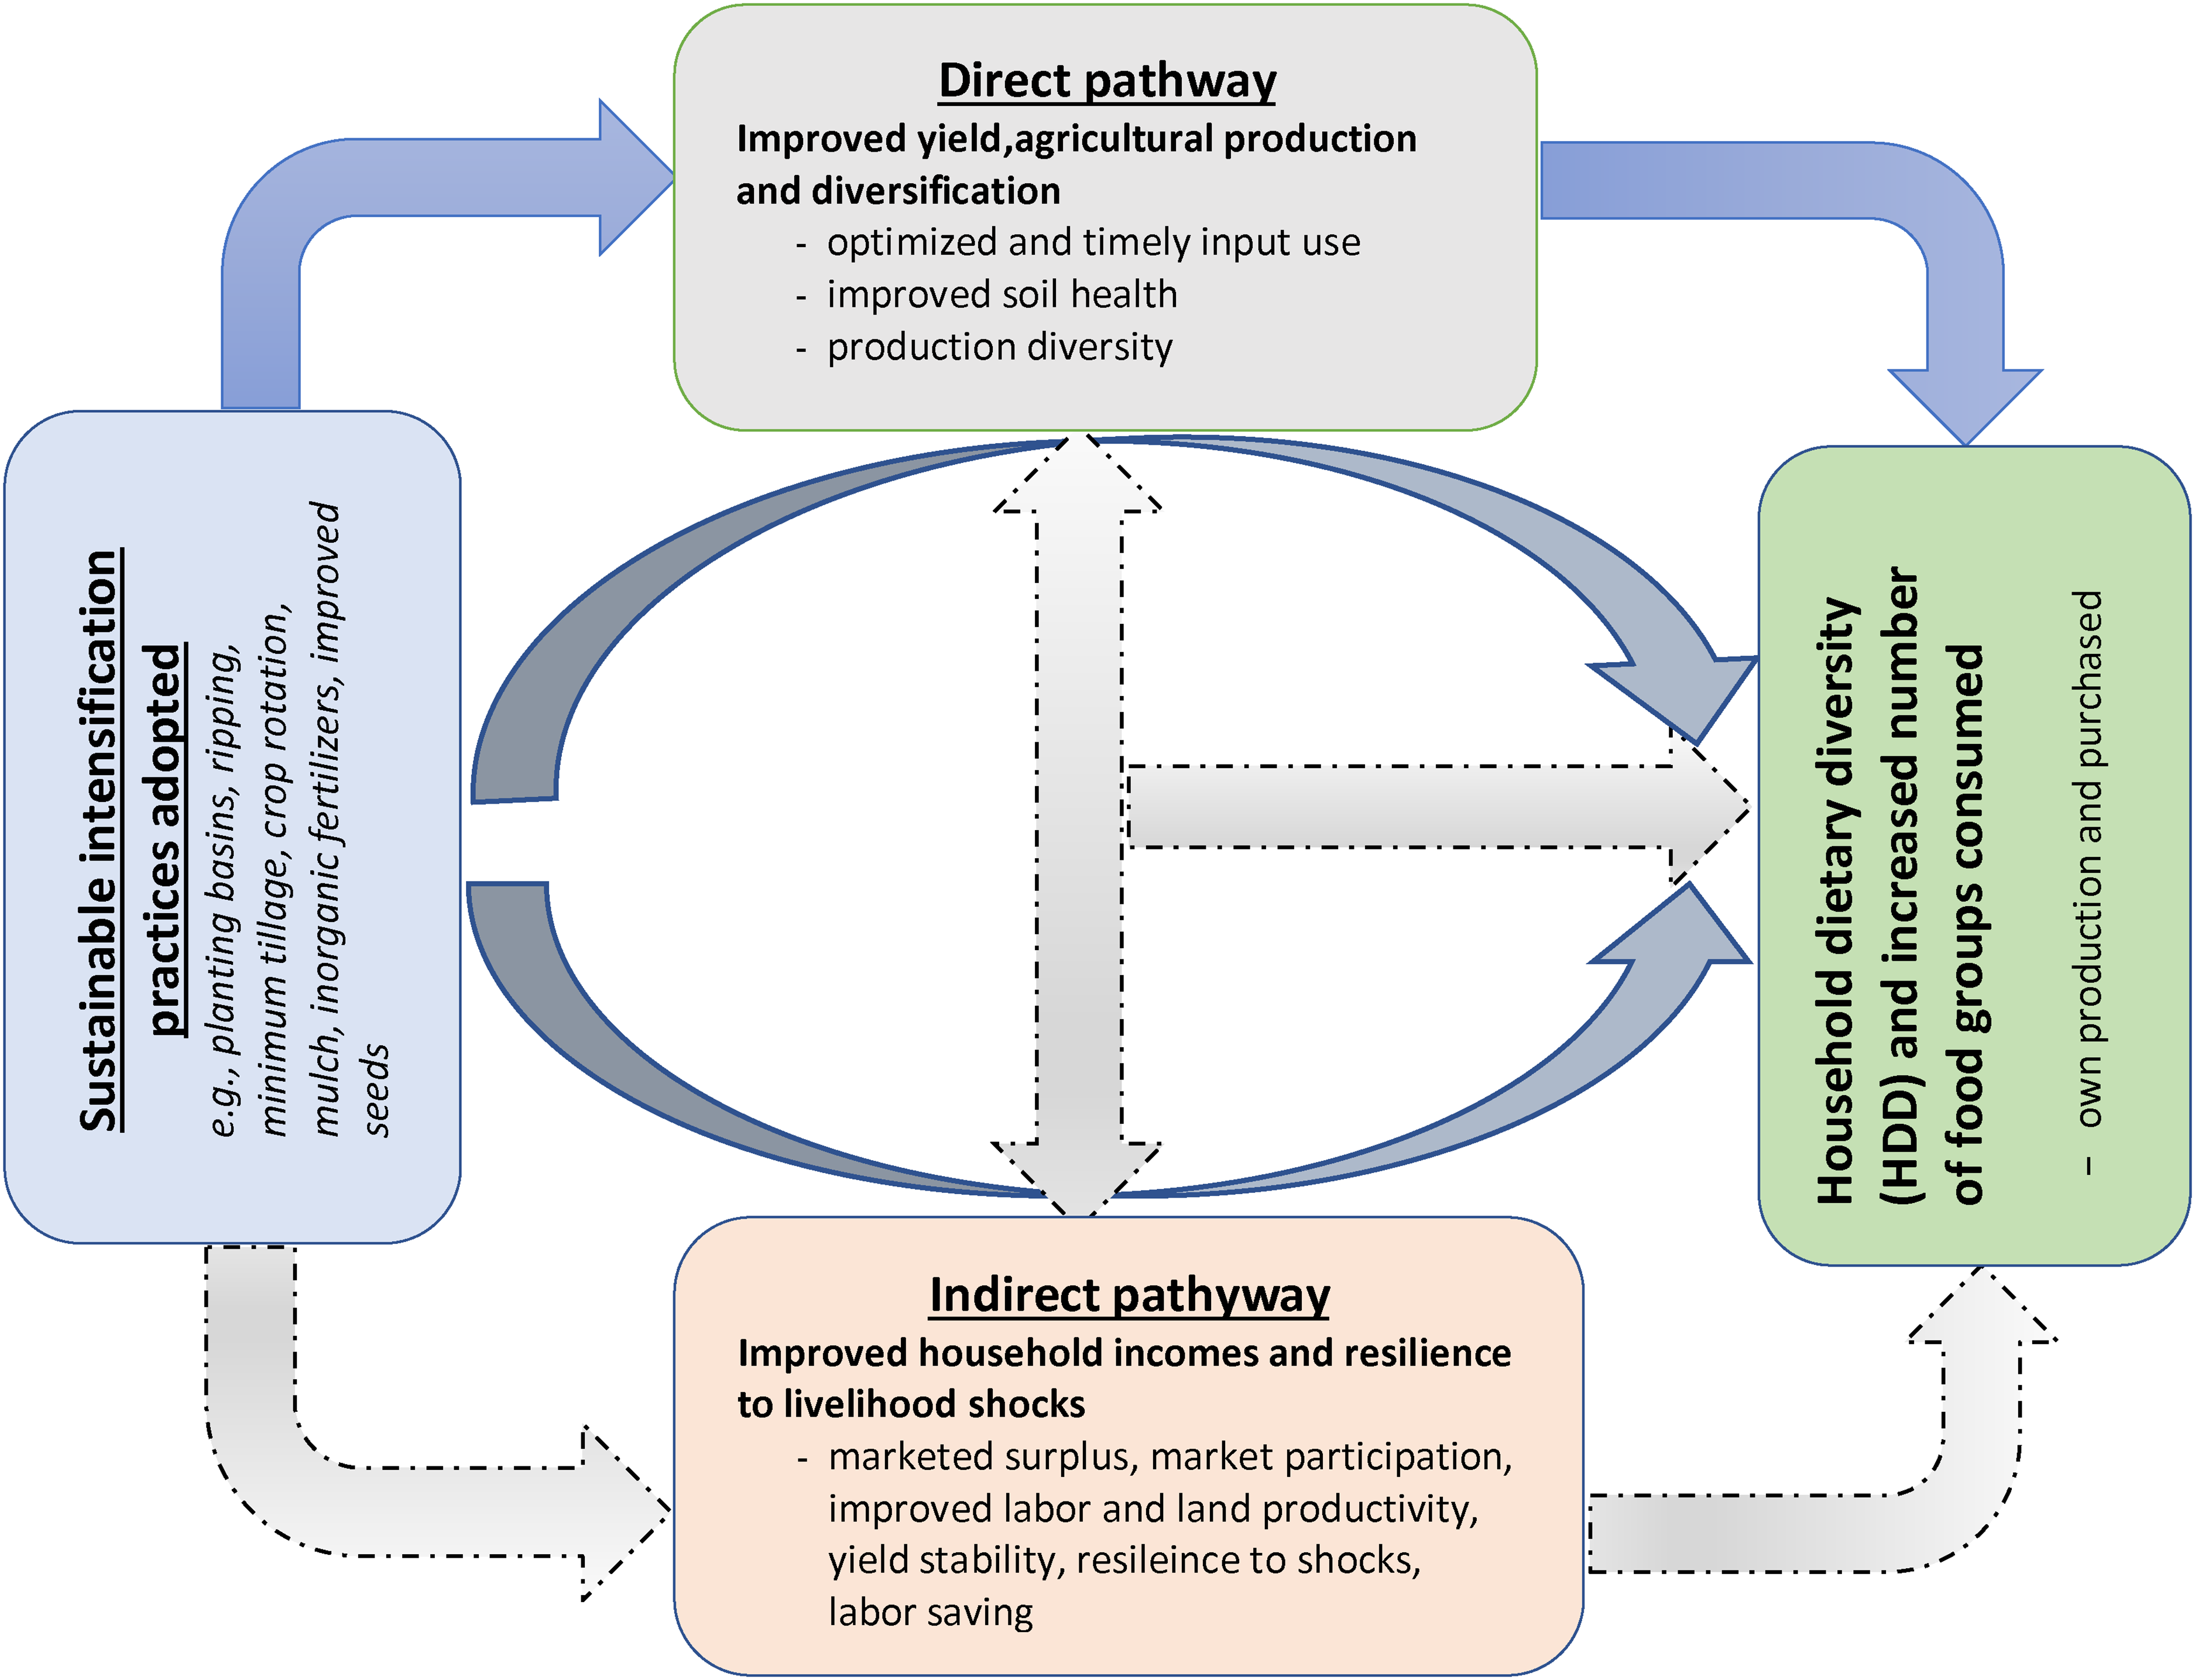
Pathways linking sustainable intensification and dietary diversity. Source: Authors’ own conceptualization.
By improving labor productivity, SIPs in theory save labor which can be re-allocated to other farm or off-farm income generating activities. Incomes realized from these off-farm activities can be used to finance agricultural production or to purchase diverse foods. This, in turn, can contribute to improved dietary diversity. Improved production, productivity, production diversity and incomes can enable households to access markets as either buyers or sellers. Improved market access and production diversity improve dietary diversity (Mulenga et al., 2021). There are other subtle ways through which SIPs might contribute to dietary diversity and these are shown by the blue arrows directly from SIPs to dietary diversity. These might include knowledge transfers received for SIPs which might include content on nutrition (e.g., nutrition education), the importance of biofortified crops and animal protein sources, and participating in development interventions that link SIPs and nutrition. These interactions are conditioned by farmer socioeconomic characteristics and farm specific factors. We mainly focus on the direct pathways in this paper and assess the extent to which SIPs affect dietary diversity through production and crop diversity.
Data and methods
Data sources and sampling strategy
Data are drawn from household surveys done in Masvingo District of Zimbabwe and in nine districts across Eastern, Northern and Southern Provinces of Zambia where the International Maize and Wheat Improvement Center (CIMMYT) has been promoting various SIPs for some time. In Zimbabwe, interventions are done in wards 13 and 17 of Masvingo District under the R4/Zambuko Rural Resilience Initiative led by the World Food Program and funded through USAID and the Swiss Development Corporation (SDC) which aims to improve the resilience and response capacity of rural farming communities in Zimbabwe. Study sites in Zambia are under the Sustainable Intensification of Smallholder Farming Systems in Zambia (SIFAZ) project funded by the European Union. The SIFAZ project aims to sustainably intensify smallholder rain-fed, maize-based farming systems in three provinces of Zambia along an agro-ecological gradient.
In both projects, CIMMYT uses an intervention approach based on ‘mother’ and ‘baby’ trials (MBT) to introduce SIPs among smallholder farmers. Mother trials are farmer-hosted, and researcher and extension-managed learning centers where farmers are exposed to a range of technologies and practices that test technologies against a control. Baby trials are managed by farmers and replicate or scale out successful technologies from mother trials. The baby trial host farmers voluntarily participate in the project to try out technologies of their choice from mother trials and start a year after mother trials are set up. MBTs started in Southern Zimbabwe in 2018 and had CA, improved maize and small grain varieties and legumes rotation on trial plots, whereas in Zambia, experimentation started in 2019 with CA, crop mixes (different rotation and intercropping strategies) and crop intensification through double and triple cropping on trial plots.
A multistage sampling approach was used in each country. In Zambia, we purposively selected all the 18 camps which host the SIFAZ research trials in the first stage. In each camp, we sampled households from among mother and baby trial host farmers, and other non-host farmers. We selected 50% from the host farmers (this includes all mother trial host farmers, and some randomly sampled baby trial hosts) and the other 50% were randomly sampled from farmers who do not host any trials under the SIFAZ project. 2 The farmers who did not host any trials under the SIFAZ project were selected from villages within a 10–20 km radius around SIFAZ mother trial hosts locations. We selected non-trial host farmers using sampling frames obtained from camp extension officers and village heads in each camp. With this strategy and based on budget constraints, we aimed to interview 228 households per province,76 households per district and 38 households per camp for a total sample of 684 in Zambia. Of these, we managed to interview 678 or 99.12% of the original sample. The survey in Zambia was conducted in Choma, Mazabuka and Monze Districts in Southern province; Chipata, Lundazi and Sinda Districts in Eastern province; and Kasama, Mbala and Senga Hill districts in the Northern province.
In Zimbabwe, we purposively selected Wards 13 and 17 in Masvingo District where CIMMYT has promoted SIPs for a longer period of up to 3 years. As a control, we selected Ward 18 where CIMMYT has had no detailed research and promotional activities. In Ward 17, we randomly selected 8 out of 10 mother host farmers, and 158 out of 200 baby trial host farmers. To make the desired sample, we randomly selected 80 households from the rest of the farmers for a total of 246. From Ward 13, we randomly selected 8 out of 10 mother trial host farmers, and 92 from the rest of the farmers. In Ward 18, we randomly selected 100 farmers for a total sample of 446 households in Zimbabwe and a pooled sample of 1124 households in the two countries. As in Zambia, sampling frames were obtained from agricultural Ward officers in liaison with village heads.
Fieldwork was conducted in March/April 2021 in Zimbabwe and June/July 2021 in Zambia. Figure 2 shows the spatial location of the sampled households in Zambia and Zimbabwe. Surveys in both countries collected detailed agricultural production and input use data (agronomic/management) at plot level, agricultural production, demographics information and dietary diversity using the 2020/2021 agricultural season as the reference period.
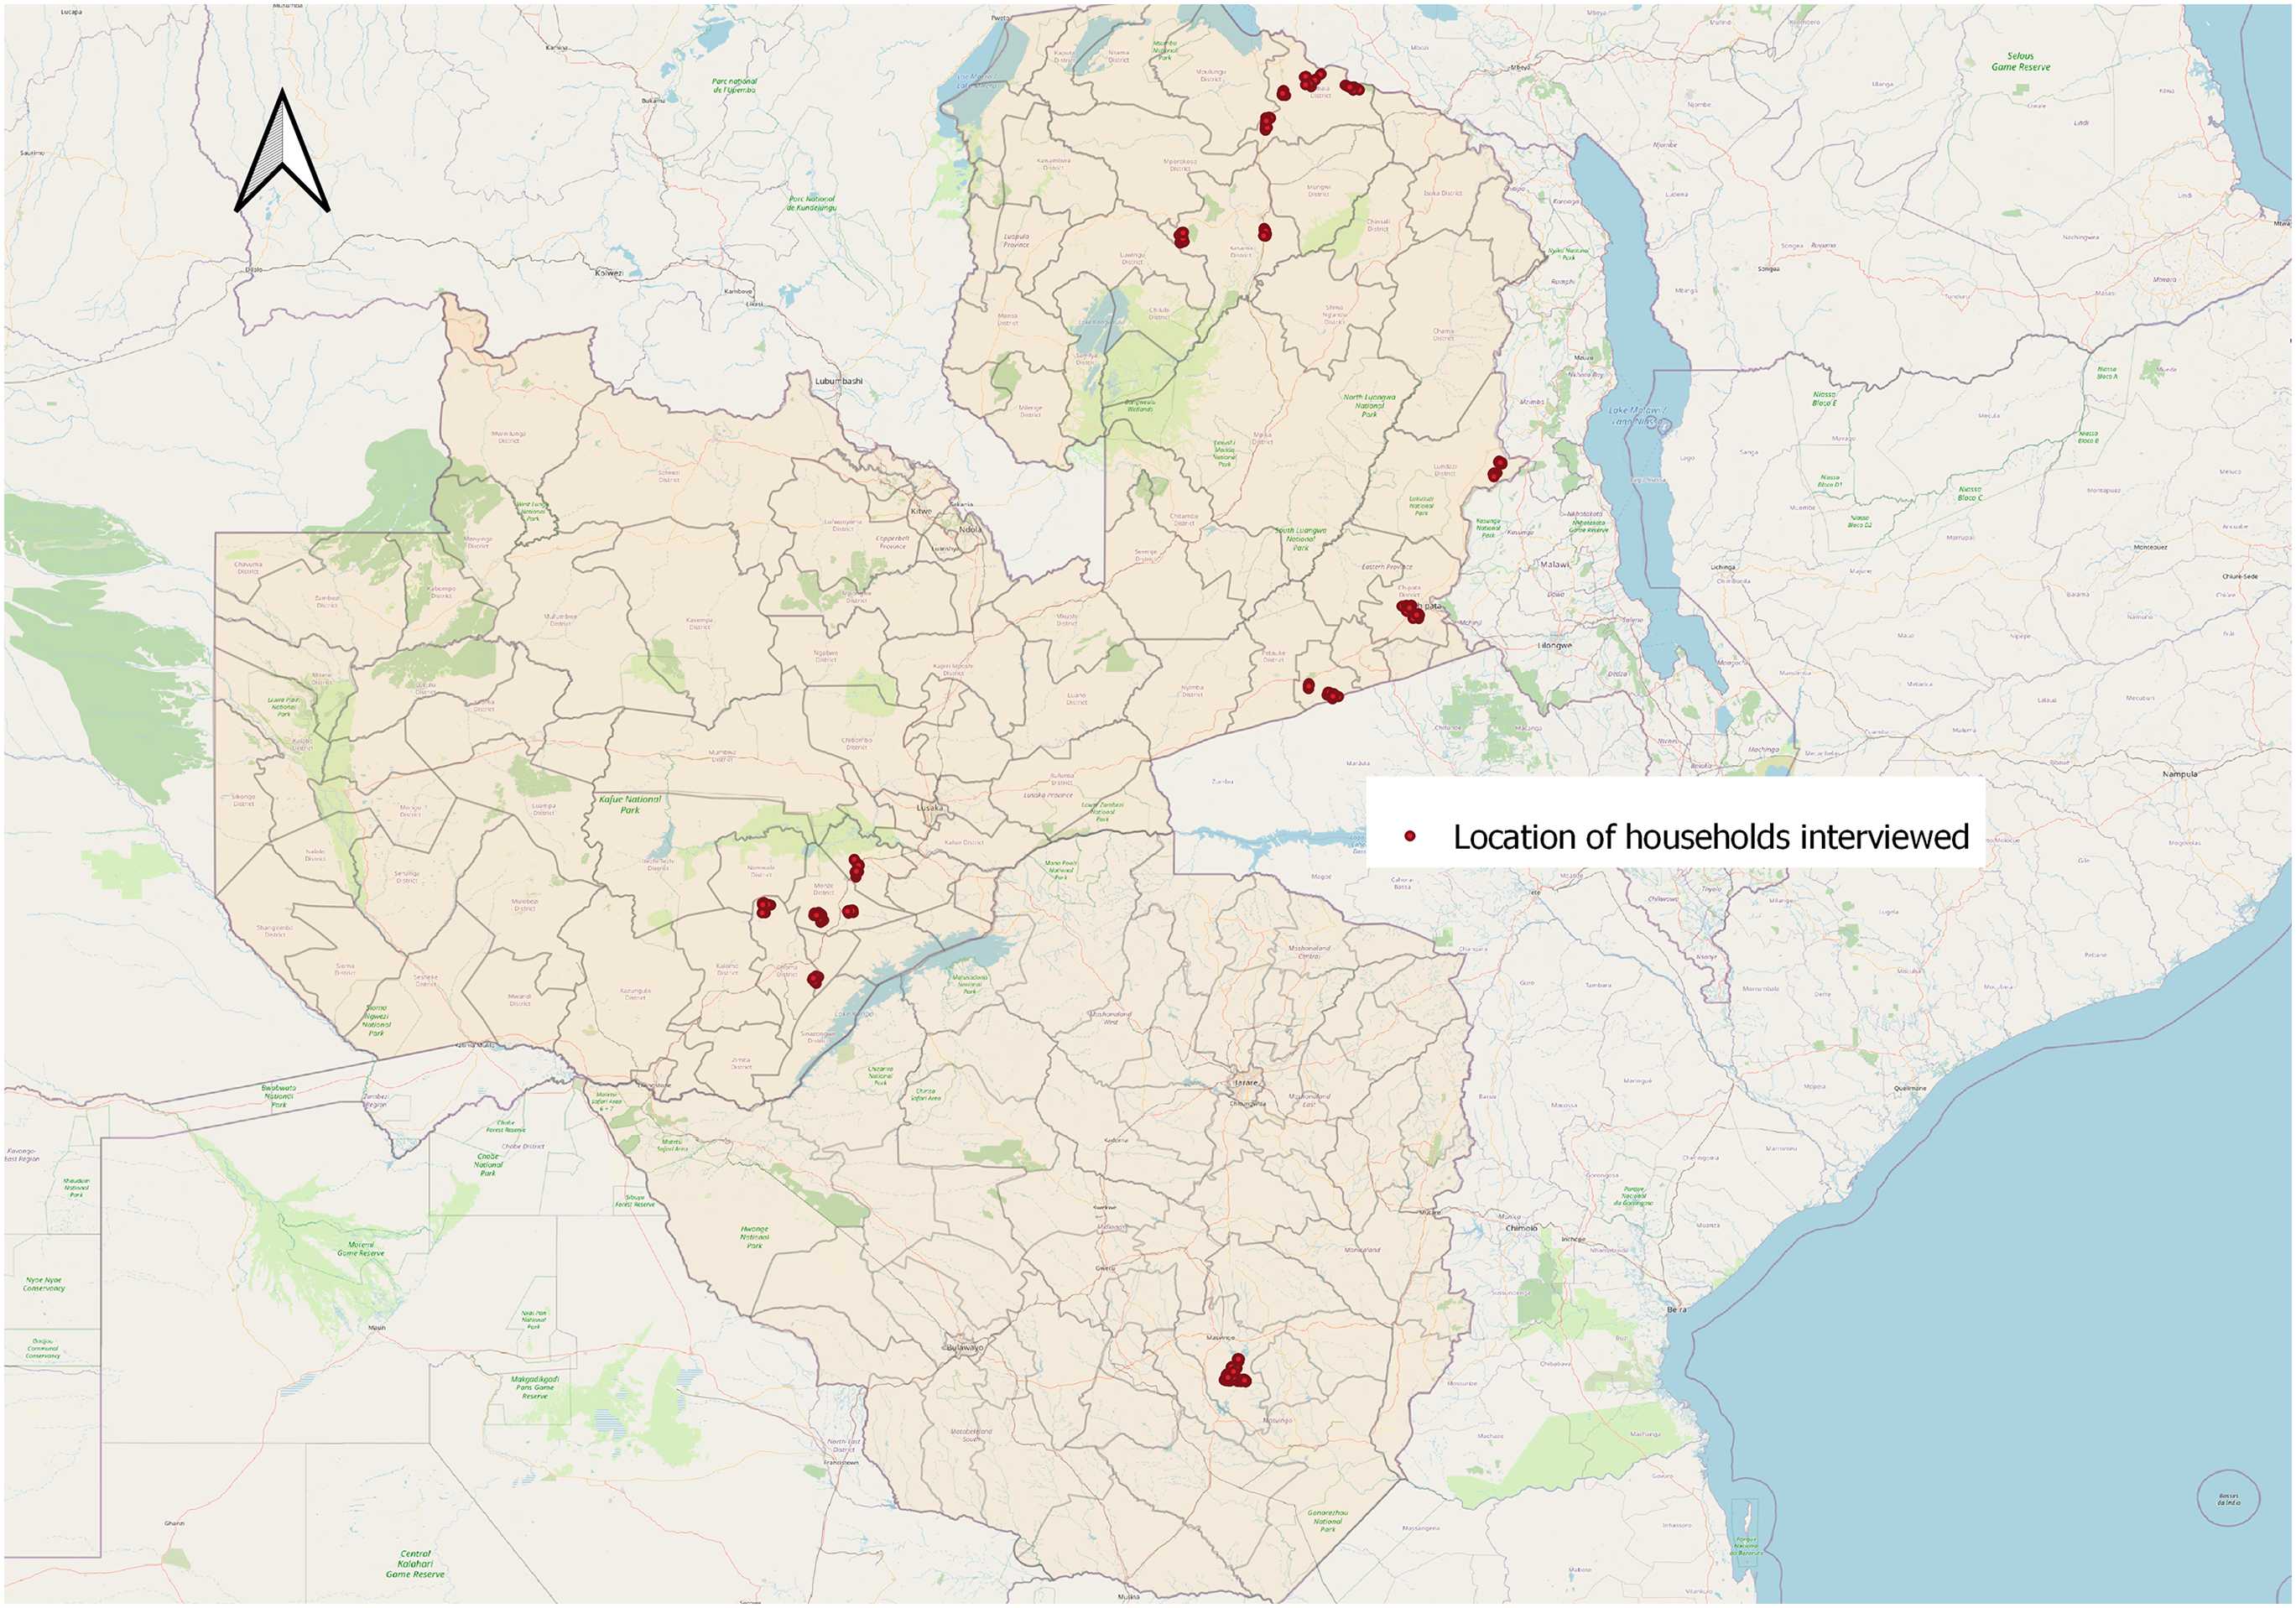
Spatial location of sampled households in Zambia and Zimbabwe.
Variable construction
Dependent variable
Our main outcome variable is household dietary diversity. Dietary diversity is a proxy indicator of the access dimension of food security and of nutrition outcomes (Hoddinott and Yohannes, 2002; Swindale and Bilinsky, 2006). Following Swindale and Bilinsky (2006), we asked sample households if any household member had eaten any food from the standard 12 food groups of cereal, roots and tubers, vegetables, fruits, meat, poultry and eggs, fish and seafood, pulses/legumes/nuts, milk and milk products, oil/fats, sugar/honey, and condiments (spices, sauces, salt etc.). Enumerators read out all the food types under each food group and asked respondents whether any member of the household consumed any food from the list in the 24 h prior to the interview. We excluded foods consumed from outside the household, such as restaurants and special events such as social and religious gatherings that do not reflect typical consumption patterns. 3 Surveys in both countries were done just before the harvest or during the harvesting season. We used a shorter 24-h recall period to increase reporting accuracy. HDDS is the number of unique food groups consumed by a household out of a total of 12 and ranges from 0 to 12, or the ratio of food groups consumed from a total of 12 and ranges between 0 and 1.
Independent variables
Our main covariates are a vector of sustainable intensification practices measuring adoption intensity. These include size of cultivated land under minimum tillage (basins, ripping and zero tillage) and a combination of minimum tillage and rotation. We added the rotation bit given its significance in increasing crop diversity and productivity. We also used intercropping to check the robustness of our results. These variables were constructed from survey questions that asked for the main tillage method, plot size, input use and other agronomic/management practices per plot. We used adoption intensity because it is likely better correlated with production/productivity than is the extent of adoption. We also controlled for inorganic fertilizer and improved seed rates (kg/ha).
To better capture the direct pathway from SIPs to HDDS, we controlled for two possible intermediary steps, production diversity and/or crop diversification. We follow Mulenga et al. (2021) and defined a crop production diversity index based on food group diversification. Food group diversification accounts for how diverse foods from own crop and livestock production are and groups all crops, livestock and poultry produced by households in the sample. Because SIPs are more likely to directly affect crop production, we restrict ourselves to five (5) possible food groups consisting of cereals, tubers/roots, fruits, vegetables, and legume/fats.
Production diversity is a ratio of the number of food groups from own production relative to the total number of possible food groups, 5 in our case. A higher value indicates more diversified own production. Crop diversity is computed using the Simpson Index of diversification. This involves subtracting the sum of the square of land shares under a given crop to total cultivated land from one at household level. A value closer to 0 signals less diversification while values closer to 1 indicate higher diversification. We also control for whether households earn off farm incomes, distance to main road (a proxy for market access) and other socioeconomic and demographic characteristics that may affect HDDS (Table 1).
Summary statistics of key variables used in the analysis.
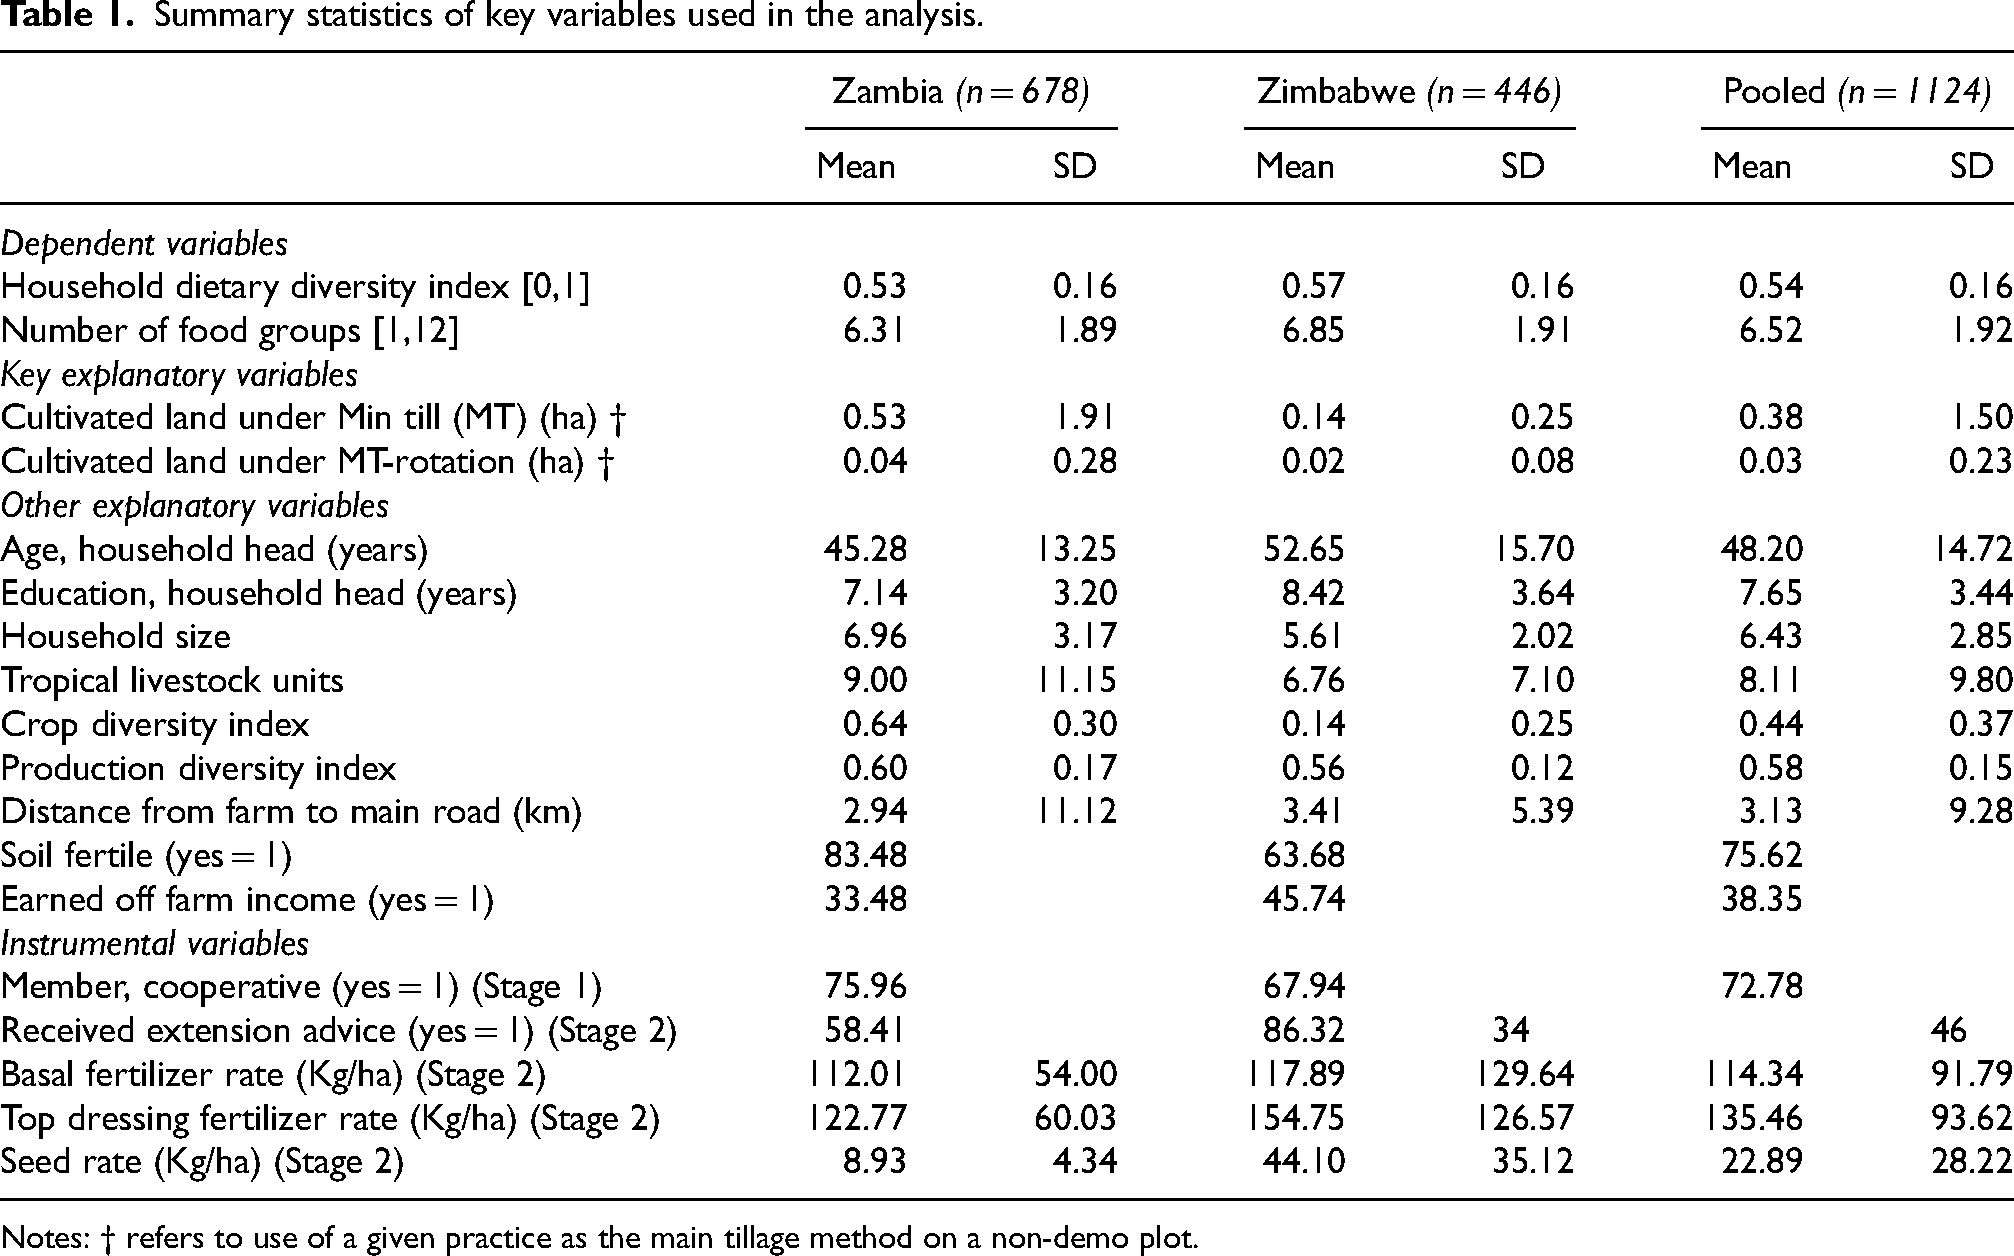
Notes: † refers to use of a given practice as the main tillage method on a non-demo plot.
Empirical and identification strategy
There are two main empirical challenges in estimating the effects of SIPs on HDDS. First, SIPs only affect HDDS through some intermediary step, either via their direct effect on production diversity or crop diversification. Second, SIP adoption is non-random and is therefore endogenous and can be co-determined with HDDS. This is because farmers that adopt SIPs may be those with high intrinsic motivation and other unobservables so that they would likely have high HDDS anyway. There are concerns of endogeneity in our case because the surveys were conducted in project areas where beneficiaries were not randomly selected.
We use an instrumental variable approach to address these empirical challenges. For the first challenge, we use Three-Stage Least Squares (3SLS) to explicitly model, via three-stages how SIP adoption intensity affects production diversity and/or crop diversity, and how these in turn affect HDDS. In a nutshell, we model SIP adoption intensity in stage one. Stage two models the effects of adoption intensity using predicted adoption from stage one, and stage three models the effects of predicted production diversity or crop diversification on HDDS.
Proper identification requires that each stage uses unique additional instrumental variables (IVs). In 3SLS, all righthand exogenous variables are considered as instruments in the first stage. We use a dummy variable = 1 if any household member is a member of a farmer group and whether a household received extension prior to the 2020/2021 season as IVs for SIP adoption in stage one. We postulate and test that these social capital variables are more likely to expose households to SIP information and might increase adoption. We find this to be the case in most of our estimations. For the second stage, we use basal and top-dressing fertilizer application rates and seed rate (Kg/ha). We expect these IVs to affect both production diversity and crop diversity but not HDDS directly. We do not have a corresponding IV for the third stage but use all exogenous variables in the estimation. We restrict our analysis to use of SIPs on non-project supported plots only. 4
We can write a representation of the estimable system of regression equations as: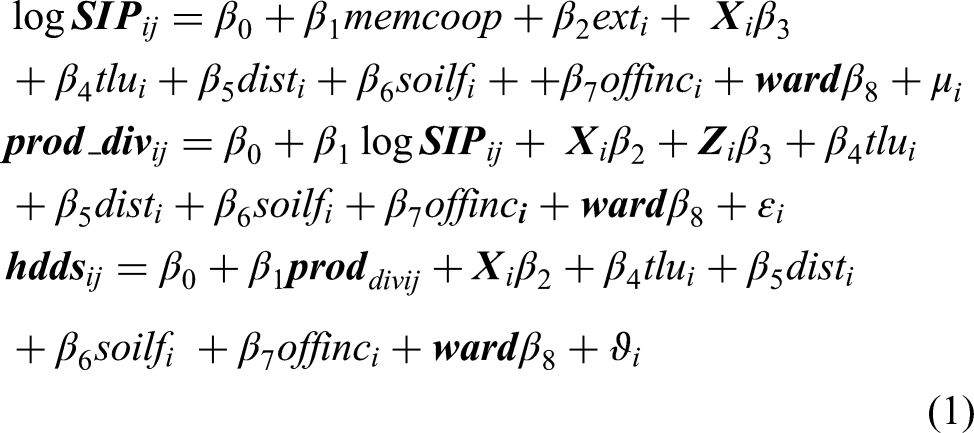
We used 3SLS methods to estimate Equation (1). In the first stage, 3SLS estimates a reduced form equation with the endogenous variable as the dependent variable and all exogenous variables in Equation (1) and the IVs (Z). In the second stage, the structural equation in Equation (1) is estimated by using all exogenous regressors and fitted values for endogenous variable generated from the first stage regression. Estimating Equation (1) using the Generalized Methods of Moments (GMM) gave identical results.
Results
Food groups consumed by sample households
Households in Zambia consumed 6.3 food groups, 24-h prior to the survey compared to 6.9 in Zimbabwe (Table 1 and Figure 3). The top 6 food groups consumed by at least 50% of sampled households in both countries include cereals, vegetables, fats, nuts, condiments, and roots (Figure 3). In both countries, just about one-fifth of sample households consumed foods rich in animal proteins such as meat, fish, milk, and eggs. Notably, far more households in Masvingo District of Zimbabwe reported having consumed fruits than in Zambia. This is not unexpected given anecdotal evidence and observations during fieldwork suggesting that most households in the district have orchards replete with fruits trees.
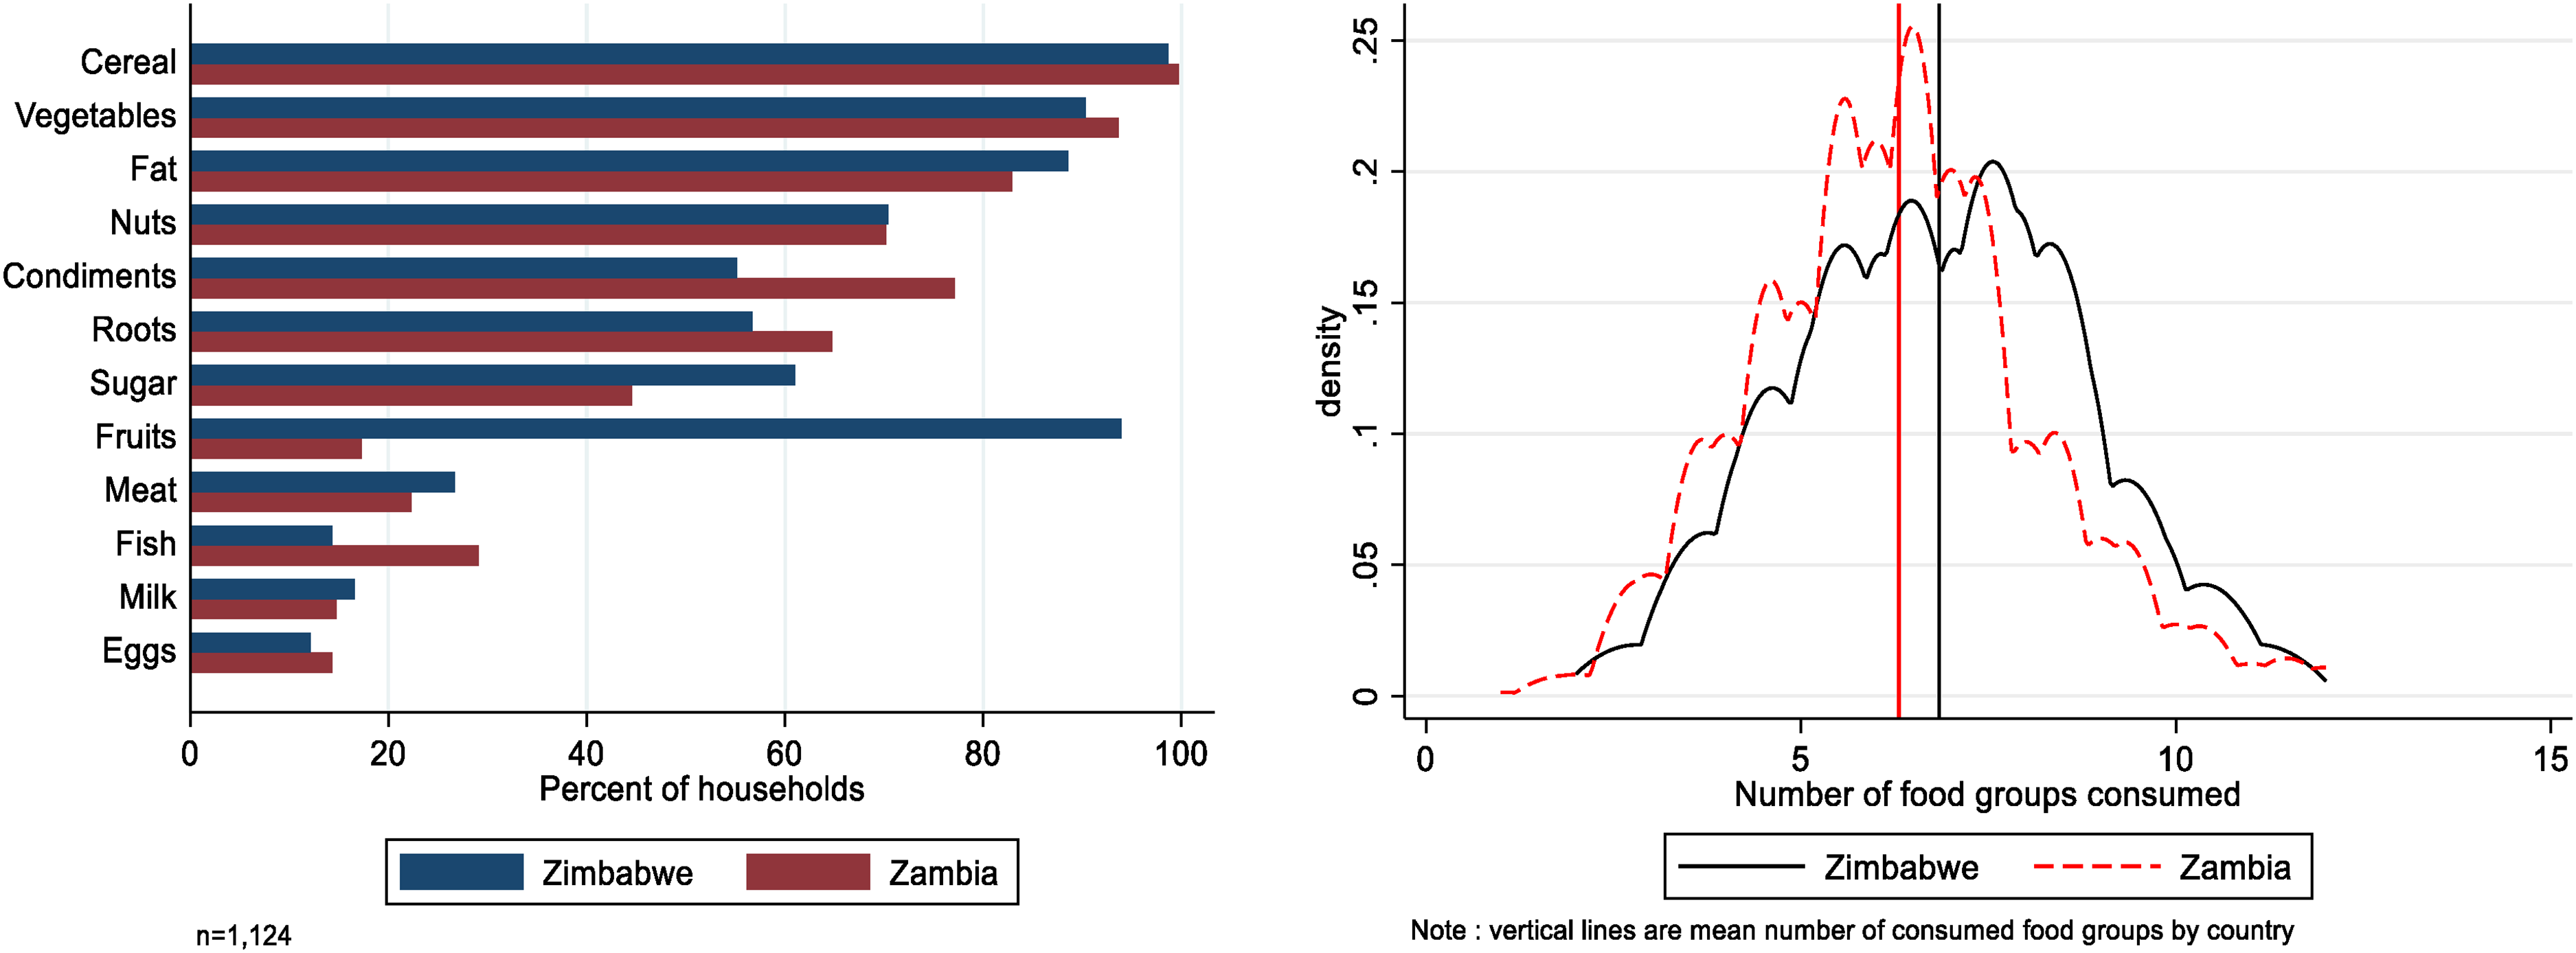
Proportion of households who consumed given food groups (left panel) and average number of food groups consumed (right panel) in Zambia and Zimbabwe, 24 h prior to the survey.
SIPs and dietary diversity
We first look at some antecedents before delving into the main question. On the extensive margin, far more sampled households in Zimbabwe used minimum tillage and its constituents of basins, ripping and/or zero tillage on non-demo plots than in Zambia. About 45% of the sample in Zimbabwe used minimum tillage compared to 23% in Zambia during the 2020/2021 farming season (Figure S1, supplementary materials). In terms of the individual MT elements, 33% and 16% of farmers interviewed in Zimbabwe used basins and ripping respectively, compared to 3% and 19% in Zambia. While households in Zambia used ripping more intensively, those in Zimbabwe had a higher use intensity for basins. 5 Households in Zambia allocated about 0.5 ha of cultivated land to each of minimum tillage and its constituent, ripping on average, compared to 0.14 ha and 0.05 ha in Zimbabwe, respectively (Table 1). However, households in Zimbabwe allocated about 21% of the 0.9 ha cultivated land on average to min till (14 and 7% under basins and ripping, respectively). In Zambia, of the average 3.36 ha cultivated per household, 16% was under min till (13% under ripping).
Without controlling for other potential confounders, bivariate relationships in Figure 4 suggest a positive relationship between the adoption intensity of SIPs and dietary diversity. The relationship between the adoption intensity of basins and distance to the main road and dietary diversity seems to turn negative beyond some threshold (Figure 4).
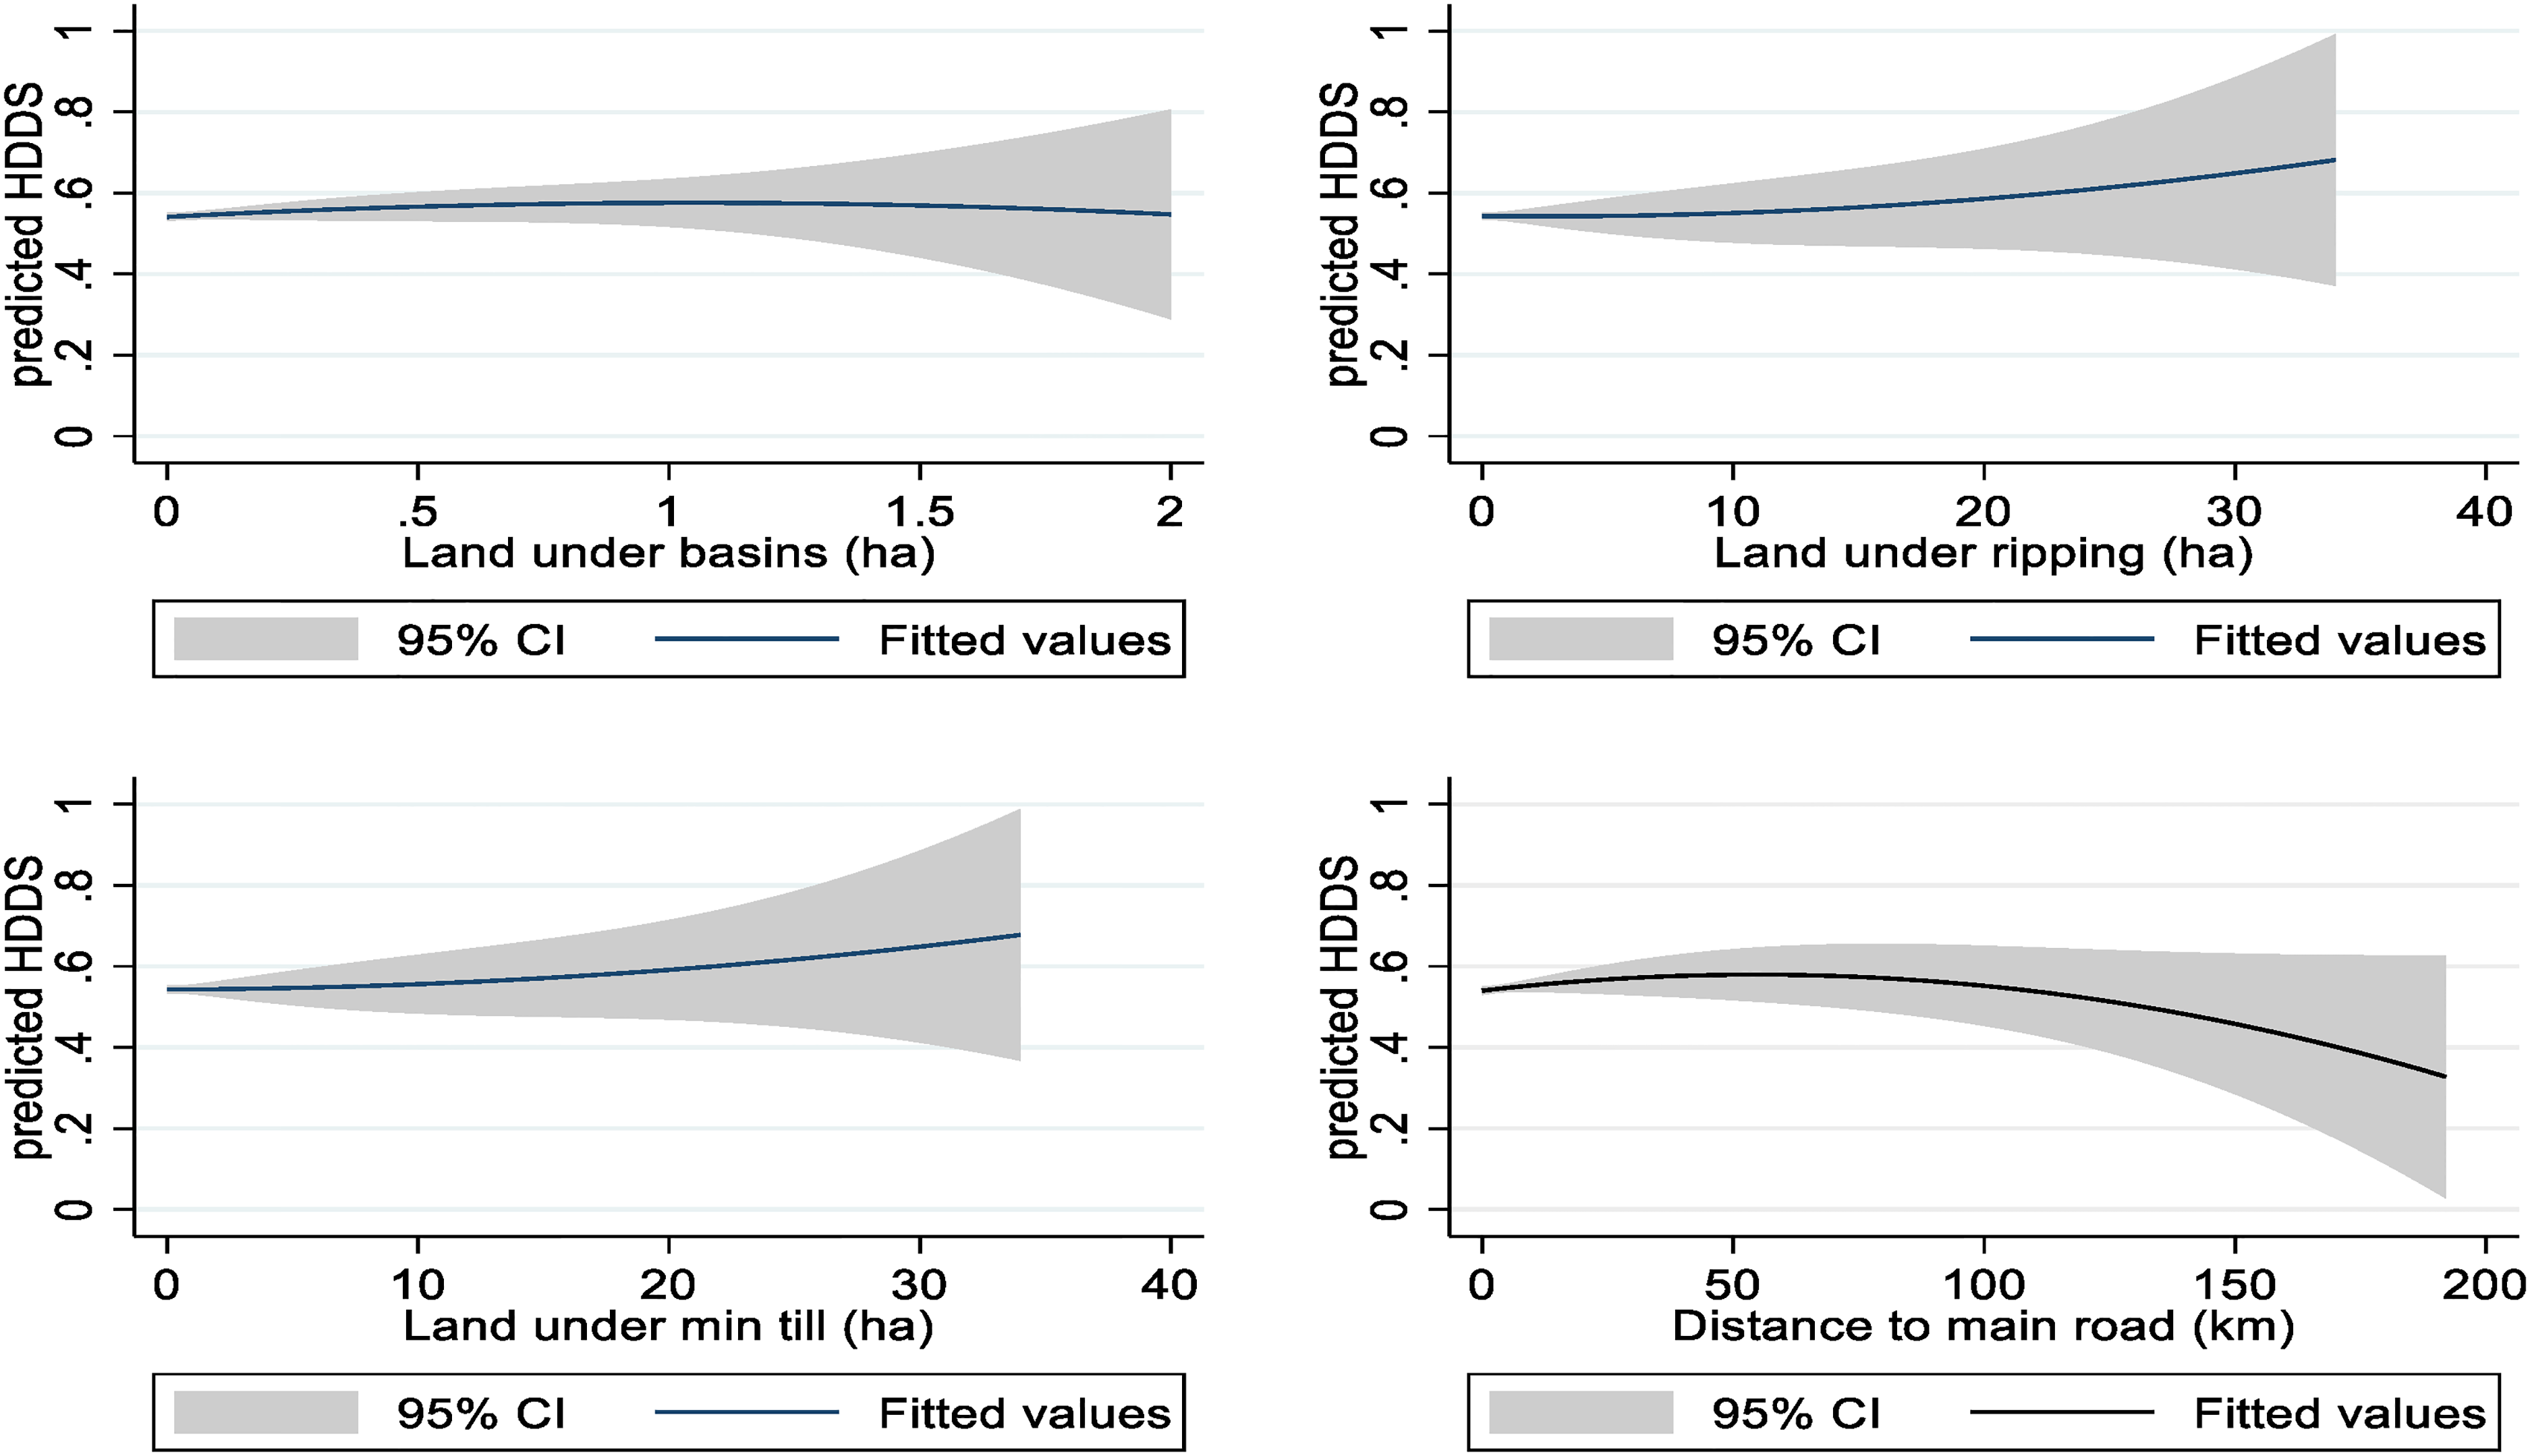
Bivariate relationships among cultivated land under basins, ripping, minimum tillage, distance to a main road and household dietary diversity.
First stage results (not reported for brevity but available from authors) show that most of our selected IVs were strongly correlated with the endogenous variables in the different stages. For example, membership to a farmer cooperative and access to extension significantly increased the land under MT.
Tables 2 and 3 presents our main multivariate results on the correlations between dietary diversity and SIPs through production diversity and/or crop diversity. These results are reported for the pooled sample in Tables 2 and 3 for production diversity and/or crop diversity, respectively. Results specific to Zambia and Zimbabwe are in Tables S1 and S2 respectively. Panel A presents results for the adoption intensity (log of cultivated land in hectares (ha)) of minimum tillage (a combination of basins, ripping and/or zero tillage) as the main SIP of interest. Panel B presents results for the adoption intensity (log of cultivated land in hectares (ha)) of minimum tillage and rotation. Under each panel, we present results for each of the three main equations in Equation (1). The main dependent variable of interest in the third equation in each model is dietary diversity measured as a ratio of the number of food groups consumed out of 12. All models are estimated using 3SLS. As robustness checks, we assessed the correlations of minimum tillage and intercropping with dietary diversity through production diversity in panel A and through crop diversity in panel B (Table S3).
Effects of minimum tillage alone and minimum tillage and rotation on food crop production diversity and household dietary diversity, pooled sample.
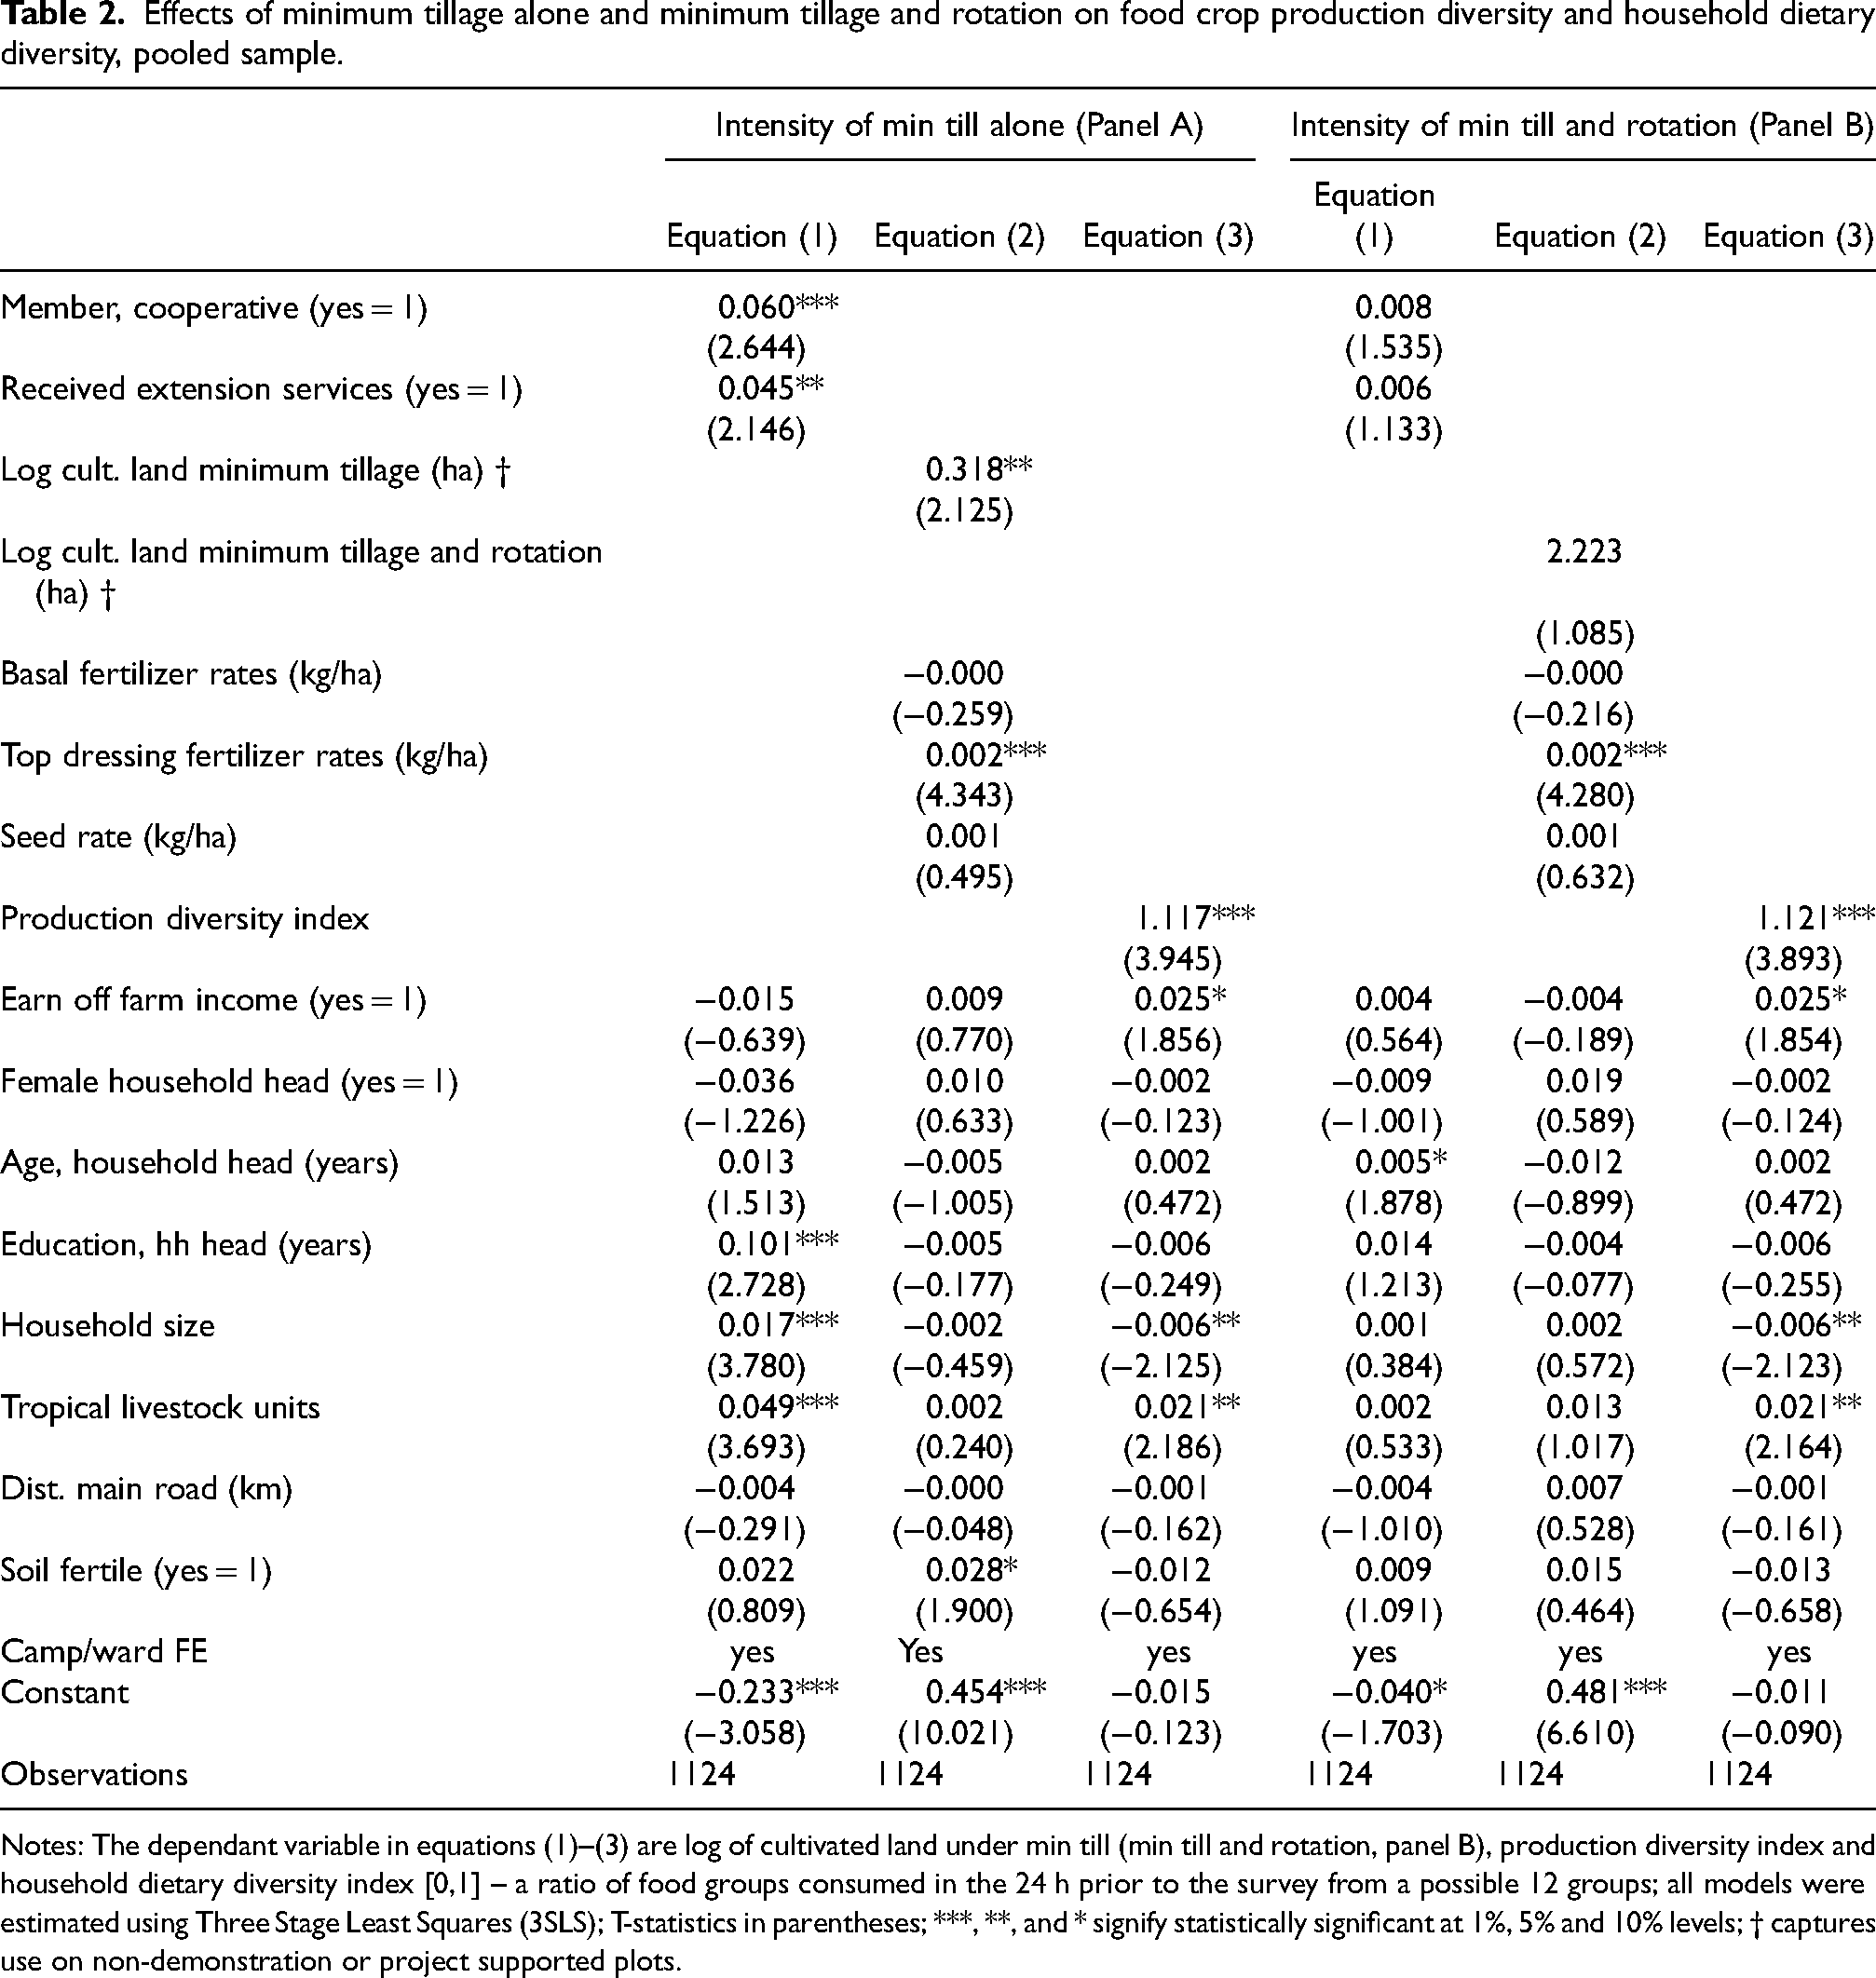
Notes: The dependant variable in equations (1)–(3) are log of cultivated land under min till (min till and rotation, panel B), production diversity index and household dietary diversity index [0,1] – a ratio of food groups consumed in the 24 h prior to the survey from a possible 12 groups; all models were estimated using Three Stage Least Squares (3SLS); T-statistics in parentheses; ***, **, and * signify statistically significant at 1%, 5% and 10% levels; † captures use on non-demonstration or project supported plots.
Effects of minimum tillage alone and minimum tillage and rotation on crop diversity and household dietary diversity, pooled sample.
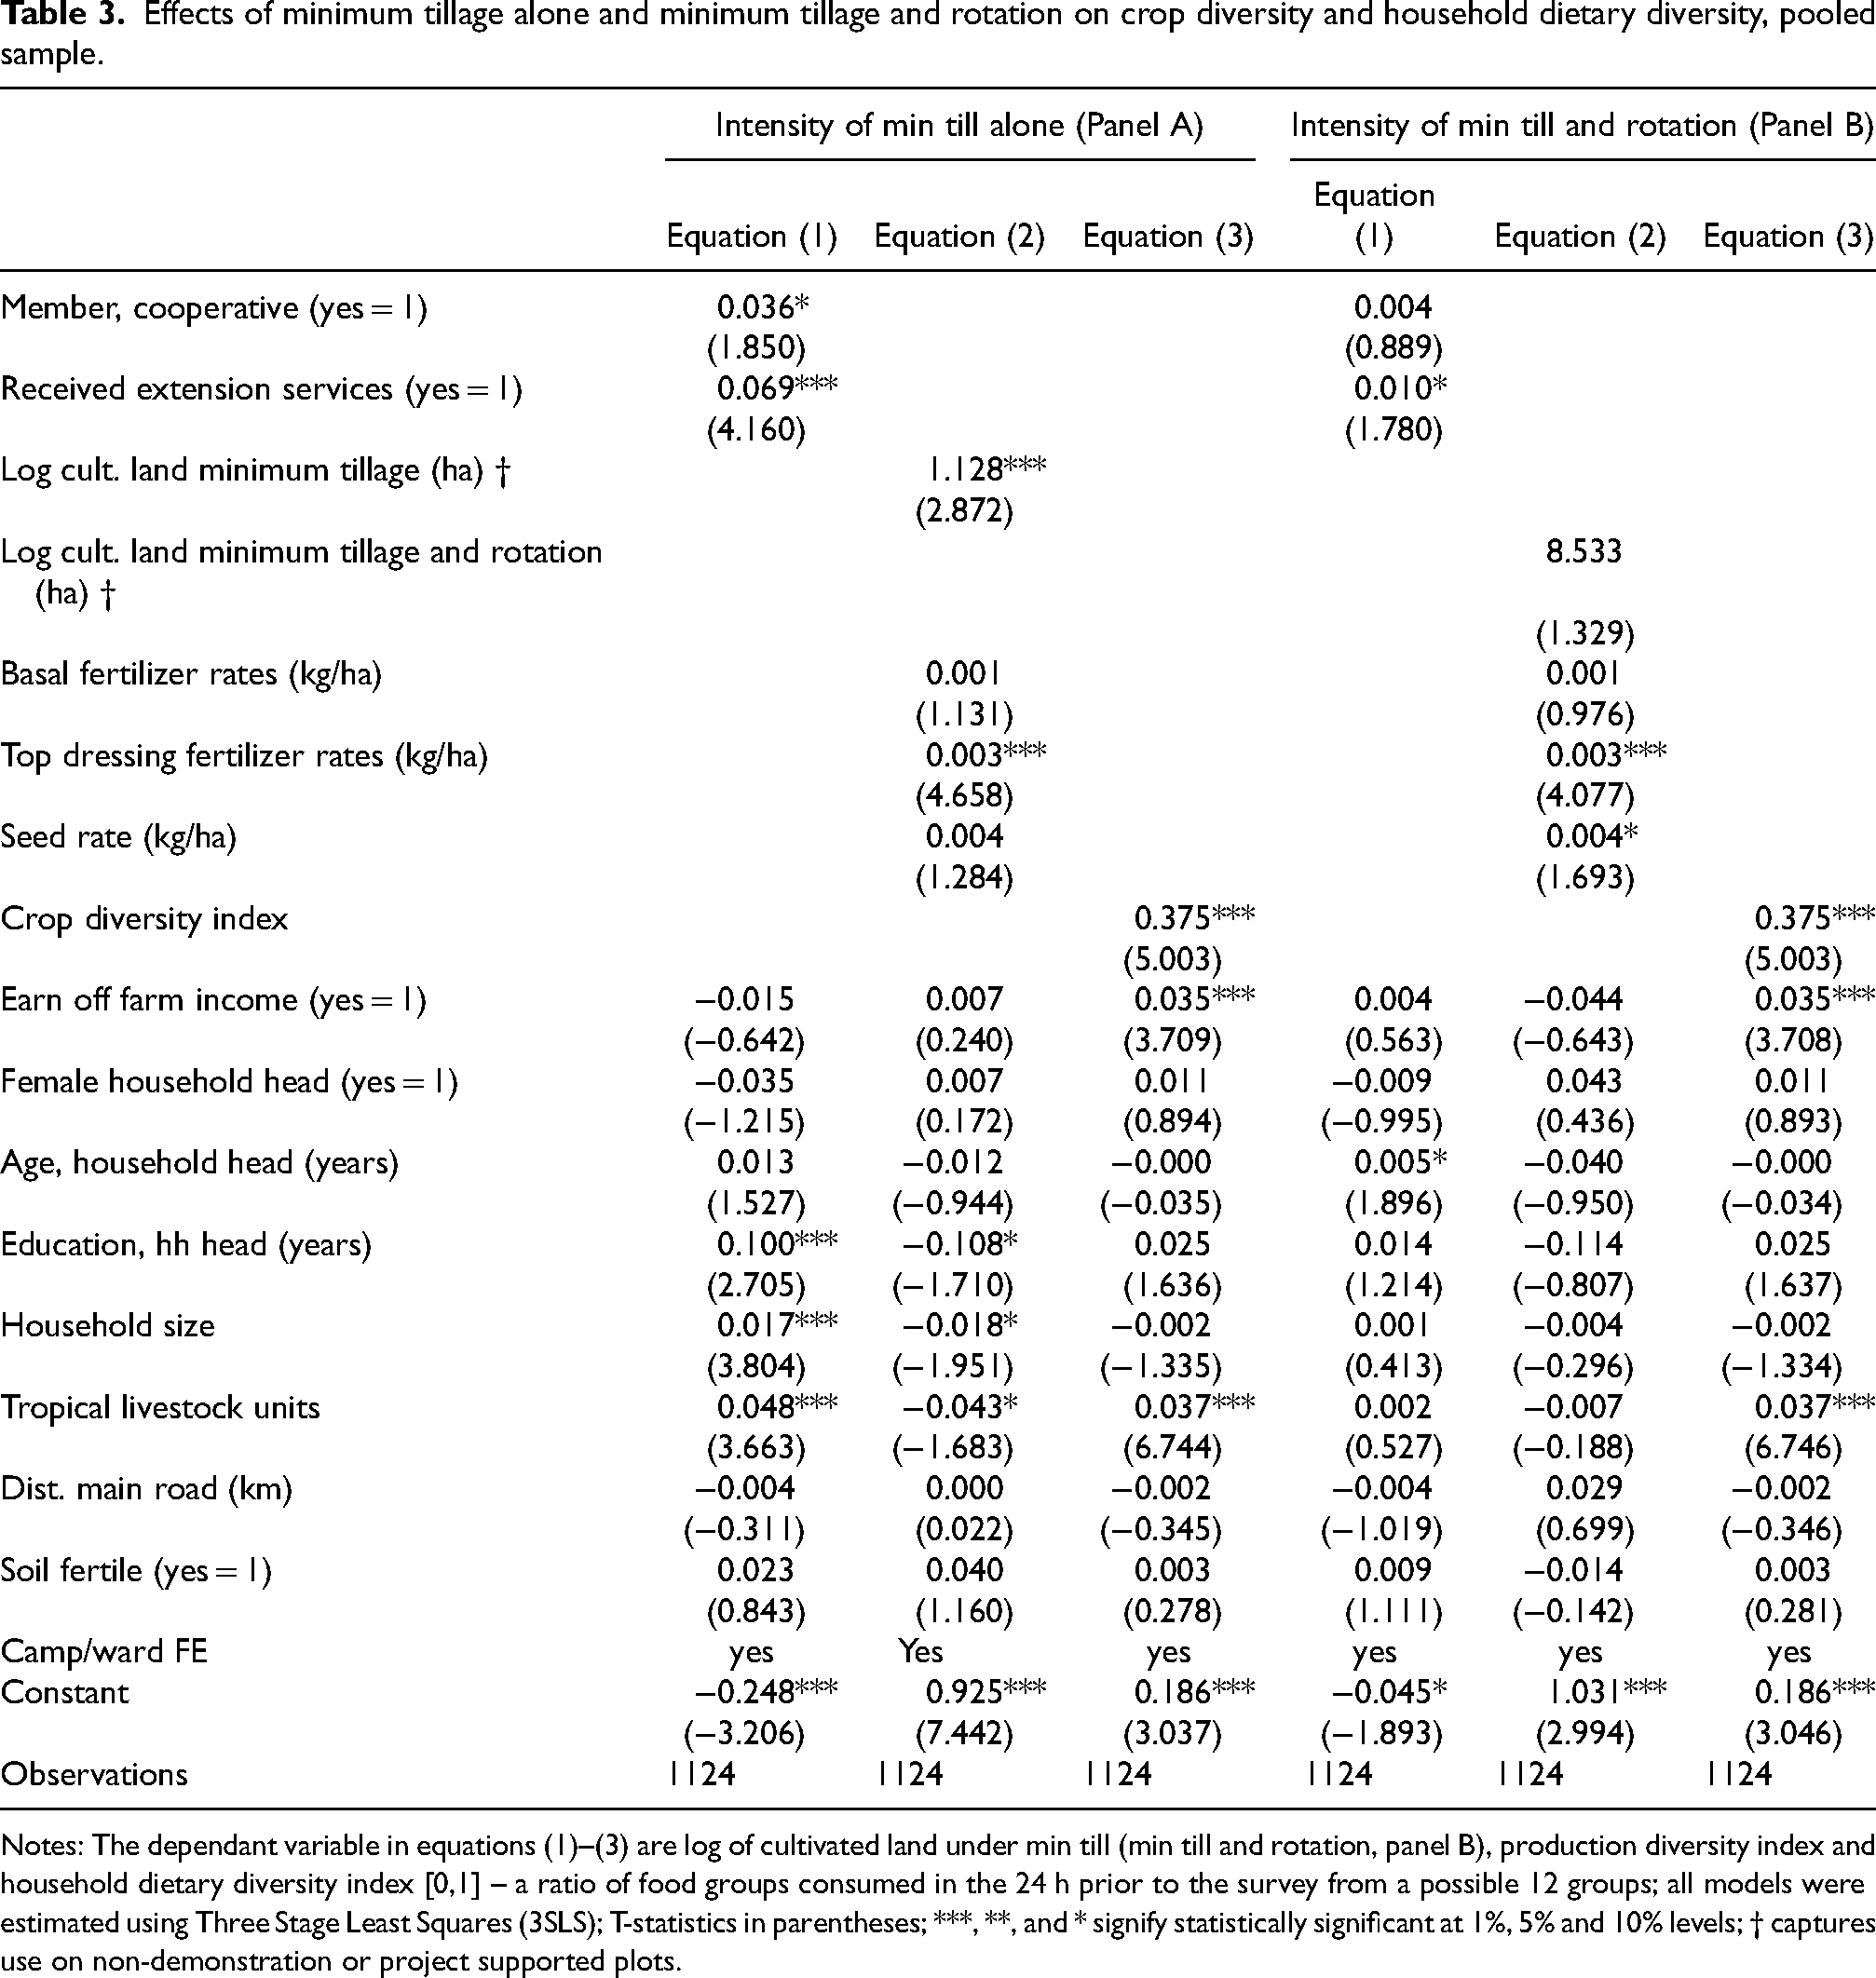
Notes: The dependant variable in equations (1)–(3) are log of cultivated land under min till (min till and rotation, panel B), production diversity index and household dietary diversity index [0,1] – a ratio of food groups consumed in the 24 h prior to the survey from a possible 12 groups; all models were estimated using Three Stage Least Squares (3SLS); T-statistics in parentheses; ***, **, and * signify statistically significant at 1%, 5% and 10% levels; † captures use on non-demonstration or project supported plots.
We find positive and strong correlations between the intensity of SIPs (minimum tillage use, and minimum tillage use and rotation) and dietary diversity in the pooled (Tables 2 and 3) and Zambia samples (Table S1). These effects are channelled through increased production diversity (Table 2) and crop diversity (Table 3). For example, increasing the log of adoption intensity by 1% for minimum tillage is associated with increases in production diversity by 0.003–0.01 (Tables 2 and 3, panel A). Production diversity and crop diversity in turn significantly increase dietary diversity by 1 and 0.4, respectively (Tables 2 and 3, panel A). The link between minimum tillage and rotation, and production diversity/crop diversity is weaker, but production/crop diversity increase dietary diversity (Tables 2 and 3, panel B). We find stronger results for minimum tillage and intercropping. Increasing the intensity of minimum tillage and intercrop adoption raises production and crop diversity by 0.04 and 0.07 respectively (Table S3).
We find qualitatively similar results at country level (Tables S1 and S2). As expected, own crop production diversity and crop diversity are positively correlated with dietary diversity in the country sub samples (Tables S1 and S2). Where these are significant, own food crop production diversity has a larger effect than crop diversity on dietary diversity both in the pooled sample and country-specific results. This result is robust to using rotation or intercropping as add ons to minimum tillage. This result might be explained by the fact that production diversity is defined based on food groups while crop diversity is based on the share of cultivated land devoted to given crops regardless of whether these are food crops or not. It could also be the case that households with higher crop diversity are more commercialized and allocate more land to cash crops. Such households might consume less diverse foods due to substitution effects. If households have a lower shadow price for food items than the actual market prices, such households would consume less food even if they have increased income from sales. In such situations, the substitution effect outweighs the income effect from sales. The contrasting results on the effects of crop diversity and production diversity on dietary diversity suggest that context matters.
There are other important drivers of dietary diversity. Earning off farm income and being wealthy measured by tropical livestock units are strong drivers of higher dietary diversity in the pooled sample and in the country subsamples (Tables 2, 3, S1, S2). The only exception is the Zimbabwe subsample where, earning off farm income does not significantly affect dietary diversity. A surprising finding is that a larger household size is associated with low dietary diversity in the pooled (Table 2). This could be driven by the fact that our measure of household size is an absolute count and does not take into account adult equivalents. As such, a household might have more members simply because there are more children. A larger household size could also imply less cash is available to purchase diversified foods given other needs for cash.
We find contrasting results on education level of the household head. In Zambia, the education level of the household head is associated with higher dietary diversity, while we find the opposite result for the Zimbabwe subsample (Tables S1 and S2, respectively). One possible explanation for the differences in the results for Zambia and Zimbabwe could be that the starting level of education matters. In Zimbabwe where education levels are already higher, additional education might not matter for dietary diversity. Household heads completed an average 8.4 years in Zimbabwe compared to 7.4 years in Zambia (Table 1).
SIPs to dietary diversity mechanisms and robustness checks
We tested the direct pathways from SIPs to HDDS espoused in Figure 1 of section “Linking sustainable intensification and dietary diversity: a conceptual framework”. If indeed SIPs have a direct effect on HDDS through their influence on production, we expect positive correlations between the intensity of SIP adoption and production/productivity and between SIPs and production/crop diversity. This is the case in our sample: the intensity of adoption for each of the five main SIPs is positively correlated with total crop production (Figure S2, supplementary materials) and to production/crop diversity (Tables 2 and 3). The positive associations between earning off farm income and dietary diversity is suggestive of positive indirect effects. Testing the indirect effects is more complex because of the several potential pathways and for this reason, we do not pursue it further.
For more robustness checks, we estimated the main IV models using the absolute number of food groups consumed out of 12 and obtained qualitatively similar results. This suggests that our results are robust whether HDDS is measured as either a ratio or a count variable. We also found similar results even when we estimate the system of equations in Equation (1) using Generalized Methods of Moments (GMM).
Discussion
Findings in this paper provide some empirical evidence on the positive association between sustainable intensification practices and dietary diversity in maize-based farming systems of Southern Africa. This link is demonstrated through the direct effects of SIPs on production/crop diversity and in turn on dietary diversity. If the positive correlations between the adoption intensity of minimum tillage and minimum tillage and rotation, and minimum tillage and intercropping, and dietary diversity found in this paper hold in several places, then promoting sustainable intensification maybe be one way to make agriculture more nutrition sensitive. Beyond just looking at corelations, this paper has also elaborated on the potential pathways from SIPs to dietary diversity. SIPs need to improve production, productivity and crop and food production diversity for them to have any direct effect on dietary diversity. The extent to which all SIPs do this, and the lag times from adoption to improved productivity is debatable. On balance and under different contexts, SIPs like CA appear to have positive benefits on crop production and productivity in the medium- to long-term range (Knowler, 2015; Komarek et al., 2021; Pittelkow et al., 2014; Thierfelder et al., 2013a, 2013b, 2015a, 2015b, 2017).
Indirectly, SIPs may contribute to dietary diversity through the income effects. Untangling the several pathways is an empirical challenge. If this is carefully done, SIPs are likely to have an even larger effect on dietary diversity than was found in this paper. In addition to showing positive associations between crop and/production diversity as was found in Sibhatu et al. (2015) in Ethiopia and Malawi, Snapp and Fisher (2015) in Malawi, Ecker (2018) in Ghana, Ntakyo and van den Berg (2019) in Uganda, Mulenga et al. (2021), Mwila et al. (2021) and Mofya-Mukuka and Hichaambwa (2018) in Zambia, our paper has gone a step further to conceptually link the intensity of SIP adoption to production. We also show how this link can affect dietary diversity. This is our contribution on the need for applied research to conceptually/theoretically link agriculture intervention to outcomes of interest.
There is need to scale-up (influence policy) through policy engagements; scale-out (increase reach) by supporting research for development; and scale-deep (influence values and beliefs) by facilitating farmer trials and experimentation on SIPs if the associated nutrition co-benefits highlighted in this paper are to be realised at scale. How to do this effectively and efficiently, with sufficient resources from governments, NGOs and donors is key, but remains an unresolved puzzle in Southern Africa (Ngoma et al., 2021). Large-scale government programs supporting SIPs in the region, such as the Zimbabwean Government's support to Pfumvudza are encouraging. 6 Such programs need to be well-designed using for example, sustainable market-based incentives to avoid creating economic dependence.
Readers should keep in mind the following three caveats when interpreting the results in this paper. First, although we use an IV approach to control for the potential endogeneity of SIPs adoption, the success of this method relies on the strength of the instruments. This is something economists always argue about; as such, we propose to interpret our results as correlations. Second, although HDDS is a good proxy measure for food diversity, when computed at household level as done in this paper, it masks intra-household food insecurity. A household could have a high HDDS driven by one person or group, e.g., male adults who are always eating a diverse set of foods or the most nutritious parts of it while children have reduced dietary diversity with unwanted nutritional outcomes. An individual dietary diversity score that allows to explore intra-household access to food would be an important research question for the future.
Lastly, because our analysis is based on cross sectional data, we are unable to control for any reminder of unobserved factors that may influence dietary diversity, even after controlling for different socioeconomic and demographic factors. Future research could use panel data to better test the pathways from SIPs to dietary diversity.
Conclusions
Identifying nutrition-sensitive and sustainable agricultural interventions is necessary to address hunger and malnutrition among the over 800 million affected globally and to meet the 2030 Zero Hunger goal. This paper assessed associations between sustainable intensification practices and dietary diversity in maize-based farming systems of Zambia and Zimbabwe. Using survey data collected from 1124 households, we applied an instrumental variable approach that allows us to control for the fact that farmers self-select themselves into adopting sustainable intensification practices, making adoption endogenous. We also assess the pathways from intensification to dietary diversity.
We find that the adoption of sustainable intensification practices (minimum tillage (use of basins, ripping and/or zero tillage), minimum tillage and crop rotation, and minimum tillage and intercrops) is associated with improved production and crop diversity and in turn, dietary diversity on average. These findings provide some empirical evidence on the positive association between sustainable intensification practices and dietary diversity in maize-based farming systems of Southern Africa. There are several other important drivers of dietary diversity including earning off farm incomes and wealth. The findings in this paper hinge on there being widespread adoption of sustainable intensification practices, something that is yet to be achieved at scale in Southern Africa. Thus, realizing the nutrition related co-benefits associated with sustainable intensification practices requires concerted efforts to address several farm, household, and policy bottlenecks that hinder widespread adoption. Households in our sample allocated less than a quarter of the total cultivated land per year to sustainable intensification practices.
We draw two implications for policy from our findings. First, the promotion of nutrition-sensitive agricultural interventions needs to use several scaling-up and scaling-out options to address bottlenecks to widespread adoption. These efforts should be done in tandem with improved improved market access to encourage production. Second, from a food and nutrition security and resilience perspective, development interventions should promote food group diversification which includes both crops and livestock in addition to scale proven sustainable practices.
Supplemental Material
sj-docx-1-oag-10.1177_00307270221150660 - Supplemental material for Sustainable intensification and household dietary diversity in maize-based farming systems of Zambia and Zimbabwe
Supplemental material, sj-docx-1-oag-10.1177_00307270221150660 for Sustainable intensification and household dietary diversity in maize-based farming systems of Zambia and Zimbabwe by Hambulo Ngoma, Esau Simutowe, Mark Manyanga and Christian Thierfelder in Outlook on Agriculture
Footnotes
Acknowledgements
This research was imbedded in projects with a strong focus on extending sustainable intensification practices in Zambia and Zimbabwe. The work is embedded into the MAIZE CGIAR Research program (![]() ) whose donors are gratefully acknowledged. Financial support was received by the Sustainable Intensification of Smallholder Farming Systems in Zambia (SIFAZ), funded by the European Union (FED/2019/400-893) and implemented by the Ministry of Agriculture in Zambia, the Food and Agriculture Organization of the United Nations (FAO) and the International Maize and Wheat Improvement Centre (CIMMYT). Further support was received by the R4/Zambuko Rural Resilience Initiative in Zimbabwe, funded by USAID and SDC and implemented by WFP and a consortium of partners including CIMMYT – we are appreciative for all resources and support received for conducting this research. We are grateful to the Editor and an anonymous reviewer for proving comments that helped greatly improve the paper.
) whose donors are gratefully acknowledged. Financial support was received by the Sustainable Intensification of Smallholder Farming Systems in Zambia (SIFAZ), funded by the European Union (FED/2019/400-893) and implemented by the Ministry of Agriculture in Zambia, the Food and Agriculture Organization of the United Nations (FAO) and the International Maize and Wheat Improvement Centre (CIMMYT). Further support was received by the R4/Zambuko Rural Resilience Initiative in Zimbabwe, funded by USAID and SDC and implemented by WFP and a consortium of partners including CIMMYT – we are appreciative for all resources and support received for conducting this research. We are grateful to the Editor and an anonymous reviewer for proving comments that helped greatly improve the paper.
Declaration of conflicting interests
The author(s) declared no potential conflicts of interest with respect to the research, authorship, and/or publication of this article.
Funding
The author(s) disclosed receipt of the following financial support for the research, authorship, and/or publication of this article: This work was supported by the USAID, SDC, European Union, (grant number FED/2019/400-893).
Supplemental material
Supplemental material for this article is available online.
Notes
References
Supplementary Material
Please find the following supplemental material available below.
For Open Access articles published under a Creative Commons License, all supplemental material carries the same license as the article it is associated with.
For non-Open Access articles published, all supplemental material carries a non-exclusive license, and permission requests for re-use of supplemental material or any part of supplemental material shall be sent directly to the copyright owner as specified in the copyright notice associated with the article.