
Abstract
Rural development objectives are often framed relative to a targeted number of beneficiary farms and farm households. Yet the data available on the number and distribution of the world’s farms has been surprisingly fragmented and coherent estimates of the number of farms in a given region for a given year have not been available. We take a set of simple rules to use existing data sources to generate a harmonized set of farm number estimates at the national level. We estimate there are 656 million farms globally in 2020, with a projected decline to 624 million farms globally by 2030. These estimates can be used to better inform policy and large-scale investment programming and design. We also articulate the need for further investments in basic agricultural census data, and outline an agenda for the generation of farm distribution data that would be most useful for further policy guidance.
Introduction
The 2030 Agenda for Sustainable Development (Agenda 2030) provides an ambitious international development agenda that revolves around 17 Sustainable Development Goals (SDGs; UN, 2015). The SDGs are aspirational and encompass all areas deemed relevant to sustainable development, with early concerns being raised about the choice of targets, indicators, and roadmaps (Colglazier, 2015). Linkages among SDGs also imply the need to take into account interdependences and trade-offs between alternative goals (Colglazier, 2015). A case in point is agriculture, which is a primary conduit for achieving many of the SDGs and, as the primary livelihood for the majority of the world’s poor, occupies a central position within overall Agenda 2030 (Omilola and Robele, 2017). Agriculture’s pivotal role in ending poverty (SDG1) and achieving food security (SDG2) is widely acknowledged (e.g. para 24, UN, 2015). Progress toward many of the other SDGs—including health outcomes (SDG3; Poole et al., 2021), gender equity (SDG5), water management (SDG6), economic growth (SDG8), reduced inequality (SDG10), sustainable consumption and production (SDG12), climate change (SDG13) and sustainable land use (SDG15)—is also difficult to conceptualize without explicitly invoking the instrumental role of agriculture in achieving them. Yet, surprisingly, we know relatively little about the number and distribution of the world’s farms, particularly in the developing world.
Representative estimates of the number of farms and derived indicators such as farm types and size are key indicators to help inform and prioritize agricultural development strategies (Lowder et al., 2016, 2021). The original Agenda 2030 makes three explicit references to “farmers” and once to “small-scale food producers” and its intention to double their agricultural productivity and incomes by 2030 as part of SDG2 (para 2.3, UN, 2015). Others have in turn built their strategies on the Agenda 2030. A case in point is the CGIAR (formerly known as the Consultative Group for International Agricultural Research), “a global research partnership for a food secure future…dedicated to reducing poverty, enhancing food and nutrition security, and improving natural resources and ecosystem services” (CGIAR, 2016: 42). Its 2016 strategy included the ambitious targets of inter alia “350 million more farm households have adopted improved varieties, breeds or trees, and/or improved management practice” by 2030 (CGIAR, 2016: 5). A recent strategy update refers to “equip 500 million small-scale producers to be more resilient to climate shocks, with climate adaptation solutions available through national innovation systems” (CGIAR-SO, 2021: 19). The International Fund for Agricultural Development (IFAD), an international financial institution and a specialized agency of the United Nations, also articulated its strategic framework in the context of contributing to the Agenda 2030, with smallholder agriculture-led growth as key entry point for enabling inclusive and sustainable transformation of rural areas (IFAD, 2016). IFAD variously refers to estimates of some 500 million smallholder farms in the developing world supporting the livelihoods of almost 2 billion people and being responsible for often more than three-quarters of the food produced there (IFAD, 2013, 2021).
The ambitious targets and calls to action are laudable. One challenge though is that there is a surprising lack of information on many key indicators, including the number of farms, their size distribution within countries and their global distribution (Lowder et al., 2016, 2021). Over the years, investments have been made to address some of these challenges. Particularly noteworthy is the World Programme for the Census of Agriculture coordinated by the FAO which just released the latest instalment for the 2010 round (2006–2015; FAO, 2021). This latest effort included 127 countries and territories, a new record for the program, and steadily increasing over the rounds and up from 81 in the 1950 round (FAO, 2021). Still, this is far short from the 195 countries generally recognized (Worldometer, 2021), and the 235 countries and territories globally (UN, 2018).
Lowder et al. (2016) estimated the number of farms worldwide to amount to at least 570 million, based on a compilation of 167 countries and territories, including and building on FAO’s efforts. This compares to an earlier estimate of 525 million farms of all sizes in the world (Nagayets, 2005). Lowder et al. (2019, 2021) subsequently updated their estimate to at least 608 million farms in the world, based on a compilation of 176 countries and territories. The efforts of Lowder and associates are a welcome addition to the data available for guiding policy targets. However, this dataset still represents an incomplete set of countries. Furthermore, estimates for various countries are variously dated, in accordance with the source data available for each country, with the latest data for individual countries ranging from 1960 to 2017. Indeed, they acknowledge that their “estimates are limited by the data available” (Lowder et al., 2016: 16) and call for “continued efforts to enhance the collection and dissemination of up-to date, comprehensive, and more standardized agricultural census data” (Lowder et al., 2016: 16).
Unfortunately, the data are particularly patchy where agriculture plays the largest role in livelihoods and economies, such as in the low and low-middle income countries. Sub-Saharan Africa (SSA) is a case in point. An early recent estimate put the number of farms there at 51 million (9% of global farms; Lowder et al., 2016), which was soon updated to 75 million (12%; Lowder et al., 2019) which this paper will show still to be a substantive underestimate. An earlier study estimated there to be some 41 million farms in SSA (of which 80%, or 33 million were smallholder farms; Wiggins and Keats, 2013). Africa’s rapidly changing land and demographic situation should shape its agricultural and rural development strategies and take into account the challenges of mounting land pressures, unsustainable agricultural intensification, a rapidly rising labor force and limited nonfarm job creation (Jayne et al., 2014). Land constraints could help induce Boserupian agricultural intensification, whereas surplus arable land is concentrated in a few countries (Jayne et al., 2014). Land distribution patterns can also constrain intensification and limit surplus and poverty alleviation potential (Jayne et al., 2010). There is an ongoing need for agricultural development and smallholder farms are a key development option in low income countries (Hazell et al., 2010), even if “the future of all smallholders may well not lie in farming” (Wiggins et al., 2010: 1341).
The prime objective of the present perspective is to review and update estimates of the number and distribution of farms, now and into the future, conditional on currently available data. In contrast to Lowder et al. (2016, 2019, 2021), we generate global and regional estimates which are harmonized for a given year, along with projections through 2030, to inform the Agenda 2030. After presenting the underlying data and methods, we summarize our main findings and their implications for targeting of Agenda 2030 investments. We then outline ways in which coordinated data collection investments may enable more accurate and detailed estimates going forward, and discuss why that matters for policy and investment targeting.
Material and methods
The farm is the basic unit of operation in agricultural and food production, although the specific entities may vary greatly from one country to another as well as within each country (Lowder et al., 2016, 2021). Agricultural holdings as reported by the agricultural census are generally used as a proxy for the total number of farms in a country (Lowder et al., 2016, 2021). Ideally each country regularly establishes its number of farms through an agricultural census using comparable methods. That is the basic premise of the World Programme for the Census of Agriculture (FAO, 2021), which compiles data in roughly 10-year rounds, with the latest being the 2010 round (2006–2015). We used the reported farm numbers across rounds and linked them to the actual underlying survey year. These data were complemented with additional data from other sources, particularly Lowder et al. (2016, 2019).
The resulting database of 175 countries and territories has some important gaps. To begin with, reference periods differ across countries. The last available census estimates for specific geographies ranged from 1964 (Brunei) to 2017 (Brazil, Jordan). To harmonize this, we estimate national totals for 2020 as a common reference year, and then extrapolate to 2030 in relation to the Agenda 2030. To do so we used two key indicators: (i) rural population estimates by country by year (1960–2030; UN, 2018): These estimates from the most recent version of the UN’s World Urbanization Prospects (UN, 2018) account for country-specific urbanization projections alongside disaggregated urban and rural population growth rate estimates; and (ii) the rural population to farm ratio (RP-F ratio): The ratio was estimated for all census years and captures the country-specific rural transformation process (see e.g. Masters et al., 2013). For low and low-middle income economies we used the RP-F ratio from the last census year for 2020 and 2030. For upper-middle and high-income economies, one would assume the RP-F ratio to potentially increase over time with economic and rural transformation, basically implying a lower participation of rural populations on farm and more in the non-farm sector. For upper-middle and high income economies we used the linearly extrapolated RP-F ratio to 2020 and 2030 when this indeed showed a positive trend; and otherwise used the RP-F ratio from the last census year.
The extrapolated farm numbers based on only the geographies with data (i.e., with original farm census data) are referred to as the “extrapolated” series. These provide a lower bound estimate (based on real data but with missing geographies) and are comparable to Lowder et al. (2019, 2021).
A second gap is that there are no farm data reported for 30 geographies with active farming, ranging from very small (e.g. Andorra, Tuvalu) to very large (e.g. various countries from the former Soviet Union—including Ukraine, Belarus, Uzbekistan and Turkmenistan—as well as Sudan and South Sudan). These geographies do have estimates, however, for other indicators such as rural population and agricultural area. We therefore used the RP-F ratio from the nearest representative neighbor to provide the corresponding imputed farm number. The farm numbers for all geographies including those with imputed data (i.e., without original farm census data) are referred to the “imputed” series. These provide our best estimate to the number of farms and will be the main focus here.
Farm size is another key indicator but nationally representative farm size data are often lacking, and confounded by imprecise estimates and ambiguous categories (Lowder et al., 2016). As proxy for the national average farm size we associate the estimated agricultural land area with the corresponding estimated number of farms. For “agricultural land” we use the FAO reported annual data for the last 25 years per country (1994–2018; FAOStat, 2021) and extrapolate to 2020 and 2030 using an exponential triple smoothing algorithm. In 2018 the global agricultural land area amounted to 4.80 billion (109) ha (FAOStat, 2021).
For presentation purposes we present the data by regional groups (following Lowder et al., 2019) and the latest income groupings (WorldBank, 2021).
Results
We estimate the number of farms in 2020 to amount to 656 Million (M, 106) globally (imputed, Table 1). Our lower bound estimate would be at least 628 M (extrapolated, Table 1), which can be compared to the 608 M farms in the world by Lowder et al. (2019). Two-thirds of the 2020 farms (imputed) are located in Asia (39% in East Asia & Pacific [EAP]; 29% in South Asia [SA], Table 1), reflecting the two regional giants with over half the global farms: China with 189.6 M (29% of global farms) and India with 148.5 M (23%). As a region, SSA comes third with 111 M (17%), followed by Europe & Central Asia (ECA, 62 M, 10%), Latin America & Caribbean (LAC, 21 M, 3%), Middle East & North Africa (MENA, 19 M, 3%) and North America (NA, 2 M, 0.3%). The most marked divergences between the extrapolated and imputed estimates (Table 1) occur in ECA (16 M), SSA (7 M) and EAP (4 M) reflecting data availability.
Estimated 2020 farm number and key indicators for regions.
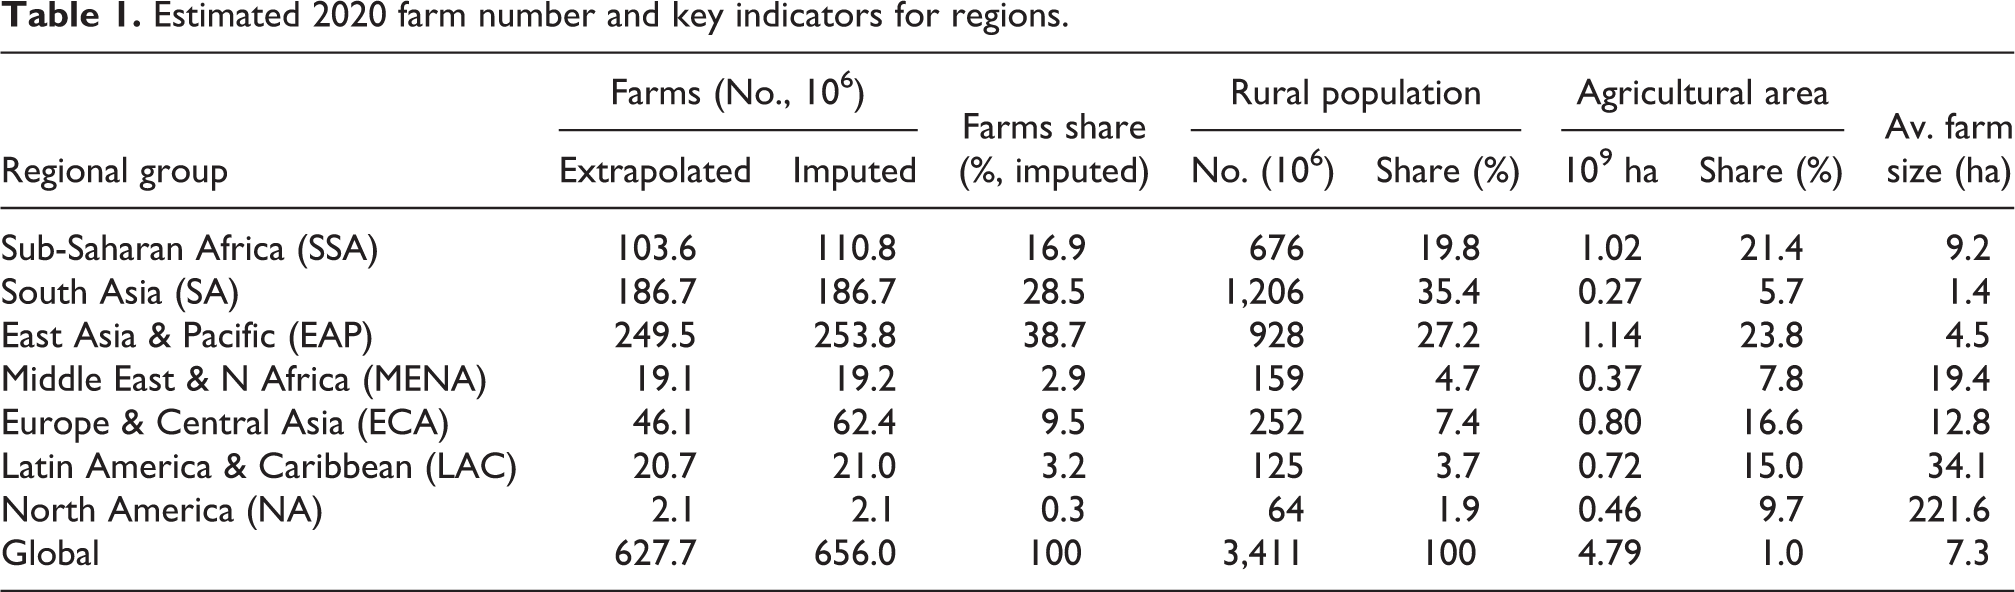
The rural population in 2020 is estimated at 3.4 billion globally, with over a third in SA and over a quarter in EAP (Table 1). The global agricultural land area is estimated at 4.8 billion ha, with 24% in EAP and 21% in SSA (Table 1). Globally, this implies an average imputed farm size of 7.3 ha—albeit with marked regional divergences (Table 1). Densely populated SA stands out with an average imputed farm size of only 1.4 ha, followed by EAP with 4.5 ha whereas SSA averages 9 ha. NA sits on the other extreme, with an average of 222 ha—with intermediate imputed farm sizes for the other regions (Table 1). India and China again play prominent roles. India has 26% of the global rural population, but only 4% of the agricultural land area with an imputed average farm size of 1.2 ha. China fares somewhat better with 16% of the global rural population and 11% of the agricultural area, and an imputed average farm size of 2.8 ha.
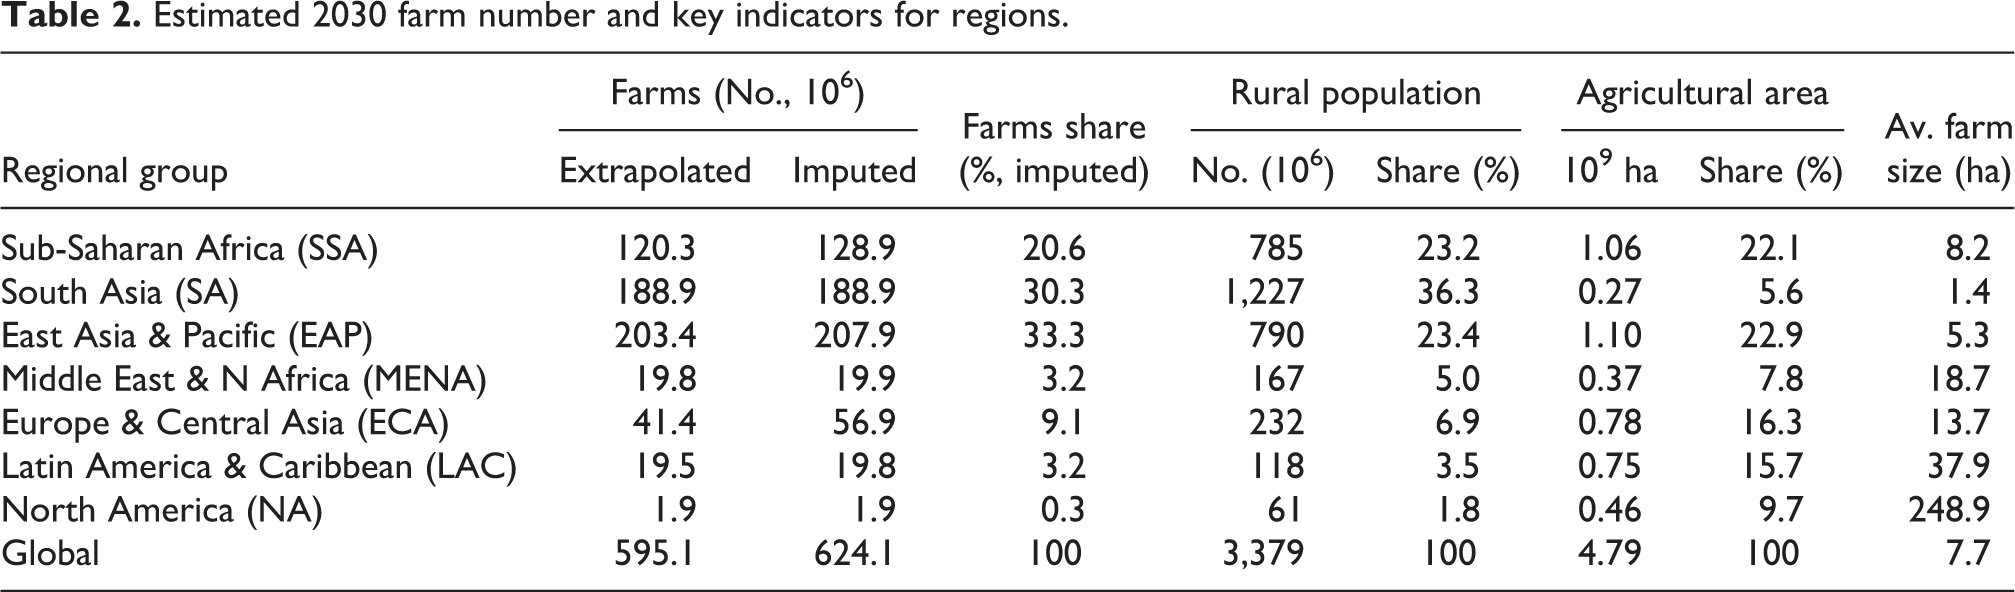
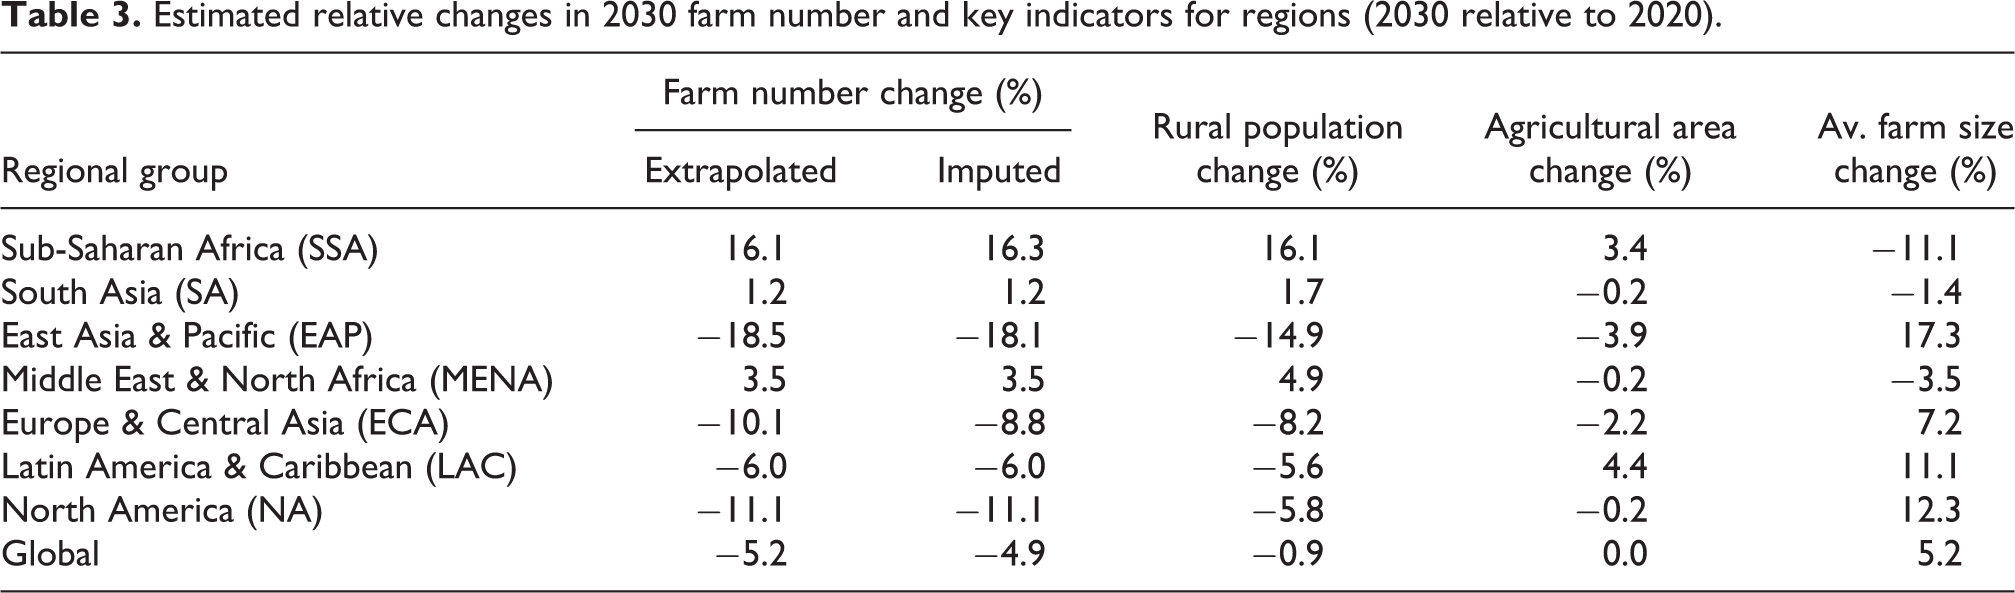
We provide similar estimates for 2030 in Table 2 and the relative changes over the decade in Table 3; and map the imputed farm estimates in Figure 1. We estimate the number of farms in 2030 to decline to 624 M globally (imputed; 595 M extrapolated—Table 2), a substantive decline of 5% (Table 3). At the same time the global rural population in 2030 is projected to decline by only 0.9% and agricultural land to remain constant at the global level (Table 3). The global aggregates however hide regional heterogeneity and diverging underlying drivers. Indeed, whereas the number of farms in 2030 is projected to decline globally and in a number of regions, it is projected to markedly increase by 16% to 129 M in SSA and to a lesser extent in the MENA (+3.5% to 20 M) and SA (+1.2% to 189 M). In contrast, the most pronounced decline in the number of farms in 2030 is projected for EAP (−18%, down to 208 M). A major driver behind these changes are the rural population dynamics. Particularly noteworthy is the projected decline in rural population in 2030 in EAP (−15%), largely driven by the ongoing urbanization and structural transformation in China (−23% in rural population). In contrast, SSA’s rural population is projected to increase by 16% in 2030. Similarly, rural populations in the MENA and SA are projected to increase at even larger rates than the predicted farm number increases. The diverging plight of China and India, the two global giants in terms of farm numbers (Figure 1), is particularly noteworthy. China’s projected rural population decline implies its farms are projected to come down to 146 M (23% of global farms) in 2030. In contrast, India’s rural population is projected to continue to increase with 0.6% over the decade to 2030 with its farms projected to increase to 149 M (24% of global farms), overtaking China in terms of the country with the largest number of farms.
Estimated 2030 farm number and key indicators for regions.
Estimated relative changes in 2030 farm number and key indicators for regions (2030 relative to 2020).
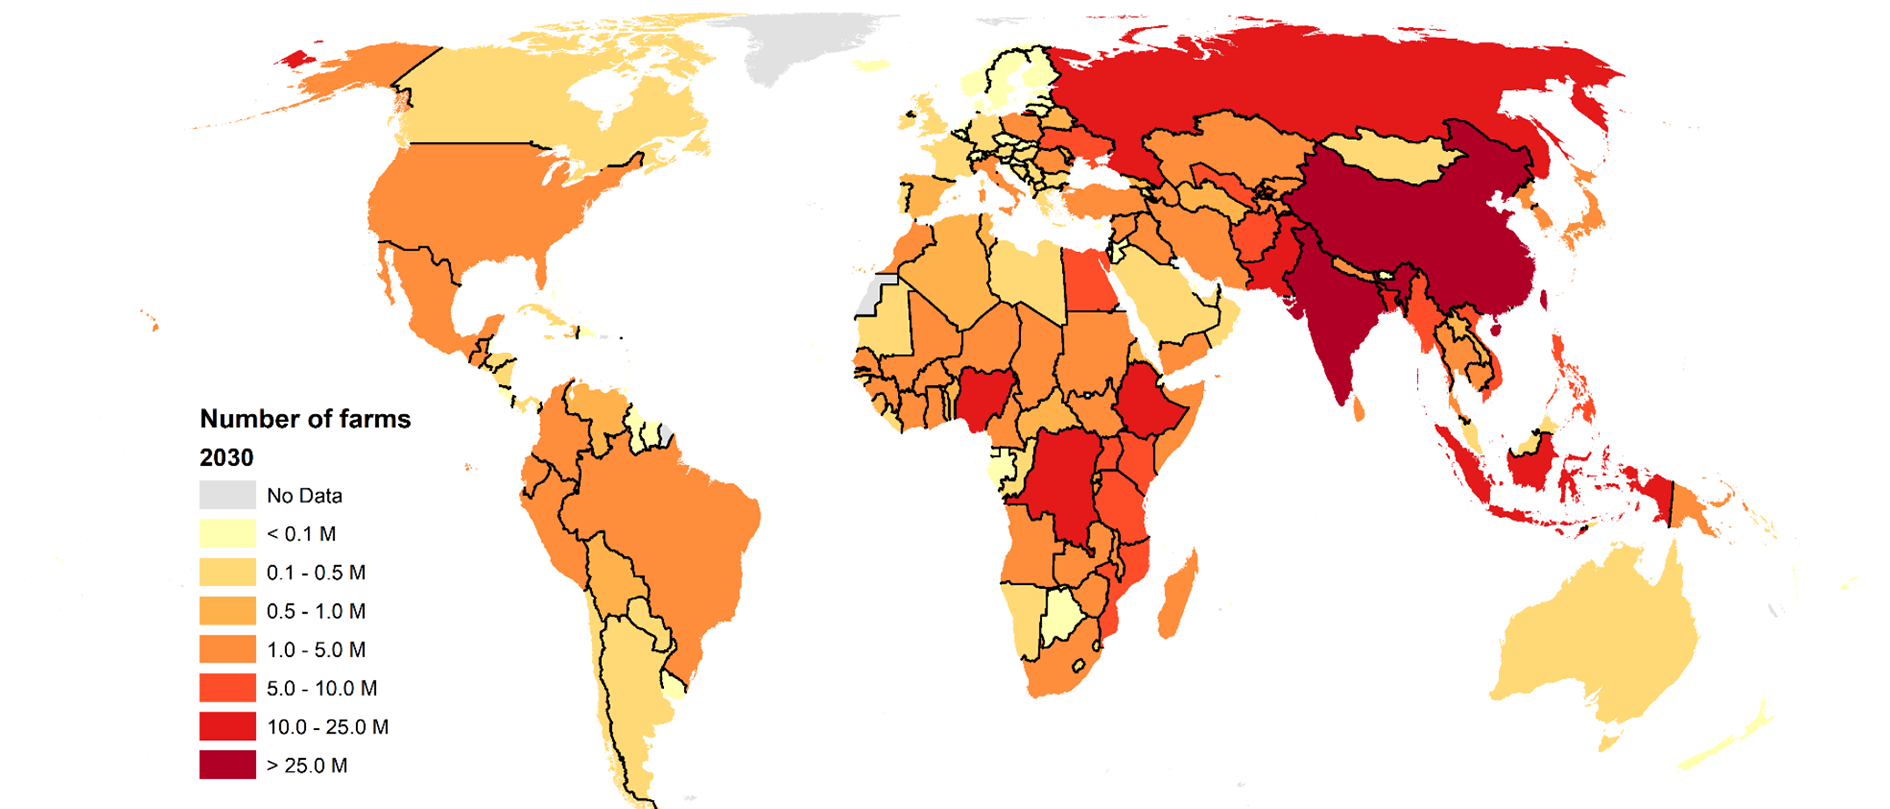
Map of estimated farms in 2030 (million of farms per country, imputed).
Whereas agricultural land is projected to remain constant at the global level (Table 3), this again masks regional heterogeneity. As a region, only LAC (+4.4%) and SSA (+3.4%) are projected to increase the agricultural land by 2030. Other regions are projected for marginal area declines to substantive declines in EAP (−3.9%) and ECA (−2.2%) by 2030. Globally, these changes imply a projected increase of 5% in the average imputed farm size to 7.7 ha by 2030—albeit again with marked regional divergences (Table 2). In SSA the projected area increase is insufficient to keep up with the surge in rural population and farm numbers, implying a marked decline in imputed farm size (−11%) by 2030. The two other regions with projected increases in rural population and farms also see a decline in imputed farm size by 2030, albeit less pronounced (MENA −3.5%; SA −1.4%). The most marked increases in projected average imputed farm size by 2030 are for EAP (+17%, albeit from a low base, to 5.3 ha) and NA (+12%, to 249 ha), both reflecting primarily consolidation given marginal area declines; followed by LAC (+11% to 38 ha, via a combination of land expansion and consolidation).
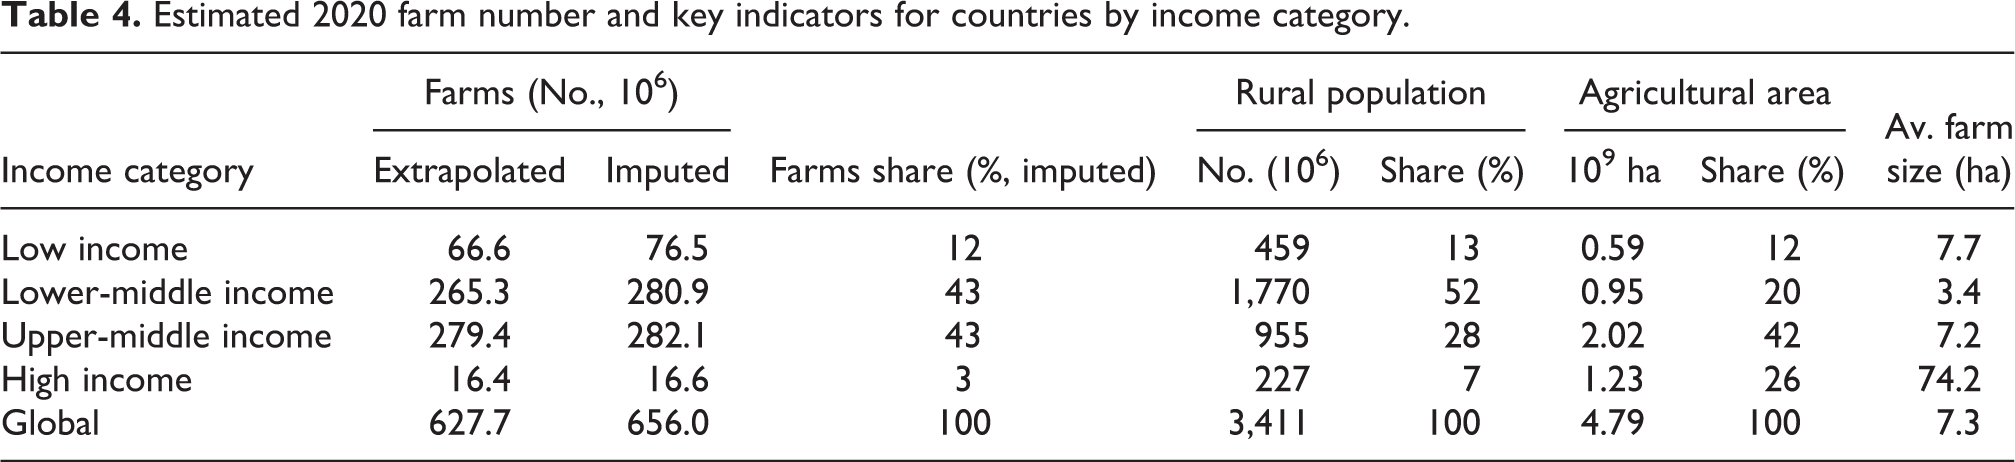
We provide similar estimates by country income groups for 2020 (Table 4) and 2030 (Table 5); and the relative changes over the decade (Table 6). Needless to say, the global headline figures remain the same—so we focus here on some of the noteworthy income group implications. The prominence of Lower-Middle Income Countries (LMICs) and Upper-Middle Income Countries (UMICs) comes to the fore. Between the two they comprise 86% of global farms in 2020, evenly split between the two groups. However, this split overlays a remarkable contrast between the two groups. Compared to the UMICs in 2020, the LMICs have double the rural population (1.8 billion, 52% of global), half the agricultural land area (1 billion ha, 20% of global) and half the average imputed farm size of 3.4 ha. Only 3% of farms are located in High Income Countries (HIC), with 12% in Low Income Countries (LIC). Compared to the HICs in 2020, LICs have more than four-fold the number of farms, double the rural population on half the agricultural area, and a tenth of the average imputed farm size.
Estimated 2020 farm number and key indicators for countries by income category.
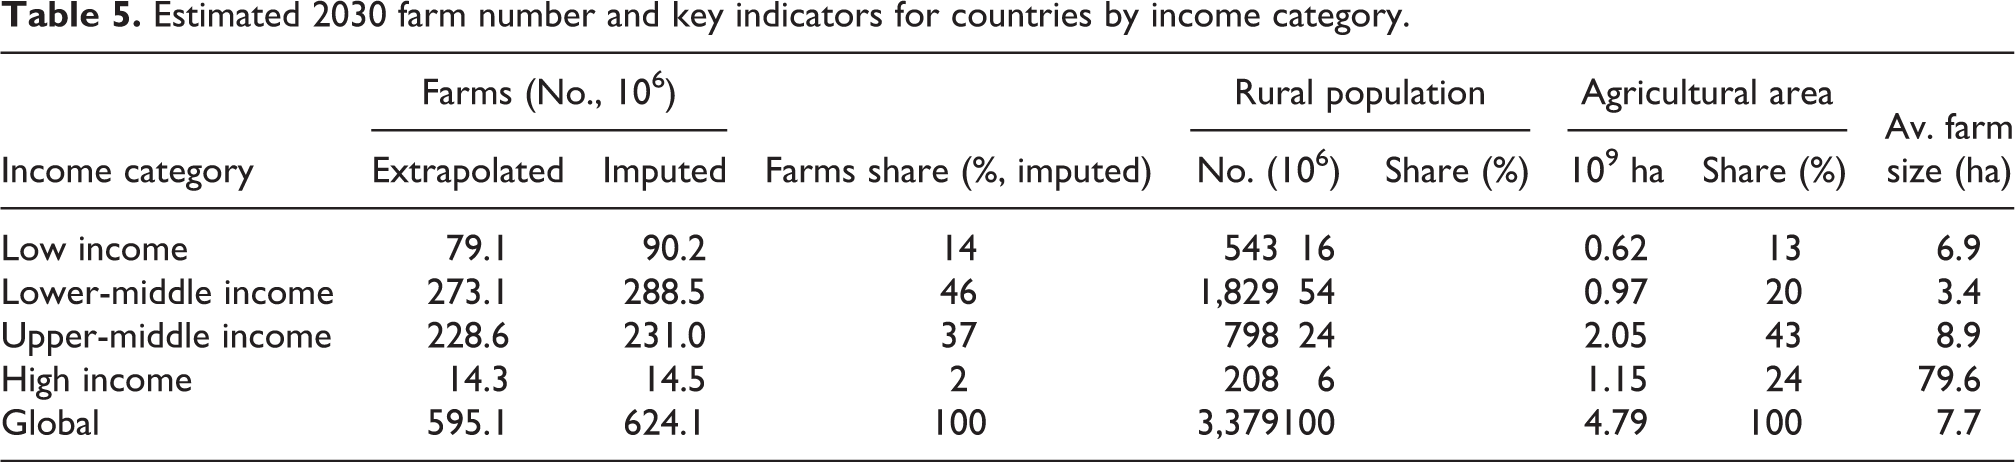
Estimated 2030 farm number and key indicators for countries by income category.
Estimated relative changes in 2030 farm number and key indicators for countries by income category (2030 relative to 2020).
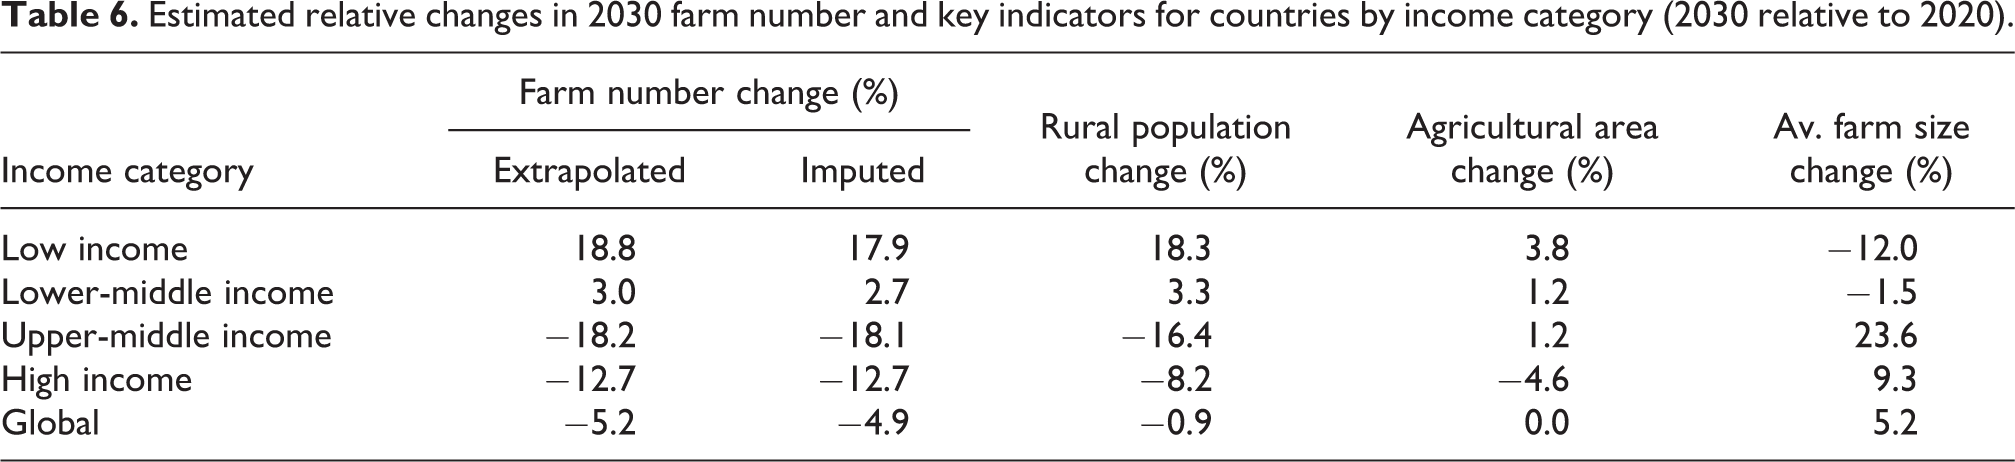
The projections to 2030 (Table 5) and the relative changes over the decade (Table 6) show marked contrasts between income groups. By income group, rural population growth and the increase in farm numbers by 2030 is limited to the LICs and LMICs, with both indicators projected to decline in UMICs and HICs. The increases are most marked in the LICs (+18%) with a more modest increase of 3% in LMICs by 2030. Overall, the LICs and LMICs combined are projected to comprise 61% of global farms in 2030, up from 55% in 2020. Agricultural area in 2030 is projected for a substantive contraction in HICs (−5%), modest increases in the middle-income groups (+1%) and the most substantive increase in the LICs (+4%). The increases in agricultural area in LIC and LMICs, combined with the expected growth in number of farms, implies decreasing farm sizes, particularly in the LICs, by 2030 and highlights the need for (sustainable) intensification. In contrast in UMICs, the projected declining farm numbers and modest area increase imply substantive imputed farm size increases by 2030, albeit still remaining a fraction of the those in HICs.
Discussion
Our estimate of 656 M farms globally in 2020 and projected decline to 624 M farms globally by 2030 remain estimates. In no way are they intended to replace the substantive efforts needed to run regular censuses in all countries to keep track of this key indicator. Our projections rely on actual empirical validation of the underlying data—and they are likely to increase in robustness as data become available from more countries. Our study can be taken as a clarion call to action: our collective insights into the number and distribution of the world’s farms requires better data, which in turn requires increased public investment. Priority attention should be paid to those countries yet to implement any agricultural census, followed by those that have done so to continue to do so regularly. Without such a key indicator as the number of farms, an important guidepost for agricultural policy and development remains absent.
In the meantime, our global and disaggregated estimates provide a useful reference to frame our development efforts toward the Agenda 2030 and beyond. It allows us to temporarily fill in the gaps, be they spatial or temporal. Indeed, the agricultural censuses by themselves are Herculean tasks. Compiling them across the globe into reference decades provides an additional layer of complexity—illustrated by the “2010” round (2006–2015) just being published (FAO, 2021). Estimates such as those provided here allow for temporary estimates as we update the censuses. Although some countries increasingly align with the census rounds (e.g., much of the EU used the same 2010 year), the 10-year period covered by each round can still imply substantive time lags between individual countries. Our paper inter alia illustrates that even in a 10-year period many key indicators can change substantially. Estimates such as those provided here increase the comparability between countries by using common reference years and comparable projections. And importantly, estimates such as these allow to generate proxies to fill in the still substantive gaps in terms of spatial coverage and come up with global estimates.
Whereas agricultural censuses are the foundation, two additional key variables underlying our estimates are the rural population projections and the rural population to farm ratio (RP-F ratio). Substantive new information in relation to any of these key variables would allow us to revisit the assumptions and refine the estimates. In upper-middle and high income countries the data generally support an increase in RP-F ratios with economic development, reflecting the underlying economic transformation and decreasing role of agriculture in GDP and employment (Christiaensen et al., 2021). In low and lower-middle income countries the situation is less clear cut—and we kept to the most recent estimates. As data quality improves, we can revisit the underlying trends in RP-F ratios. Still, the observed trends and assumptions imply quiet substantive changes over our 10-year projection to 2030. When we consider the diverse pace of economic and rural transformation across countries—some making rapid progress, while others stagnate or even regress—it is clear that we need to be careful not to extrapolate too far into the future, and also need to continuously update and ground truth the key indicators as we go forward. The recent economic shocks imposed by the COVID-19 pandemic and associated economic fallout suggest that further adjustments may be needed even in the short term.
The heterogeneity in countries in terms of size and farm numbers also implies the need to at least have up-to-date and reliable estimates for those with the larger farm numbers for global estimates (Figure 1). China and India are a case in point (Figure 1)—the two Asian giants comprising more than half the global farms in 2020 (52%) and slightly less than half in 2030 (47%), with China being a major contributing force to the projected decline in global farm numbers (Supplementary material, Table S1). Recent research starts to shed light on China’s ongoing rural transformation (Zhang et al., 2021). Rural households increasingly work off-farm and rent out their land to remaining farmers, with farm size steadily increasing (from a low base; Huang and Rozelle, 2018). Taken together, the 10 countries with the largest farm numbers comprise 70% of the global farms in 2020 (and 67% in 2030; i.e. China, India, Indonesia, Russian Federation, Ethiopia, Nigeria, Bangladesh, Vietnam, Pakistan and DR Congo—Supplementary material, Table S1).
We have presented our findings in this paper by regional and income groupings. Each provided specific insights and some of the big-picture implications. Additional groupings may be of interest, including the overlay of region by income but were out of scope of the current paper. At the same time having a proxy of the number of farms at the national level is a useful entry point. However, most policy and development efforts would benefit from more disaggregated data (e.g. Masters et al., 2013). A future challenge remains to estimate the spatial distribution of farms of different sizes within countries. Some advances have been made to estimate the spatial distribution of key indicators at the subnational level—particularly useful where robust statistics and georeferencing are patchy (Ricciardi et al., 2018a; Samberg et al., 2016). Cases in point are efforts to map population (FCL and CIESIN, 2016; Linard et al., 2012), field size (Fritz et al., 2015; Lesiv et al., 2019), crops (Lu et al., 2020) and development outcomes (Burke et al., 2021) where advances in remote sensing, machine learning and crowdsourcing have drastically increased spatial resolution and acquisition time as well as repeatability (Masoud et al., 2020). This also opens the door to overlays and indicator combinations. Actually knowing the number of farms in a specific country in 2020 would be an achievement compared to our current estimate. Still, agricultural research and development and their funders increasingly call for more granular data. The CGIAR again is a case in point, with an increased emphasis on innovation profiles, associated market segments and investment cases. In the case of germplasm products this implies the need to know not only the number of farms in a specific country, but the number of farms cultivating crop X within market segment Y in that country.
The current paper also touched on the imputed farm size in 2020 and 2030, reflecting the overall agricultural land by farm numbers for the geographic entities. At the global level, we project the average imputed farm size to increase by 5% by 2030. However, particularly in low income countries and SSA the imputed farm size is projected to substantially decrease by 11–12%. This highlights the urgency of making real progress on inclusive and sustainable intensification in the developing world. Sustainable intensification thereby calls for the need to raise land productivity through agricultural intensification (in order to offset further extensification/area expansion) in a durable way with minimal external costs (limiting e.g. short term productivity gains which cannot be sustained over time like soil nutrient mining and environmental externalities like nitrogen leaching/run-off). Our projections for low and lower-middle income countries largely align with the farm size dynamics reported elsewhere (e.g. Masters et al., 2013), even if not directly comparable given those estimates relate to a subset of countries with actual data (Lowder et al., 2016, 2021). This includes the often increasing concentration of farmland among large farms as economies grow and reiterates the need to consider economic and rural transformation processes.
The current paper focused primarily on farm numbers and remained largely silent on farm types. From a development perspective much of the interest revolves around family and smallholder farms and their roles in facilitating a broadly shared rural transformation. Lowder et al. (2016, 2021) estimate that >90% of global farms are family farms occupying around 70–80% farmland and producing 80% of the world’s food in value terms. They also distinguish family farms from small farms (i.e., <2 ha). They estimate that 84% of all farms worldwide are small farms albeit operating only around 12% all agricultural land. Ricciardi et al. (2018b) estimate such small farms (<2 ha) to occupy 24% of agricultural gross area based on 55 countries. Care is needed when comparing studies, as other label farms <2 ha as “very small” farms (Herrero et al., 2017; Samberg et al., 2016). Samberg et al. (2016) used such a broader definition for small farms (<5 ha) and estimated these to produce more than 70% of the food base calories and use 30% of the agricultural land in their target countries in the Global South. Herrero et al. (2017) estimates farms <2 ha to contribute 30% to most food commodities; and farms ≤20 ha to produce >75% of most food commodities in much of in SSA and Asia. Following Lowder et al. (2016) ratios, we would estimate the number of family farms to amount to 590 M in 2020; with small farms amounting to 551 M. However, the ongoing changes in farm structure in many parts of the world are an important, if complex, phenomena that would be useful for extensions of this work to engage with. For example, in SSA, the increasing share of production under medium-scale farms has been documented for relatively land-abundant countries (Byerlee and Deininger, 2013; Chamberlin and Jayne, 2020; Jayne et al., 2016, 2019; Sitko and Chamberlin, 2015). While the drivers and impacts of these changes are still not entirely clear, it seems clear that estimating their spatial distribution now and into the future would be very relevant for targeting interventions and monitoring changes in the agri-food system.
Conclusion
This analysis set out to get a better handle on some of the key indicators for the global development agenda. We have focused on the number of farms and harmonized estimates for 2020 and projections to 2030, although we have also argued that this is just a starting point for assembling the data required to guide strategic policy priorities and investments. We have articulated some of the improvements needed to enhance the robustness and utility of such estimates.
Our analysis may prompt doubts about our collective ability to achieve Agenda 2030: the already ambitious SDGs appear increasingly out of reach in light of the ongoing pandemic, and further challenged by climate change. Yet in the end, farms are set to remain the foundation for much of the rural populace in low and low-middle income countries to safeguard and improve their livelihoods for the coming decades. Reliable estimates of farm numbers and associated indicators thereby merit more attention in global sustainable development efforts and our quest to understand and support economic and rural transformation.
Supplemental material
Supplemental Material, sj-docx-1-oag-10.1177_00307270211025539 - Farms worldwide: 2020 and 2030 outlook
Supplemental Material, sj-docx-1-oag-10.1177_00307270211025539 for Farms worldwide: 2020 and 2030 outlook by Olaf Erenstein, Jordan Chamberlin and Kai Sonder in Outlook on Agriculture
Footnotes
Acknowledgment
The authors acknowledge the suggestions from reviewers which have helped shape the final version.
Declaration of conflicting interests
The authors declared no potential conflicts of interest with respect to the research, authorship, and/or publication of this article.
Funding
The authors disclosed receipt of the following financial support for the research, authorship, and/or publication of this article: The study was supported by the CGIAR Research Programs on Maize (CRP MAIZE) and Wheat (CRP WHEAT). The views expressed here are those of authors and do not necessarily reflect the views of the funders or associated institutions.
Supplemental material
Supplemental material for this article is available online.
References
Supplementary Material
Please find the following supplemental material available below.
For Open Access articles published under a Creative Commons License, all supplemental material carries the same license as the article it is associated with.
For non-Open Access articles published, all supplemental material carries a non-exclusive license, and permission requests for re-use of supplemental material or any part of supplemental material shall be sent directly to the copyright owner as specified in the copyright notice associated with the article.