
Abstract
This article assesses the technical efficiency of 28 Indian states in delivering elementary education between 2009–2010 and 2020–2021, using the stochastic frontier model developed by Battese and Coelli. The findings indicate that technical inefficiency accounts for 82 per cent of the interstate disparities in elementary education output. Factors such as public expenditure, schooling infrastructure and the presence of qualified teachers positively impact output. However, the effect of public expenditure diminishes beyond a certain threshold. Higher literacy rates, increased urbanisation and a greater proportion of government schools improve efficiency. Conversely, a higher percentage of scheduled caste and scheduled tribe children and the appointment of contractual teachers decrease efficiency. The overall technical efficiency stands at 79 per cent. Efficiency varies widely across states, ranging from 52 per cent to 94.5 per cent. Goa, Haryana and Kerala demonstrate the highest efficiency, while Arunachal Pradesh, Meghalaya and Manipur rank the lowest. Some states have seen improvements in efficiency, while others have experienced declines. These findings suggest that resource-poor states can benefit from increased public expenditure, whereas efficient resource utilisation is crucial for states facing inefficiencies. This article provides essential insights for policymakers to address regional imbalances and enhance elementary education outcomes.
1. Introduction
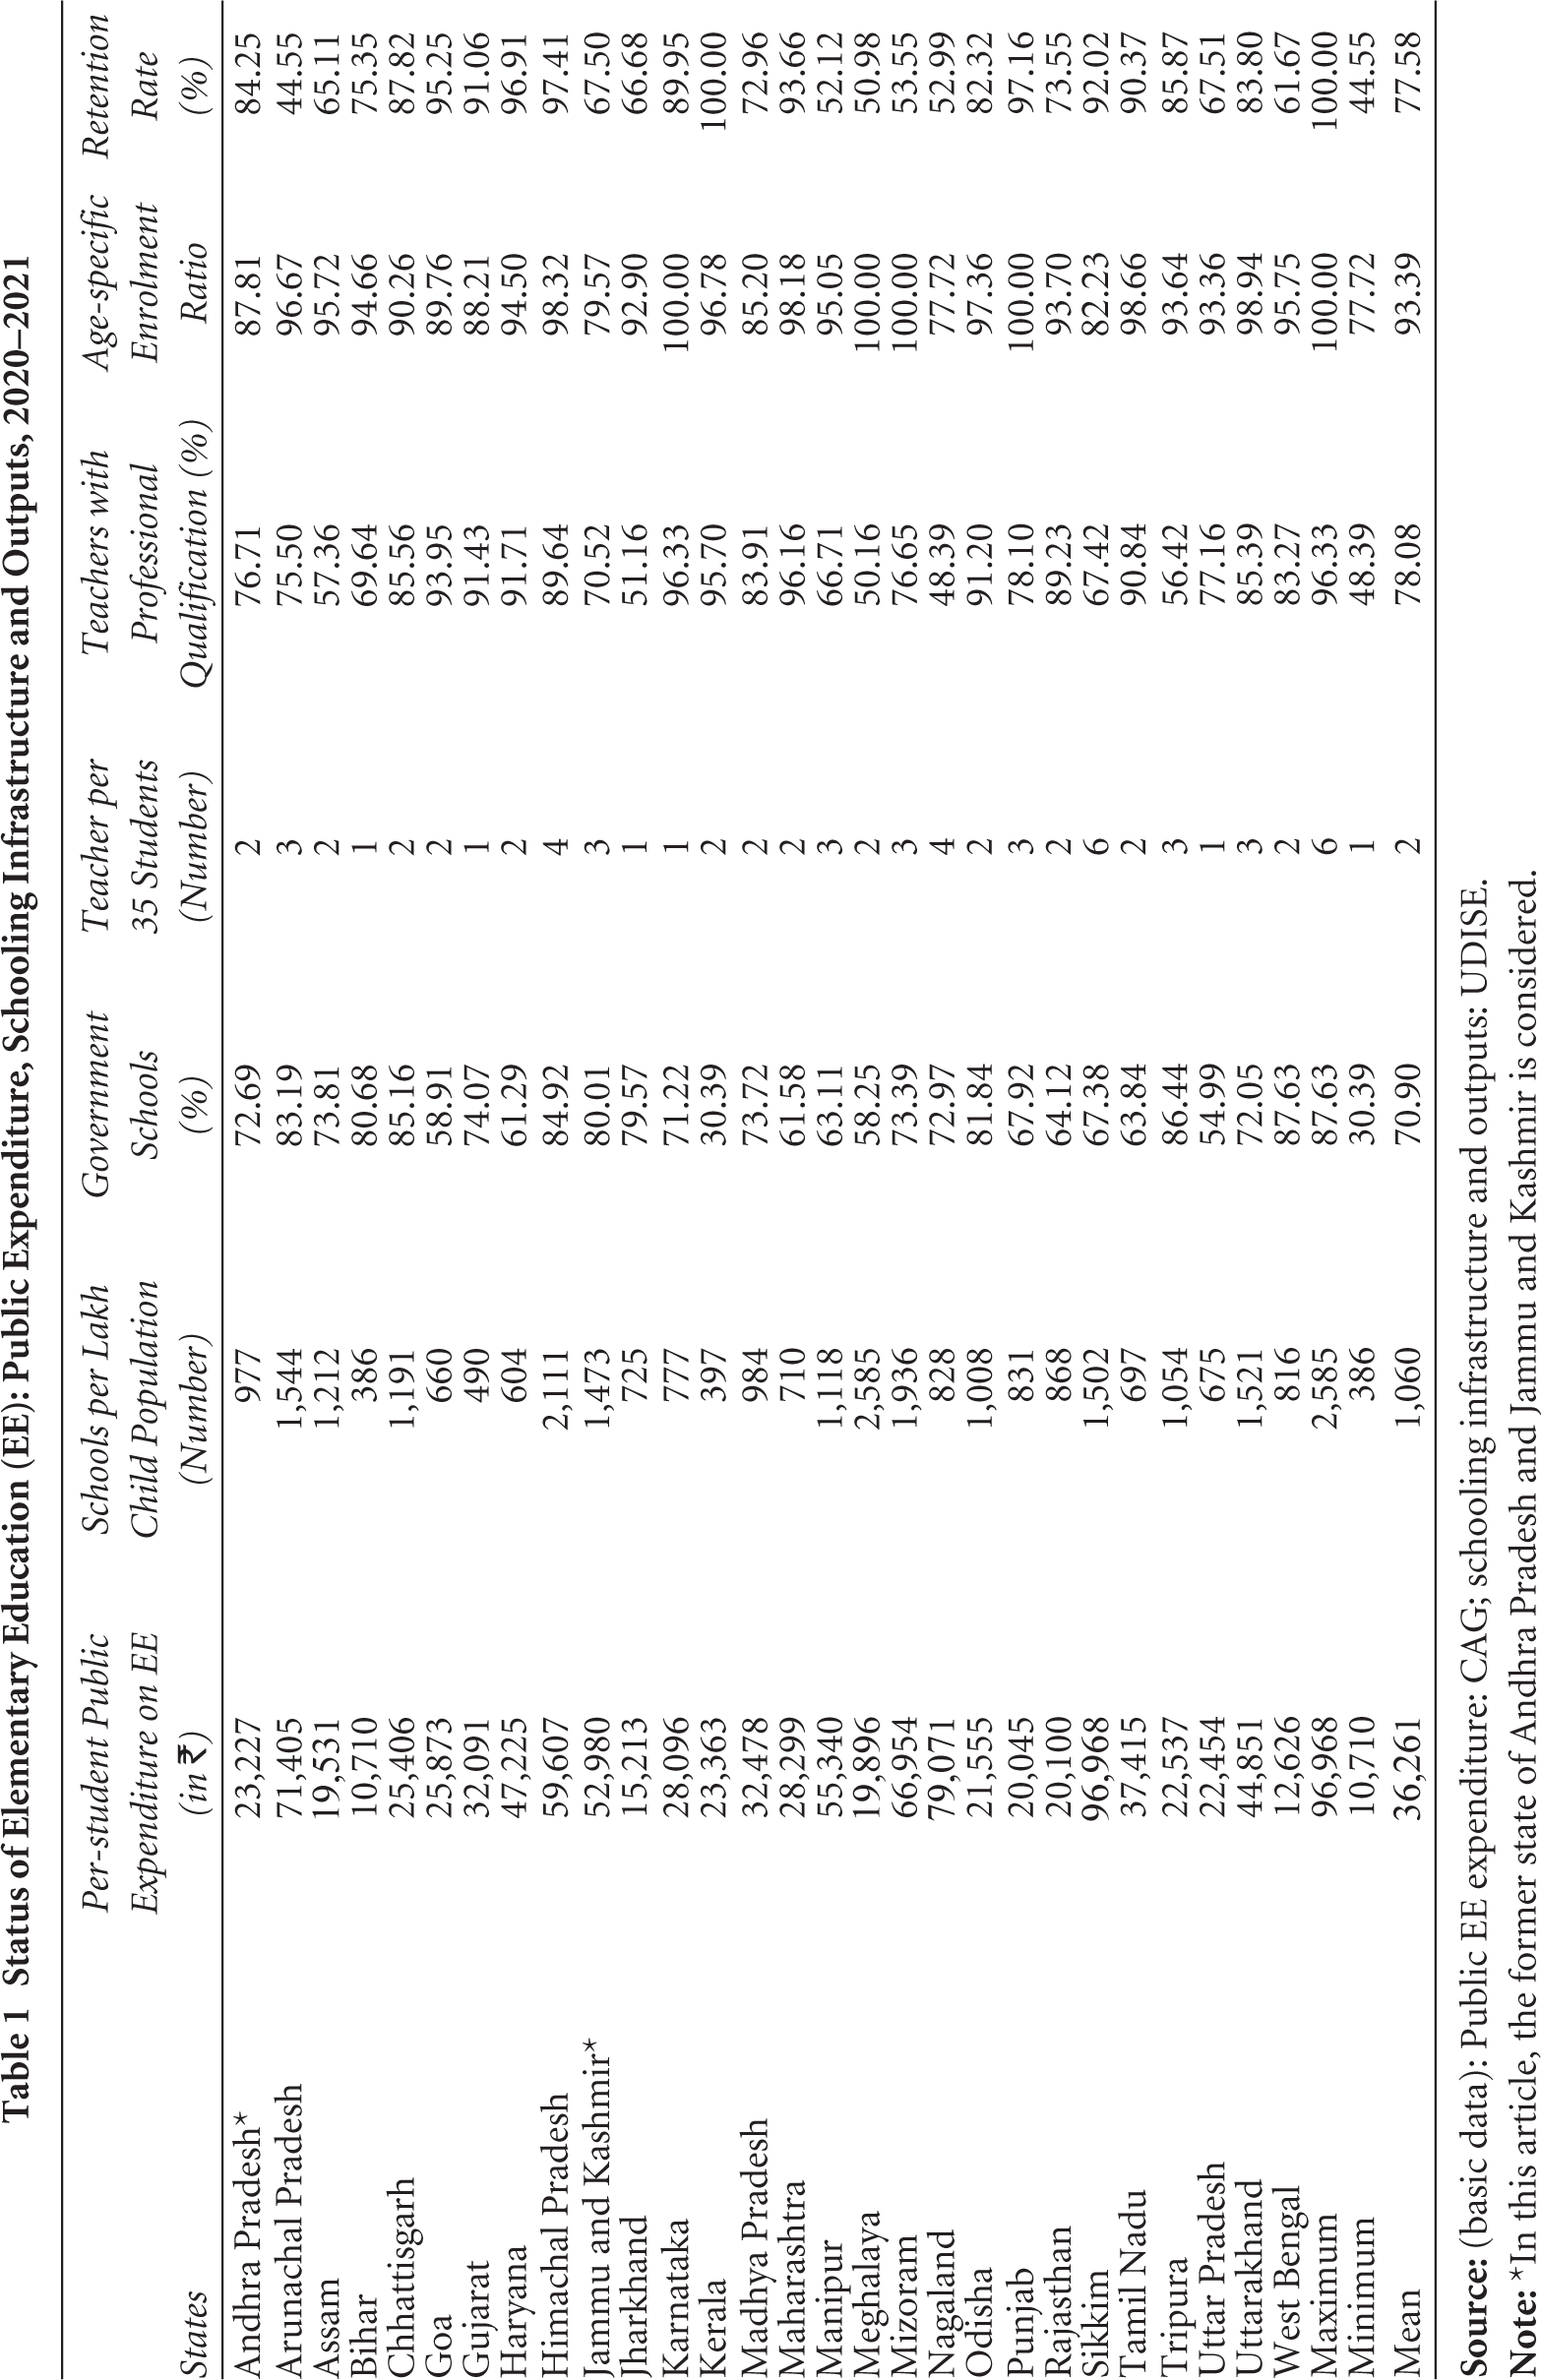
Elementary education, being a merit good, attracts substantial public funding from countries worldwide, and India is no exception. In 2020–2021, India allocated 1.33 per cent of its GDP to elementary education, surpassing the public spending of several neighbouring countries, including China (0.84 per cent), Myanmar (0.78 per cent), Pakistan (0.92 per cent), Sri Lanka (0.44 per cent) and Bangladesh (0.97 per cent). During the same period, Indian states spent an average of ₹36,261 per student per annum (pspa) on elementary education. 1 However, a meticulous examination of input and output dynamics across Indian states reveals pronounced interstate disparities, indicating underlying inefficiencies in the production of elementary education.
States exhibit diverse spending patterns, with some achieving favourable outcomes 2 through moderate spending, while others grapple with poor outcomes despite higher financial allocations. For example, in 2020–2021, Sikkim and Nagaland spent ₹96,968 and ₹79,071 pspa, respectively. However, the age-specific enrolment ratios in these states were 82 and 78 per cent, respectively. On the other hand, states such as Karnataka, Punjab and Meghalaya attained 100 per cent enrolment with a moderate amount of spending. Similarly, Arunachal Pradesh recorded the lowest retention rate (45 per cent) in 2020–2021, despite an expenditure of ₹71,405 pspa. In contrast, Meghalaya and Assam maintained retention rates of 51 and 65 per cent, respectively, with comparatively lower spending of ₹19,896 and ₹19,531, respectively (Table 1).
Disparities in educational infrastructure are also evident. In 2020–2021, Meghalaya notably surpassed Bihar (seven times more), Uttar Pradesh (four times more) and West Bengal (three and a half times more) in the number of schools per lakh child population. Additionally, significant variations exist in the percentage of government schools across states. Kerala (30 per cent), Uttar Pradesh (55 per cent), Meghalaya (58 per cent) and Goa (59 per cent) reported the lowest percentages of government schools. In contrast, West Bengal (88 per cent), Tripura (86 per cent), Chhattisgarh (85 per cent) and Himachal Pradesh (85 per cent) had the highest proportion of government schools (Table 1).
The Government of India (2017) reveals that several states grappling with low enrolments and an excess of schools and teachers. In 2015–2016, Arunachal Pradesh had 7.3 per cent of primary schools and 13 per cent of upper primary schools with zero enrolment. In Sikkim, 83.3 per cent of primary schools had an enrolment of less than 30, while it was 70 per cent in Jammu and Kashmir and Arunachal Pradesh. Similarly, at the upper primary level, 56 per cent of schools in Jammu and Kashmir, 50 per cent in Nagaland and 43 per cent in Arunachal Pradesh had an enrolment of fewer than 30 students. These findings further suggest inefficiencies in public resource allocation.
The Right to Education Act specifies that having 1 teacher per 35 students is ideal. In 2020–2021, only Bihar reported a shortage of teachers. Conversely, Sikkim, Himachal Pradesh, Nagaland, Jammu and Kashmir, Arunachal Pradesh, Mizoram and Uttarakhand had 3 to 6 teachers per 35 students. Many states also had lower percentages of qualified teachers (i.e., those holding a Bachelor of Education degree or equivalent professional qualification). The states with the lowest percentages were Nagaland (48.38 per cent), Meghalaya (50.16 per cent), Jharkhand (51 per cent), Tripura (56 per cent), Assam (57 per cent), Manipur (66 per cent) and Sikkim (67 per cent) (Table 1). These facts highlight the need to assess the technical efficiency of Indian state governments in providing elementary education.
Status of Elementary Education (EE): Public Expenditure, Schooling Infrastructure and Outputs, 2020–2021
Technical efficiency refers to the ability of the state governments (here, the decision-making unit) to produce the maximum possible output from a given set of inputs and technology. The education production process of a state is technically efficient if the actual output is equal to the potential output.
Few Indian studies have examined the efficiency of education outcomes at the state level. For example, Mohanty and Bhanumurthy (2020) analysed the efficiency of the education and health sectors across Indian states. Gourishankar and Lokachari (2012) focused on education development and efficiency. Dutta (2012) and Ghose (2017) assessed the efficiency of elementary education outcomes across Indian states for 2007–2008 and 2005–2006 to 2010–2011, respectively. Purohit (2016) studied the efficiency of elementary education outcomes in urban areas for 2012–2013 across 19 states.
The existing Indian studies are confined to a select group of states, rely on cross-sectional data and use Data Envelopment Analysis (DEA). 3 However, the DEA methodology suffers from various limitations: (a) it is highly sensitive to variable selection, (b) subject to small sample bias and (c) produces biased estimates in the presence of statistical noise. The stochastic frontier approach (SFA) is relatively stable and is a preferred methodology for policymaking (Coelli et al., 2005; Rassouli-Currier, 2007). SFA is a parametric method used to assess the technical efficiency of decision-making units by considering both random shocks and inefficiencies in the production process.
This article addresses the limitations of existing Indian research by using the stochastic frontier estimation method developed by Battese and Coelli (1995). This method simultaneously estimates the frontier production function and inefficiency effects function, providing a more accurate estimation of technical efficiency compared to the DEA. This article estimates the technical efficiency of 28 Indian states (including former states of Andhra Pradesh and Jammu and Kashmir) from 2009–2010 to 2020–2021 in providing elementary education. It uses the latest data and considers a wider range of explanatory variables to gain a deeper understanding of the topic. It also identifies the determinants of technical inefficiency. This article fills a crucial gap in the literature and offers valuable insights for identifying best practices and developing strategies for optimal public resource allocation, along with pertinent policy recommendations.
This article is structured as follows: The second section provides a brief literature review, the third section discusses the methodology, the fourth section presents empirical results, and the fifth section concludes.
2. Review of Literature
2.1 Empirical Literature on Education Outcome Efficiency
International studies have extensively explored education outcome efficiency. Koku (2015) analysed data from 15 West African countries and found that public expenditure did not significantly impact primary and secondary school enrolment. Instead, per capita GDP emerged as a key positive influencer. Guarini et al. (2020) found a positive effect of both public education expenditure and private wealth on schooling years in 17 regions of Italy. Miningou (2019) developed the Learning Adjusted Years of Schooling index, an education outcome indicator. This article examined the efficiency of 130 countries and found a positive impact of public expenditure on outcomes but a negative impact when considering the square of public expenditure (i.e., the impact of public expenditure on education outcomes appeared to diminish beyond a point).
A significant number of studies favour DEA over SFA due to DEA’s ability to handle multi-input and multi-output scenarios. For example, Campoli et al. (2019) used DEA to determine the efficiency of 27 Brazilian federative units. Dufrechou (2016) compared the efficiency of 11 Latin American countries with 24 high-income countries, using DEA.
Learning outcome data provided by the Program for International Student Assessment (PISA) surveys has been used in several cross-country and country-specific studies. Delprato and Antequera (2021) used the PISA survey data to compare the efficiency of public and private schools in four Latin American countries, namely, Ecuador, Guatemala, Honduras and Paraguay. Salas-Velasco (2020) used it to study the efficiency of public schools in Spain. Ciro and García (2018) measured the efficiency of 37 developed and developing countries in providing secondary education. Cuéllar (2014) compared the efficiency of 15 Latin American countries.
As discussed in the first section, Indian studies on education outcome efficiency are scarce. The few Indian studies that focus on the elementary education sector, treat primary education (grades 1–5) and upper primary education (grades 6–8), separately. One pioneering study by Sankar (2007) measured the efficiency of 27 Indian states in producing educational outcomes such as enrolment, retention, language scores and math scores. Results indicated that both economically disadvantaged states, such as Jharkhand, Uttar Pradesh and Madhya Pradesh, and prosperous states, such as Himachal Pradesh, Tamil Nadu and Kerala, were highly efficient. In contrast, Chhattisgarh, Assam and Gujarat were the least efficient and had lower outcomes.
Dutta (2012) measured elementary education efficiency in Indian states and found that in 2007–2008, Delhi, Kerala and Tamil Nadu excelled in educational outcomes and efficiency, while Bihar, Rajasthan, Madhya Pradesh, Odisha and Uttar Pradesh struggled with lower outcomes and inefficiency due to inadequate inputs.
Purohit (2016) studied the efficiency of primary and upper primary education in urban areas across 19 states in 2012–2013. This article found that Andhra Pradesh, Maharashtra and West Bengal were the most efficient states, while Goa and Uttarakhand were the least efficient. Ghose (2017) estimated technical efficiency scores at both primary and upper primary levels from 2005–2006 to 2010–2011. This article found that Karnataka and Tripura were fully efficient at the primary level, whereas Andhra Pradesh and Kerala were fully efficient at the upper primary level. Bihar, Gujarat, Maharashtra, Tamil Nadu and West Bengal also exhibit high efficiency levels. Purohit (2015) and Ghose and Bhanja (2014) have estimated the district level efficiency in enrolments at primary and upper primary levels, in Rajasthan and West Bengal, respectively.
Notably, the Indian studies employed a two-step DEA methodology, which is known for producing biased estimates. These studies are outdated and also lack a comprehensive examination of the entire elementary education sector.
2.2 Empirical Literature on the Determinants of Technical Efficiency (or Inefficiency)
Empirical studies also identify various environmental factors that impact technical efficiency/inefficiency in the education production process. Guarini et al. (2020) emphasised that social capital and quality local governance enhance efficiency. Dufrechou (2016) discovered that economic globalisation had a positive impact on efficiency, while democracy showed a negative association. Additionally, higher income levels led to non-linear efficiency gains. Koku (2015) highlighted the positive impact of corruption control and political stability, on technical efficiency.
Delprato and Antequera (2021) discussed that favourable student-specific factors (such as attending preschool, students’ health, etc.), teacher-specific factors (such as work satisfaction, professional qualification, etc.) and school-specific factors (such as fund availability, enrolment, class size, etc.) had a positive impact on efficiency. Herrera and Ouedraogo (2018) found that increased public expenditure, a higher public-to-private financing ratio, AIDS/HIV prevalence and urbanisation had adverse impacts on efficiency. Inequality and aid dependency showed mixed results, whereas GDP and good governance had a positive impact.
Ciro and García (2018) found that GDP/income and parents’ educational attainment positively impact efficiency. Chakraborty (2009) highlighted that poverty reduces efficiency, and the proportion of minority populations has a positive impact on inefficiency. Salas-Velasco (2020) discussed that private school administration, school autonomy and teacher morale positively impact technical efficiency. Similarly, Kang and Greene (2002) found that private schools in the United States are more efficient in generating education outcomes.
Indian studies by Sankar (2007), Dutta (2012), Purohit (2015, 2016), Ghose (2017), Ghose and Bhanja (2014) and Mohanty and Bhanumurthy (2020) identified factors affecting education outcome efficiency. Population density, literacy rate, school infrastructure and teacher training grants were found to positively impact efficiency, while factors such as student–classroom ratio, urbanisation and income inequality had varying effects.
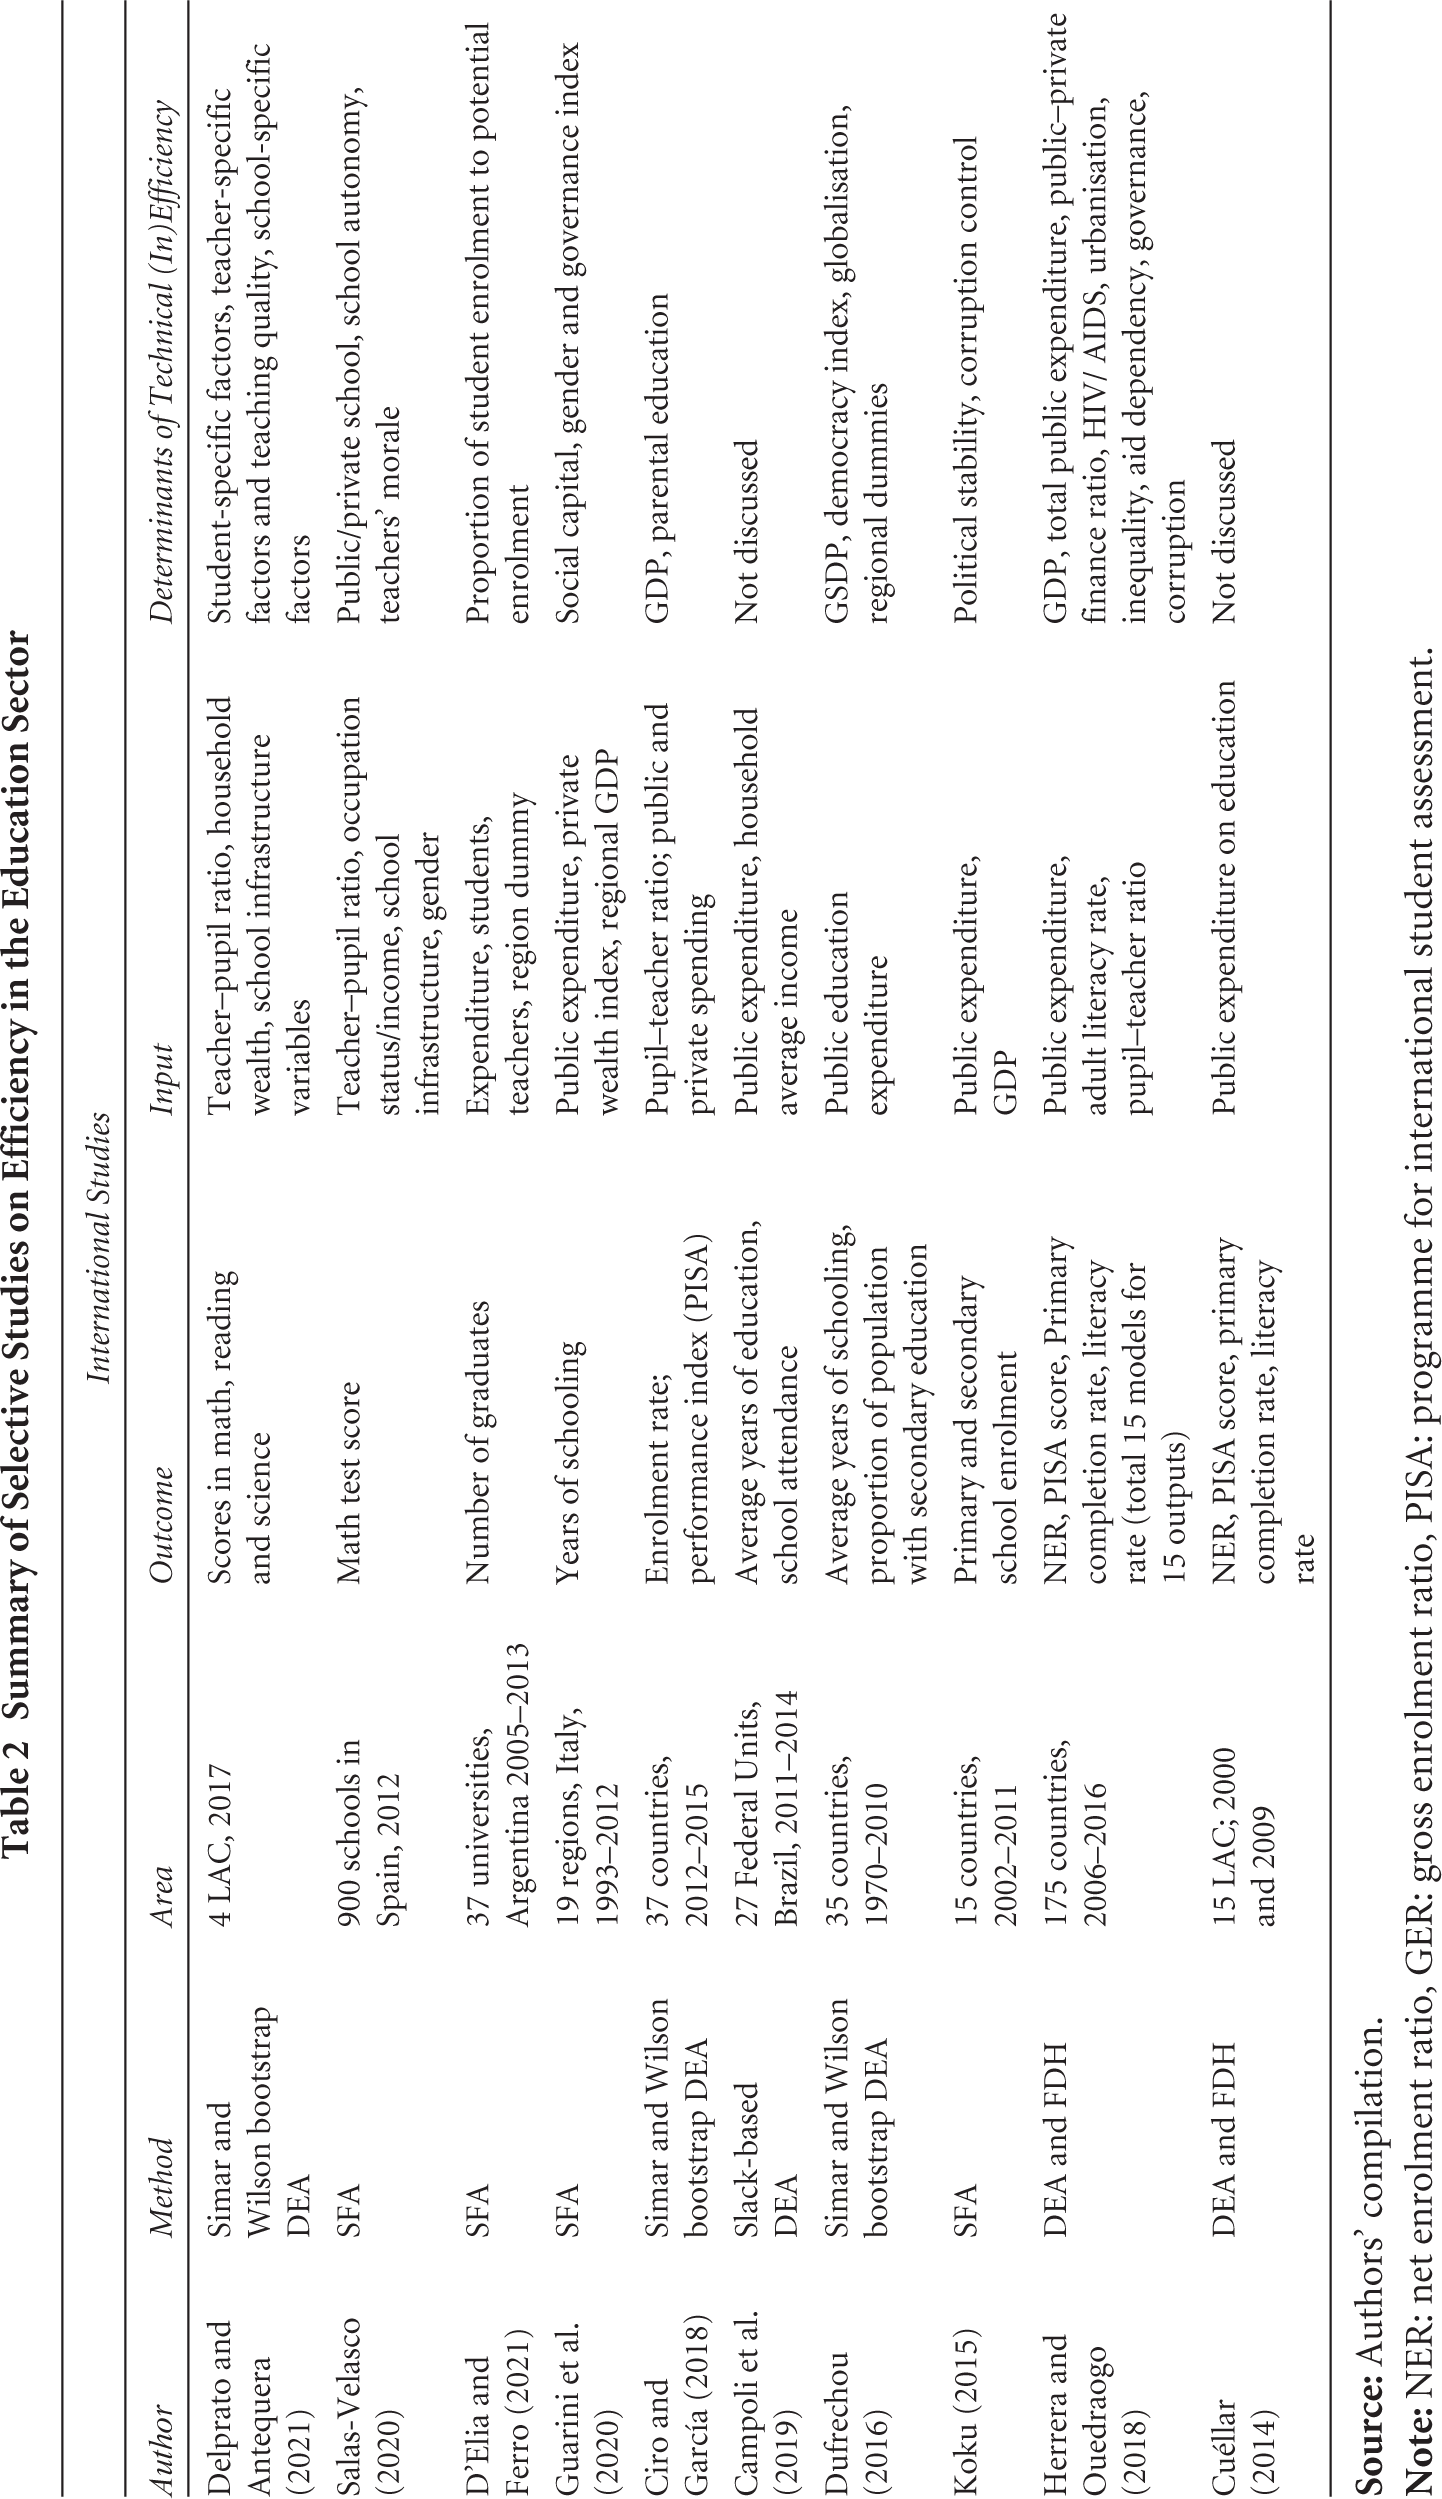
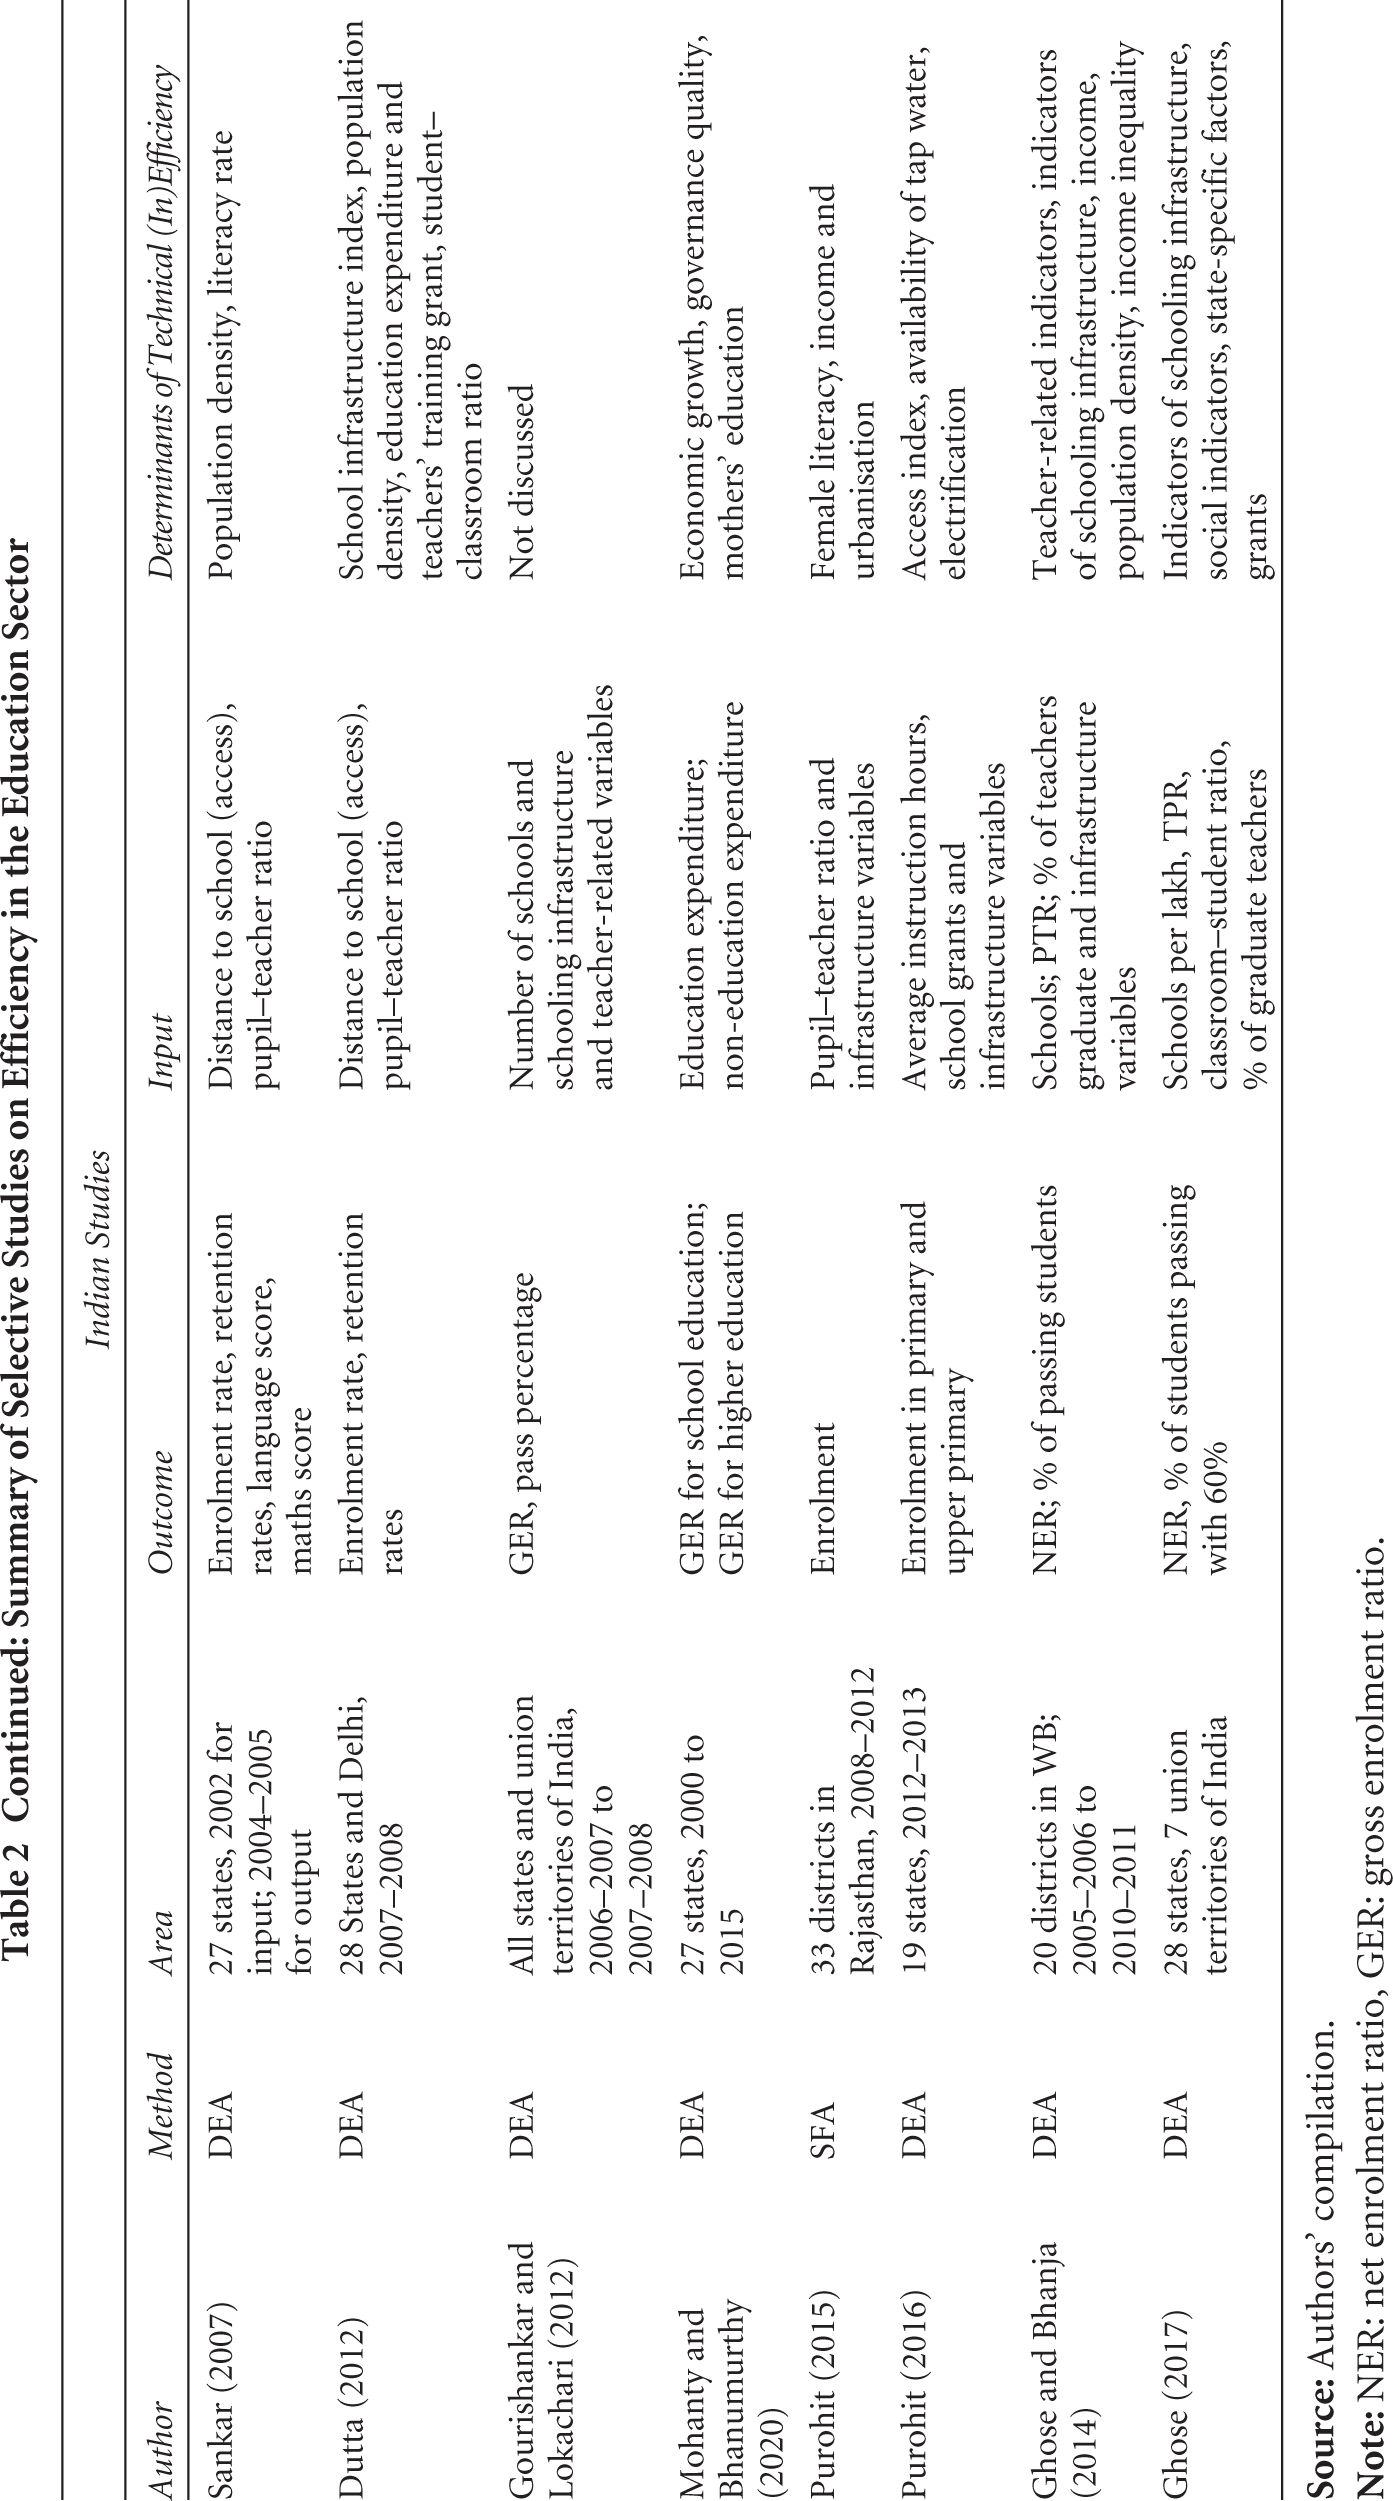
To summarise, factors such as income, income inequality, poverty, literacy rate, teacher characteristics, infrastructure and governance indicators are expected to impact the efficiency of educational systems. Understanding and addressing these factors are crucial for improving education outcome efficiency. Table 2 presents a summary of the literature review.
Summary of Selective Studies on Efficiency in the Education Sector
Continued: Summary of Selective Studies on Efficiency in the Education Sector
3. Data and Methodology
SFA is the parametric approach developed by Aigner et al. (1977) and Meeusen and van den Broeck (1977) to measure technical efficiency. It is an extension of the conventional production function. While the conventional production function assumes that producers are fully efficient, and deviations from the production possibility frontier are solely due to random shocks, the SFA specifies the frontier production function (regression model) characterised by a composite error term that can be decomposed into the statistical noise that captures measurement error and a one-sided disturbance term that measures inefficiency.
Over time, various SFA models emerged to estimate time-varying or time-invariant technical efficiency. These models typically employ a two-step process: (a) estimating the stochastic frontier model and technical efficiency scores and (b) using these estimates to identify the determinants of efficiency through Tobit models or OLS. Battese and Coelli (1995) argued that the two-stage approach may yield inconsistent and biased parameter estimates due to (a) potential serial correlation among technical efficiency estimates and/or (b) correlation between the inefficiency term and inputs/output used in the production function.
Battese and Coelli (1995) developed the inefficiency effects model that simultaneously estimates the frontier production function and the inefficiency function, hence solving the problem of the two-step approach. This paper uses the inefficiency effects model to estimate the technical efficiency of 28 Indian states from 2009–2010 to 2020–2021. The elementary education frontier production function can be written as
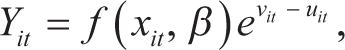
where Yit denotes education outcome, xit denotes a vector of inputs used in the production of education, vit is the stochastic error term and vit ~ iid N (0, σv
2
); and uit is the inefficiency component. By taking the logarithms of equation (1), we can obtain the SFA model for panel data as

According to Battese and Coelli (1995), uit follows a truncated normal distribution and time-varying mean, that is, uit ~ iid N + (mit, σu
2
). The technical inefficiency term (mit) depends on a set of environmental factors. The inefficiency model can be expressed as follows:

As suggested by Jondrow et al. (1982), technical efficiency (TE) can be estimated as the expectation of the truncated error term (u) conditional on composed error term (ε), that is,

Maximum likelihood estimation is applied to estimate parameters in equations (2) and (3). The likelihood function is parameterised with variances in the model and the variance ratio (γ = σ
u
2
/ σ
2
and where σ
2
is the sum variance σ
u
2
and σ
v
2
). γ indicates the extent of technical inefficiency variance relative to the total variance, on a scale from 0 to 1. A γ of 0 means that parameters δ are unidentified, and variables in Z are part of the production function. The statistical significance of γ can be tested using the generalised likelihood ratio (LR) test:

where L(HU) and L(HUR) represent the log-likelihood values computed from the restricted model (OLS) and the unrestricted model (SFA), respectively. LR follows a mixed χ 2 distribution, with degrees of freedom equal to imposed restrictions (Kodde & Palm, 1986).
Usually, SFA models extend the Cobb–Douglas (CD) production function. However, CD production functions are quite restrictive as they assume constant elasticity of substitution. Some studies opt for the trans-log production function because it does not impose restrictions on scale elasticities (Miningou, 2019; Rassouli-Currier, 2007). However, trans-log functions often face multicollinearity issues due to numerous input interaction terms. Quadratic specifications have been explored in a few studies (Kang & Greene, 2002; Pereira & Moreira, 2007; Perelman & Santin, 2011). Best practice involves estimating multiple specifications and selecting the most relevant model based on likelihood ratio tests and information criteria (Chakraborty, 2009; D’Elia & Ferro, 2021; Guarini et al., 2020; Koku, 2015). Since there are only 336 observations in the database used in this study, a functional form that requires the estimation of fewer parameters is more desirable.
This study chooses retention rate as the output variable (Yit). Research indicates that the retention rate (or completion rate) is a better education outcomes indicator than enrolment/attendance ratios (Cuéllar, 2014; Mehta, 2004; Sankar, 2007; UNESCO, 2009). Retention rate is the percentage of students who finish grade 8. It can be measured as

Input variables considered in this article are real public expenditure per student, real gross state domestic product (GSDP) per capita, number of teachers per 35 students, number of schools per lakh child population and several schooling infrastructure variables such as the percentage of schools having girls’ toilet, computer, electricity, drinking water and provide midday meals. Teaching quality (measured by the proportion of teachers having professional qualifications such as a bachelor’s in education or an equivalent degree) is also considered. However, data on the proportion of professionally qualified teachers are missing for the years 2009–2010 and 2010–2011.
The inefficiency model includes literacy rate, the proportion of the rural population, the proportion of government schools, the percentage of regular teachers 4 and the proportion of scheduled caste (SC) and scheduled tribe (ST) children.
The study relies on secondary data from various sources: Expenditure data are sourced from the Finance Account of States, Comptroller and Auditor General of India (CAG) (2022). Retention rate and schooling infrastructure data are compiled from the Unified District Information System on School Education (UDISE) (2015, 2022). Literacy rate and rural population figures are estimated using census data (Government of India [GOI] 2001, 2011). Information on midday meal provision is gathered from the annual work plan and budget documents of the states (GOI, 2022a). The population of elementary schooling age is obtained from the GOI (2022b). GSDP data are compiled from the National Statistical Office (2022).
4. Empirical Results
Table 3 presents the estimated results of equation (2) (frontier models) and equation (3) (inefficiency model). The outcome variable used in this exercise is the retention rate at the elementary level. Specification (1) includes all the input variables for which data are available from 2009–2010 to 2020–2021 for all 28 states. Specification (2) only includes the inputs that were significant in specification (1). Specification (3) includes the proportion of teachers that have a professional qualification 5 (because data are unavailable for 2009–2010 and 2010–2011). Technical efficiency scores have been estimated based on model (2) as it allows us to track changes in efficiency since 2009–2010.
Maximum Likelihood Estimation of Stochastic Frontier Models and Inefficiency Effects Function (IM)
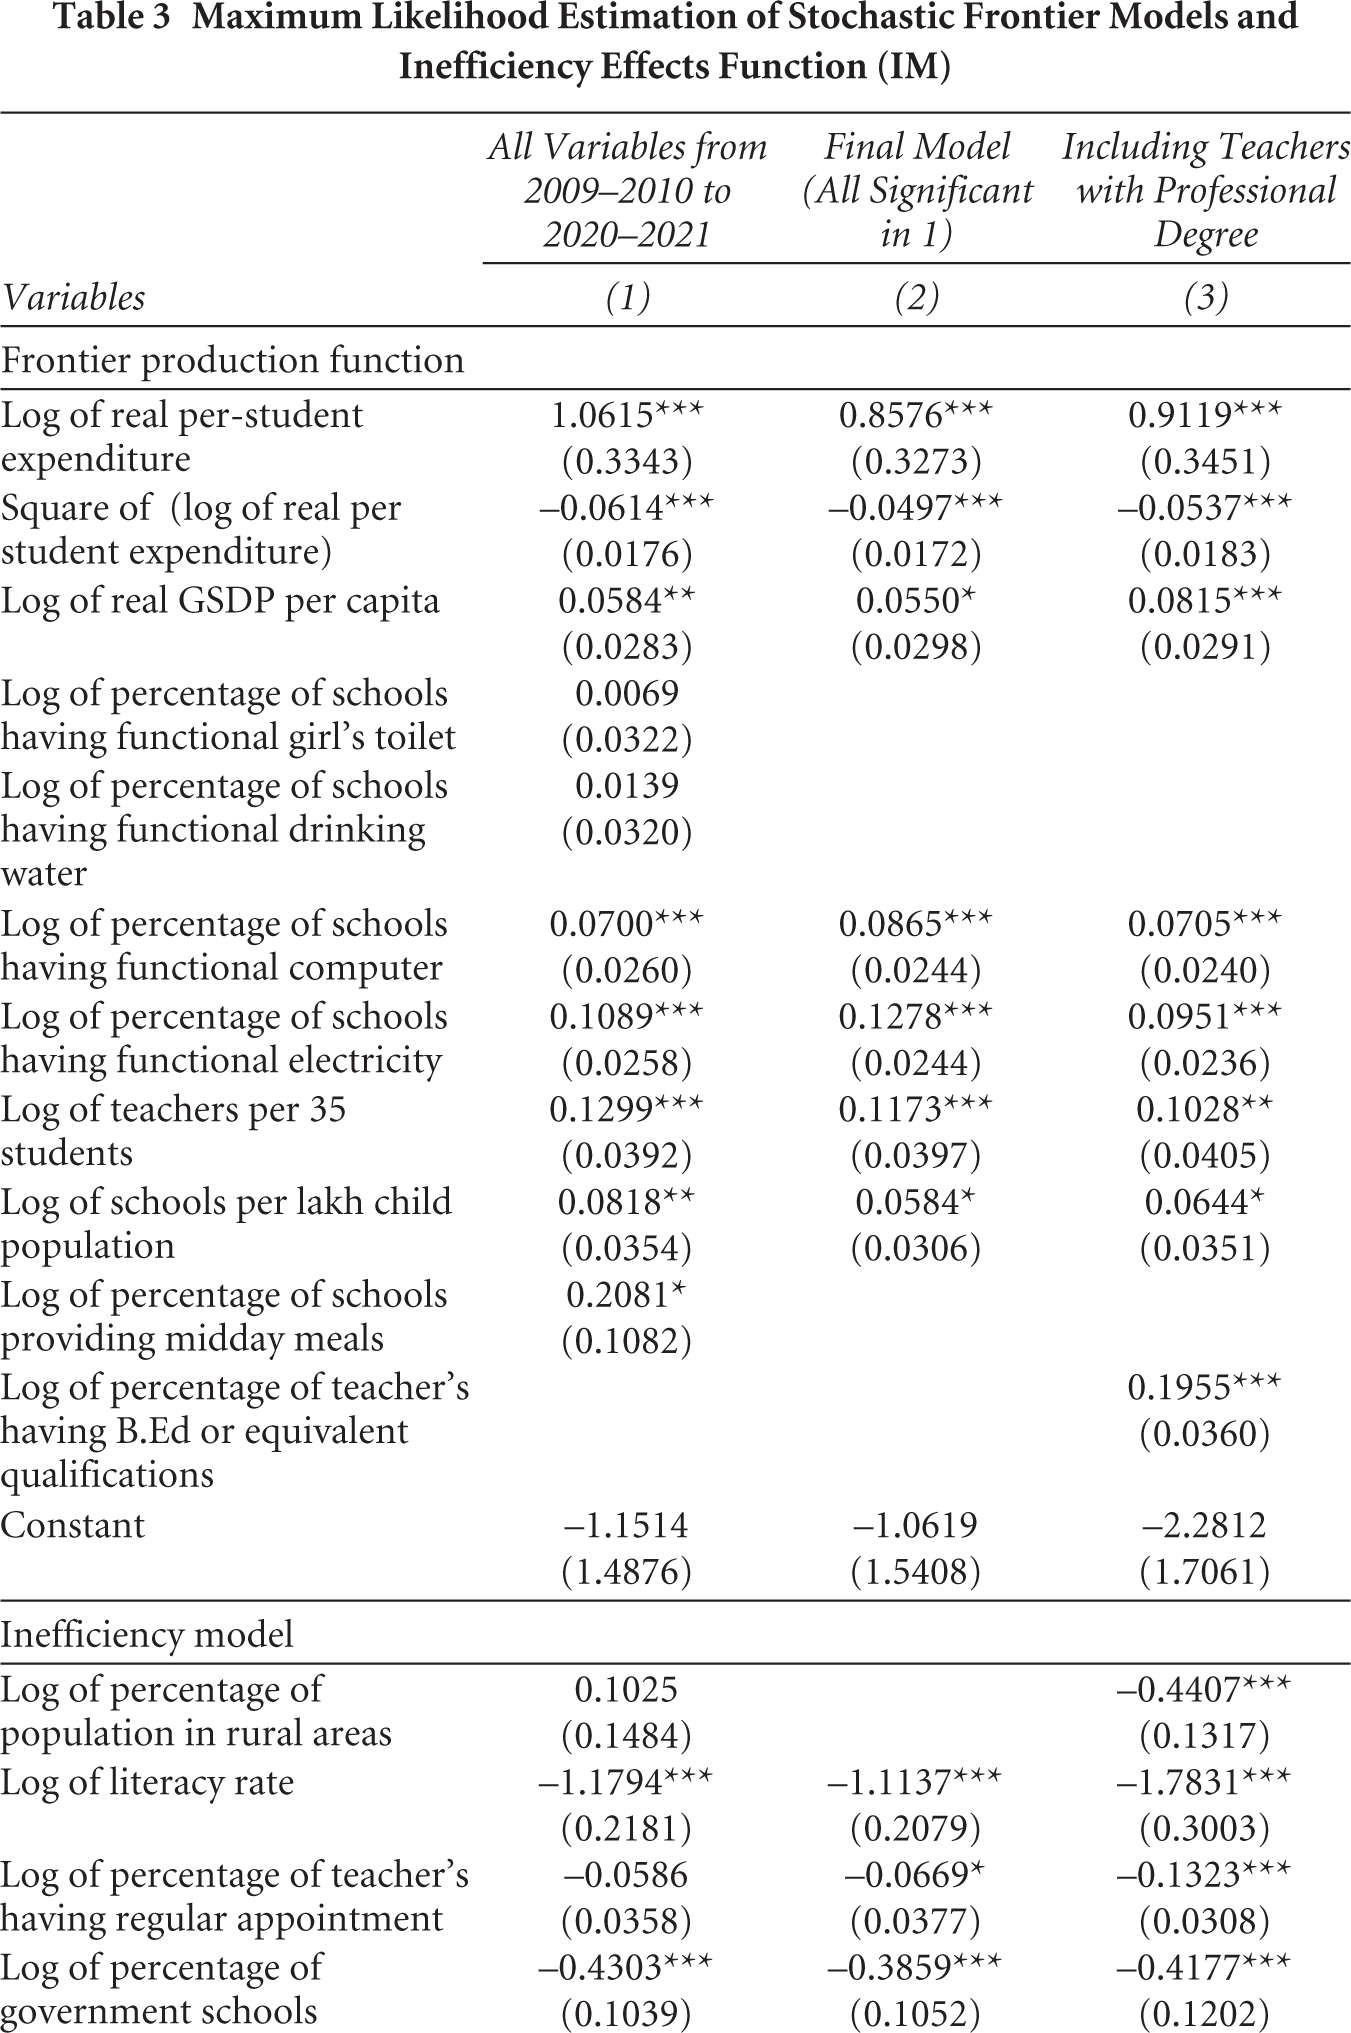
Column 1 shows that states’ per-student expenditure (real) has a positive significant impact on the retention rate. However, the square of per-student expenditure (square of log of real per student expenditure) is negative and significant. This implies that additional units of expenditure have a lower impact on the retention rate compared to the previous units of expenditure and the relationship wears off after a certain point. 6 All the other input variables have a positive coefficient as expected. This indicates that better schooling infrastructure generates better outcomes. However, the percentage of schools having girl’s toilets and drinking water was not significant. Hence, these variables have been dropped in specification (2). The findings of specification (3) are similar to that of specification (2). Additionally, the proportion of teachers with a professional qualification (B.Ed or equivalent) has a positive and significant impact on the retention rate.
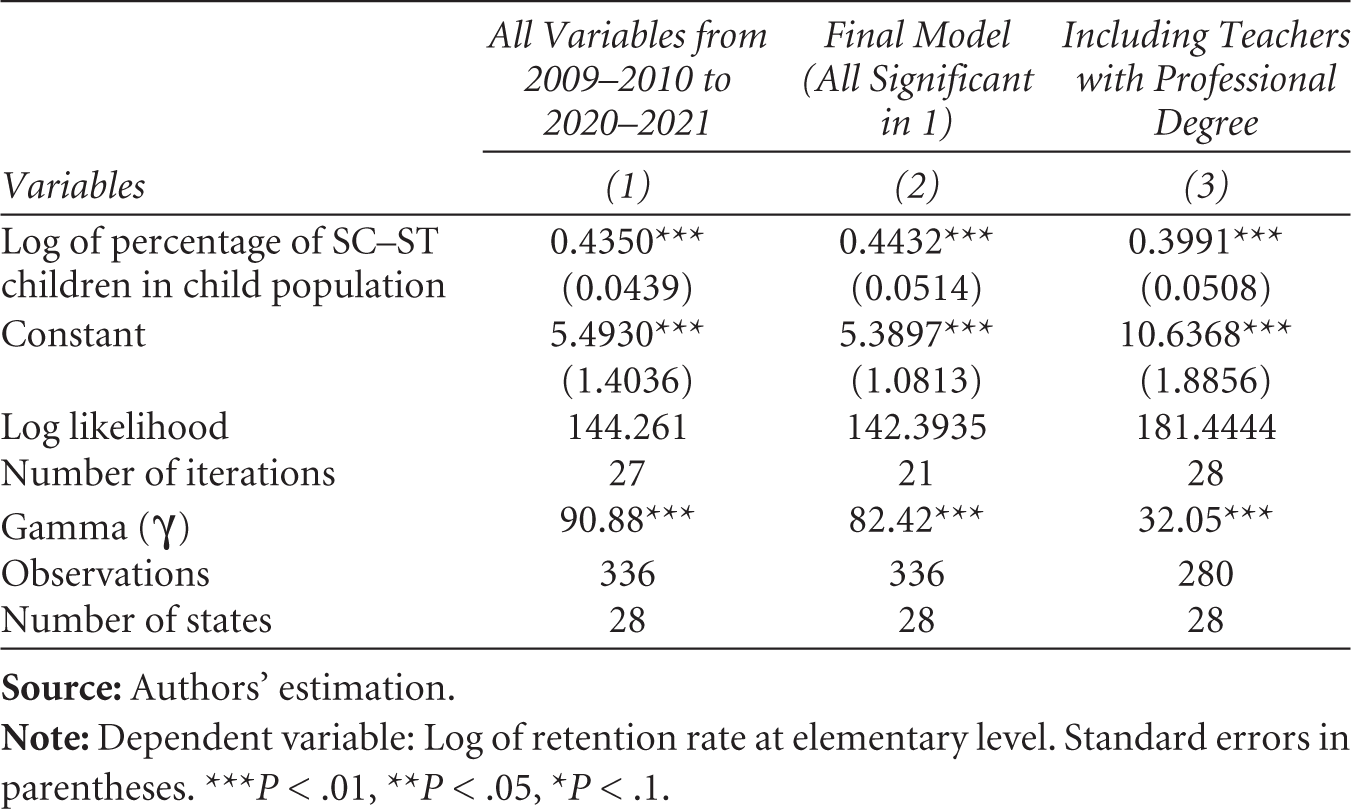
The statistical significance of γ indicates the validity of the SFA model. Alternatively, states are inefficient in producing elementary education. According to the γ coefficient, 82.42 per cent of the interstate variation in elementary education output is explained by technical inefficiency (specification 2).
The inefficiency model identifies factors that influence technical inefficiency. Its results are consistent across the three specifications. Literacy rate and the proportion of government schools negatively impact technical inefficiency, suggesting that efficiency improves with higher literacy rates and a greater ratio of government to private schools. The percentage of SC and ST children has a positive effect on inefficiency, suggesting that states that have a higher proportion of ST/SC children are more inefficient. The proportion of the rural population is not significant in specification (1), but specification (3) indicates that urban areas are more efficient compared to rural areas. The appointment of contractual teachers or part-time teachers (instead of regular teachers) has a negative impact on technical efficiency.
Table 4 presents the technical efficiency scores and relative ranking of states. The mean efficiency of states was 76 per cent in 2009–2010, improving to 81 per cent in 2015–2016. Although there was a slight decline in between, it eventually increased to 82 per cent in 2020–2021. The overall efficiency of states during the study period was 79 per cent. Overall, Goa (94.5 per cent) is the most efficient state followed by Haryana (94.1 per cent) and Kerala (94 per cent). Arunachal Pradesh (52 per cent) is the least efficient state followed by Meghalaya (55 per cent) and Manipur (59 per cent). There appear to be wide interstate variations (between 94.5 and 52 per cent) in efficiency.
Technical Efficiency Estimates, Relative Ranks and Mean Efficiency of States Based on the Retention Rate Model
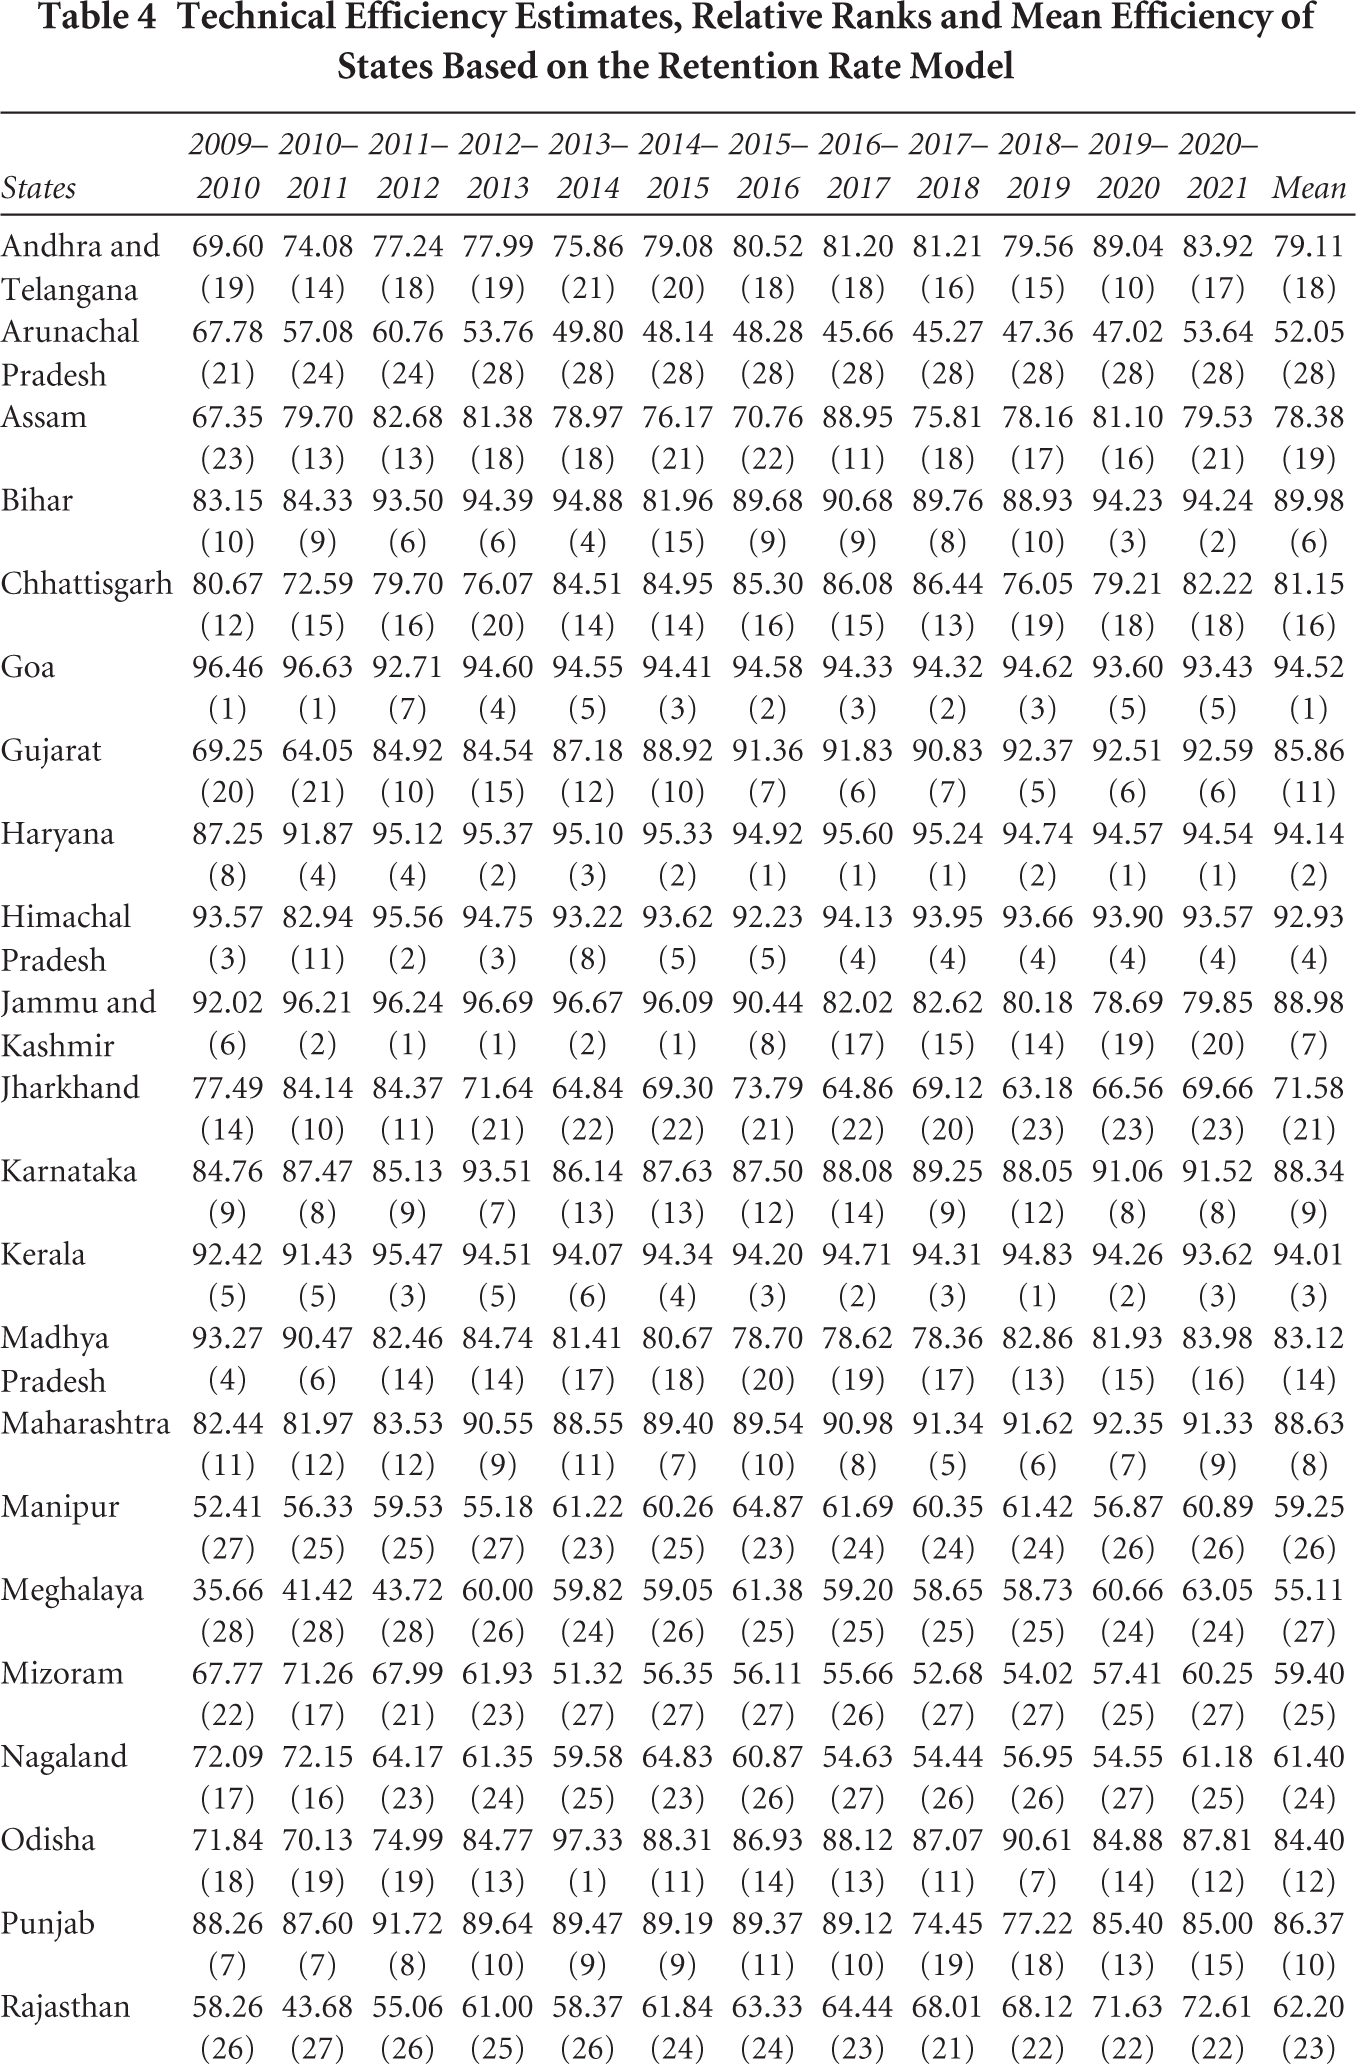
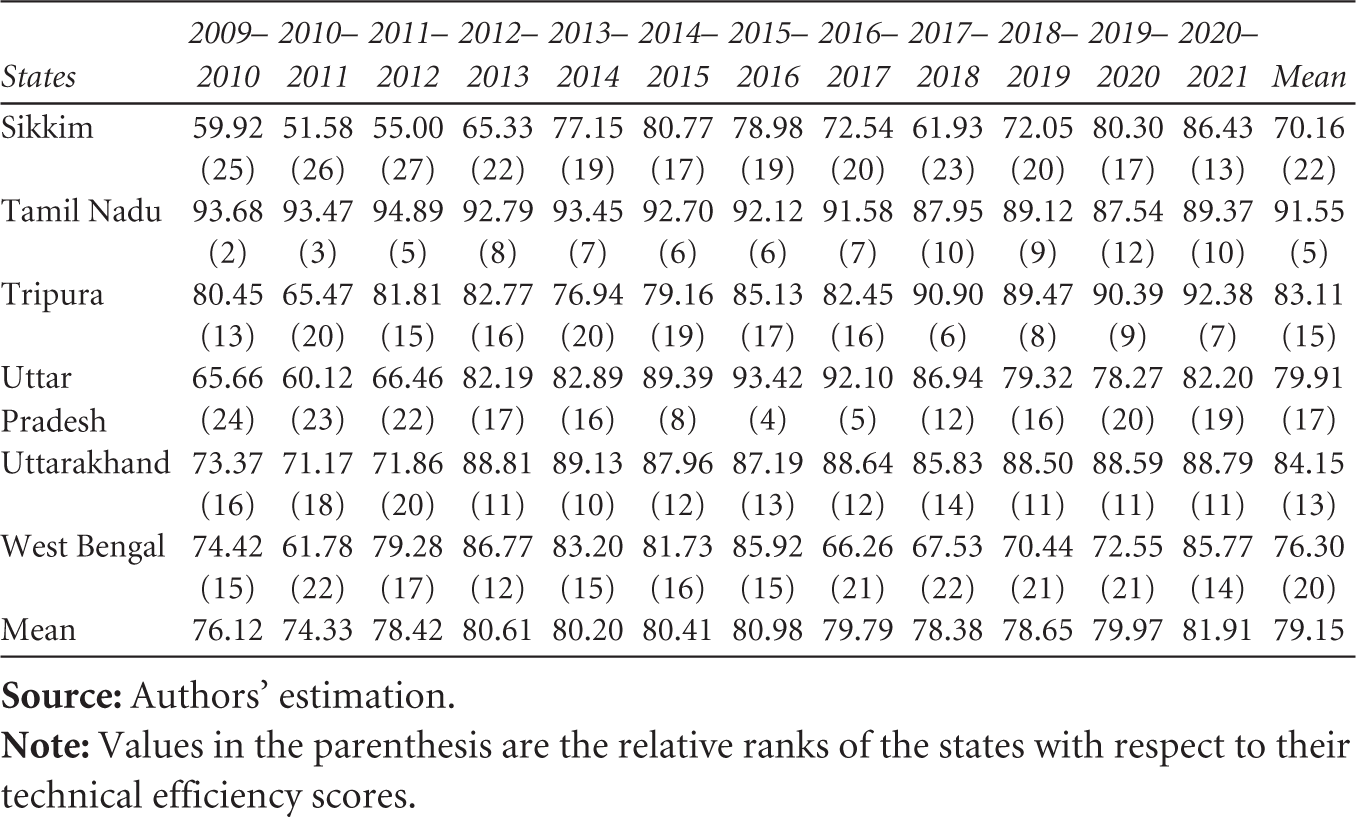
Over time, the relative rankings of states have changed. In 2009–2010, Goa, Tamil Nadu and Himachal Pradesh were the most efficient, while Meghalaya, Manipur and Rajasthan were the least efficient. By 2020–2021, Haryana, Bihar and Kerala emerged as the most efficient, while Arunachal Pradesh, Mizoram and Manipur became the least efficient.
Technical efficiency scores have improved in Uttar Pradesh, Bihar, Gujarat, Haryana, Maharashtra, Meghalaya, Sikkim, Odisha and Rajasthan, while it has declined in Arunachal Pradesh, Chhattisgarh, Jharkhand, Jammu and Kashmir, Mizoram, Nagaland, Madhya Pradesh, Punjab and Tamil Nadu.
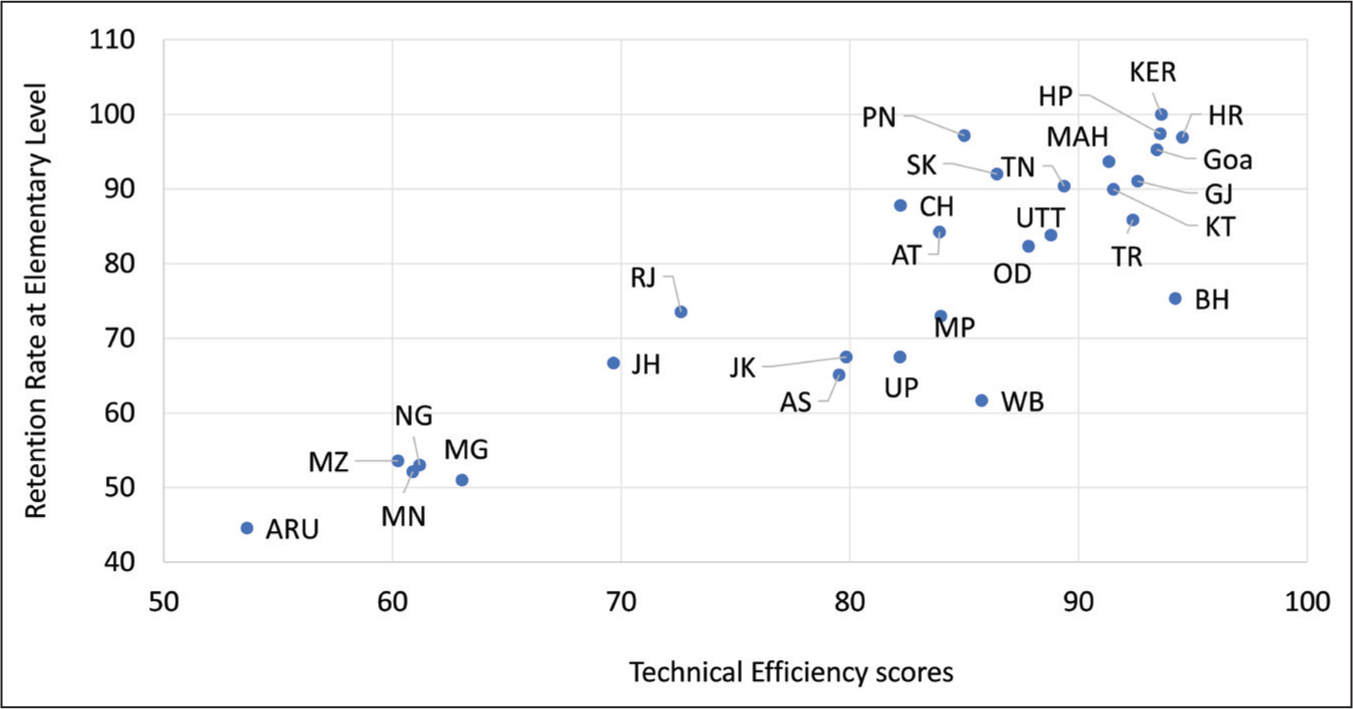
An analysis of the relationship between states’ retention rates and their technical efficiency scores reveals that states such as Kerala, Himachal Pradesh, Haryana and Goa exhibit high efficiency and favourable outcome, suggesting efficient resource allocation. Conversely, states such as Arunachal Pradesh, Manipur, Mizoram, Nagaland and Meghalaya demonstrate poor outcomes attributable to inefficient resource allocation. States such as Bihar, Tripura, Uttar Pradesh, Madhya Pradesh, West Bengal and Odisha display above-average efficiency but still experience low output, pointing to potential resource scarcity challenges. On the other hand, states such as Jharkhand, Jammu and Kashmir, Assam and Rajasthan may face a dual challenge of both resource scarcity and technical inefficiency (Figure 1). This analysis highlights that education outcomes can be influenced by a complex interplay of efficiency, resource allocation and existing levels of regional disparities.
5. Conclusion
This study measured the technical efficiency of 28 Indian states (from 2009–2010 to 2020–2021) in providing elementary education. Technical efficiency has been measured using the stochastic frontier model for panel data developed by Battese and Coelli (1995), which requires the simultaneous estimation of the elementary education frontier production function and inefficiency effects model. Any deviation from the frontier indicates that there is scope for the state governments to improve education outcome without increasing public expenditure.
The statistical significance of γ validates the SFA model. It reveals that 82.42 per cent of the interstate variation in elementary education output is explained by technical inefficiency. Empirical results show that higher public expenditure positively impacts retention rates, but diminishing returns occur beyond a certain point. To optimise resource allocation, the government should regularly evaluate and adjust budgets based on impact assessments. Prioritising investments in schooling infrastructure and upskilling teachers is crucial for achieving better outcomes. Tailored interventions are essential for addressing inefficiencies in rural areas. Promoting literacy through campaigns and raising awareness about the benefits of education can improve efficiency. The government must foster collaborations with private entities to ensure efficient resource utilisation while expanding access to education. Targeted support for marginalised groups, especially SC and ST children, can improve efficiency. Re-evaluating teacher employment policies in favour of regular appointments and continuous policy monitoring are recommended for sustained improvements.
The estimated overall technical efficiency of states is 79 per cent, indicating that about 21 per cent of states’ potential output is not yet realised. On average, efficiency varied widely (52 to 94.5 per cent) among states, with Goa, Haryana and Kerala being the most efficient, while Arunachal Pradesh, Meghalaya and Manipur were the least efficient. Efficiency improved in Uttar Pradesh, Bihar, Gujarat, Haryana, Maharashtra, Meghalaya, Sikkim, Odisha and Rajasthan. However, it declined in Arunachal Pradesh, Chhattisgarh, Jharkhand, Jammu and Kashmir, Mizoram, Nagaland, Madhya Pradesh, Punjab and Tamil Nadu.
The retention rates and efficiency score patterns indicate that states such as Kerala, Himachal Pradesh, Haryana and Goa exhibit high efficiency alongside positive outcomes. However, Arunachal Pradesh, Manipur, Mizoram, Nagaland and Meghalaya suffer from poor outcomes attributed to inefficient resource allocation. Bihar, Tripura, Uttar Pradesh, Madhya Pradesh, West Bengal and Odisha demonstrate above-average efficiency but yield low outcome, suggesting potential resource scarcity. Jharkhand, Jammu and Kashmir, Assam and Rajasthan appear to confront a dual challenge of resource scarcity and technical inefficiency. These findings are consistent with the research of Sankar (2007) and Dutta (2012).
The study emphasises the need for public policy interventions to improve the performance of the states. Resource-poor states can benefit from increased public expenditure, while inefficient states can achieve substantial improvements through efficient use of existing resources. These findings can offer valuable insights for policymakers and aid in addressing regional imbalances and improving elementary education outcomes.
Footnotes
Declaration of Conflicting Interests
The authors declared no potential conflicts of interest with respect to the research, authorship and/or publication of this article.
Funding
The authors received no financial support for the research, authorship and/or publication of this article.