
Abstract
The social accounting matrix (SAM) for India was historically constructed based on the input–output table (IOT). However, since 2011–2012, the Government of India has been publishing the supply–use table, instead of the IOT. While the erstwhile IOT, published by the Government of India, had the same number of products and industries, the supply–use table provides one ‘supply matrix’ and one ‘use matrix’, each of which is a rectangular table with 140 products and 66 industries (for 2018–2019). Converting the supply–use table to a square IOT and subsequently extending it to SAM require the utilisation of various data sources, numerous steps and adjustments. Despite the usefulness of both IO and SAM matrices in macroeconomic policy design, not much literature is available on these. This study aims to bridge the gap by constructing IOT and SAM for India from the supply–use table incorporating information from many other sources and describing the method of construction of the matrices. Our IO and SAM also focus on various energy sectors, including different sources of power generation, biomass and so on, and disaggregate energy-intensive sectors like cement or aluminium, considering the immense usefulness of the energy-extended macro-structure to the research of energy and environment policies. The study focuses on the construction of a 59 × 59 SAM for India, with the base year of 2021–2022 incorporating three factors of production and ten categories of households. As an application of the newly constructed SAM, we have analysed the employment implication of India’s Nationally Determined Contribution emission commitments.
1. Introduction
A social accounting matrix (SAM) depicts the entire circular flow of income for an economy in a square matrix format. It shows production leading to the generation of incomes which, in turn, are allocated to institutional sectors. These incomes are either spent on products or saved. The expenditures by institutions lead to production by domestic industries as well as supply from the rest of the world (ROW). Hence, a SAM can be used to analyse the relationship between production structure, income distribution and consumption profile of different household groups in an economy. Unlike a closed input–output (IO) model that uses a single household sector, a SAM typically models households by various occupation/expenditure classes. The literature suggests that an inter-industry analysis can be seriously misleading without incorporating these aspects (Roland-Holst, 1990).
An important application of SAM is multiplier analysis. A multiplier analysis enables one to understand the direct, indirect and induced impacts of an exogenous demand shock on the economy. The direct effect is caused by the expansion of production of other activity sectors that need intermediate inputs of the manufacturing process. For example, agricultural production requires inputs from other activities, and this demand, in turn, affects the production of its inputs. The indirect effects occur due to the relationships between consumption and intermediate demand among the activity sectors. To satisfy the input requirements of the agricultural sector, the remaining activities require other inputs and this generates additional production effects. The induced effects occur due to the circular flow of income. The production of each activity generates a feedback process from the incomes of the production factors to the expenditures of the institutional sector and to each activity’s own productive process.
A SAM can be used as the database of computable general equilibrium (CGE) models, which are widely used to analyse the aggregate welfare and distributional impacts of policies across various areas like fiscal reform and development planning, international trade, structural adjustment programmes, impact assessment studies, environmental regulations and so on. For the above reasons, the construction of SAM has been undertaken by researchers in numerous countries over the past decades. India is not an exception to this work. India was an early leader in the construction of SAM (Bhide & Pohit, 1993; Pradhan & Sahoo, 1996; Pradhan et al., 1999; Sarkar & Panda, 1986; Sarkar & Subbarao, 1981).
However, the SAMs for India were historically constructed based on the input–output table (IOT) along with other data sources. However, since 2011–2012, the Government of India has been publishing supply–use table (SUT), instead of the IOT. The two types of tables, though both talk about the structure of the Indian economy, are different in structure. While IOT had same number of products and industries, SUT provides one ‘supply matrix’ and one ‘use matrix’, each of which is a rectangular table with 140 products and 66 industries (for 2018–2019). Converting the SUT to a square IOT and then extending it to SAM requires utilisation of various data sources, application of numerous steps and adjustments, and not many studies are available on it. We wanted to make an updated SAM which, apart from its usage in policy assessment studies, can be used as an important input to the macro models like CGE. So, we required the updated SAM, which is benchmarked with macro-data of 2021–2022. This study aims to construct a SAM for India for 2021–2022 from the SUT for 2018–2019 while also incorporating information from many other sources and describing the method of construction of the matrices. A consequent IOT is also generated and presented.
The focus of our IOT and the SAM is the energy sector. Hence, the energy sector is disaggregated in detail using different data sources, and energy-intensive sectors in the economy like cement or aluminium are disaggregated from their parent sectors. Biomass is also extracted from different sectors which contribute to the output of the biomass sector. The IO matrix and SAM are thus generated and provided paper to the research community, considering their immense usefulness to macroeconomic and policy research, especially in the context of energy and environment policy design.
To our knowledge, Sarkar and Subbarao (1981) constructed the first SAM for India. Subsequently, a number of SAMs were constructed by different researchers. Table 1 depicts the developments since the 2000 decade on a national level. 1 A majority of the papers constructing SAM (after 2000) are based on IOT (Pal et al., 2012, 2015; Pal & Bandarlage, 2017; Pal & Pohit, 2014; Pradhan et al., 2006, 2013; Saluja & Yadav, 2006; Sinha et al., 2007). SUT is utilised by Venkatesh and Pal (2018) and Pal et al. (2020), but with different sectoral emphases and with different data sources. Many studies consider occupational status of the households as a basis of classification of households as agents (Pal et al., 2012, 2015; Pal & Bandarlage, 2017; Pal & Pohit, 2014; Pradhan et al., 2006, 2013; Saluja & Yadav, 2006; Sinha et al., 2007). A few studies classified households based on expenditure classes (Pal & Bandarlage 2017; Pal et al., 2020; Saluja & Yadav 2006).
SAMs of India, 2000 Onwards
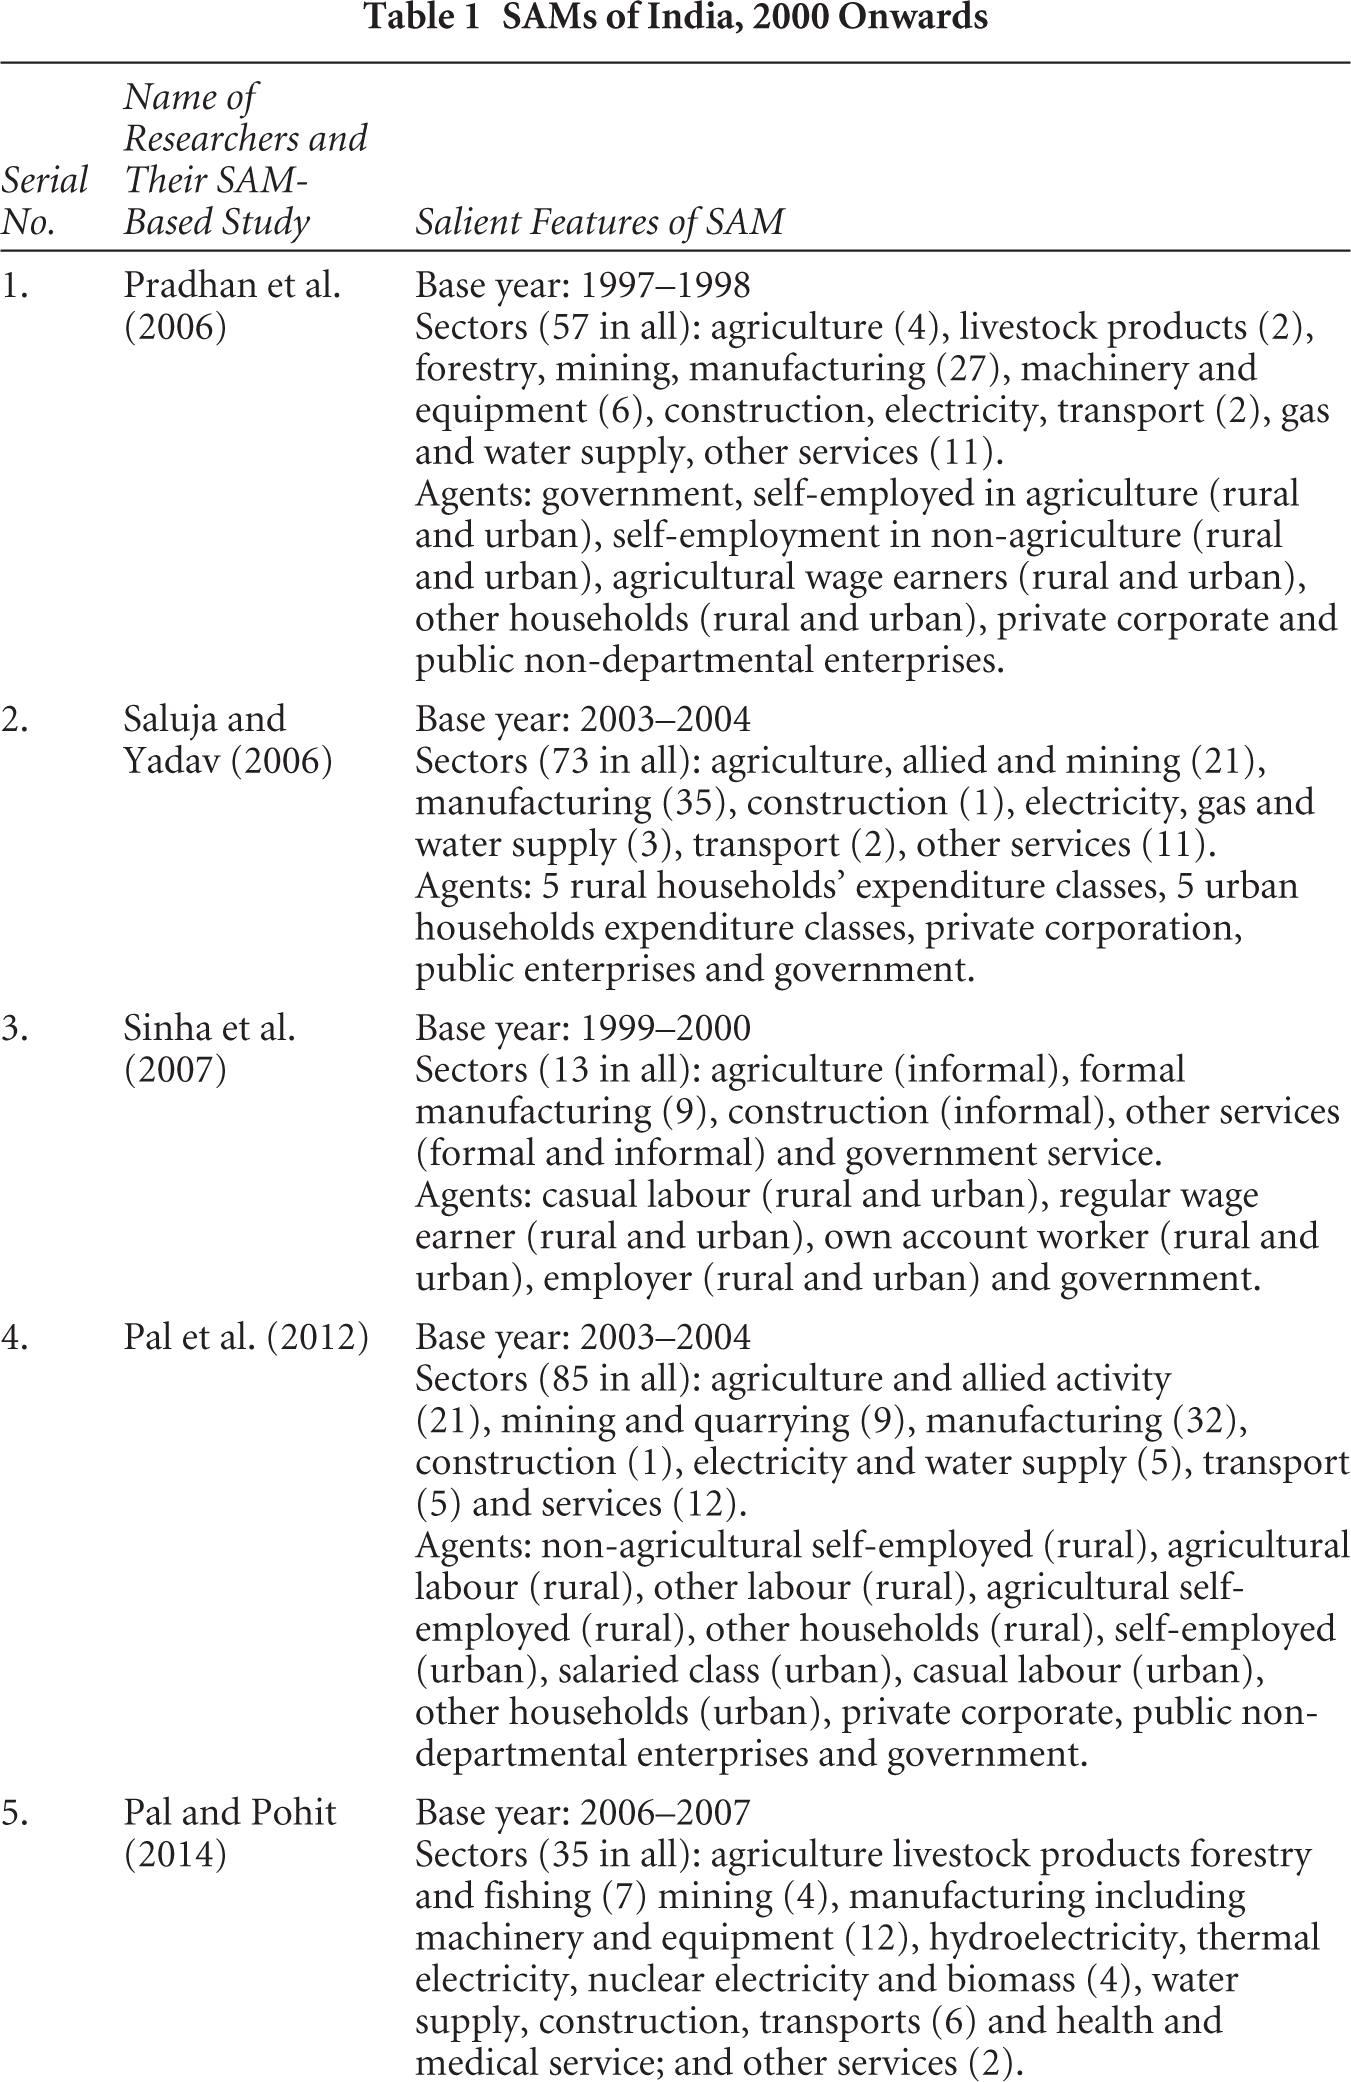
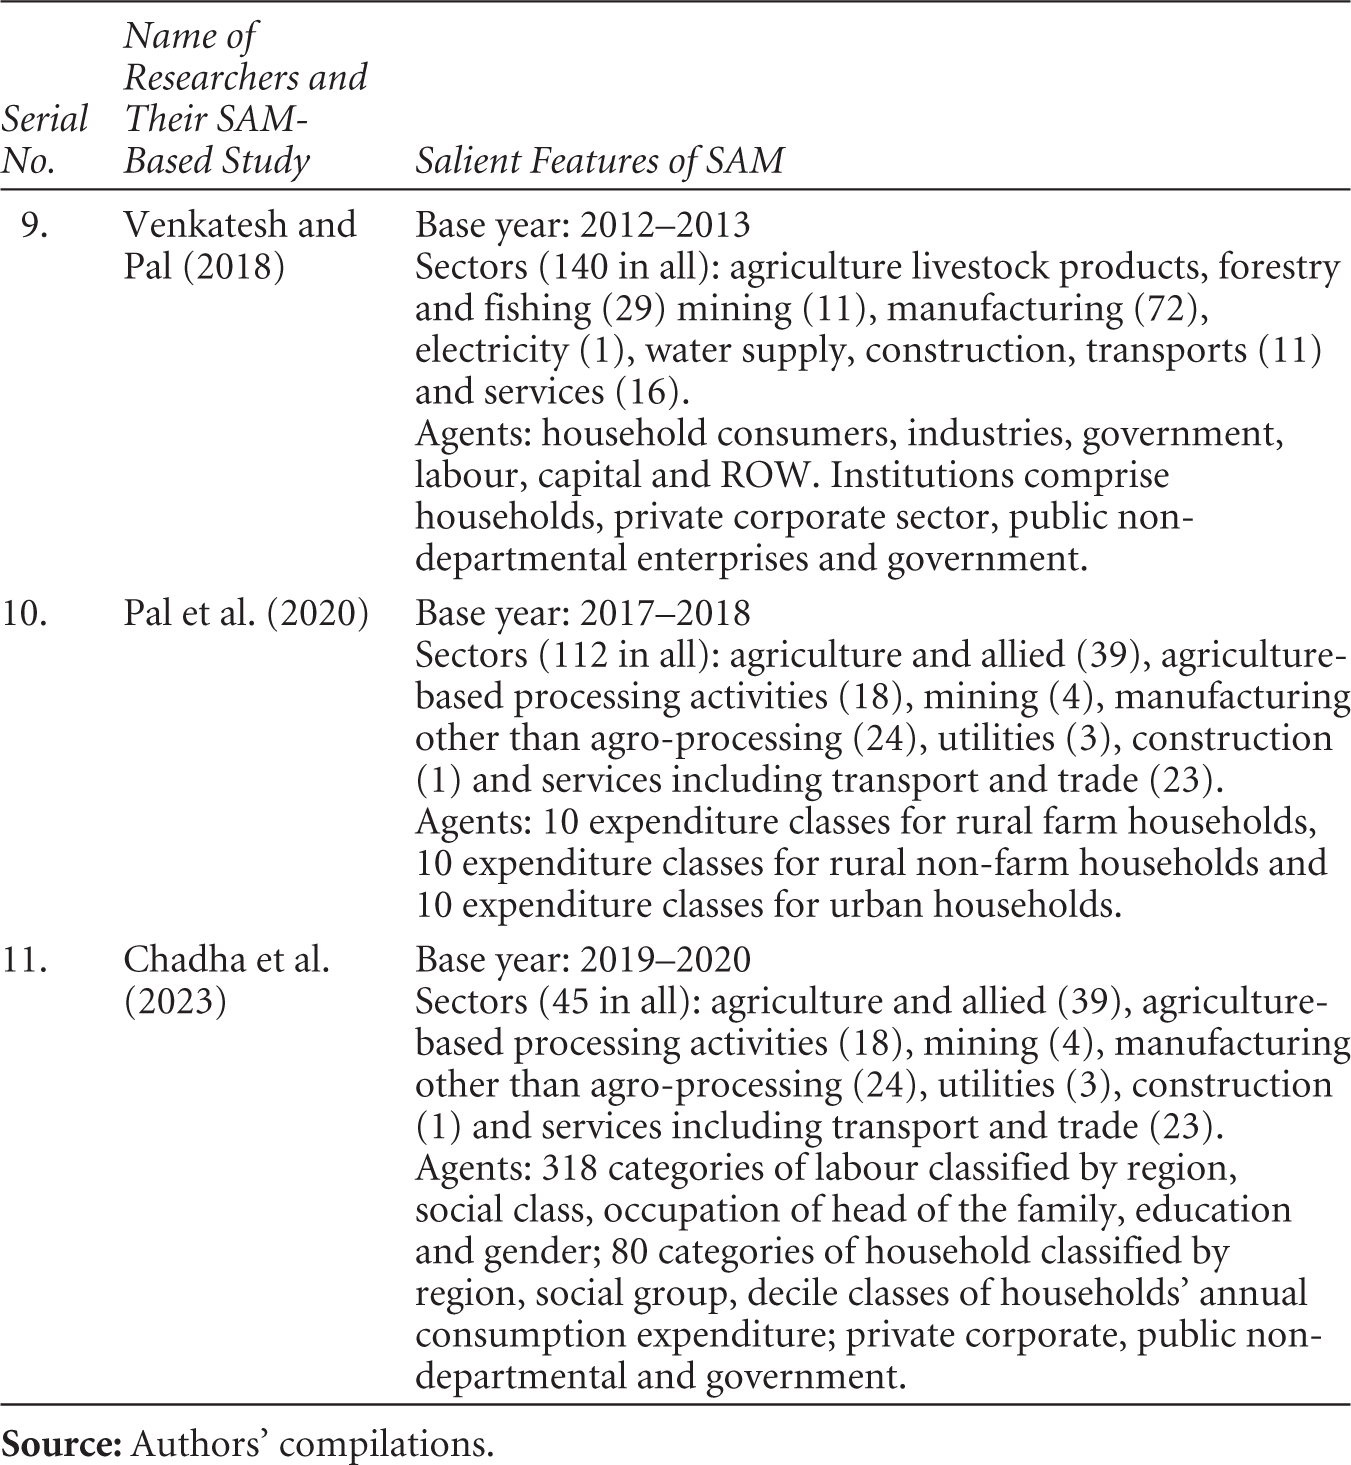
As Table 1 shows, a major shortcoming of the SAMs of India is the aggregate treatment of energy sectors. However, the SAM constructed by Pal and Pohit (2014) addresses these shortcomings. The renewable energy sectors are not fully disaggregated in these SAMs. Energy sectors need to be disaggregated if one has to undertake environmental analyses, particularly in view of net zero commitment by India. Also, as mentioned earlier, a majority of the SAMs are based on IOT published by the Government of India, not the SUT, which the Government of India has been publishing since 2011–2012, instead of IOT. Therefore, we have constructed a new SAM.
In recent years, many studies have utilised SAM to analyse and assess the macroeconomic impacts of different policies in the context of different countries. For example, Njoya (2023) utilised SAM for Tanzania to assess the poverty impact of the COVID-19–induced tourism crisis in that country. Hartono et al. (2020), in the context of Indonesia, analysed the impacts of fossil and renewable energy investments using SAM. Based on SAM multiplier analysis, Tiku et al. (2022) analysed effects of tourism-induced distribution on various socio-economic groups in West Papua Province. Ferrari et al. (2022) also utilised SAM in their study on the role of tourism in China’s economic system and growth. Betho et al. (2022), in their study on macroeconomic impact of COVID-19 in Mozambique, have used SAM. Mardones and Brevis (2021) constructed SAM with environmental accounts for analysing energy and environmental policies in Chile. Morrissey et al. (2019) analysed the distributional impact of investment in the port sector on households in Mauritius through the SAM approach. SAM is considered a very important policy tool for analysing the impact of different policies in a macroeconomic context, but no SAM for India was published after 2021. The year 2021–2022 is chosen as the base year because it was the ‘normal’ year after COVID-19 since the growth rate was recorded at 9 per cent in 2021–2022, which recovered from –6 per cent in 2020–2021, as per Reserve Bank of India (RBI) data. 2 The major contribution of the article is construction of India’s SAM from SUT, which, despite being worked on at some institutions, has not yet been published in any major journal. Major contributions of the article are that it prepared SAM from SUT of the recent year; disaggregated energy sector at a detailed level; captured disaggregated energy-intensive sectors; and estimated employment implications of India’s energy targets.
Section 2 discusses materials and methods, which talks about supply–use matrix and its link with SAM, the construction procedure of our IOT, followed by the construction methodology of overall SAM. Section 3 describes the results, with sub-sections on the structure of the Indian economy, factor and energy demand analysis using SAM multipliers and employment implication of India’s environmental policy target. Finally, section 4 summarises our findings and provides concluding remarks. IOT and the SAM are presented in Appendices II and III, respectively.
2. Materials and Methods
The methodology of construction of SAM consists of many steps, which broadly can be classified as construction of IOT from SUT, expansion of energy sector into seven categories based on the source of generation; bifurcation of biomass from several sectors; and construction of sectors other than production account in SAM. Our study uses the available dataset for India in the best way possible with the benchmark of macroeconomic variables and the step-by-step method, which can be utilised in the context of other countries as well.
2.1 SUT and SAM Framework
The SUT for India 3 includes the following: (a) supply table at purchasers’ price, containing the information on domestic and imported supply of commodities at basic price, commodity-specific taxes and margins; (b) use table at purchasers’ price, containing the information on use of commodities by users valued at purchasers’ price; (c) the value added by industry is presented at the bottom of the use table. SUTs describe the entire economy by industry and products. The tables show links between components of gross value added (GVA), industry input and output and commodity supply, and the use of these commodities. The supply table shows where commodities are sourced from the local market or imported from the ROW. The use table shows the use of these commodities either as an intermediate input in production, used by domestic final consumption or exported to the ROW.
The basic price is the amount receivable by the producer from the purchaser for a unit of a good or service produced as output, minus any tax payable (i.e., excise duties, stamp taxes, registration taxes and Goods and Services Tax (GST))), and plus any subsidy receivable, on that unit as a consequence of its production or sale. Basic prices exclude any transport charges involved separately by the producer. The producers’ price is the amount receivable by the producer from the purchaser for a unit of a good or service produced as output, plus VAT, or similar deductible tax, invoiced to the producer. It also excludes any transport charges invoiced separately by the producer. The purchaser’s price is the amount paid by the producer, including any deductible VAT or similar deductible tax, in order to take delivery of a unit of goods and services at the time and place required by the purchaser. The purchaser’s price includes any transport charges paid separately by the purchaser to take delivery at the required time and place. There are 140 commodities and services and 66 domestic industries or imported from abroad, illustrated in the SUT in SUT 2018.
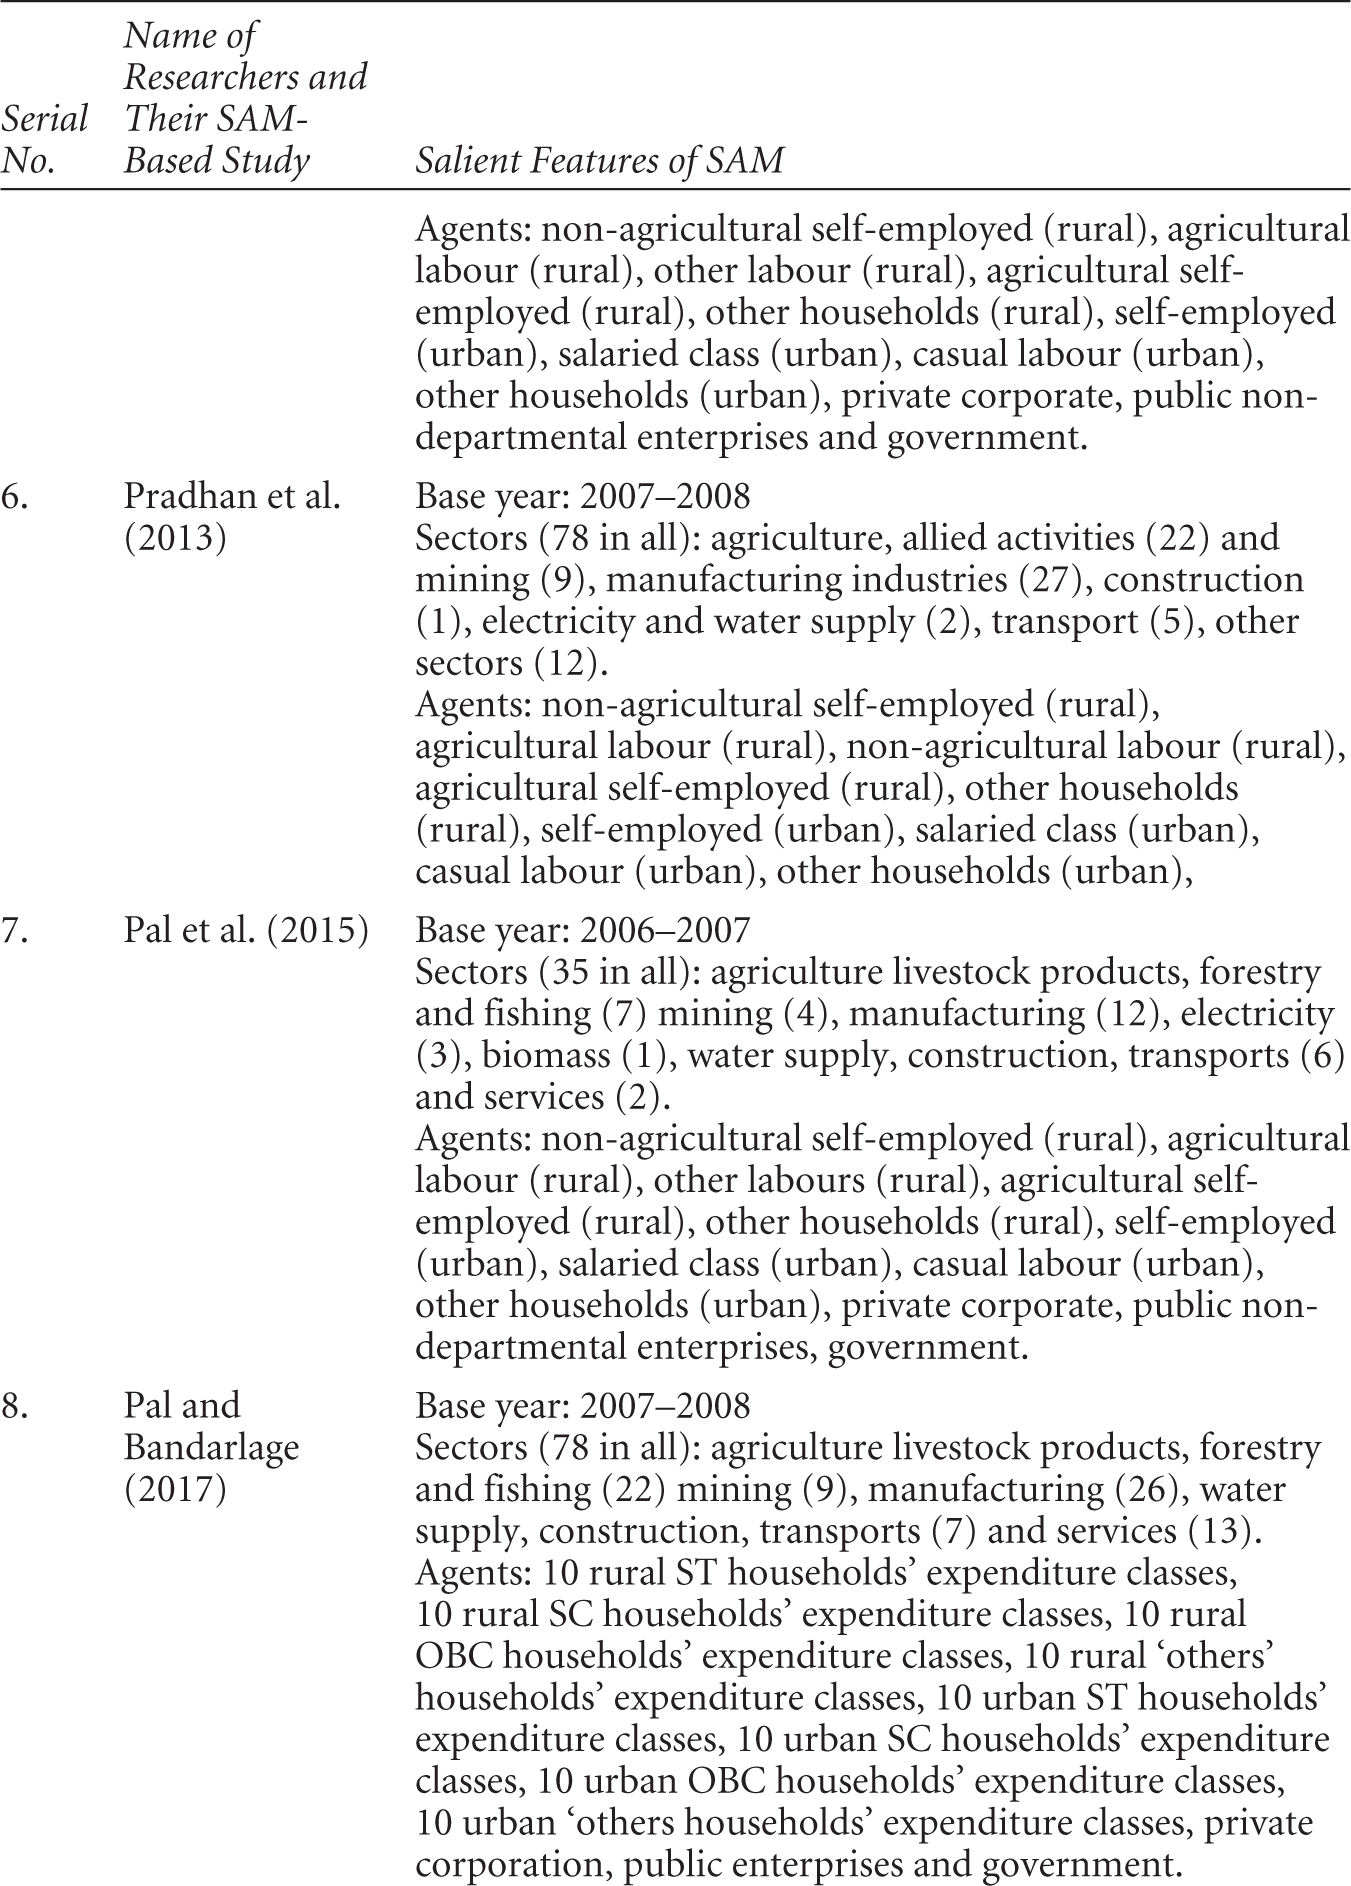
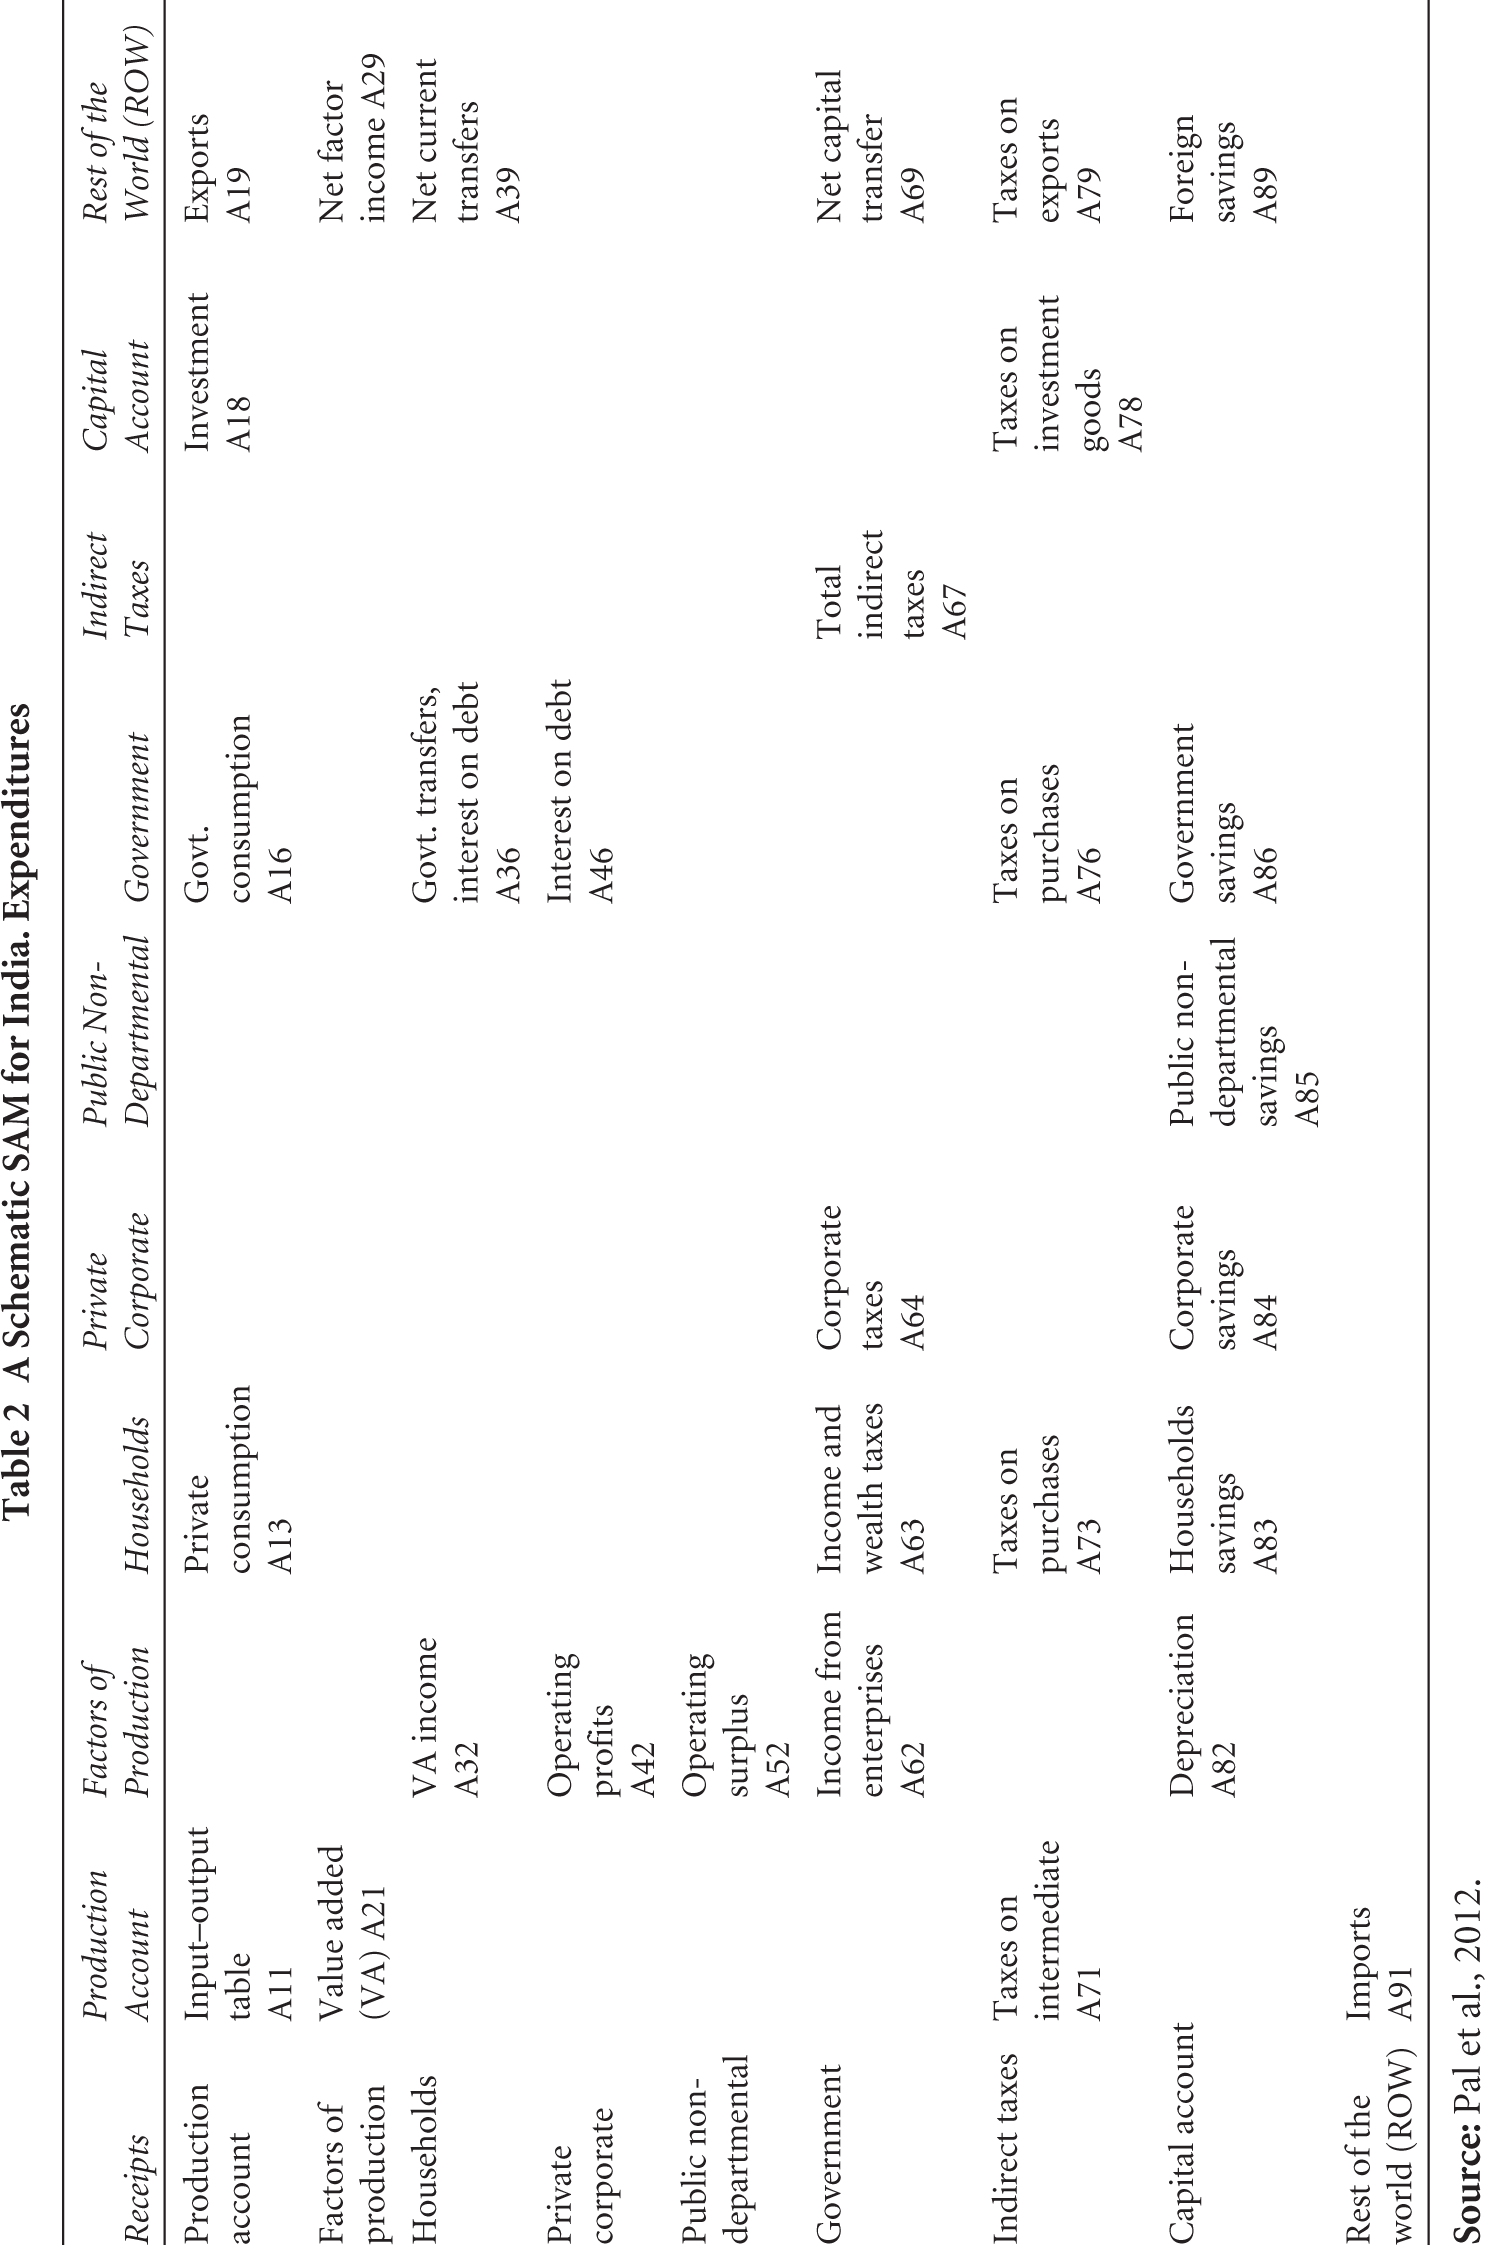
A schematic presentation of the SAM is shown in Table 2. IOT corresponds to the production account and appears in cell A11 of the schematic SAM. There are four agents in this model economy: households, private corporate, public non-departmental enterprises and the government. Factor incomes generated through the production process (A21) are transferred to institutions, according to the ownership of their factors of production (A32, A42, A52 and A62). Household’s income also includes current transfers from the government, interest on public debt (A36) and net current transfers from the ROW (A39). The households spend on consumption of goods and services (A13) and pay direct income taxes (A63) and indirect taxes on purchase (A73), while residual income is saved (A83). Private corporate sector’s income consists of operating profit (A42) and interest on the public debt (A46). The income, excluding the corporate tax (A64), is its savings (A84). The income of the public non-departmental enterprises is only the operating surplus (A52), which is the same as their savings (A85). The receipts of the government include income from its enterprises (A62), direct taxes of the households and private corporations (A63 and A64), total indirect taxes of the economy (A67) and the net capital transfer from the ROW (A69). The government spends its final consumption expenditure on goods and services (A16), transfers and interest payments to households (A36) and interest payments to the private corporate sector (A46). The receipts of the capital account comprise net savings of the different institutions (A83, A84, A85 and A86), foreign savings (A89) and depreciation (A82). The capital account expenditure is equal to gross domestic capital formation (A18) and indirect taxes paid on purchases of the investment goods (A78). The ROW represents the equality between foreign exchange expenditures, on the one hand, and foreign exchange earnings on the other.
A Schematic SAM for India. Expenditures
Since 2011–2012, a new series of national accounting has been published by the National Accounts Division, Ministry of Statistics and Programme Implementation, Government of India, namely, SUT. The SUT framework describes the production in industries, in which intermediate products and primary inputs are required. Additionally, it categorises whether produced goods and services are utilised for intermediate consumption, final consumption, gross capital formation and exports—this is captured in entries across the column in a use table. Supply table shows the value of the products by the kind of supplier. The study uses SUT for 2018–2019 published by the Government of India, where one ‘supply’ and one ‘use’ table are provided, each encompassing 140 products and 66 industries.
Given the available data, the objectives of our study and time constraints, we have decided to construct a 59-sector SAM for India. The base year of our SAM is 2021–2022, and it incorporates 3 factors of production and 10 categories of households. Table 3 gives the description of our sectors and its concordance map with 140 products and 66 industries of the SUT of 2018–2019.
Mapping Between SAM Sectors and Sectors of SUT
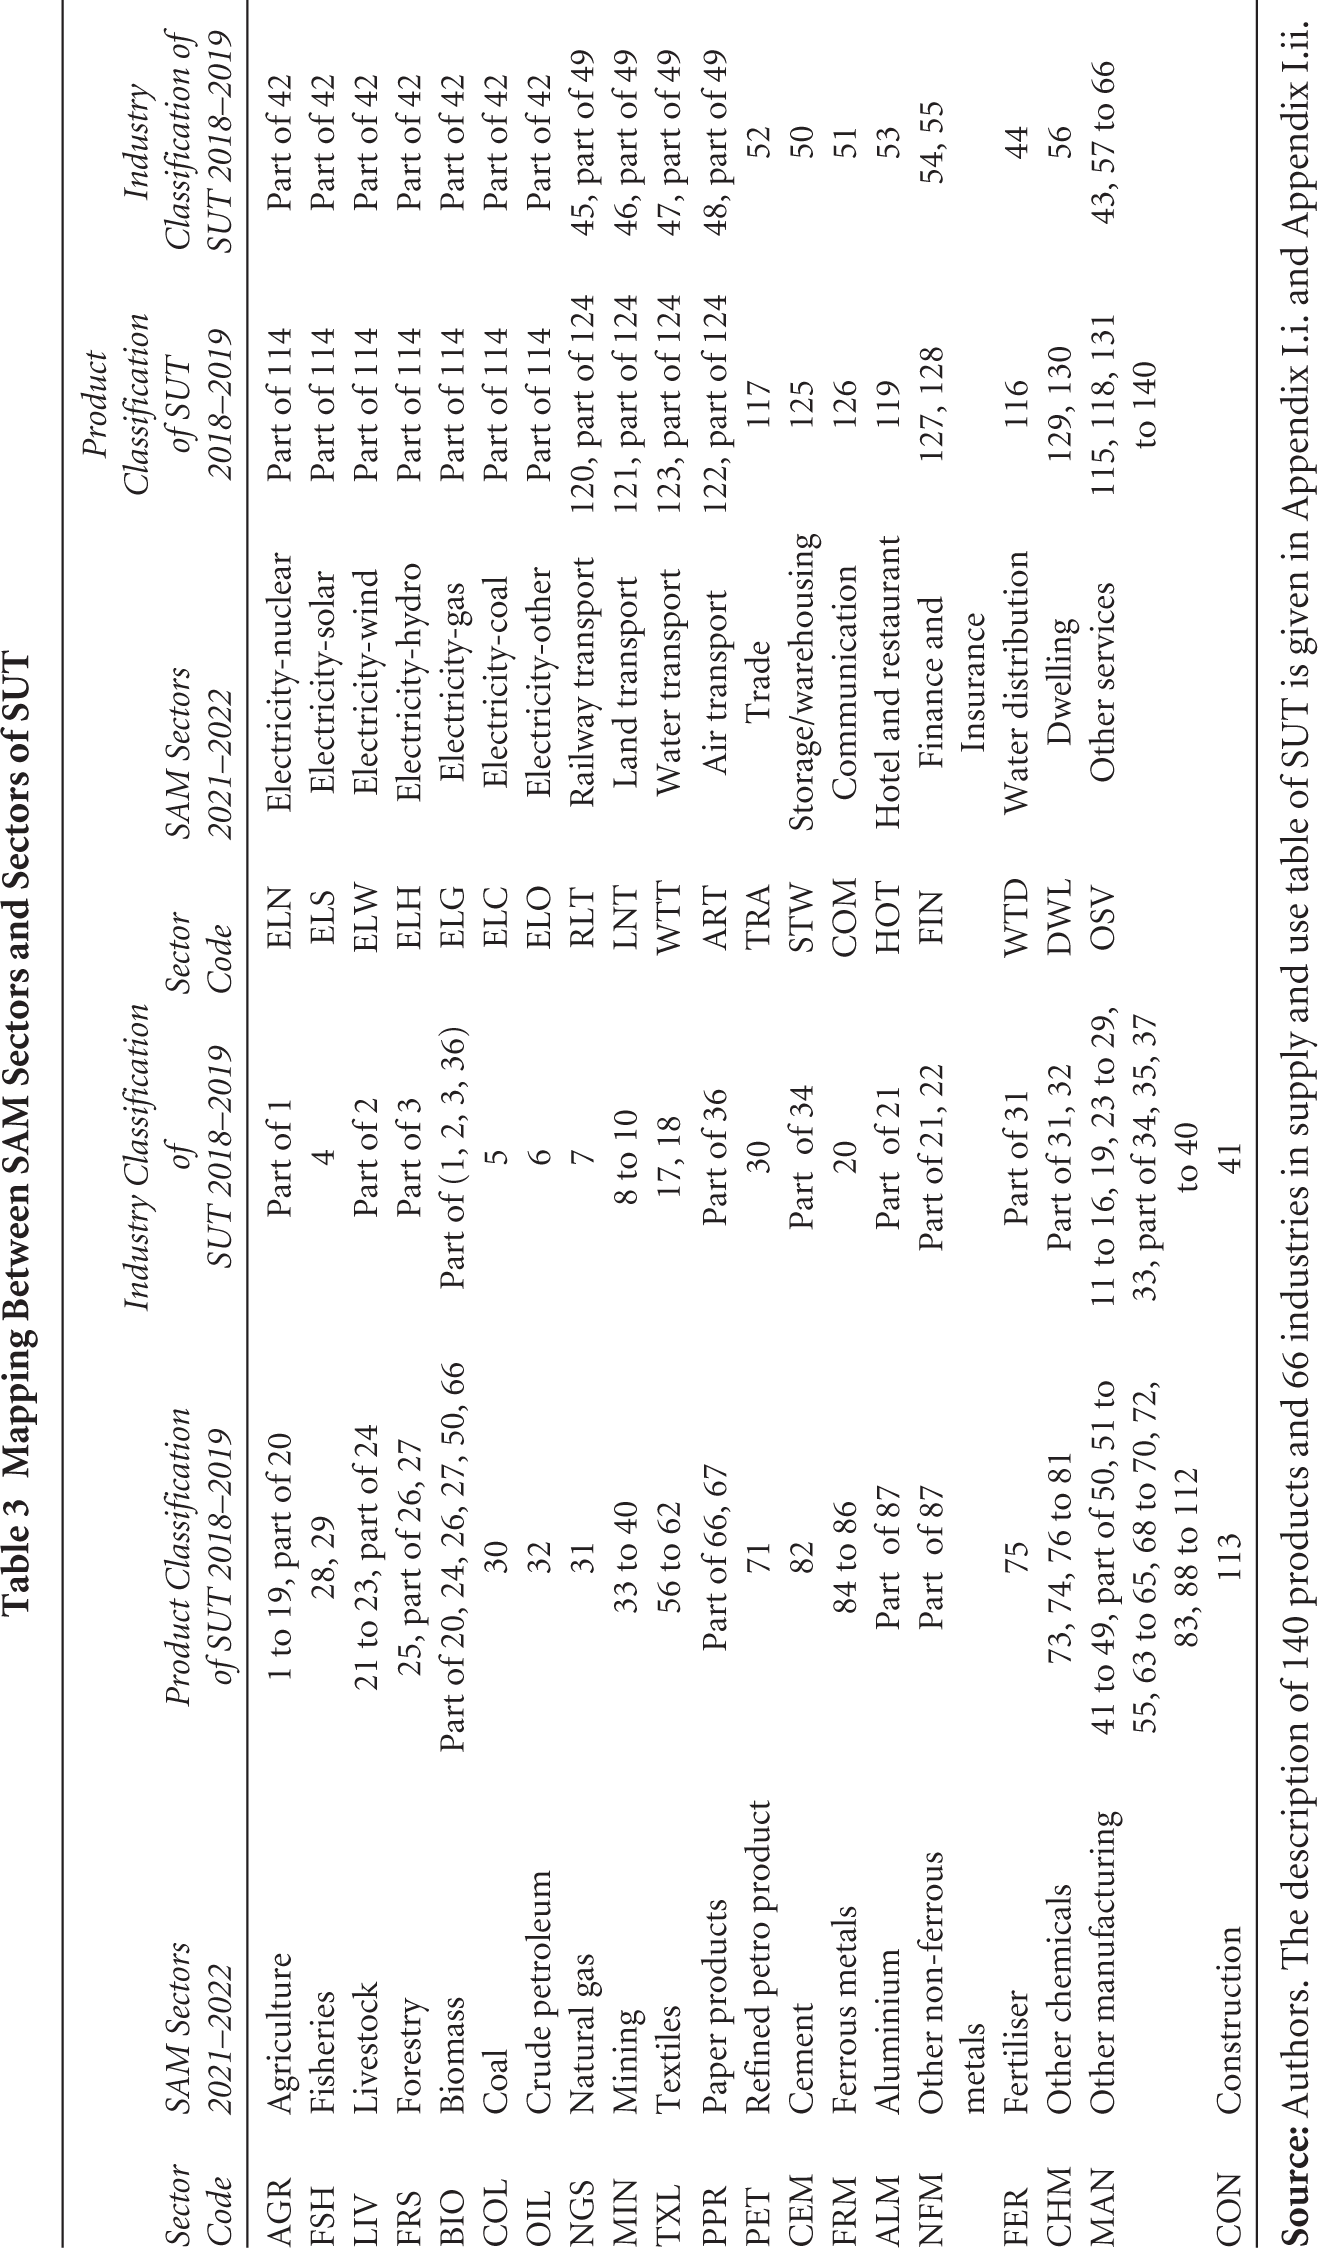
The important aspect of our SAM is the decomposition of the electricity sector into seven separate sectors, viz., nuclear, solar, wind, hydro, gas, coal and others. Energy-intensive sectors in the economy like cement or aluminium are disaggregated from their parent sectors. Biomass is also extracted from different sectors which contribute to the output of the biomass sector.
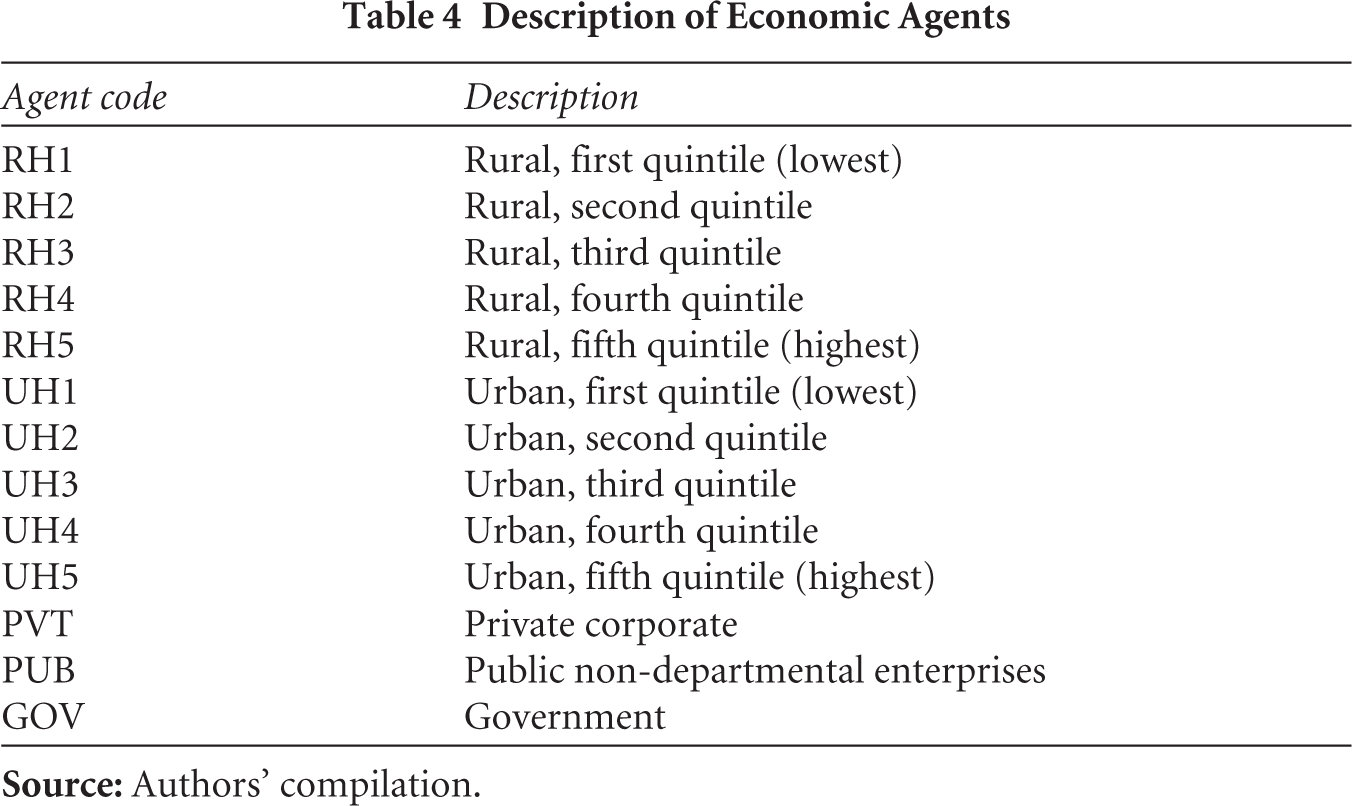
We have considered four broad economic agents in our proposed SAM, viz., households, government, public non-departmental enterprises and private corporations. Moreover, households are decomposed into 10 households’ groups based on their consumption quintiles (see Table 4).
Description of Economic Agents
The underlying assumptions in a SAM model are: (a) prices and expenditure propensities of endogenous accounts are constant; (b) government, ROW and capital accounts are considered to be exogenous, following the conventional practice (Miller & Blair, 2009), while the factors, institutions and sectoral production activities are endogenous; and (c) production technology and resource endowments are given for a time period (Babu et al., 2018).
2.2 Methodology for Constructing SAM
In our study, the methodology of construction of SAM is primarily based on Pradhan et al. (2006) and Pal et al. (2015). Though these studies prepare SAM from IOT, the basic methodology is similar. IOT is a by-product of the exercise. An attempt to develop IOT from SUT for India for 2013–2014 has been undertaken by Singh and Saluja (2018), but our objective was to prepare SAM, which not only provides a broader economic perspective by including the income distribution of households but also generates a basic structure for CGE modelling. So, the SAM for the Indian economy has been prepared with the base year of 2021–2022.
2.2.1 Construction of IOT from SUT
Both the supply table and use table of India are Product × Industry matrices, but their entries are different. In the supply table, each column presents the values of products (kept in rows) produced by industry or the products supplied by industries to the economy distinguishing the domestic supply from foreign supply (imports). The supply table documents the availability of individual commodities of goods and services and is usually valued at basic prices. The total supply of each product at the purchasers’ price has been obtained by adding taxes less subsidies on products and trade and transport margins. On the other hand, a use table shows the use of the product (a good or service and kept in rows) by the type of use (kept in columns), that is, as intermediate consumption, gross capital formation and exports. They are all at purchasers’ price.
For transforming rectangular SUTs into square SUTs, we needed to follow two major steps: First, the products included in the SUTs were disaggregated or aggregated in a way so that they represent the characteristic products of industries shown in the columns; and second, the industries included in the columns of SUTs are disaggregated or aggregated in a way so that they correspond to the products shown in the rows. Following either of the steps, the resultant square SUT will show in rows the characteristic products corresponding to the industries included in the columns. The choice of either of the two options depends on the size of the IOT to be compiled from the SUTs. We should also consider that as products included in SUT are often more than the industries in the rectangular SUTs, the option of disaggregating the industries would result in a larger size IOT. Conversely, if products are aggregated to correspond to the industries, the size of IO will be smaller. In general, the aggregation approach is preferred, as disaggregation requires much effort in collecting detailed data, and such compilations involved would almost be equivalent to compiling the SUTs afresh.
The criterion of any product, to be the characteristic product(s) of an industry or, in other words, any industry to be a producer of single or more products, was based on specialisation and coverage ratios based on the supply matrix. The specialisation and coverage ratios are share matrices respectively in column totals and row totals. Coverage ratios are row-wise shares of each product in domestic supply at basic prices. If the value of the ratio is equal to 1, it shows that the product is aligned with a particular industry. For example, products 1–20 (crops) are aligned to agriculture. Specialisation ratio indicates how concentrated an industry is in producing the primary products. These two ratios are used to map the product characteristics to industries. This provides us with a mapping between 140 products and 66 industries or vice versa. However, the limitation of the use of these two ratios is that changes in these ratios generally refer to changes in the structure of the economy, while it can arise from the merging of businesses or diversifying the products. Another limitation is that any change in these ratios depends on the output of secondary products. However, since we are using a static model in this study, we can safely use these ratios to get a mapping between products and industries.
The commodity × commodity IOT is constructed following the method suggested in System of National Accounts (1993), Studies in Method Series F. No. 2, Revision 3, 1968 (UN) under industry technology. Under the industry technology assumption, it is assumed that each industry has its own way of production, irrespective of the product mix. It is usually used when several products are produced in a single production process. Commodity technology assumption, on the other hand, assumes that each product is produced in its own way, regardless of the industry where it is produced, and technologies of primary and secondary products are independent. In a commodity × commodity table, both rows and columns represent the commodity group sectors. For our analysis, the commodity × commodity table is more suitable, since demand in the final demand vector is for a particular commodity or a group of commodities, and not for a mixed set of output from a particular industry. Also, for a commodity × commodity table, transfers made under commodity technology assumption sometimes yield negative entries which are difficult to explain. For these two reasons, industry technology assumption is made.
The commodity × commodity flow table is derived as follows:

where X is the use matrix, M is the supply matrix, B = X (g)–1: commodity × industry coefficient matrix, values in the use matrix expressed as coefficients; g is a diagonal matrix with diagonal elements as the elements of vector g; (g)–1 is the inverse of the matrix g.
D = M (q)–1: where q = diagonal matrix with diagonal elements as the elements of vector q; (q)–1 is the inverse of the matrix q.
Here, D is basically the market share matrix, the column of which shows proportions in which various industries produce the total output of a particular commodity.
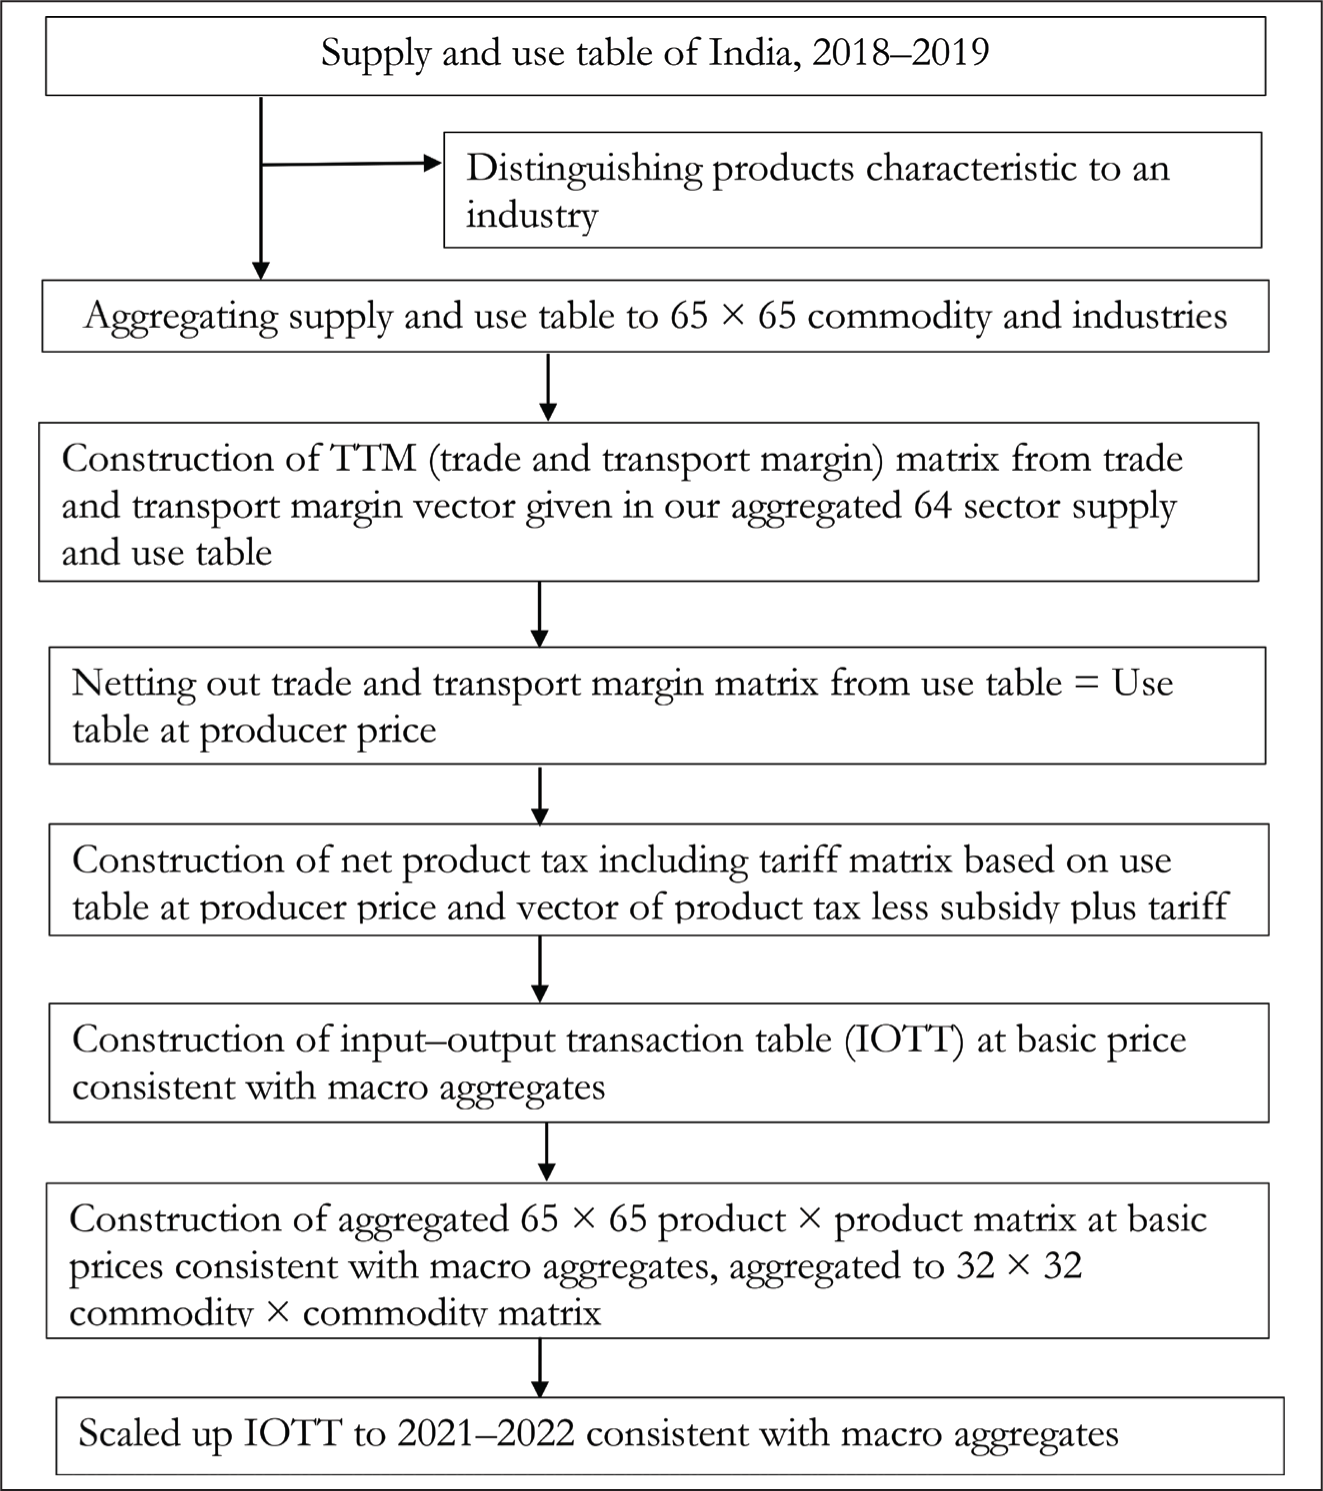
The flowchart of the construction procedure of our SAM begins with the construction of an IOT from the published SUT of India as shown in Figure 1. As Figure 1 indicates, initially, after aggregation, we have with us one aggregated supply table and one aggregated use table, each with a 65 × 65 dimension. For balancing the two tables and finally bringing them to an analysis, it is essential that both the tables are brought to the same valuation prices using trade and transport margin matrix and net product tax including tariff matrix. The detailed procedure is shown in Figure 1. Here, note that sectors like aluminium and cement are not shown as separate sectors/industries in SUTs. These have been separated from their parent sectors by drawing on their structure from detailed Annual Survey of Industries (ASI) statistics. ASI data, published by the Ministry of Statistics and Programme Implementation, Government of India, provide statistical information on the organised manufacturing sector comprising activities related to manufacturing processes, repair services, gas and water supply and cold storage. Most of these products originate in the registered sector, which are covered in the ASI statistics. We have not made any adjustment in their contribution originating in the unorganised sector. The 32-sector uniform IOT is scaled up to the year 2021–2022 using the latest national account statistics. The consistency of the IOT hence prepared for 2021–2022 is further checked for both income and expenditure.
India’s SUT provides only a column ‘Trade and transport margin (TTM)’, which covers the trade margins and the transport cost of goods, or freight cost, from the place of the seller to the purchaser. For all agriculture and manufactured products, the TTM value is a combination of trade and transport margins. For services, the TTM value is zero as it involves neither trade nor transport margin. For transport services, TTM depicts transport margins or freight costs only.
The transport services for which these freight costs are available are railway transport, road transport, water transport, air transport and supporting and auxiliary transport activities.
The values of TTM for all the above items present the values of freight cost for each type of transport as well as the cost of support services for each of the transport services. The support services include services such as switching and shunting (in the case of railways), parking charges (in the case of land transport), firefighting services (in the case of air transport), cargo handling in all types of transport services and service charges of travel agents.
The column vector of trade and margin is used to construct the matrix by distributing the column entry using output as the control total as follows:
Let us denote entry in supply table at a basic price (S) by sij, entry in the use table at purchaser price (U) by uij, entry in the use table at producer price (Up) by upij and TTM by ttmij. Then, TTM is derived as follows:

The sum total of the column value is further apportioned using a share of individual margin commodity vis-à-vis row sum of all the margin commodities together. The cell entries for margin sectors in TTMs are placed as negative values. We netted out TTM from the use table and further arrived at the use table at producer prices. For clarity, the derivation of the use table at producer prices (Up) is as follows:

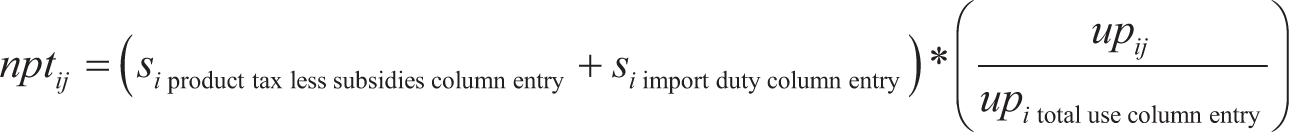
Similarly, we have constructed a matrix for net product tax including tariffs by similarly allocating net product tax including the tariffs column. We have taken out the net product tax matrix from the use table at producer prices, which further resulted in the use table by product and industry dimensions.
Let NPT be the matrix for net product tax including the tariff. The derivation is as follows:
The use table at producer prices (Up) and NPT are then used to construct IO transaction table at basic prices by deducing taxes from the Up table.
If we define the entry in the use table at the basic price (Ub) by ubij, then
2.2.2 Expansion of Energy Sector
Having constructed the 32 × 32 balanced IOT, we have extended the same to match our desired sectoral scheme, and finally a matrix with 39 production sectors is generated. The procedure is outlined in the following self-explanatory charts (see Figures 2 and 3). The methodology primarily follows Pal et al. (2012), but the energy sector is expanded to generate disaggregated distribution of renewable and non-renewable energy sources of power generation.
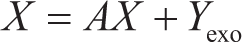
The electricity sector is expanded into seven sectors, namely, electricity from coal (ELC), electricity from gas (ELG), electricity from nuclear (ELN), hydroelectricity (ELH), electricity from solar (ELS), electricity from wind (ELW) and electricity from other sources (ELO) (Figure 2). Each category includes transmission and distribution loss. For this, annual reports of Hindustan Petroleum Corporation Limited (HPCL), Nuclear Power Corporation of India Limited (NPCIL), National Thermal Power Corporation Limited (NTPC) and of firms engaged in gas-based power, solar/wind electricity are utilised (HPCL, 2021–2022; NPCIL, 2021–2022; NTPC Limited, 2021–2022). The gross output of various sources of electricity is estimated using the share of generation from a particular source and the total output of electricity in our IOT (CEA, 2021–2022; Gas Authority of India Ltd, 2021–2022; National Power Portal, 2021–2022). For example, the output from electricity generation from hydro sources is estimated by multiplying the output from total electricity generation with the share of hydro in total generation of electricity. The underlying assumption is that the price of each source of electricity is the same. For the construction of columns in the SAM, GVA values from the annual reports are utilised. GVA of the ‘other’ sector is estimated by subtracting GVA from electricity produced by coal, gas, nuclear, hydro, solar and wind from the total GVA from electricity. Similarly, for intermediate use, data from the same annual reports are utilised, and the estimates for the ‘other’ sector are derived by similar subtraction. Net indirect tax in the total output of the electricity sector is distributed among sources based on their outputs’ shares in total. The shares of each of the seven electricity types are applied to total electricity rows to estimate the supply of seven different sources. Because there are no electricity imports except in the hydro sector, few of the columns are adjusted pro rata.
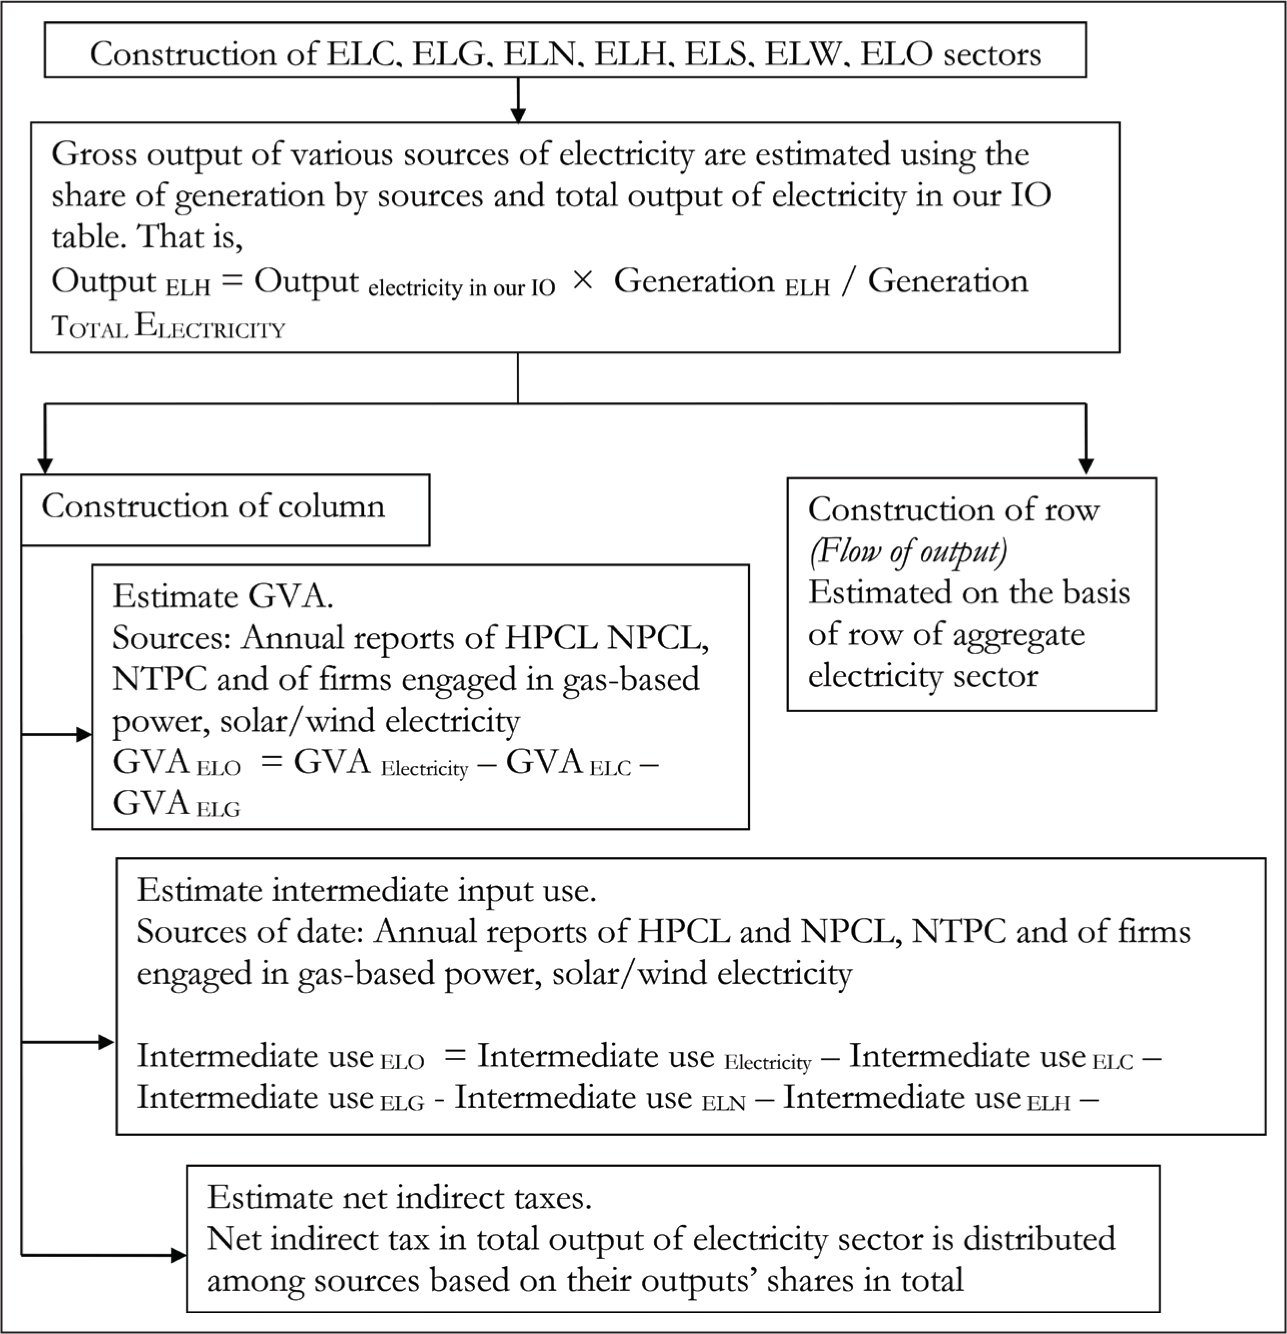
Biomass supply generally originates from agricultural residues, animal husbandry, firewood, and residual from the food and beverage industry and pulp-paper industry. Output value for the biomass sector is thus derived from other crops, livestock, forestry, paper and pulp and food and beverage sectors on the basis of the rows of the mother sector. The input structure of the biomass sector is largely drawn from crop, livestock and forestry. However, some consideration of specific industry sectors, such as paper and pulp and food and beverage sectors, are made in the pro-rata adjustments using Annual Survey of Industries data for 2018–2019 (NSO, 2018–2019). The respective input structure is drawn from Pal et al. (2015). After obtaining the columns and rows for each mother sector through this method, they are subtracted from the mother sectors and then added up to obtain the entries for the biomass sector.
2.2.3 Construction of Sectors Other Than Production Account in SAM
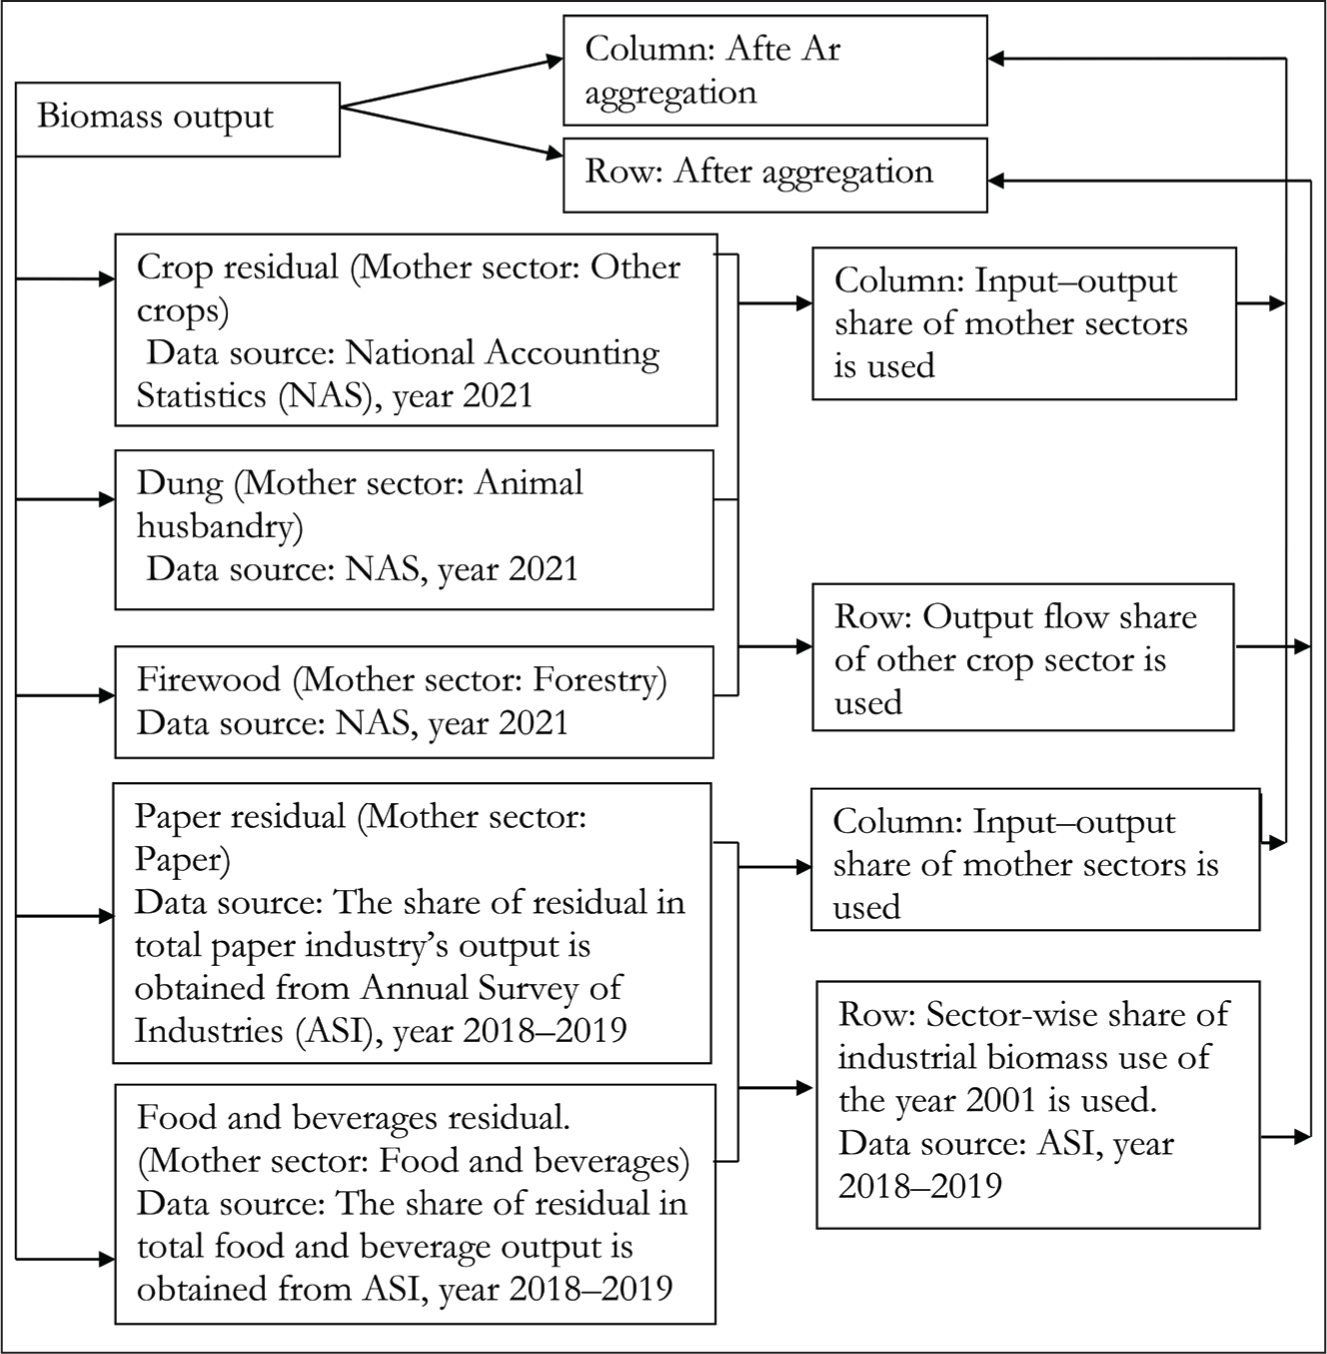
Apart from information from IOT, SAM requires information for factors of production, households, private corporates, public non-departmental enterprises, government, indirect taxes, capital account and ROW. The method that was applied in estimating these sectors in SAM follows the estimation process applied by Pradhan et al. (2006). The flowchart in Figure 4 shows the additional path adopted by us for the construction of these other sectors of the SAM apart from the IOT. In the subsequent sections, we have discussed each step in the flowchart in detail.
2.2.4 Division of GVA into Land, Wage and Capital Income
The use table in SUT shows the components of GVA by industry. The components are net production taxes, compensation of employees and gross operating surplus/mixed income. For the sectors that are expanded, we split the value added for the initial industry into the new industries by multiplying the initial value added with the share.
The extension exercise of IO to SAM involves additional data which are drawn mainly from the NAS of the Government of India, RBI’s KLEMS (K: Capital, L: Labour, E: Energy, M: Materials and S: Services) database and Global Trade Analysis Project (GTAP) database (Pratap & Chadha, 2023). The KLEMS database is used for distributing GVA among capital and labour, and the GTAP database is further used for allocation between skilled and unskilled labour. The original data provided to GTAP that were later utilised to prepare GTAP data version 11 are used in this study. In doing so, we have used the following three identities:
GVA = Net value added (NVA) + Depreciation, NVA = Payment for wage + Payment for land + Net payment for capital other than land, Net payment for capital excluding land = Gross payment for capital excluding land – Depreciation.
We have decomposed GVA into payment for wage, payment for land (if applicable) and payment for capital (other than land). The following procedure has been used apart from the above identities:
ASI gives the estimates of total emoluments and GVA from the registered sector for the manufacturing sector. In the case of the unregistered sector, we could not get similar data. The ratios of the registered sector are also used for the unregistered sector to get the wage and capital income. For agricultural sectors, we have used information from the Cost of Cultivation of Principal Crops Studies (CCS) of the Ministry of Statistics and Programme Implementation (MOSPI) to divide the GVA into land, wage and capital income for agriculture-related sectors. CCS give the data on the wages of the hired labour as well as the cost of the family labour. The wage estimates given in the SAM are, therefore, inclusive of the wages of family labour. For the service sector, we have mainly used the KLEM database and NAS statistics to decompose value added into labour and capital income. For the electricity sector, we have depended on annual reports of NPCIL, HPCL, NTPC and selected firms engaged in solar, wind and gas-based power stations to decompose value added into labour and capital components.
2.2.5 Distribution of Sector-wise Consumption Expenditure by Household Classes
The updated IOT provides commodity-wise private final consumption expenditure (PFCE) for 39 sectors only. Therefore, we have to decompose PFCE for these 39 sectors into 10 household classes. The latest round of the NSSO survey on consumption expenditure provides the distribution of per-capita consumption expenditure for 10 household classes for a more detailed level of classification of commodities for the year 2011–2012 (NSSO, 2011–2012). The census also gives the distribution of the rural–urban population for the year of our SAM. These two figures are used to derive consumption expenditure for our household class after (a) adjustment for sector-wise inflation and (b) population growth of rural and urban households. Sector-wise inflation estimation is based on sector-wise components of WPI and CPI indices.
2.2.6 Distribution of Household Income by Source of Income and by Wage and Other Components
We need to estimate the total personal incomes of each of our 10 household classes. The households receive income from different sources like labour income, income from capital owned by households, land income and transfer income from the government and ROW. In the first part of this section, we have estimated payment for wages for each of the domestic sectors of our SAM. On the other hand, the net wage income from ROW is available from NAS. We have added up these wage payments to obtain households’ total labour income. Now, we have to distribute this labour income among the 10 household classes. This has been done using (a) information from national household surveys and (b) SAM for the year 2017–2018 constructed by Pal et al. (2020).
To estimate household income from capital ownership, we have used our estimated data on payments of the domestic production sectors for capital use. The payment for capital along with net capital income from ROW is treated as the gross capital income of the economy where the data on net capital income from ROW are available from NAS. We subtract depreciation from gross capital income to obtain net capital income of the economy. This net capital income is received by household classes as well as by economic agents like the private corporate sector, public non-departmental enterprises and government. The private corporate sector receives capital income in the form of operating profits while the public non-departmental enterprises receive the same in the form of operating surplus and the government receives capital income in the form of entrepreneurship income. The data on operating surplus, operating profit and income from entrepreneurship are available from NAS for 2021–2022. So, the remaining part of the capital income is the capital income of the households. We have distributed this capital income among the household classes by using the share of each household’s capital income as available from SAM of Pal et al. (2020).
Next, we have to estimate land income received by the household classes. Noted that only the rural agricultural self-employed household class receives income from land. In this case, we have taken the total payment for land factor as the total land income of that class.
The other sources of household income are transfer income from the government and net current transfer from ROW. The NAS gives data on current transfers from the government and net current transfers from ROW. The government transfer includes direct government transfer to the households and interest payment for debt. A part of this interest payment goes to the private corporate sectors due to their holding of public shares, bonds and so on. We have estimated interest income received by the private corporate sector and other parts of government transfer using data from NAS.
Thus, we have obtained households’ personal income from different sources. The household personal income obtained in the above way did not match with the column total of each of the household classes of our SAM. A pro rata adjustment has been made to obtain the control total, that is, row total of each household class in our SAM.
2.2.7 Construction of Tax Account (Direct and Indirect Taxes)
The indirect taxes reported in our SAM are net of subsidies (net indirect taxes). The net indirect taxes on household consumption and government consumption include GST, excise on domestic production and customs duties on imported goods. The decomposition of net indirect taxes across production sectors is done using the IO flow table.
The total direct taxes drawn from NAS are distributed among different categories of households in the following manner. Land revenue is paid by self-employed agricultural households. The other direct taxes are distributed among different categories of households in proportion to their personal income, assuming no direct tax is to be paid by agricultural and non-agricultural labour households and self-employed rural agricultural households.
2.2.8 Construction of Capital Account
This account represents the macro balancing of savings and investments. Net savings include those by the households, private corporate sector, public non-departmental enterprises, government and ROW. Net savings along with depreciation equal gross domestic capital formation. The savings of different categories of households are derived by subtracting their consumption and direct taxes from their total personal income.
The retained earnings of the private corporate sector and non-departmental public enterprises are treated as their savings. The difference between the revenue and current expenditure of the government is its savings. The foreign savings are equal to the difference between gross domestic capital formation and gross domestic savings.
2.2.9 Treatment of Foreign Trade, Private Corporate and Public Enterprises
The column of ROW describes the exports of goods and services, net factor income from abroad, net capital transfer to the government, other current transfers to the households and private corporate and foreign savings. The data on exports are directly available from IO flow table 2021–2022. The other data are drawn from National Accounts Statistics (NAS) and Reserve Bank of India (RBI) Balance of Payment data, while NAS is used mainly for aggregated values, and RBI is used for disaggregation of data (MOSPI, 2020, 2021; RBI, 2021–2022). We put these data under the column of ROW in such a manner that the column total of ROW must be equal to the total imports.
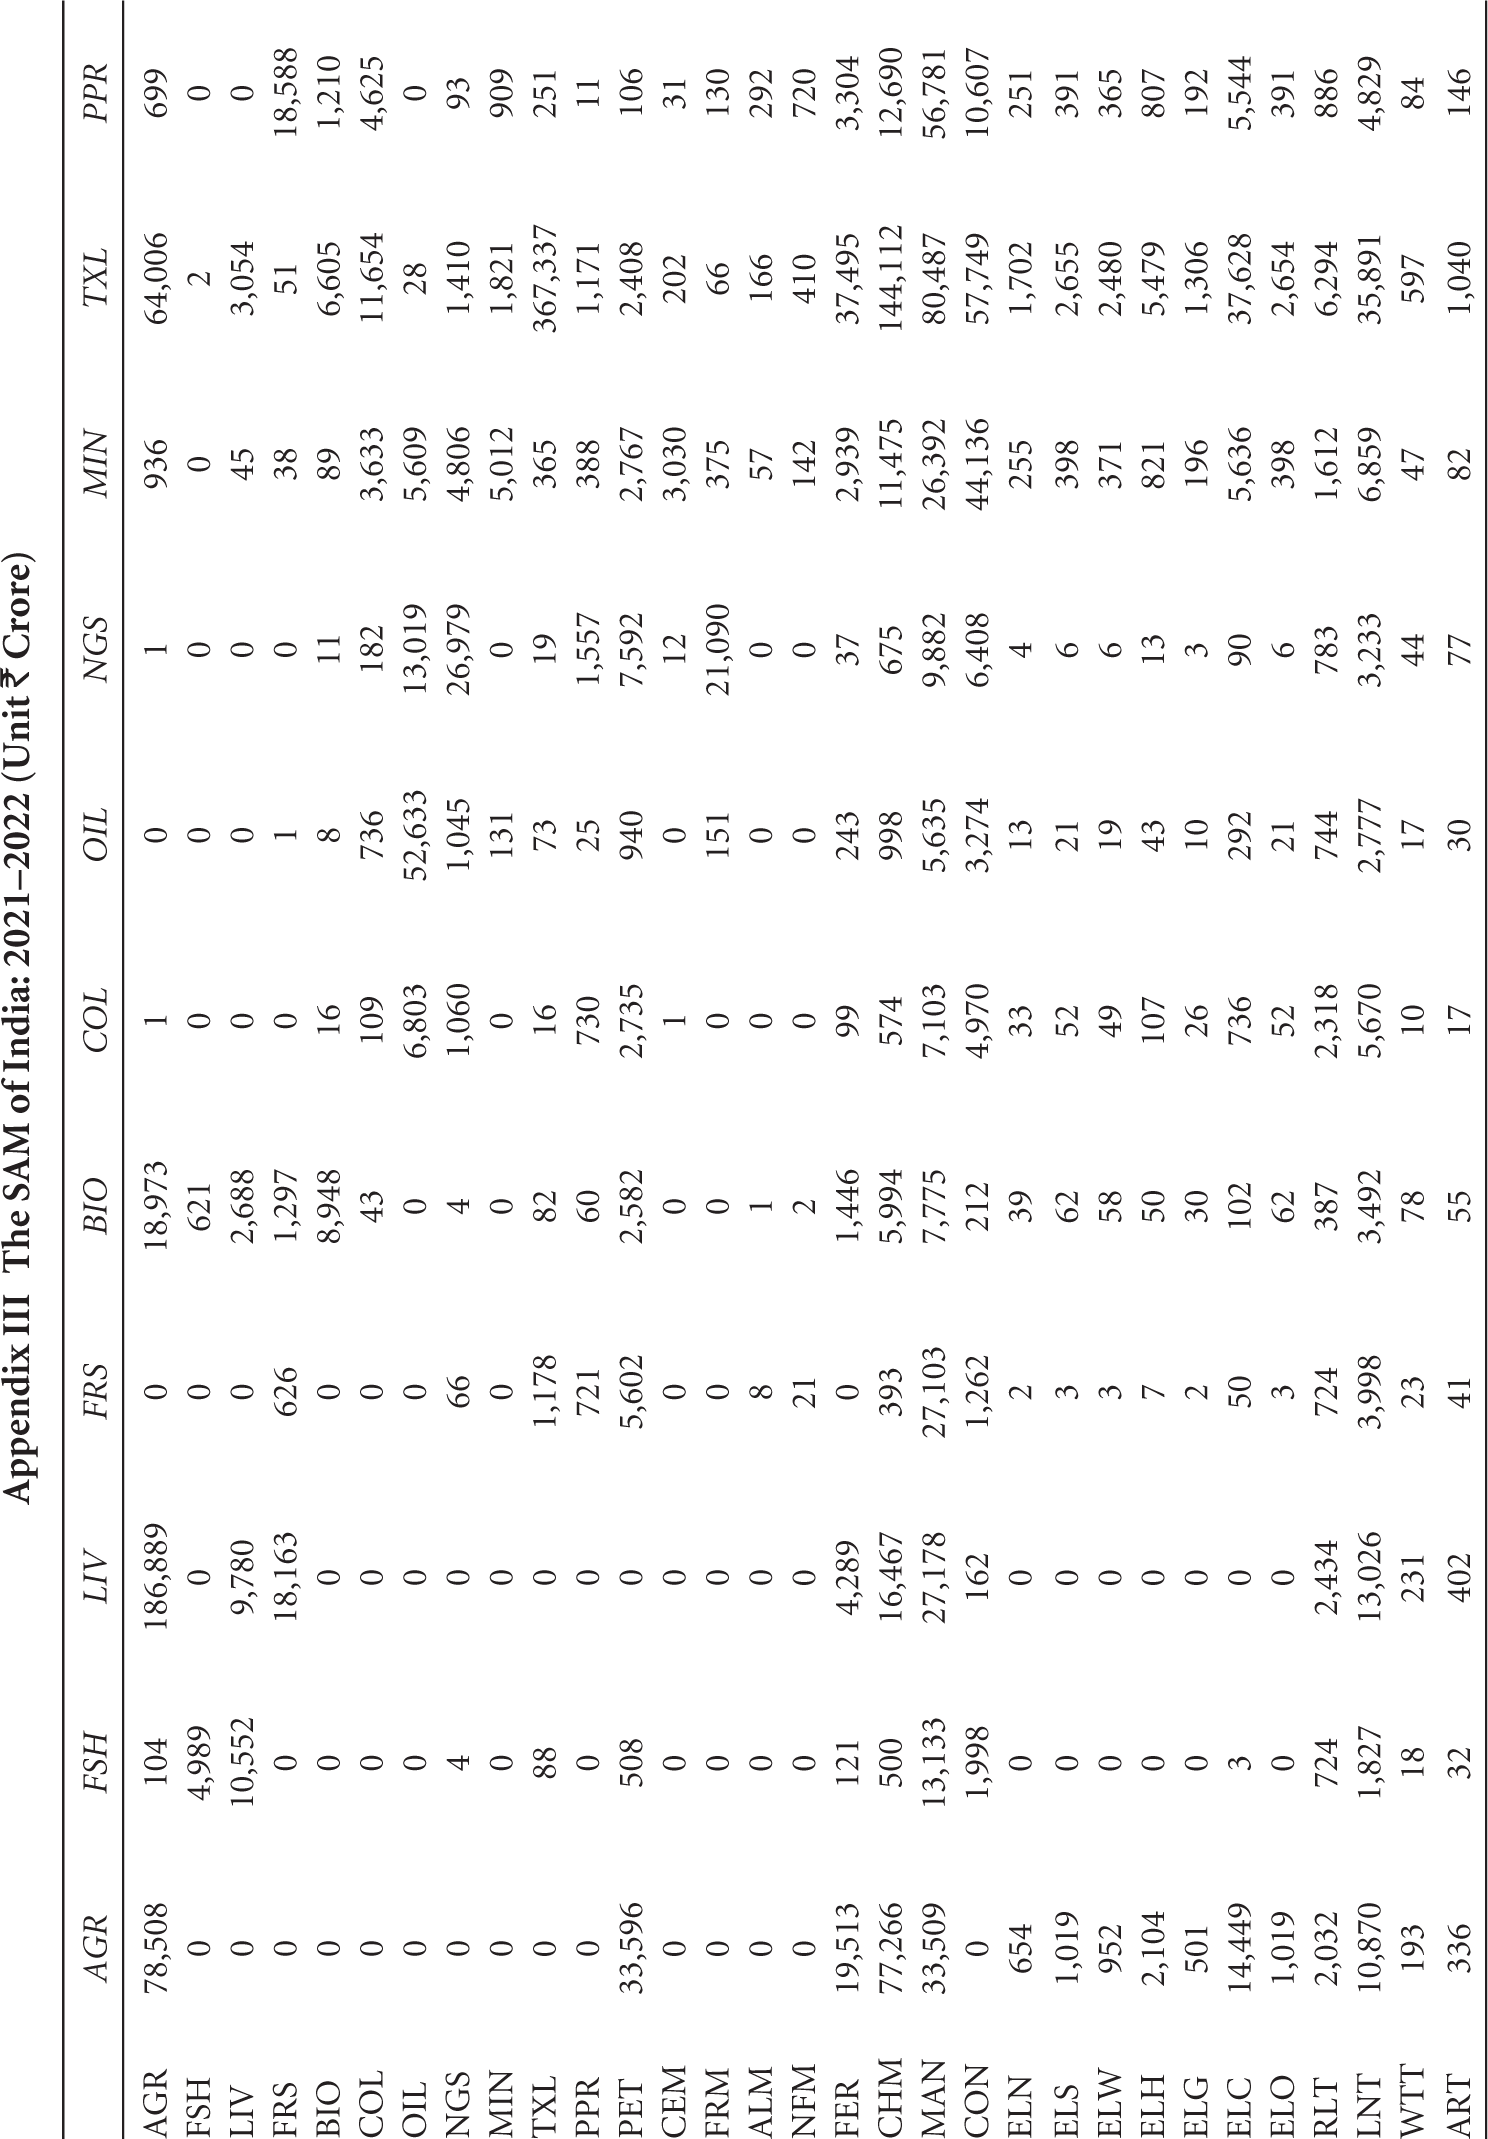
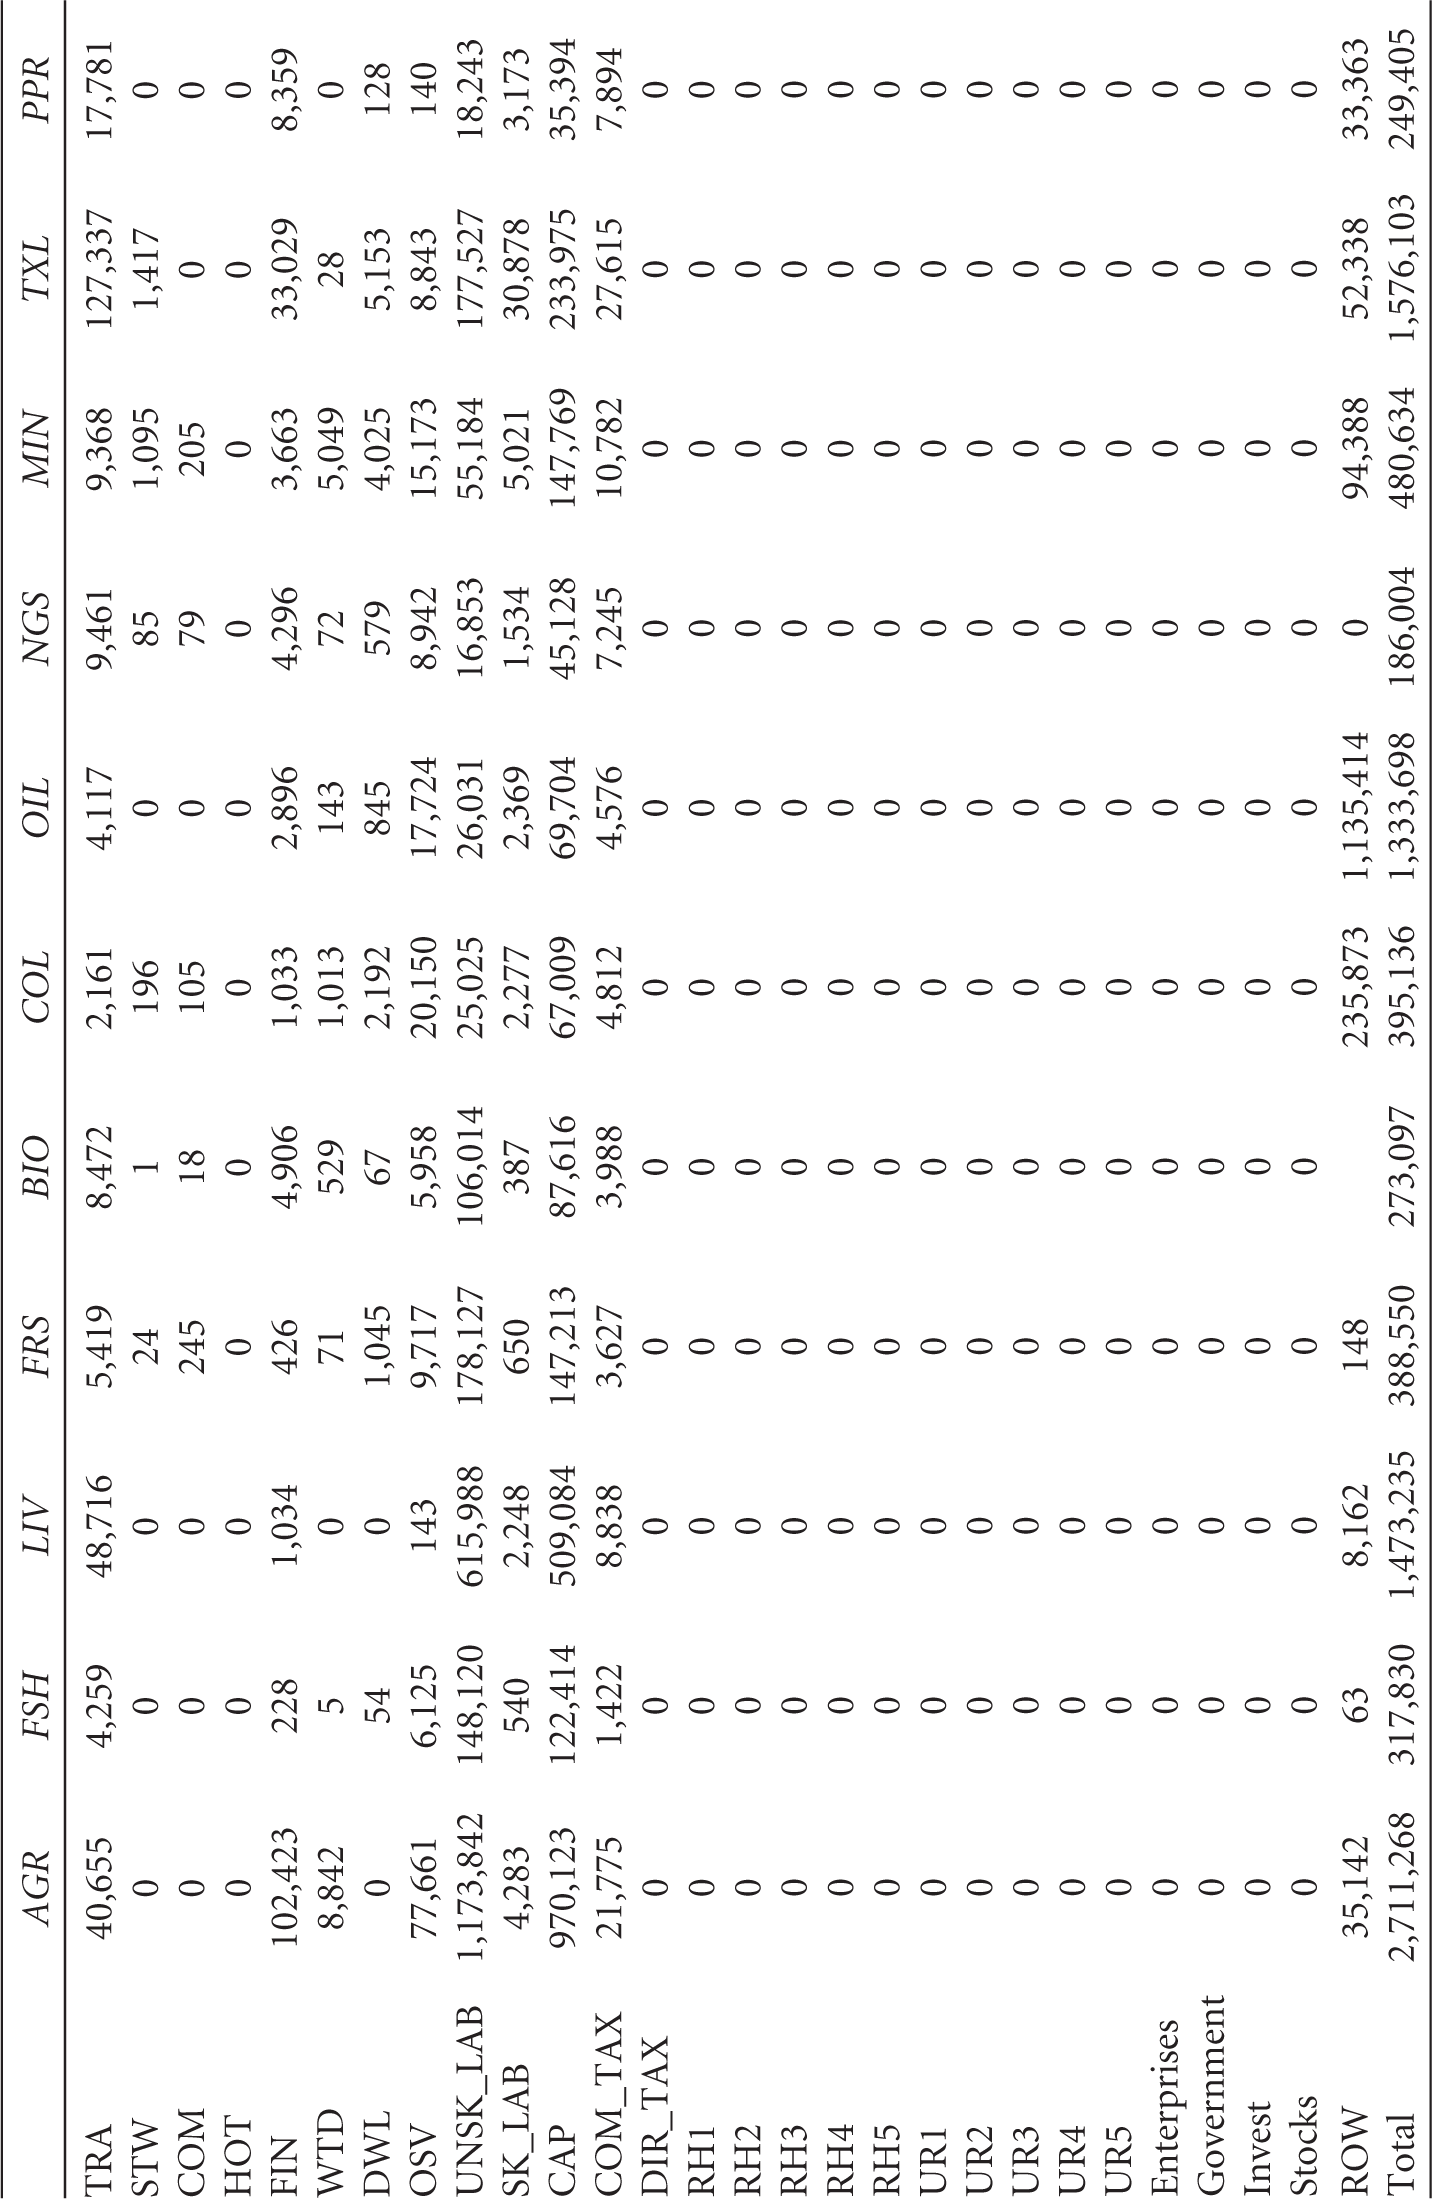
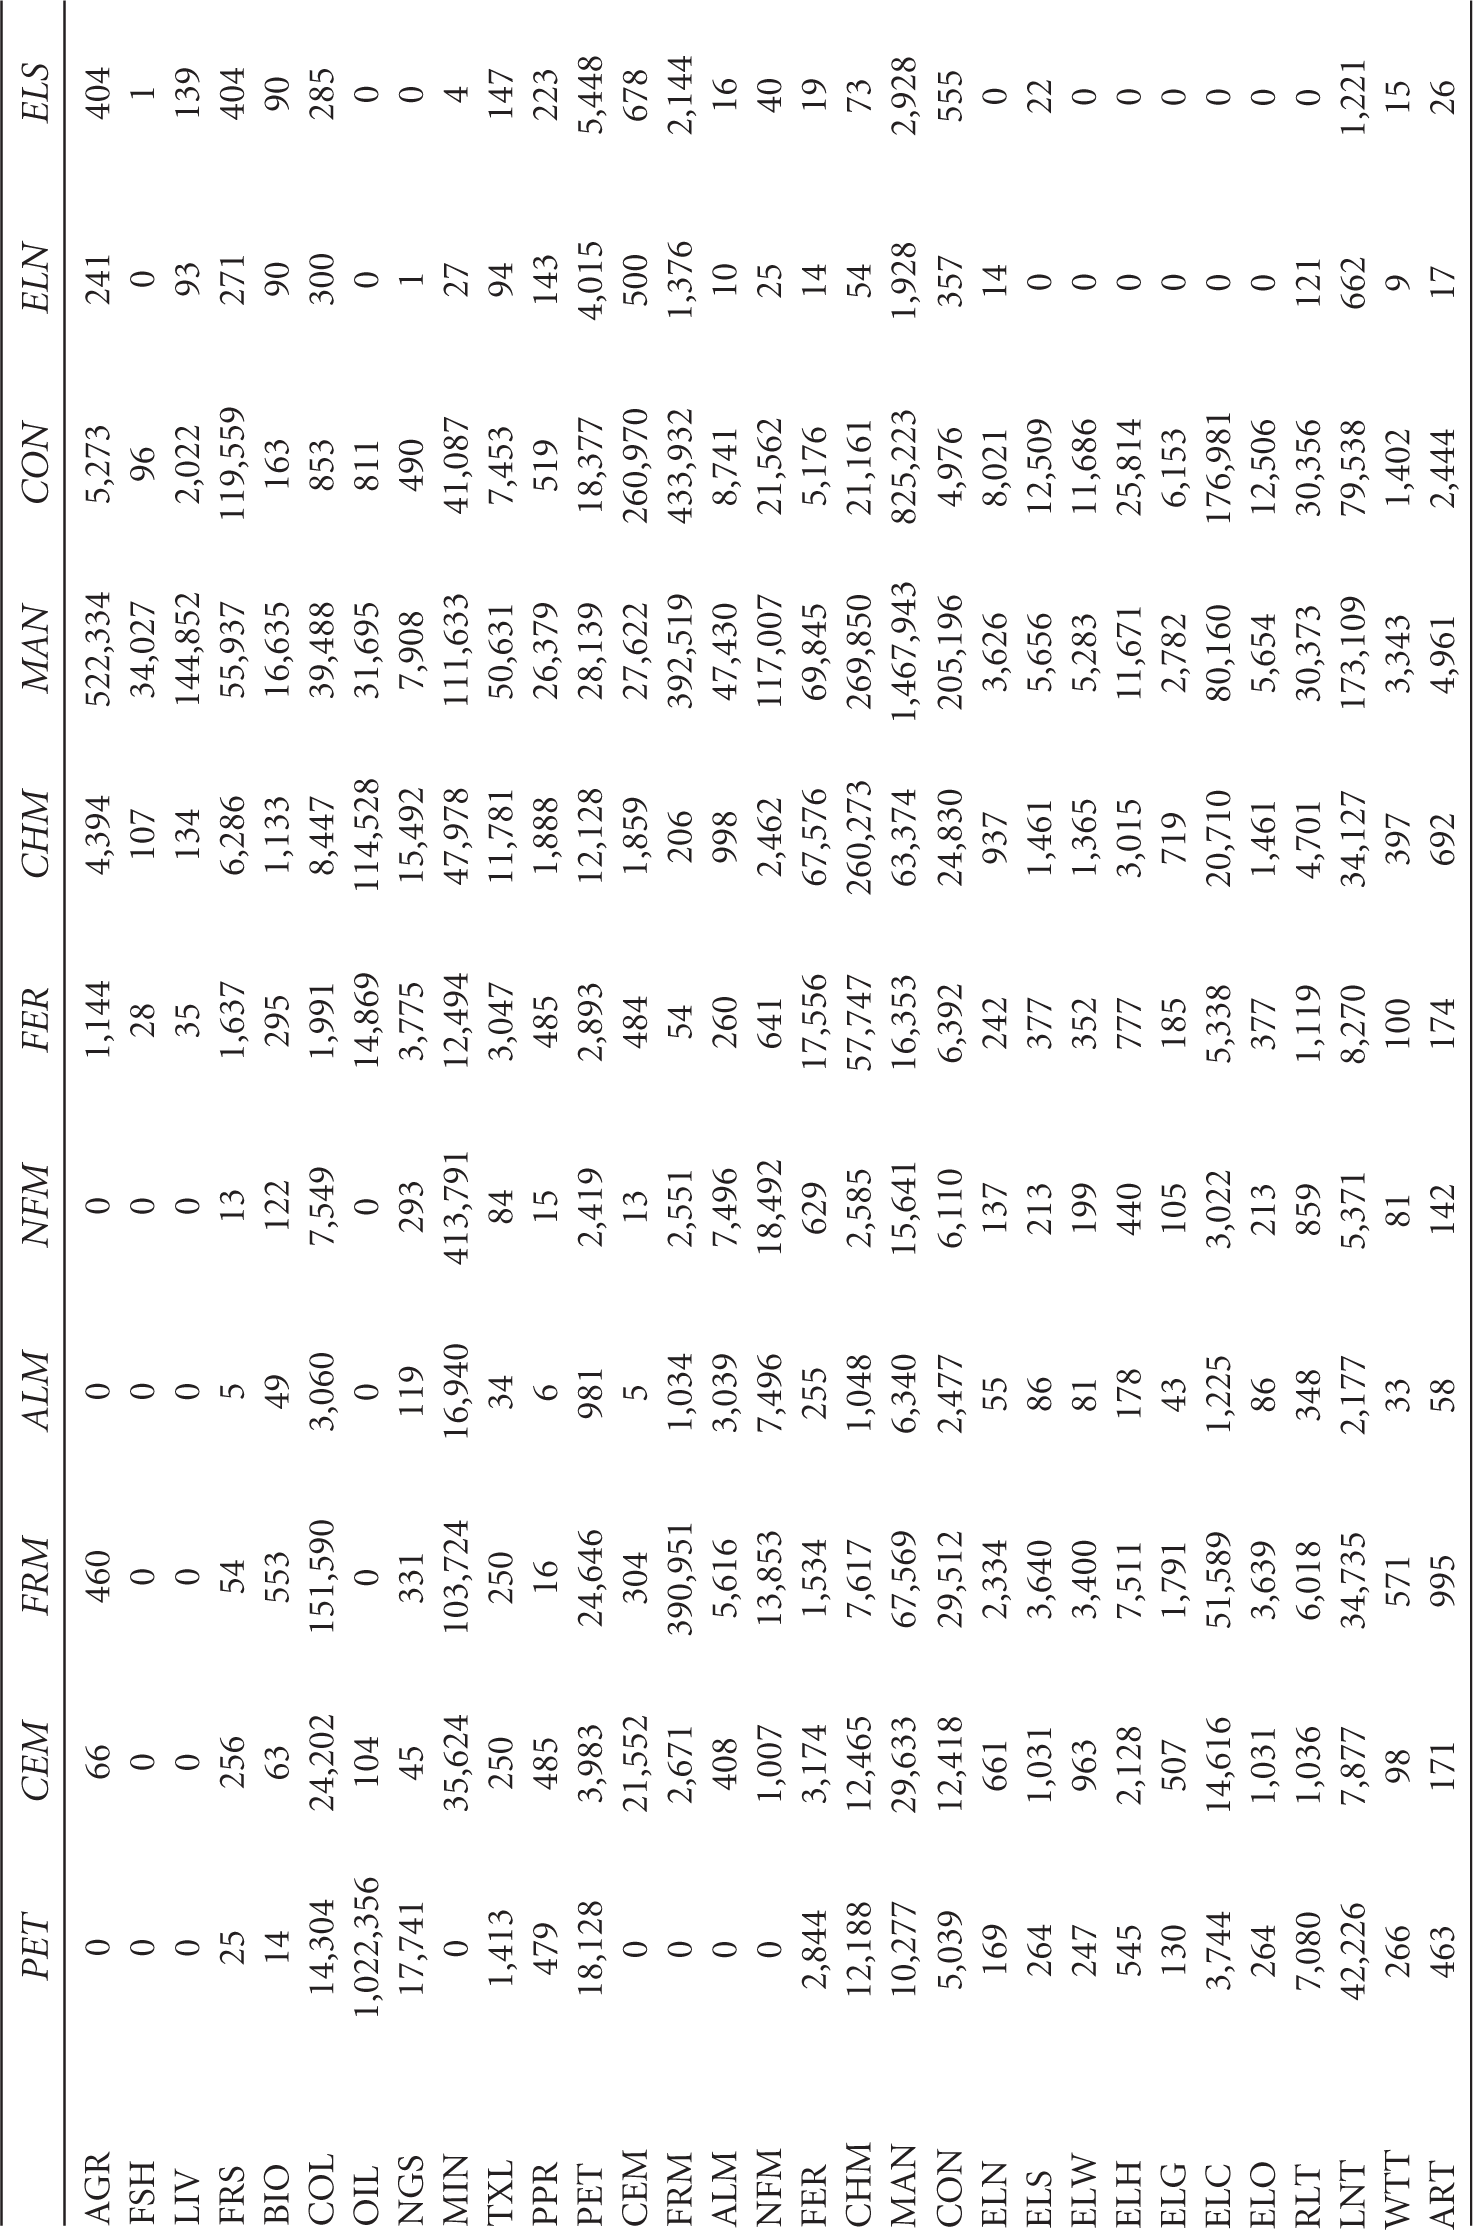
In the method described above, we have constructed a SAM for India for the year 2021–2022 (see Appendix III in Supplementary file). This SAM consists of 39 producing sectors, three factors of production and four economic institutions including the household sector. The households are also classified into 10 broad categories according to their income quintile class in rural and urban areas in this SAM. Having filled up the entries in this way, the RAS technique is applied so that the total of each row matches the corresponding column total of each column. In this way, the consistent SAM of India is estimated.
2.2.10 Estimation of SAM Multiplier
Given this structure of the Indian economy, let us now discuss the impact on factor demand and energy use due to any exogenous change in the Indian economy. This is done using the methodology of SAM multiplier analysis.
Let A be the domestic expenditure coefficient matrix and X be the matrix of sector-wise gross output. Also, let Yexo be the exogenous account comprising government, capital account and ROW. Therefore, the SAM can be written as
Or
If we denote (I – A)–1 matrix as M, then equation (2) can be written as
where M is the SAM multiplier matrix, with a representative element mij as the total (direct + indirect + induced) impact on account i due to change in exogenous injections in account j.
To analyse the effect of change in the exogenous sector on labour demand, we need to estimate the employment multiplier. For that, first, we need to estimate the employment coefficient ej of sector j, which is the ratio of the number of jobs Ej to the output Xj (equation (4)). The total effect on employment as a result of change in the exogenous account is estimated by equation (5). The employment multiplier, which captures the effect of change in the exogenous sector on labour demand, is estimated as M(I – A)–1.
The SAM multiplier has several applications. For instance, to capture the impact on production activities due to increased spending by the household, one needs to consider the column of the household sector corresponding to the rows of the activity sectors of the M matrix (i.e. Mactivity by households). Similarly, to understand the impact of increased production activities on households, we need to look at the column of activity sectors corresponding to the rows of the household sector of matrix M (i.e., Mhouseholds by activity). Each variation unit in the exogenous account (Yexo) affects the endogenous account (X) by M. The accounting multiplier matrix in the SAM framework captures the overall impacts of the variations in a particular sector, along with other sectors within the economy.
However, there are some limitations of the SAM multiplier. It is operated at a fixed price setting, and price effects are not captured. Also, the construction of SAM requires the collection of huge information from different types of data sets, and it is not easy to rationalise the two data sources. It is not always possible to use the data sets without some adjustments. However, it provides a simple structure of the economy to analyse the potential effects of an exogenous policy or external shock on the economy. However, the application of multiplier analysis requires caution in case the economy is suffering from bottlenecks in the supply of goods and services.
3. Results and Discussion
The focus of the paper is to generate a SAM for India for the year 2021–2022. The SAM we generated is a 59 × 59 matrix, where there are 30 production sectors; three factors of production, viz., skilled labour, unskilled labour, capital; direct and commodity tax; 10 categories of households (rural and urban, each with five decile groups); government; public non-departmental enterprises; and private corporations. In the first step, a 39-sector IOT for India for the year 2021–2022 is prepared, and then it is extended to SAM, following the methodology described above. Both the tables are shared as Appendix Tables II and III in Supplementary Material, because of space constraints. The SAM helps us to analyse the structure of the economy, employment implications and the consequences of India’s energy policy targets on employment generation.
3.1 Structure of the Indian Economy: Some Observations from SAM
The structure of the Indian economy can be outlined from the SAM. Table 5 shows that the service sector is fuelling the growth in the Indian economy in 2021–2022. Broadly, the service sector, including transport, has the highest contribution to the GDP with 51 per cent share, while manufacturing sector’s contribution (including construction) is at 26 per cent, agriculture at 20 per cent and energy at 4 per cent.
Sectoral Share of GDP in Total GDP of the Year 2021–2022 (Unit: ₹ Crore)
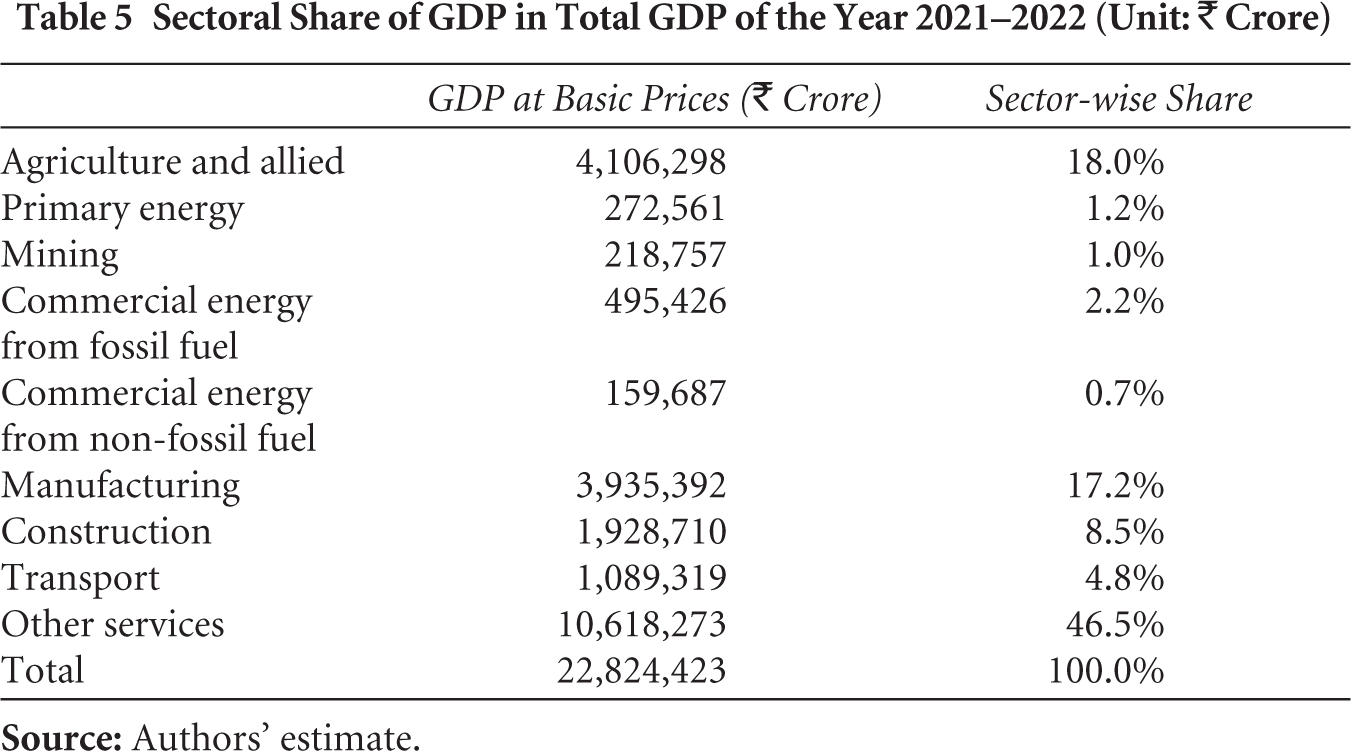
Figure 5 shows that labour intensity is still quite high in agriculture and allied sectors because agriculture still provides subsistence jobs to a large section of the Indian population. However, the labour intake happens largely for unskilled workers. Skilled labour intensity is high for the services sector and non-fossil fuel–based commercial energy.
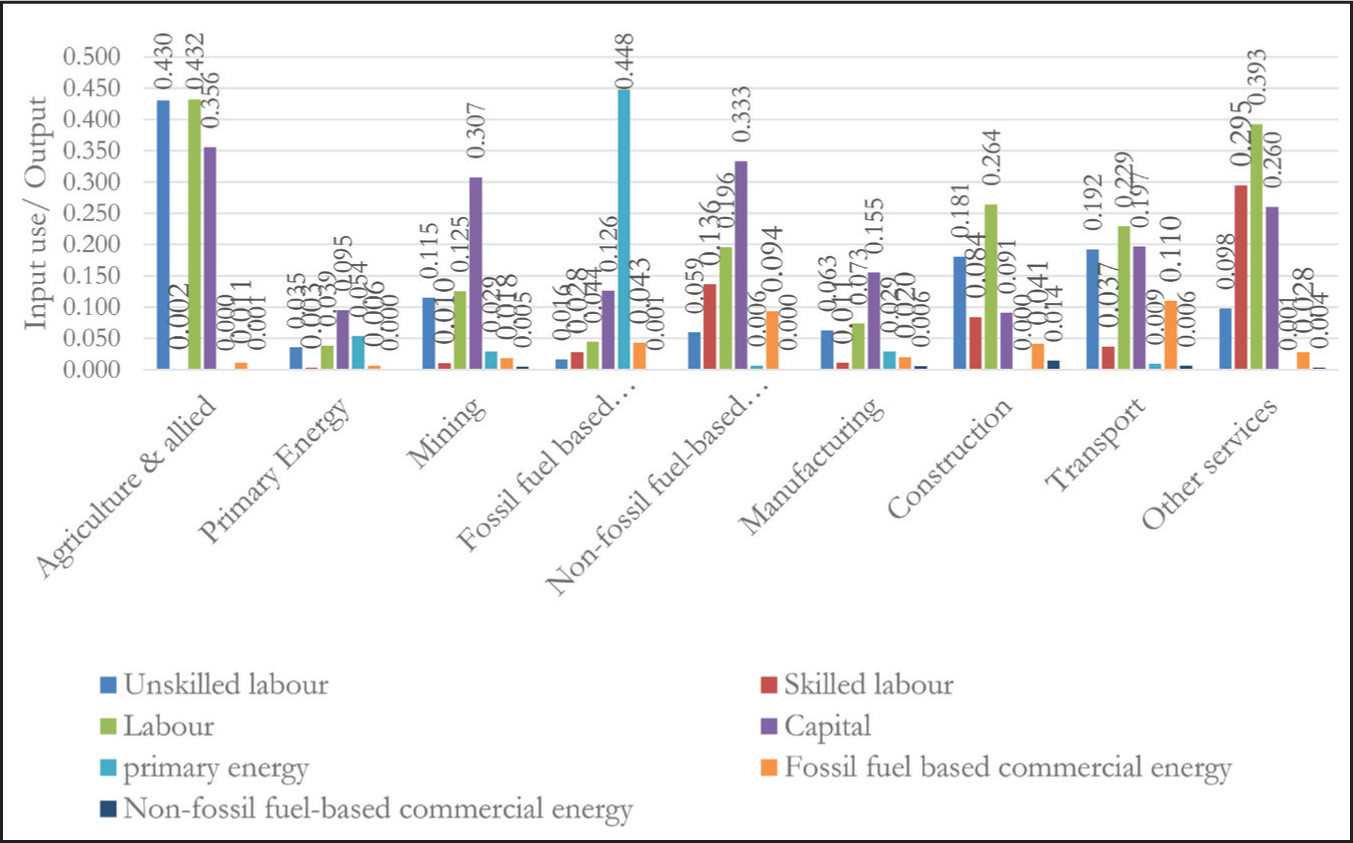
Indian economic structure with service sector bias positions the economy in an advantageous position in the current climate change debate. Because of the relatively low energy intensity of the service sector from the production side or supply side, the Indian economy enjoys the benefit of relatively low energy intensity. Overall, the energy intensity of the Indian economy is 0.073. Here, capital estimates include land, and so is capital intensity estimates.
Our SAM indicates that the households belonging to the lowest income quintile in rural areas spend a major part (i.e. 33 per cent) of their consumption expenditure on agriculture commodities as compared to other commodities, while the lowest quintile group in urban areas spends only 28 per cent of their consumption expenditure on agriculture commodities. The lowest quintile in rural areas is spending 40 per cent of their consumption expenditure on manufacturing goods, which might be caused by the advent of mobile and other consumption goods which are now perceived as a necessary commodity. On the contrary, the highest income quintile in urban areas spends only 9 per cent of their consumption expenditure on agricultural commodities while it spends 65 per cent of their consumption expenditure on services. Both for rural and urban areas, as income grows, people tend to spend less on agricultural commodities and more on services.
3.2 Employment Implications Towards Energy Sector
A multiplier analysis is done to facilitate the implication of SAM on the energy sector in India. In our multiplier analysis, government, capital account and ROW is treated as an exogenous sector. There are many studies where ROW, government and capital accounts are considered as exogenous sectors. For example, Njoya (2023) mentioned that exogenous accounts comprise the ROW, government and capital accounts. Tiku et al. (2022) consider five exogenous accounts including government, capital balance, indirect tax minus subsidy, the rest of Indonesia and ROW. Ferrari et al. (2022) selected public and private expenditure, capital accounts and ROW as exogenous account. Betho et al. (2022) define exogenous final demand by households, government, investors and export demand. Mardones and Brevis (2021) stated that exogenous accounts are commonly related to government spending, investment, and/or exports. Morrissey et al. (2019) aggregated savings and investment and ROW account into a single exogenous account. Hartono and Resosudarmo (2008) also consider ‘other’ as an exogenous account, which consists of corporate, government, capital account, indirect tax, subsidies and foreign transaction accounts.
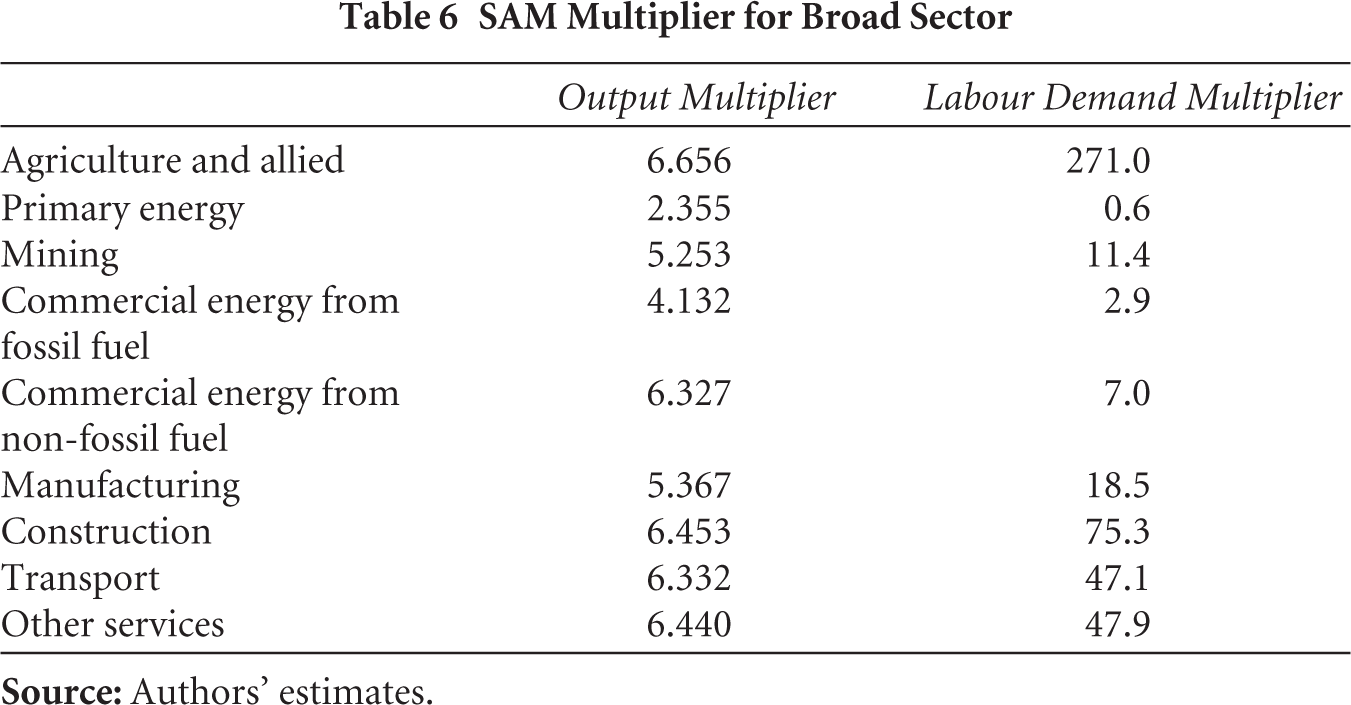
In this study, we have estimated the SAM multiplier for some broad sectors, namely, agriculture, energy, manufacturing, transport and other services. The results are shown in Table 6. Output multiplier shows how much a sector’s output would increase if there is an exogenous shock of units in the economy. The addition of the columns of the multiplier matrix shows the output multiplier, which reveals the total effect of an exogenous shock received by an endogenous account on the rest of the economic activity (Cardenete & Garcia-Tapial 2019). Results show that for one unit change in the exogenous sector, the output in agriculture and allied activities increases by 6.656 units. Similarly, the effect of an increase in one unit exogenous account would increase the output of commercial energy from fossil fuel by 4.132 units, while a similar change in the exogenous account would increase the output of commercial energy from non-fossil fuel by 6.327 units. For labour demand, one unit of increase in the exogenous account would increase the labour demand in commercial energy from fossil fuel by 2.9 units, while a similar change in the exogenous account would increase labour demand in commercial energy from non-fossil fuel by 7.0 units. So, our results show that the multiplier effect on electricity generation from non-fossil fuel energy sources has a larger effect on output and labour demand as compared to electricity generation from fossil fuel energy sources. Agriculture has the highest output multiplier followed by services, construction, transport, commercial energy from non-fossil fuel and manufacturing. The labour demand multiplier is highest in the case of agriculture. The other sectors contributing to high returns to labour are construction, services and transport.
SAM Multiplier for Broad Sector
3.3 Implication of India’s Environmental Policy Target
As an application of the newly constructed SAM, we have analysed the employment implication of India’s Nationally Determined Contribution (NDC) emission commitments. India first submitted its Intended NDC to the United Nations Framework Convention on Climate Change (UNFCCC) in 2015, with two quantitative targets: to make cumulative electric power installed capacity from non-fossil sources 40 per cent by 2030 and to reduce the emission intensity of GDP by 33–35 per cent compared to 2005 levels and making the carbon sink of 2.5–3 billion tonnes of CO2 equivalent with forest and tree cover. In the updated NDC, communicated to the UNFCCC in 2022, India set its target to reduce emissions intensity of its GDP by 45 per cent by 2030, from the 2005 level and to reach about 50 per cent cumulative electric power installed capacity from non-fossil fuel–based energy resources by 2030. Achieving this target requires a shift in technology, which would have implications for the overall economy. Presently, the share of renewables in power generation in India is only 12 per cent (as of February 2023). Coal is still the dominant source of energy for power generation (73 per cent in 2023) in India.
With increased focus on the promotion of renewable energy and policy initiatives to achieve the net zero target, the energy sector is going through a transition phase, and there would be an impact of the transition on socio-economic factors like employment. In this section, we explore the impact of the targets on electricity generation from renewable energy sources on the Indian economy, as an application of our SAM along with the Periodic Labour Force Survey data on labour force participation and data on the energy sector from India Climate and Energy Dashboard published by the NITI Aayog.
We have developed three scenarios for the analysis for capturing the effect of the policy emphasis on the renewable energy sector: (1) Scenario 1 assumes the present composition of energy generation in 2030. (2) Scenario 2 assumes that renewable’s share in electricity generation is increased to 50 per cent in 2030. (3) India targets to ramp up the share of installed capacity of electricity generation from renewables to 50 per cent of total installed capacity by 2030. However, it is perceived historically that an increase in installed capacity does not always increase generation at the same scale. For example, the share of solar energy in total installed capacity of electricity has increased from 2 per cent to 16 per cent from 2015–2016 to 2022–2023, but the share of solar energy in total electricity generation in India has increased from 1 per cent to 6 per cent only during the same period. So, in scenario 3, we assumed that renewable’s share in electricity generation would become 30 per cent in 2030, as a result of an increase to 50 per cent share of renewable energy in total installed capacity. All the scenarios are based on a 6 per cent growth rate of energy demand, which is the average growth rate of energy generation between 2018–2019 and 2022–2023.
Our estimates show that the present composition of energy generation (scenario 1) would provide direct employment to 3.9 million people in 2030, vis-à-vis employment of 1.1 million people in the energy sector in 2021 (Figure 6). If renewable’s share in electricity generation is increased to 50 per cent (scenario 2), it would provide direct employment to 4.5 million people in 2030. Under scenario 3, direct employment is provided to 4.2 million people in 2030 in the energy sector.
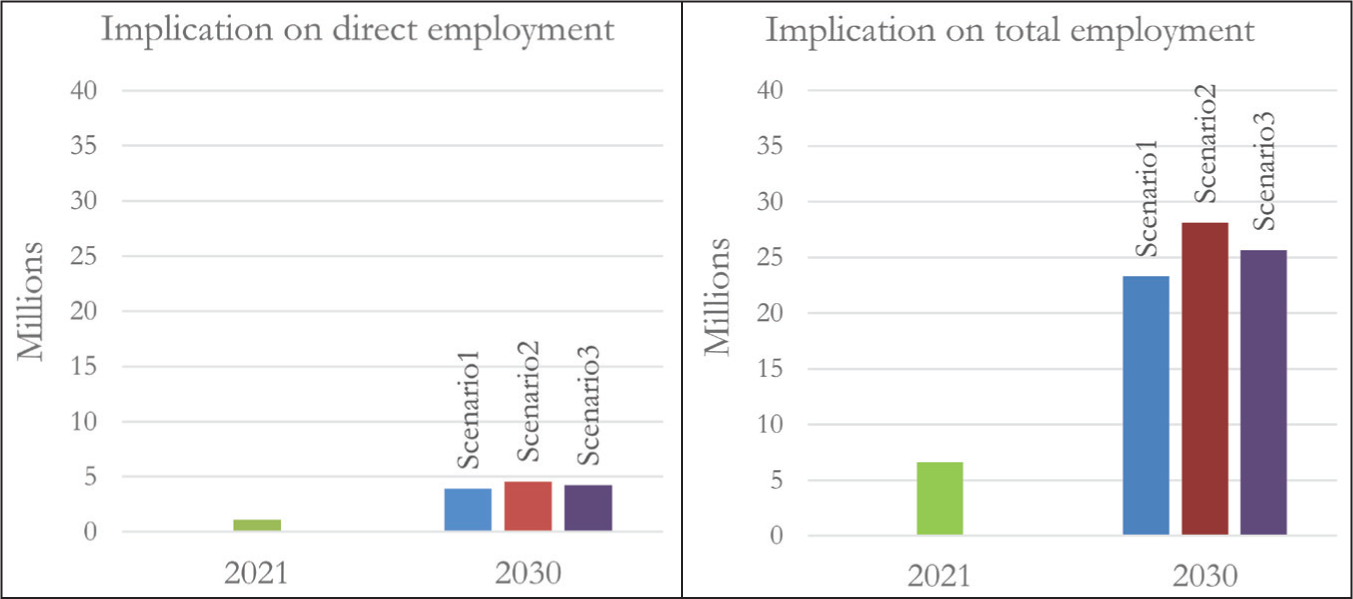
The energy sector is linked with other sectors of the economy through forward and backward linkage, which is captured by the SAM in our study. So, the impact of employment generation through environmental policy interventions is not limited to the energy sector alone. It generates employment in the sectors which provide input to the electricity generation sector and generates employment in all sectors through the income effect that it generates in the process. Capturing these two effects, other than direct employment generation, we can see that the energy sector, in total, provided employment to 6.6 million people in India in 2021. With the present composition of electricity generation, under scenario 1, the energy sector would provide employment to a total of 23.3 million people, directly or indirectly, by 2030. Under both scenarios 1 and 2, employment generation is higher as compared to scenario 1 in 2030. Under scenario 2, 28.1 million of total employment, and under scenario 3, 25.7 million of total employment are provided through the interlinkage of other sectors with the energy sector. This shows that India’s emphasis on the renewable energy sector would not only be beneficial for employment generation in the energy sector, but it also generates employment in other sectors too.
4. Concluding Remarks
SAM as a policy tool has wide applications for macroeconomic analysis, and thus, the matrix is generated and utilised for designing policies in many countries. SAMs of the Indian economy, generated so far, are mostly based on IOT in the past. The Government of India currently publishes SUT instead of IOT. This article provides a detailed narrative of the methodology of construction of IOT, and, subsequently construction of a SAM, which is not lucidly covered in the literature. Both the tables, which capture structural aspects of the economy, can be utilised for several environmental policy–related research. Capturing the methodological nuisances using a large set of databases for India and highlighting the usefulness of such a framework in energy and environmental policy analysis have been the two motivating factors for the research.
The SAM highlights the income distribution across the occupational classes, which has an important role as an information system. The SAM not only talks about the structure of the economy, it also indicates the spending pattern of the households across rural and urban income decile groups.
SAM multiplier provides a useful tool to understand the different linkages in the economy. Our analysis indicates that the labour demand multiplier is higher for the agriculture and services sector, but the magnitudes differ because agriculture still absorbs a majority of the unskilled labour force. Nonetheless, these two sectors will play a key role in employment generation for the Indian economy. This is of particular importance since inclusive growth is the focus of the policy-makers at present.
To illustrate the use of SAM, we have also assessed the impact of India’s environmental policy initiatives in the context of employment generation. Our results show that India’s policy emphasis on greater reliance on renewable energy sources for power generation would not only generate jobs in the electricity generation sector but also would increase overall employment as compared to the present composition of electricity generation sources.
Although SAM has significantly extended the multi-sectoral framework of the IOT, it still falls short in representing elements such as pollutants, environmental quality, natural resources and their interactions with economic activities. In the future, we wish to work along this line.
Footnotes
Notes
Declaration of Conflicting Interests
The authors declared no potential conflicts of interest with respect to the research, authorship and/or publication of this article.
Funding
The authors received no financial support for the research, authorship and/or publication of this article.
Appendix
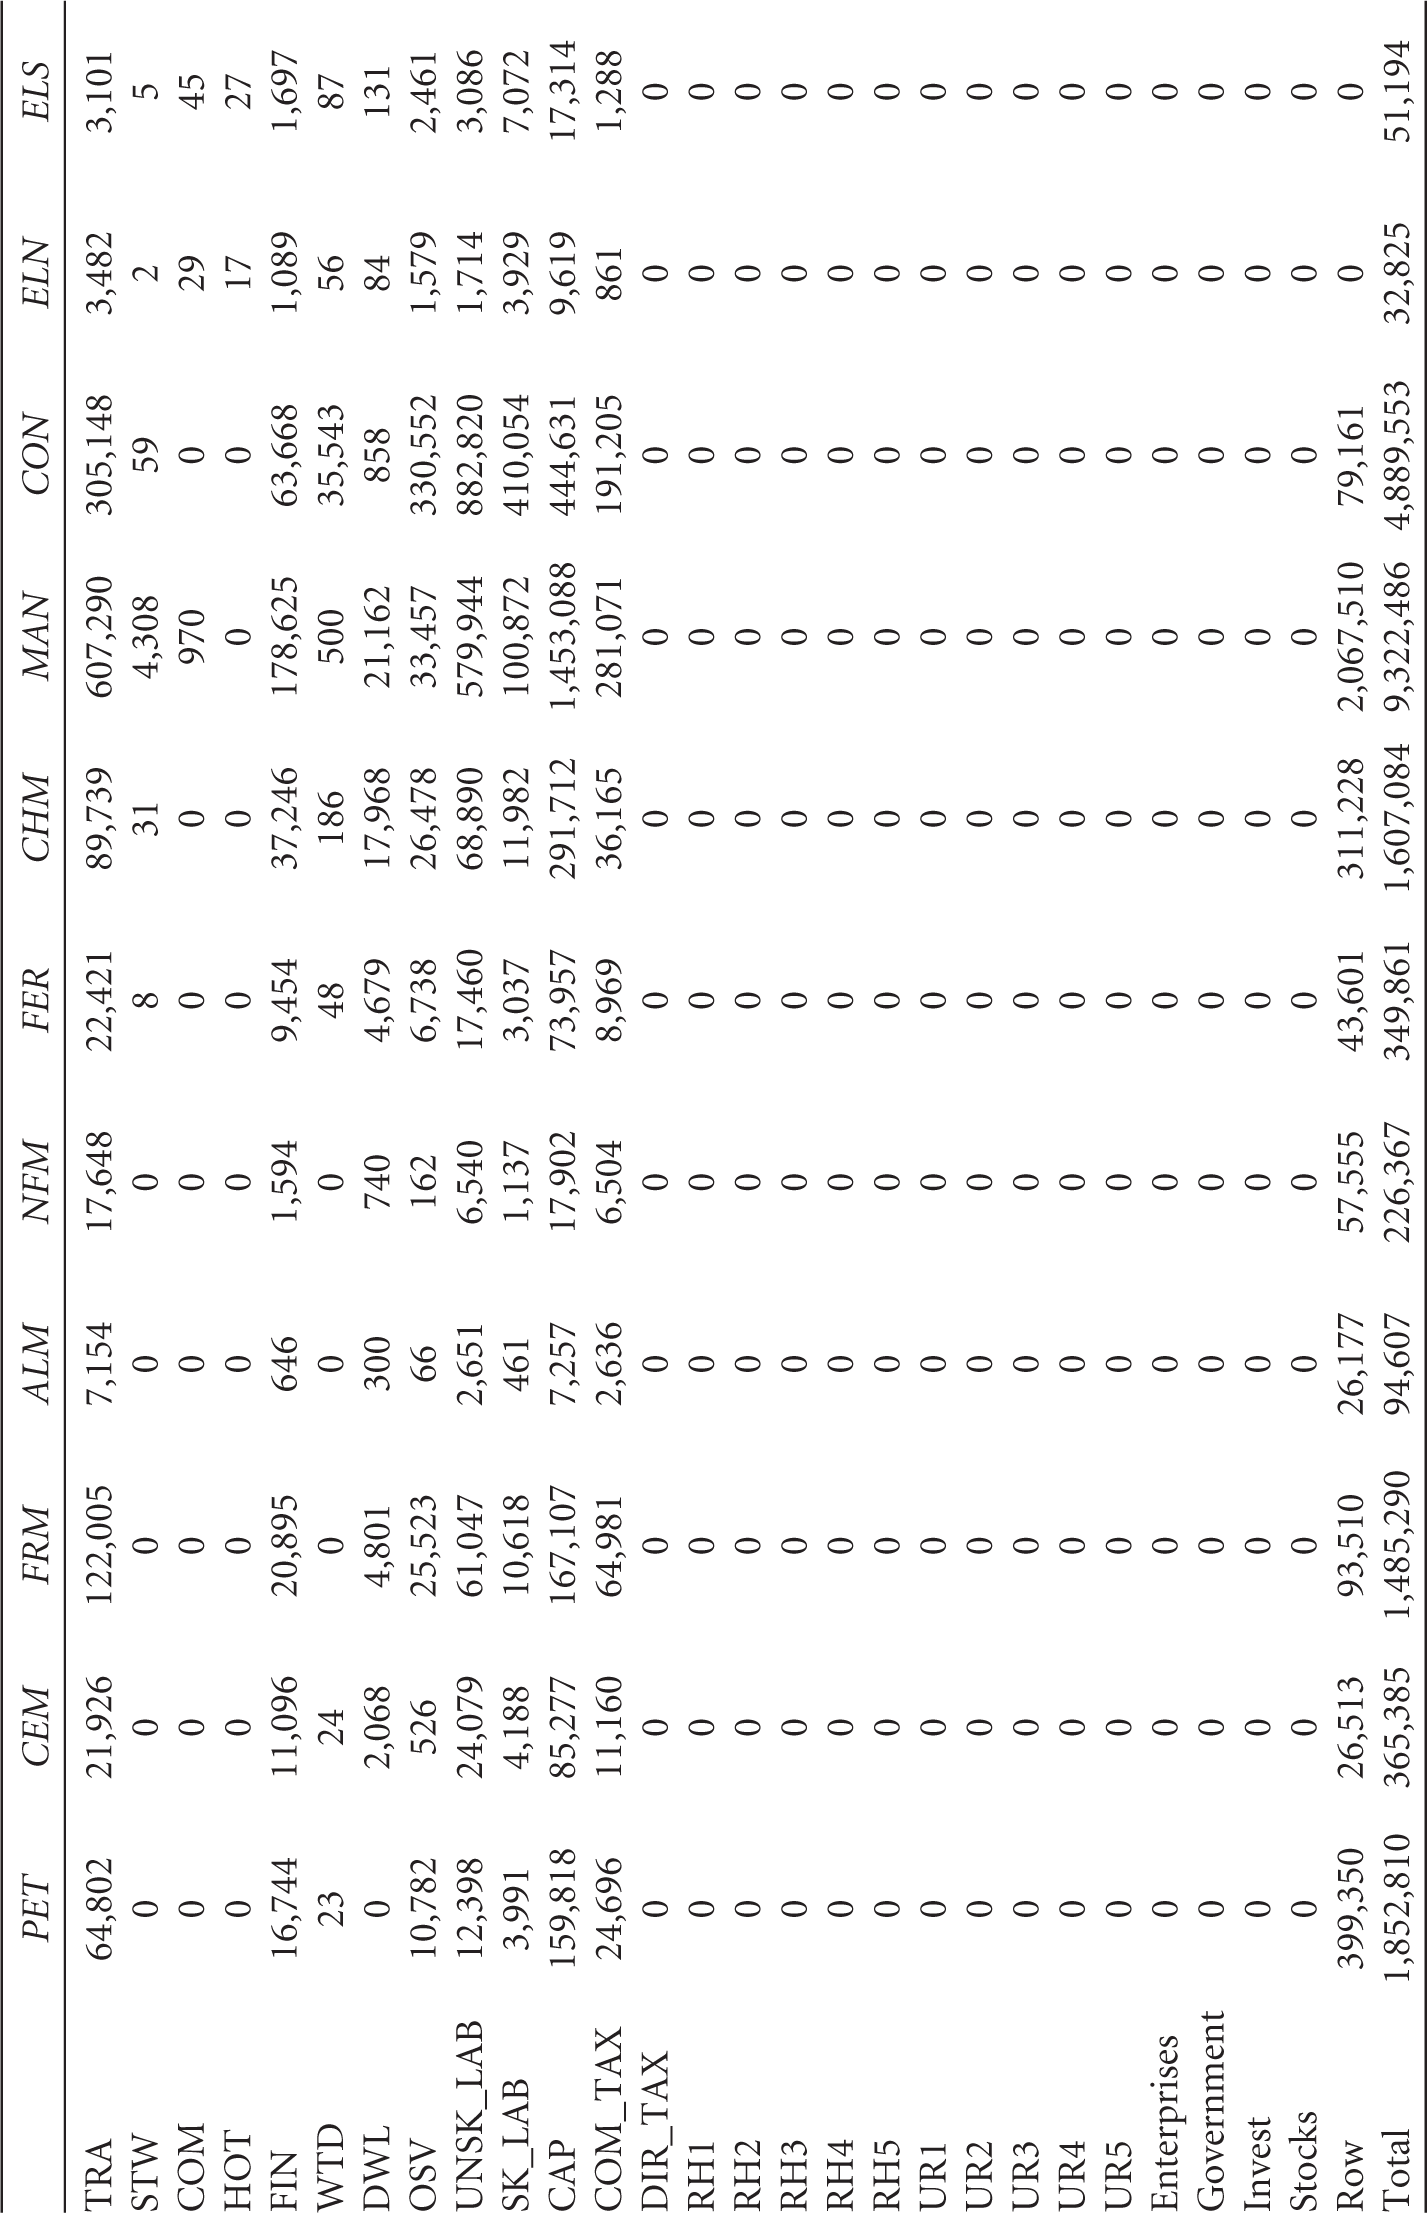
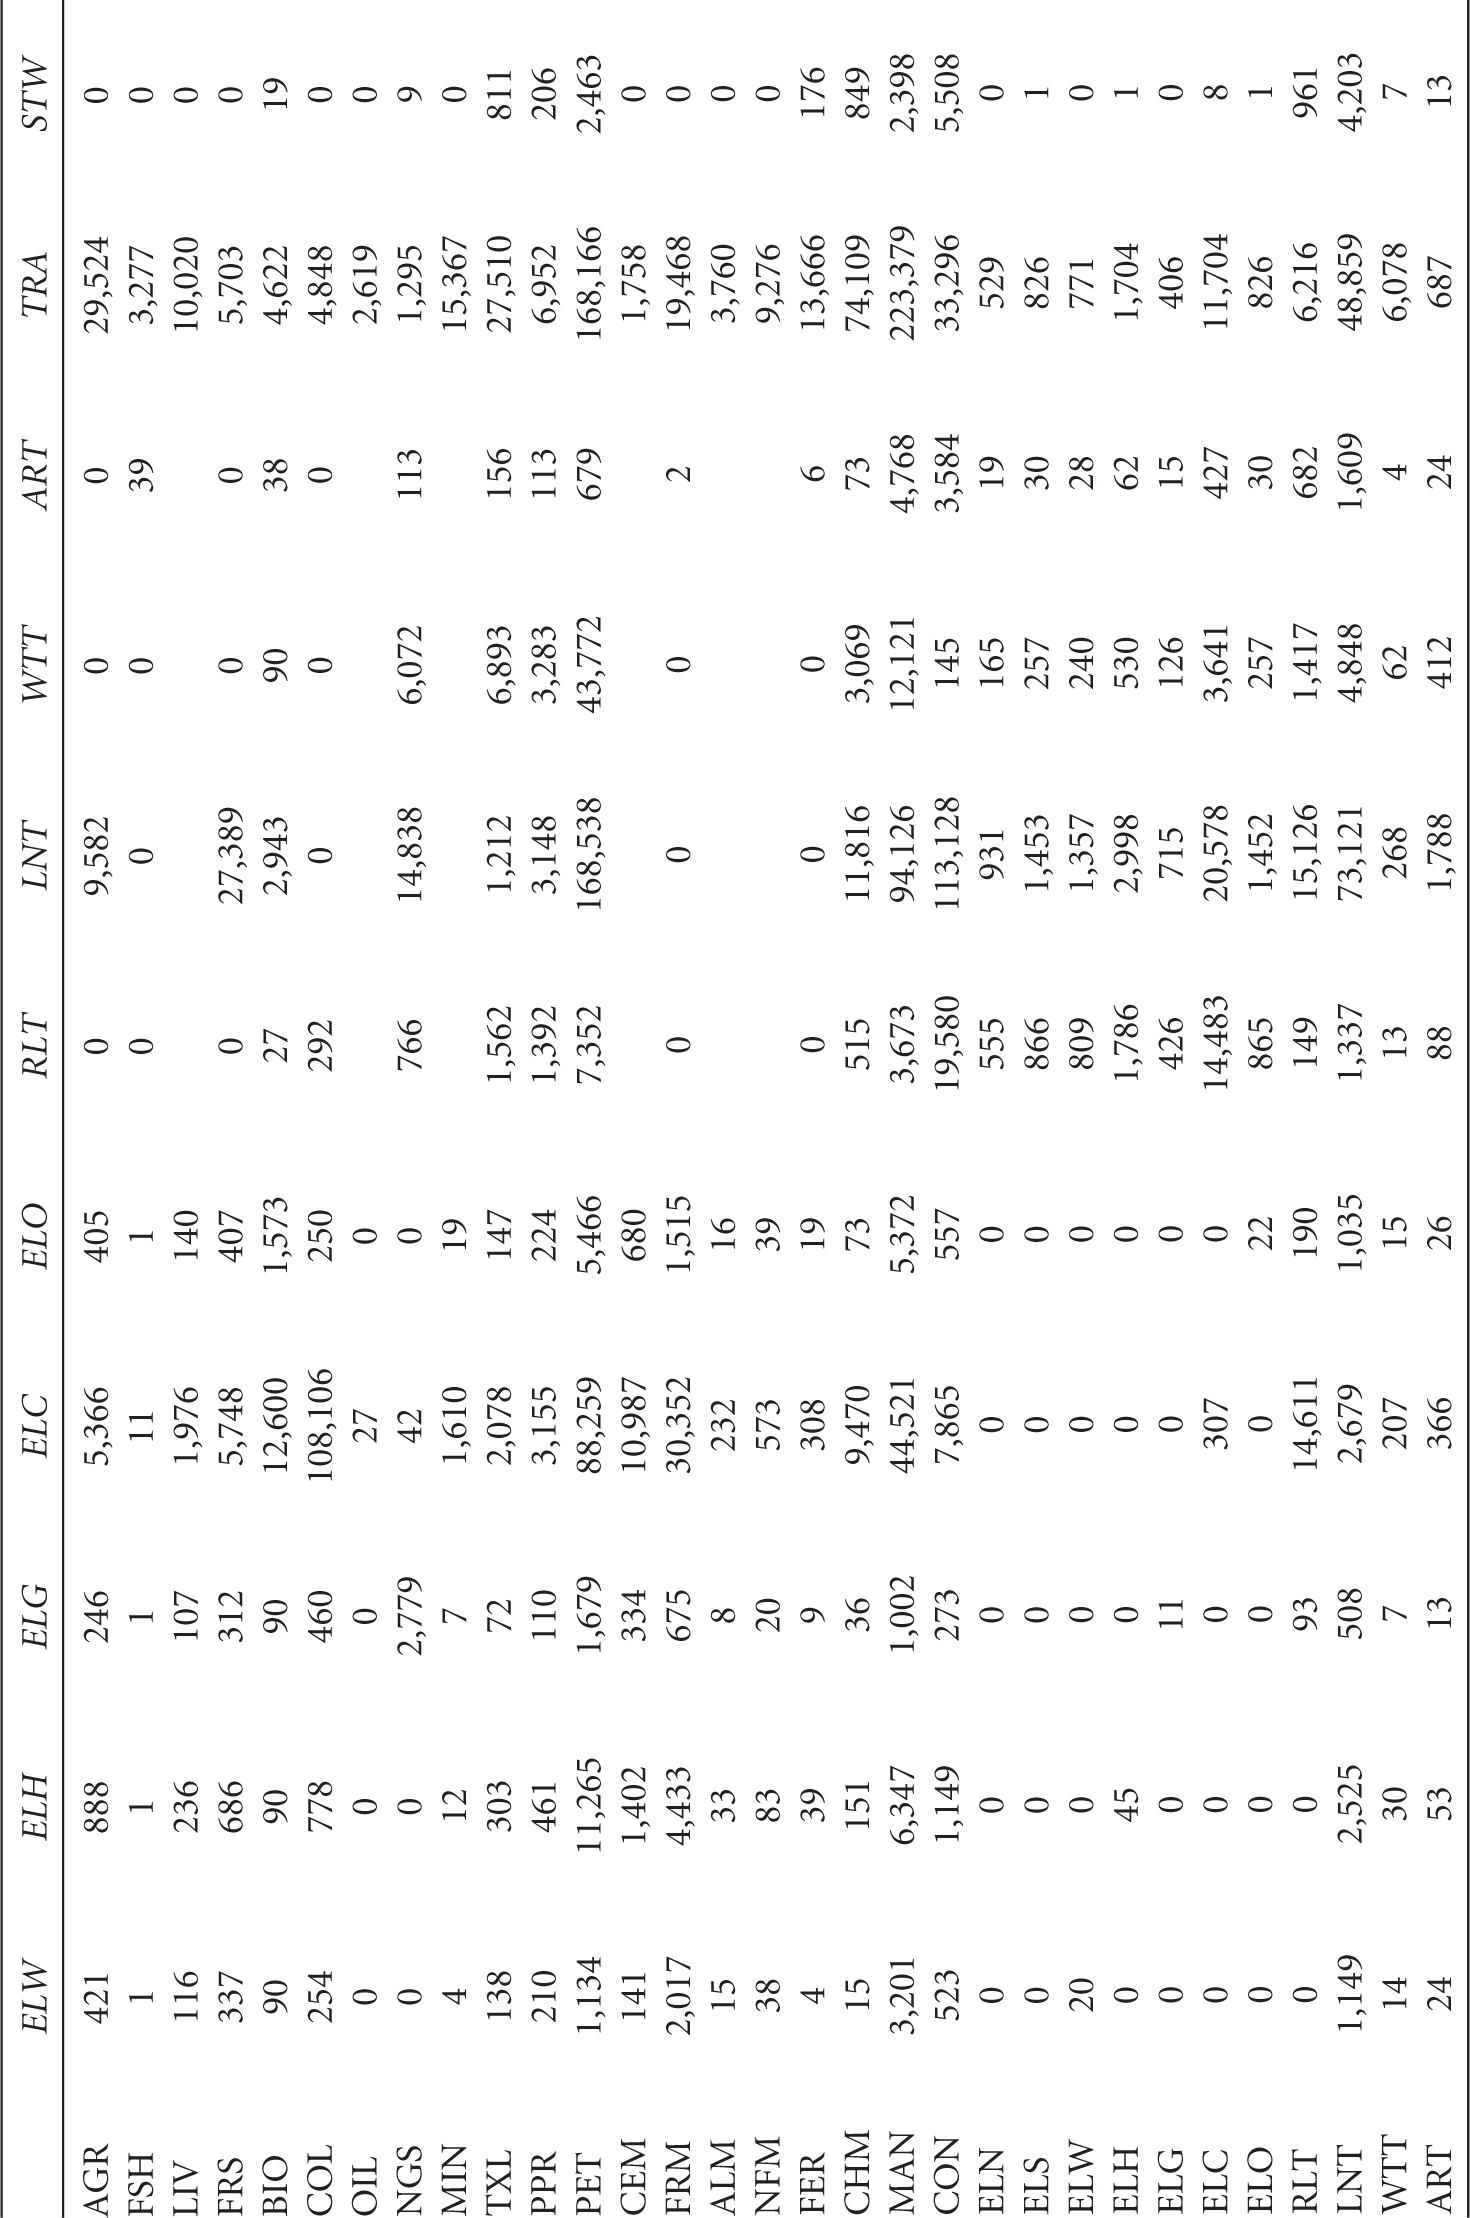
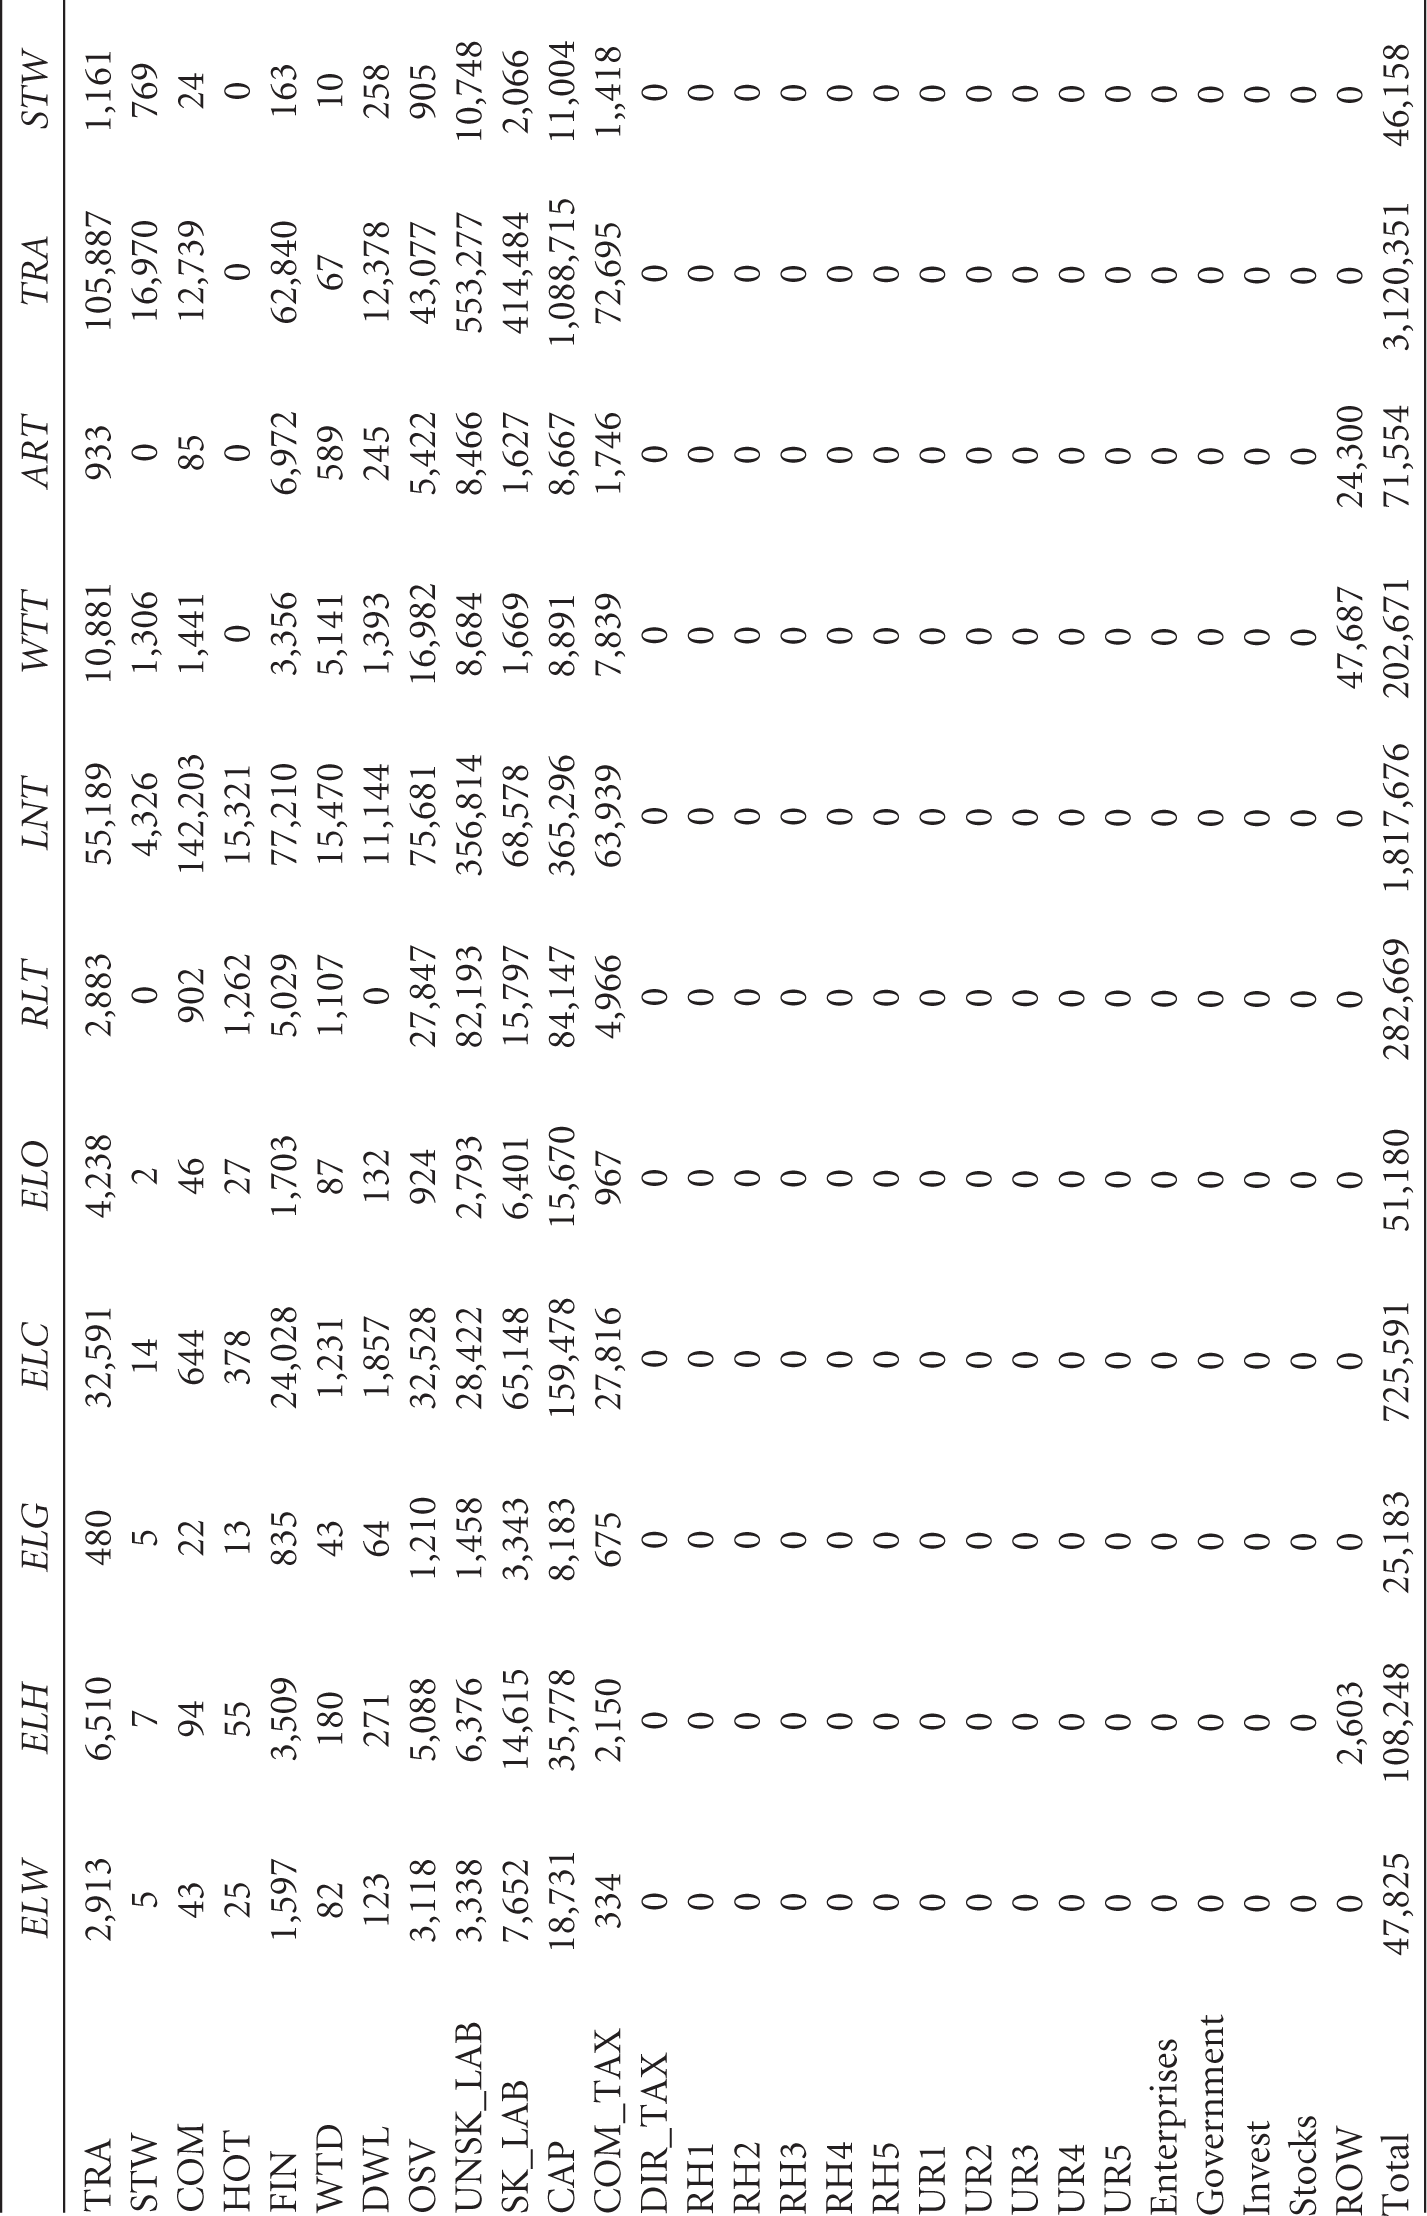
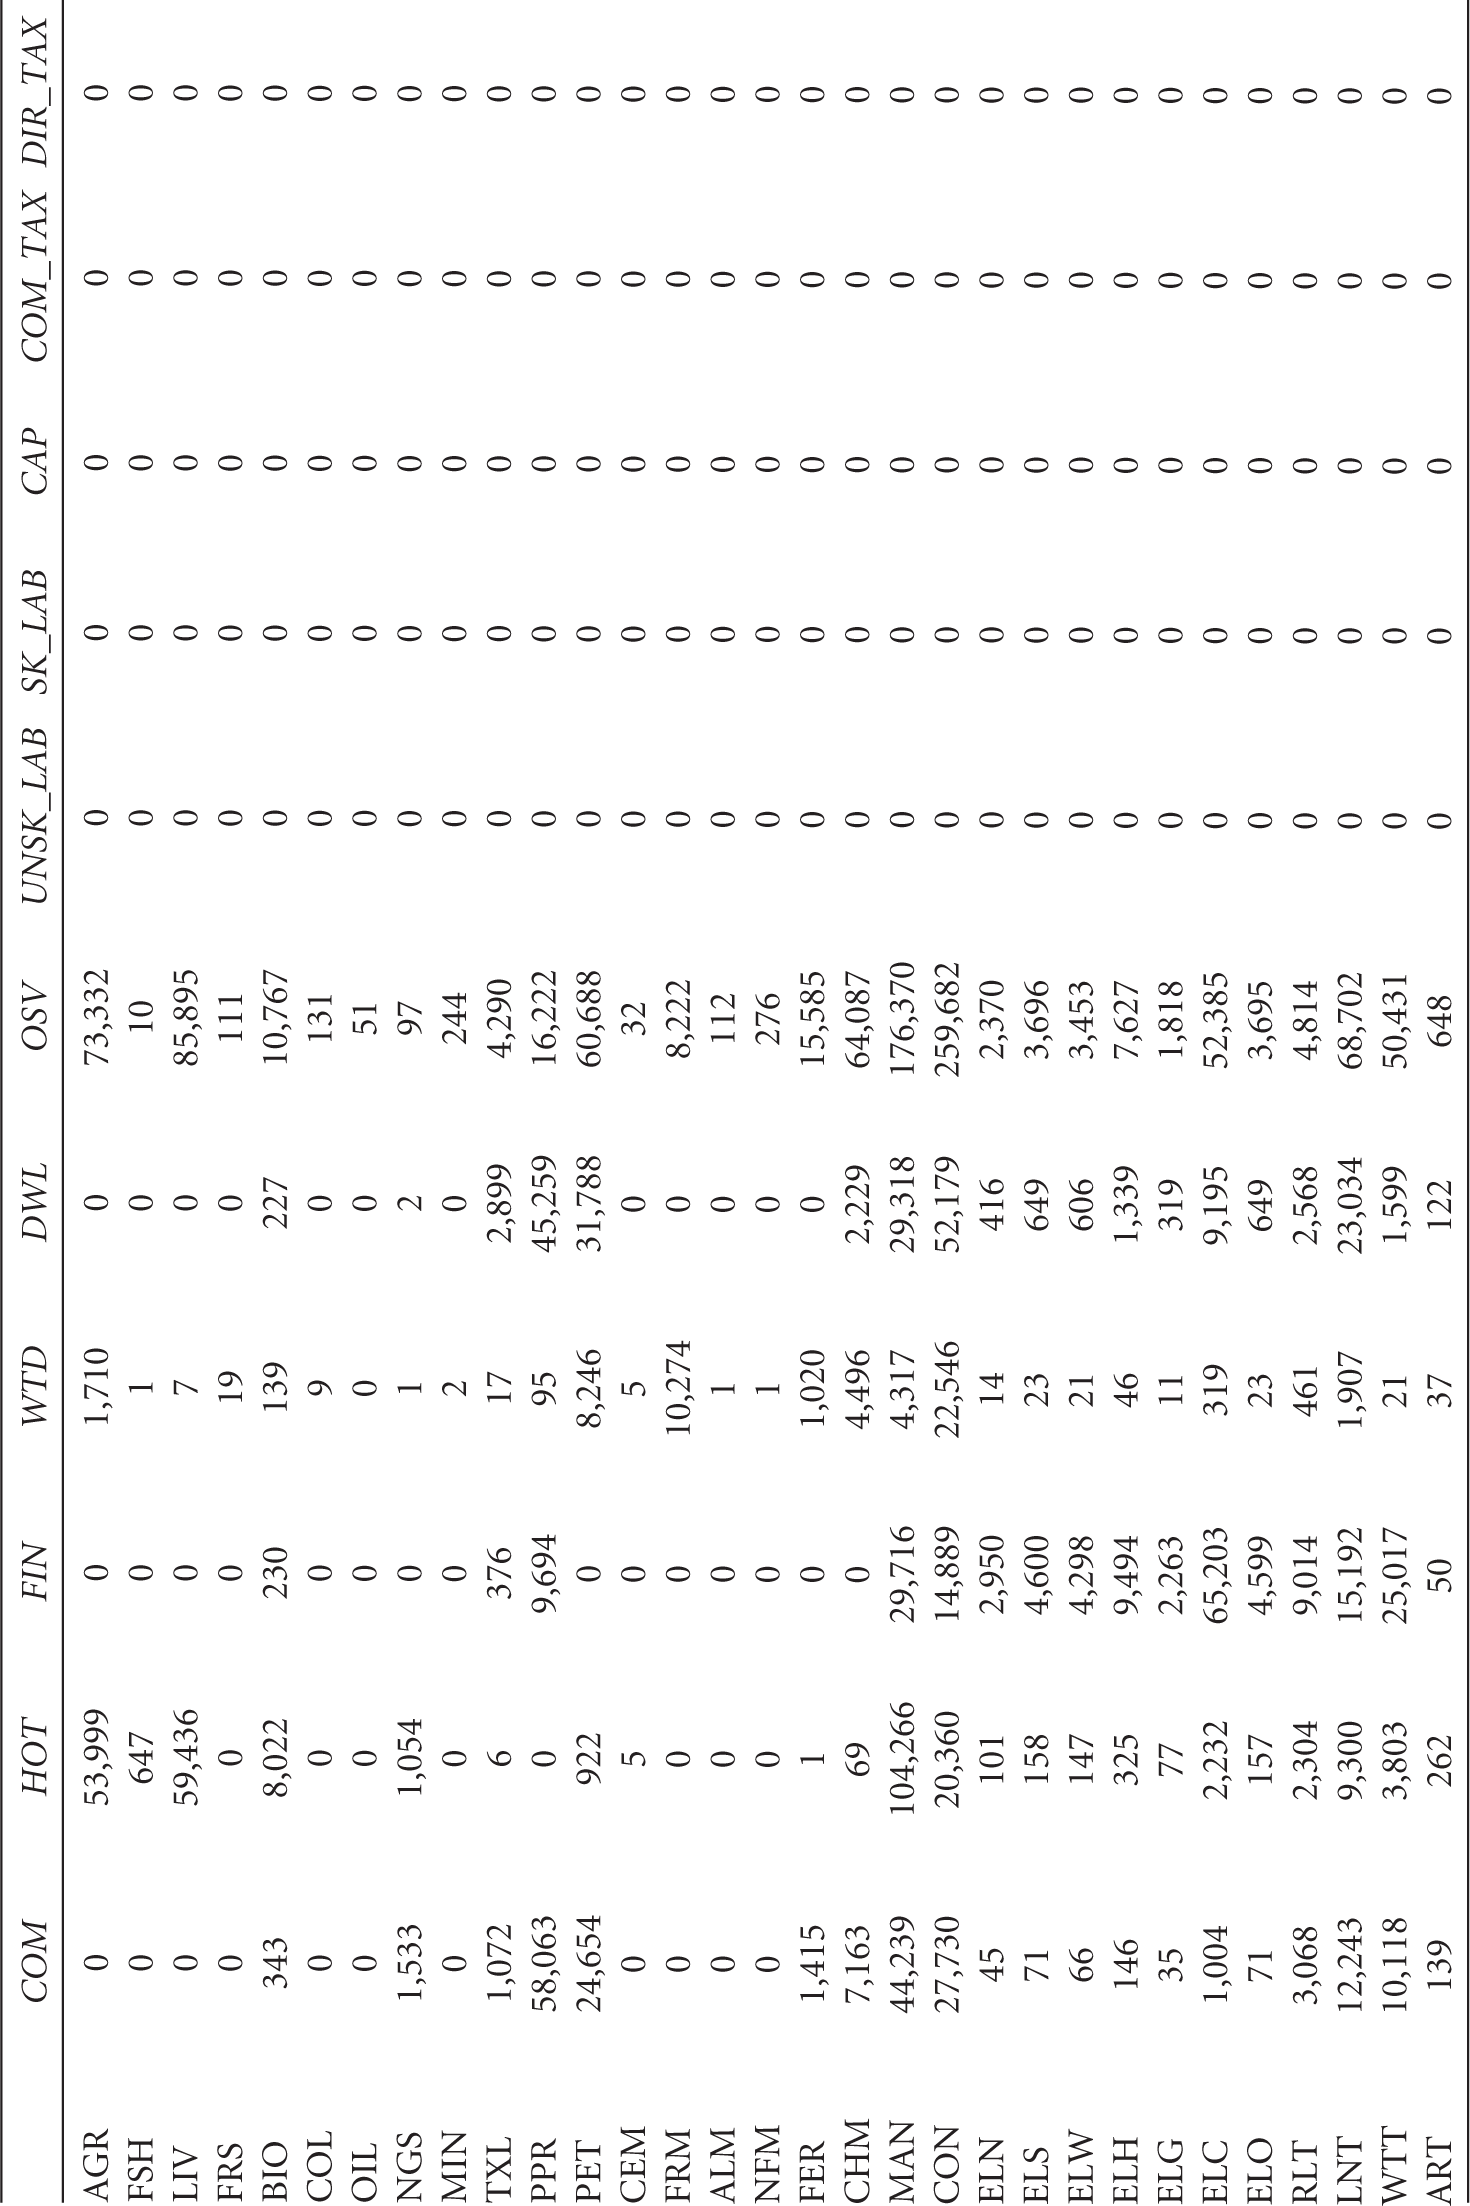
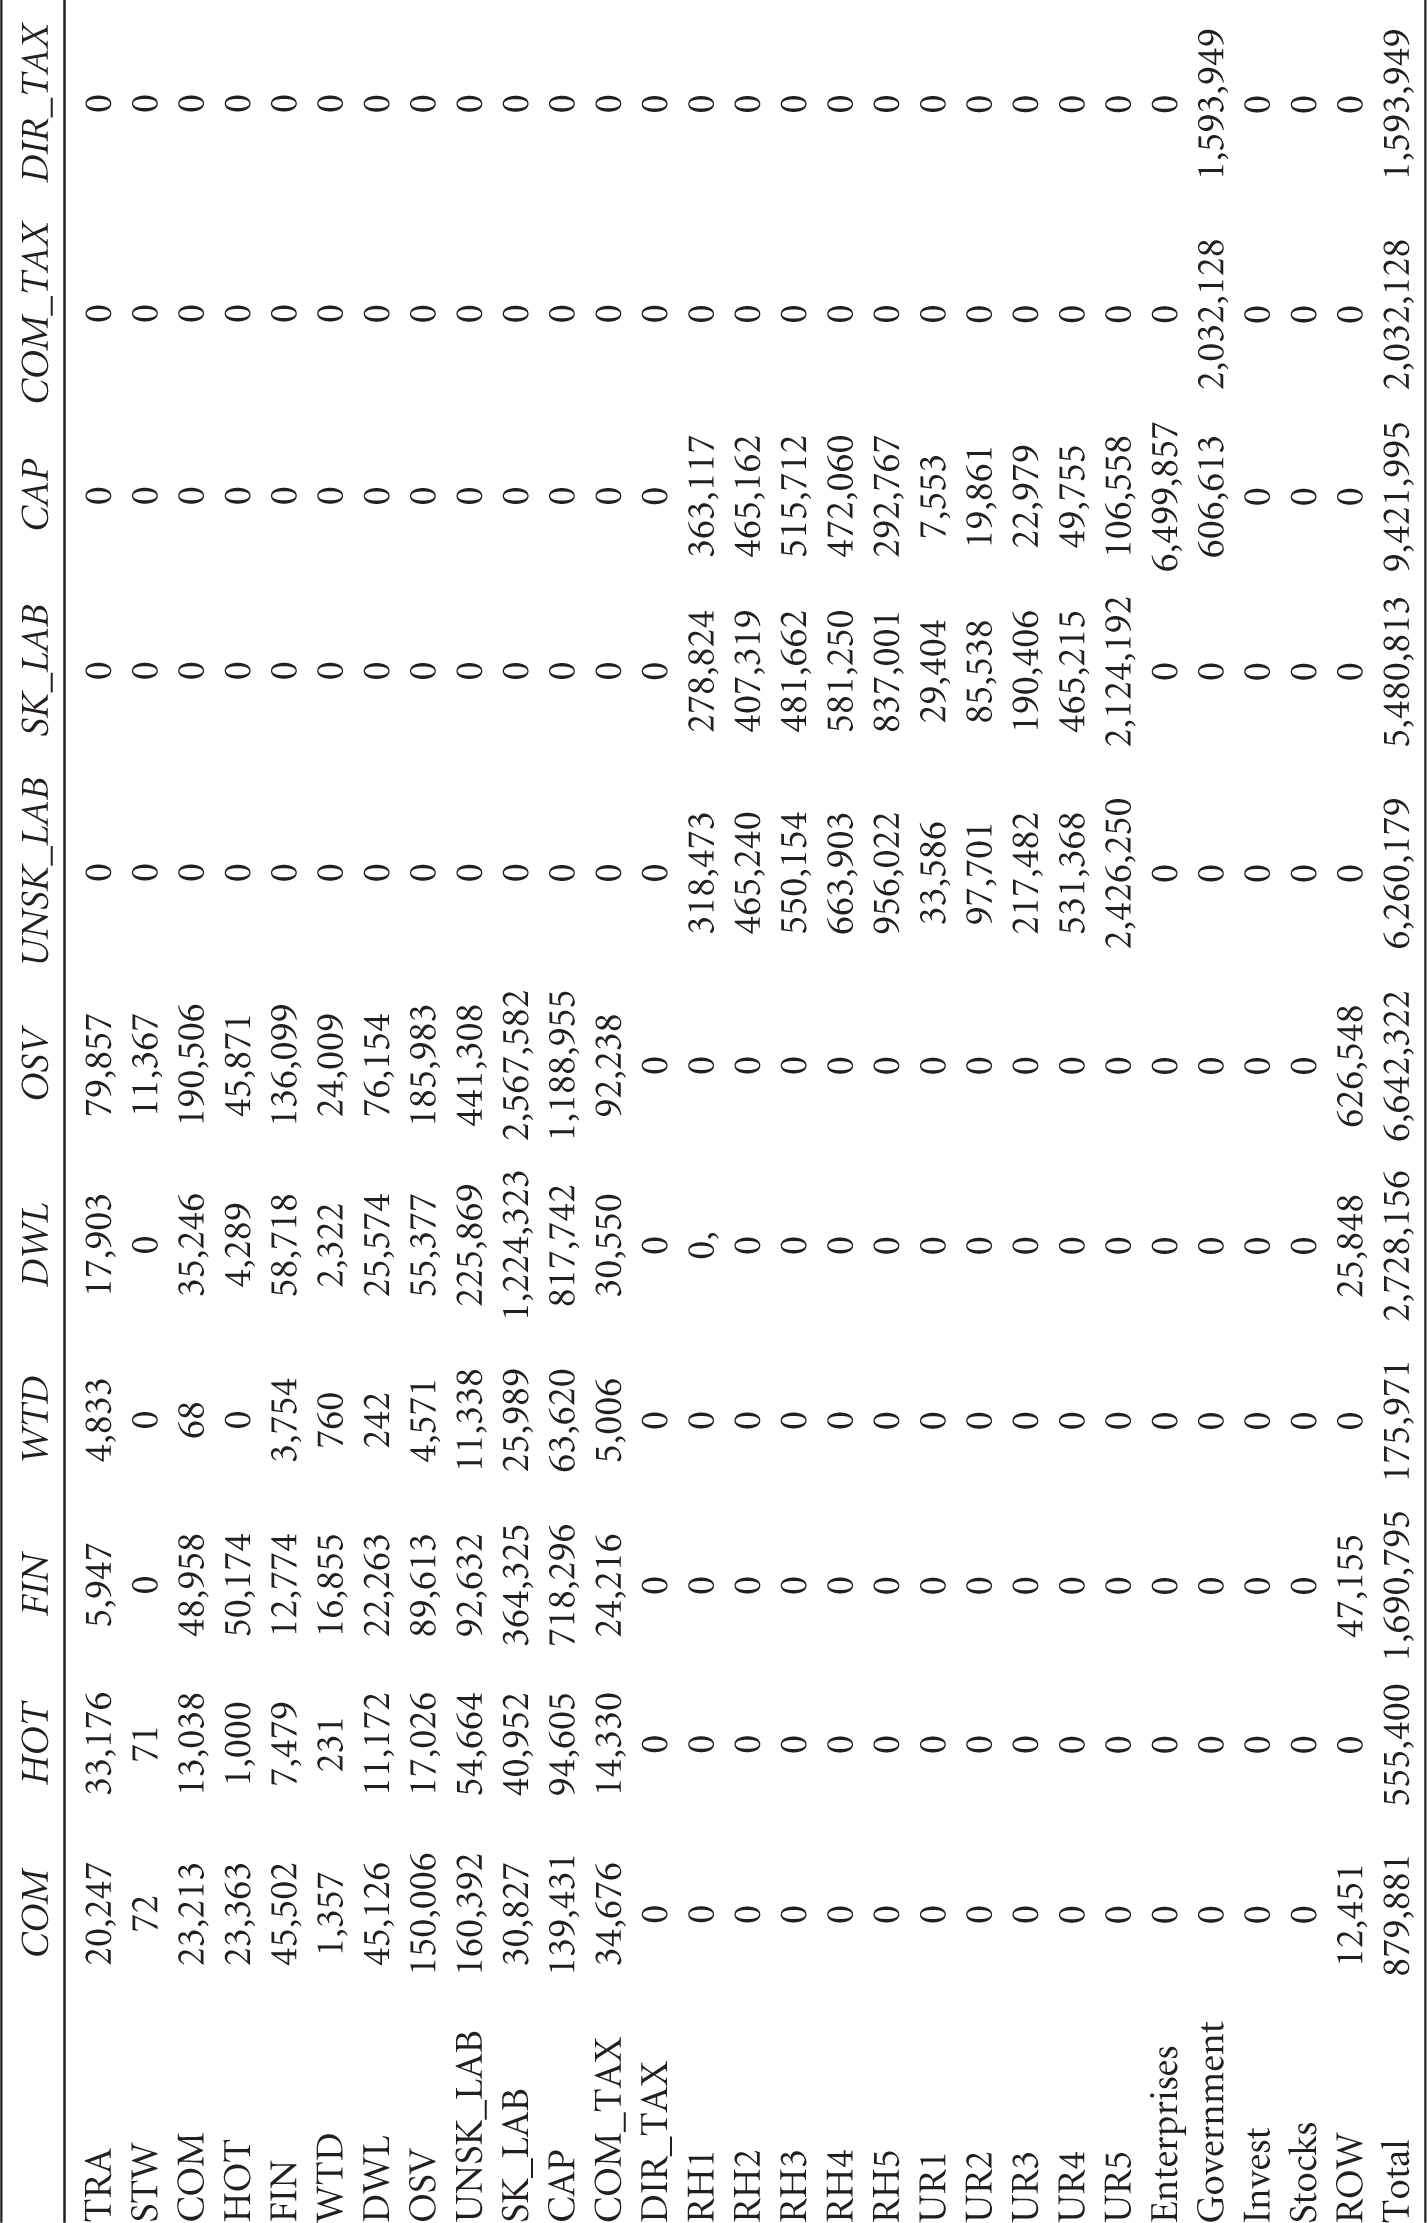
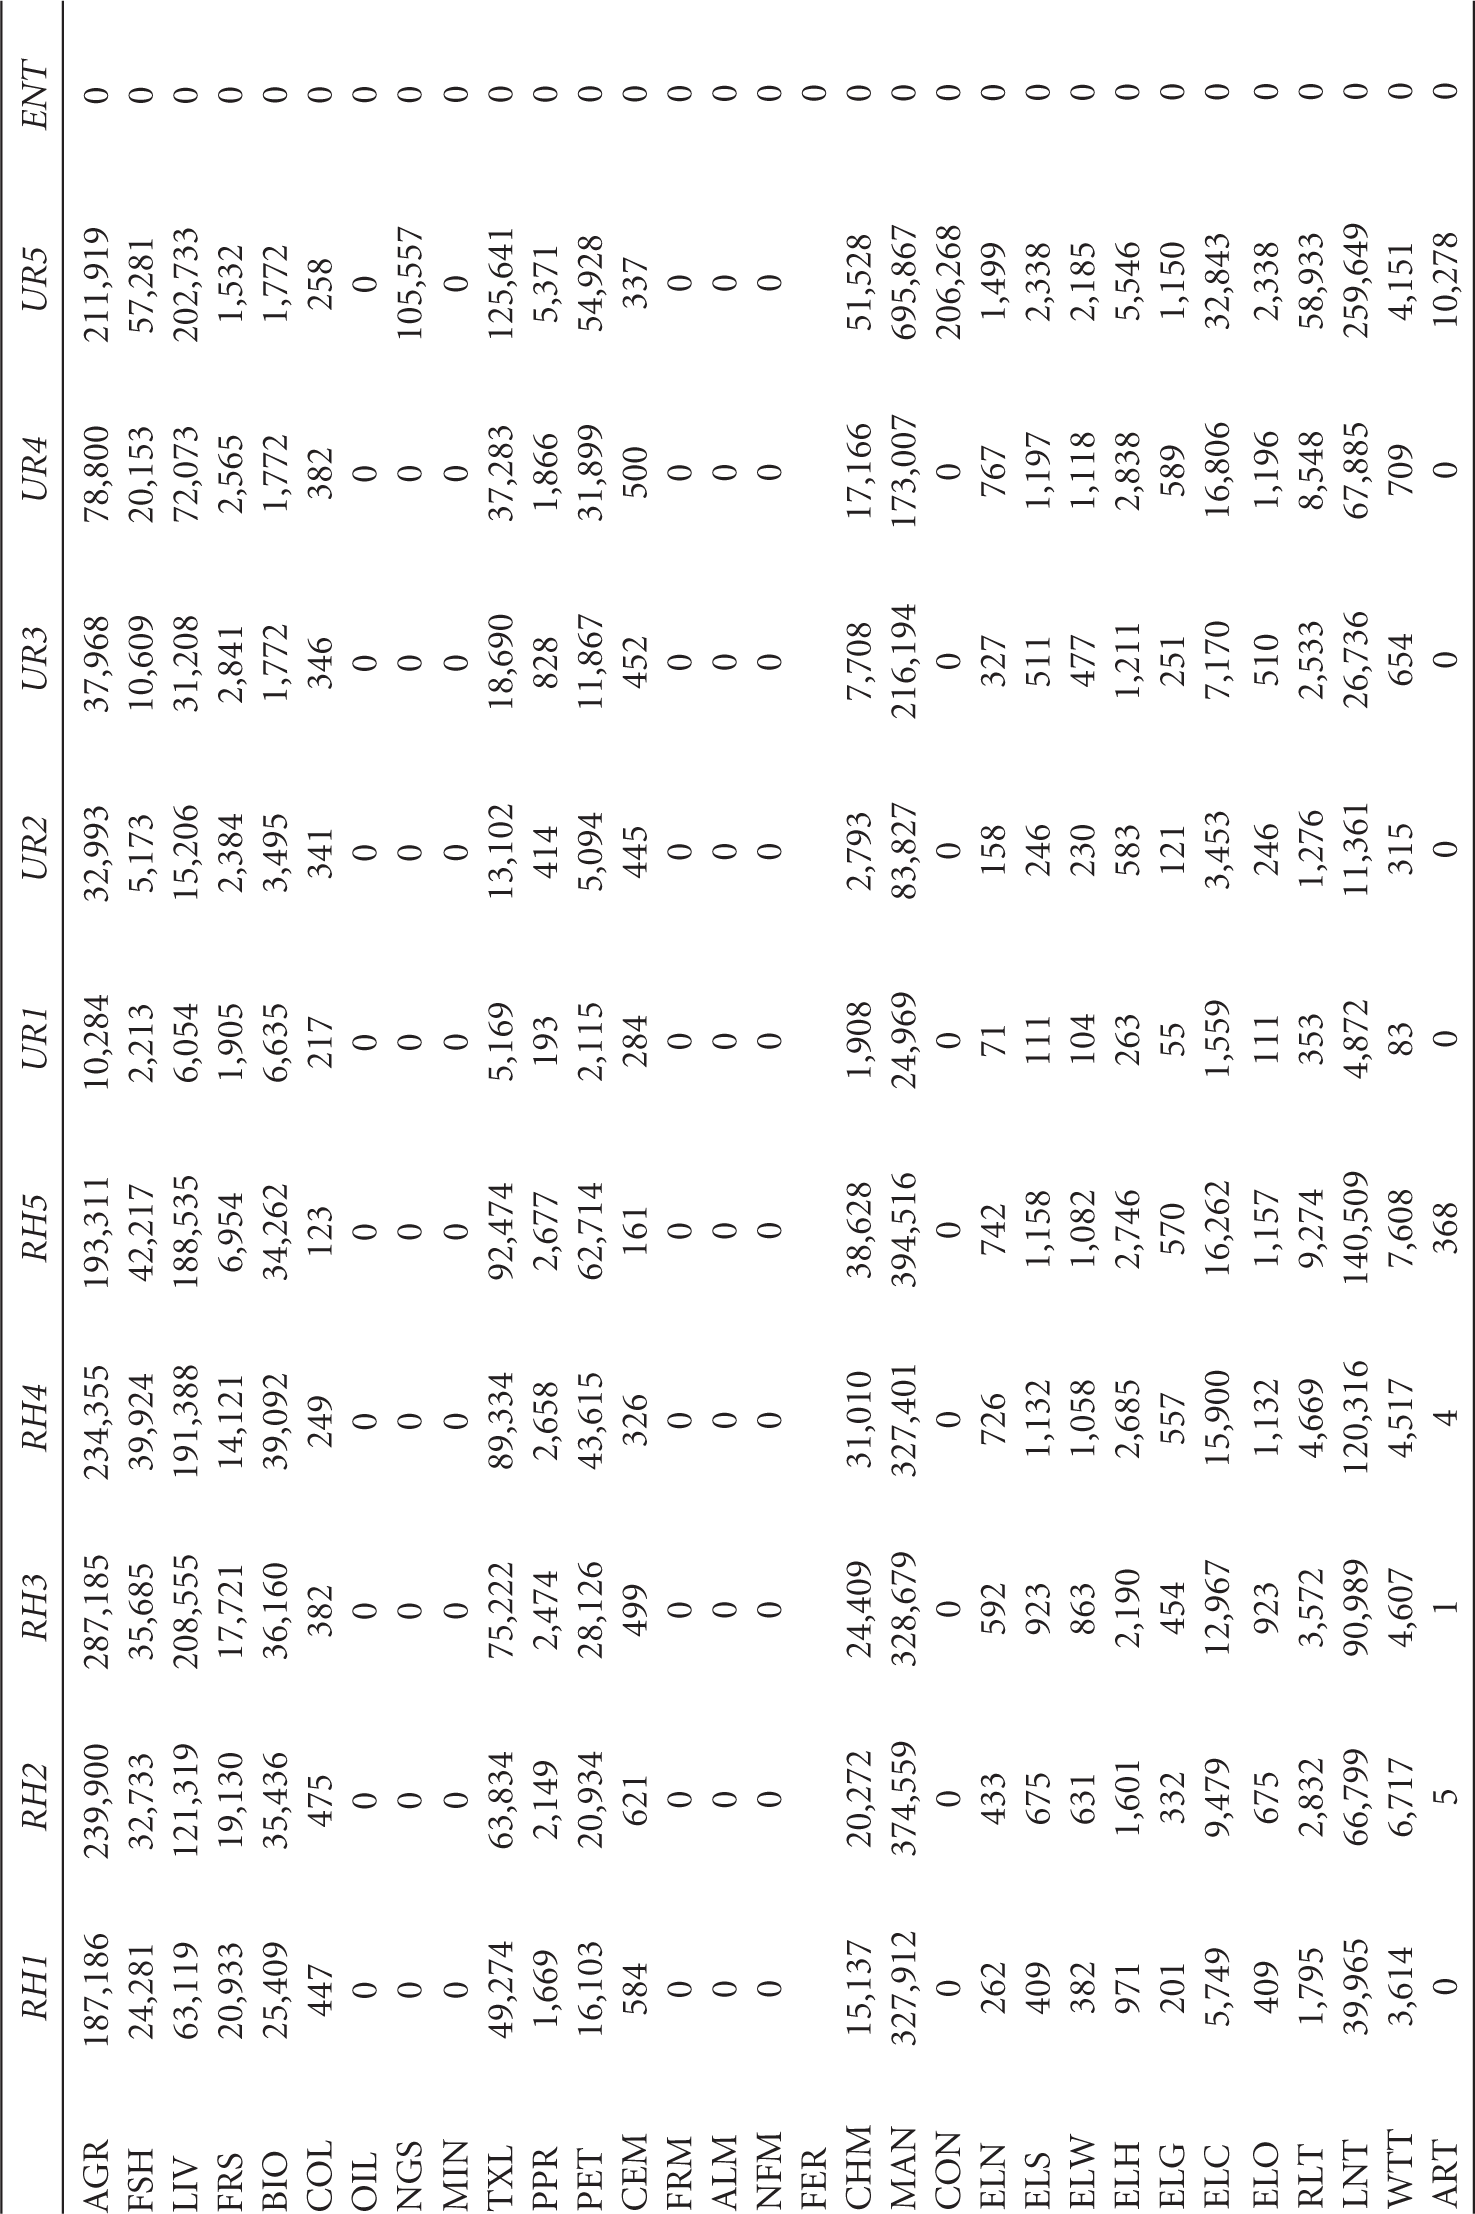
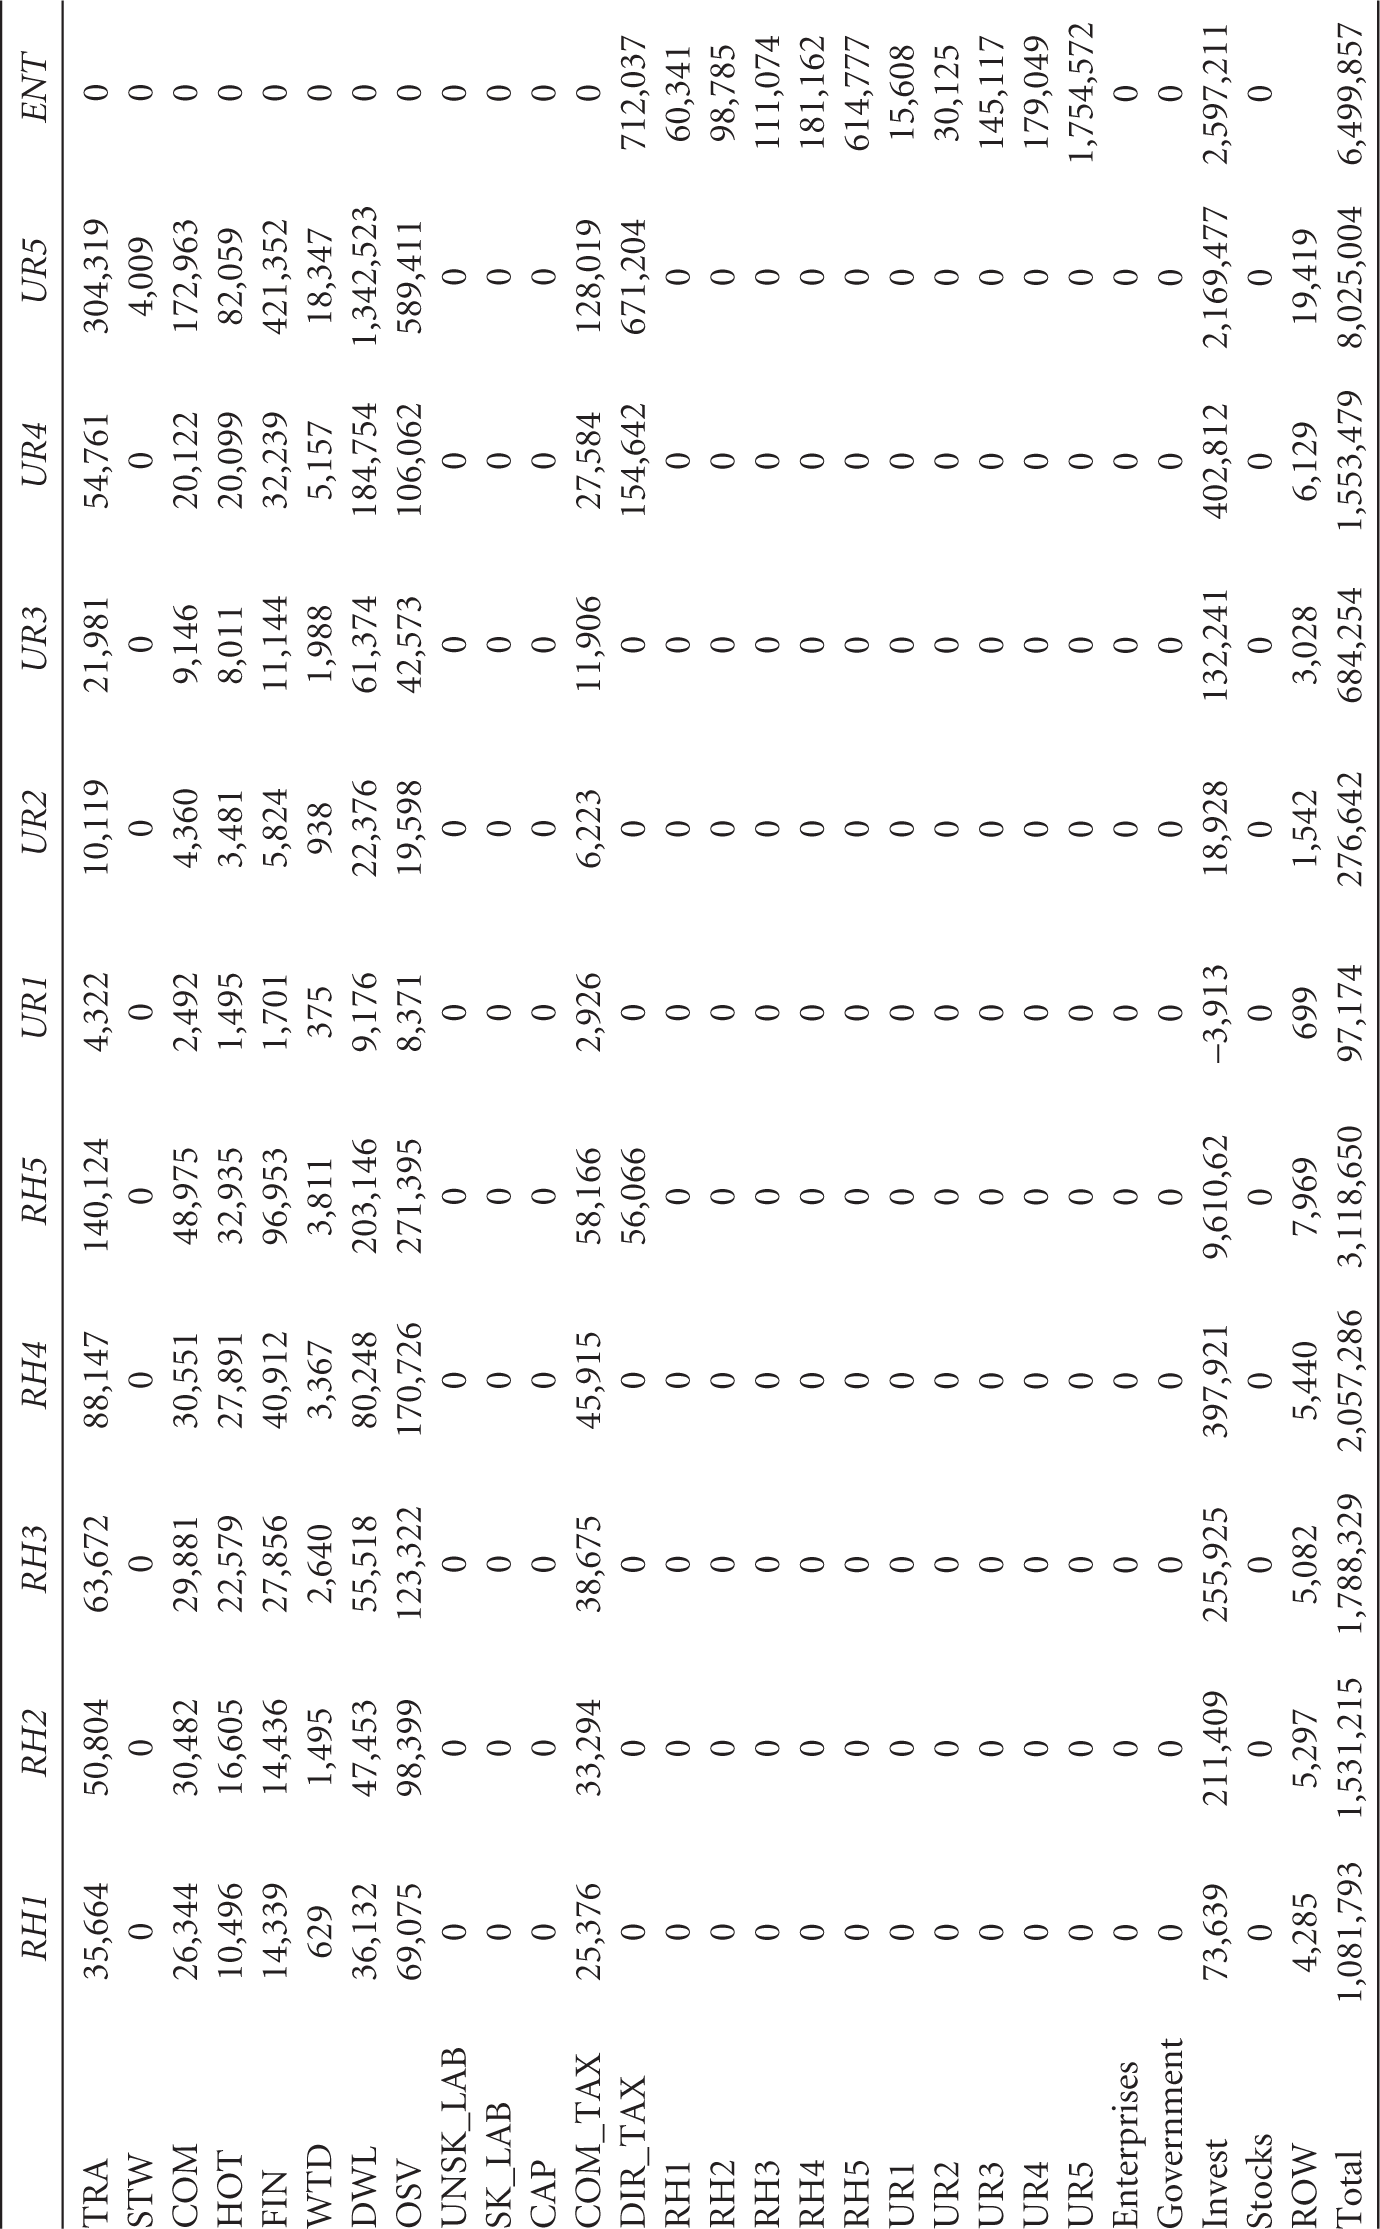
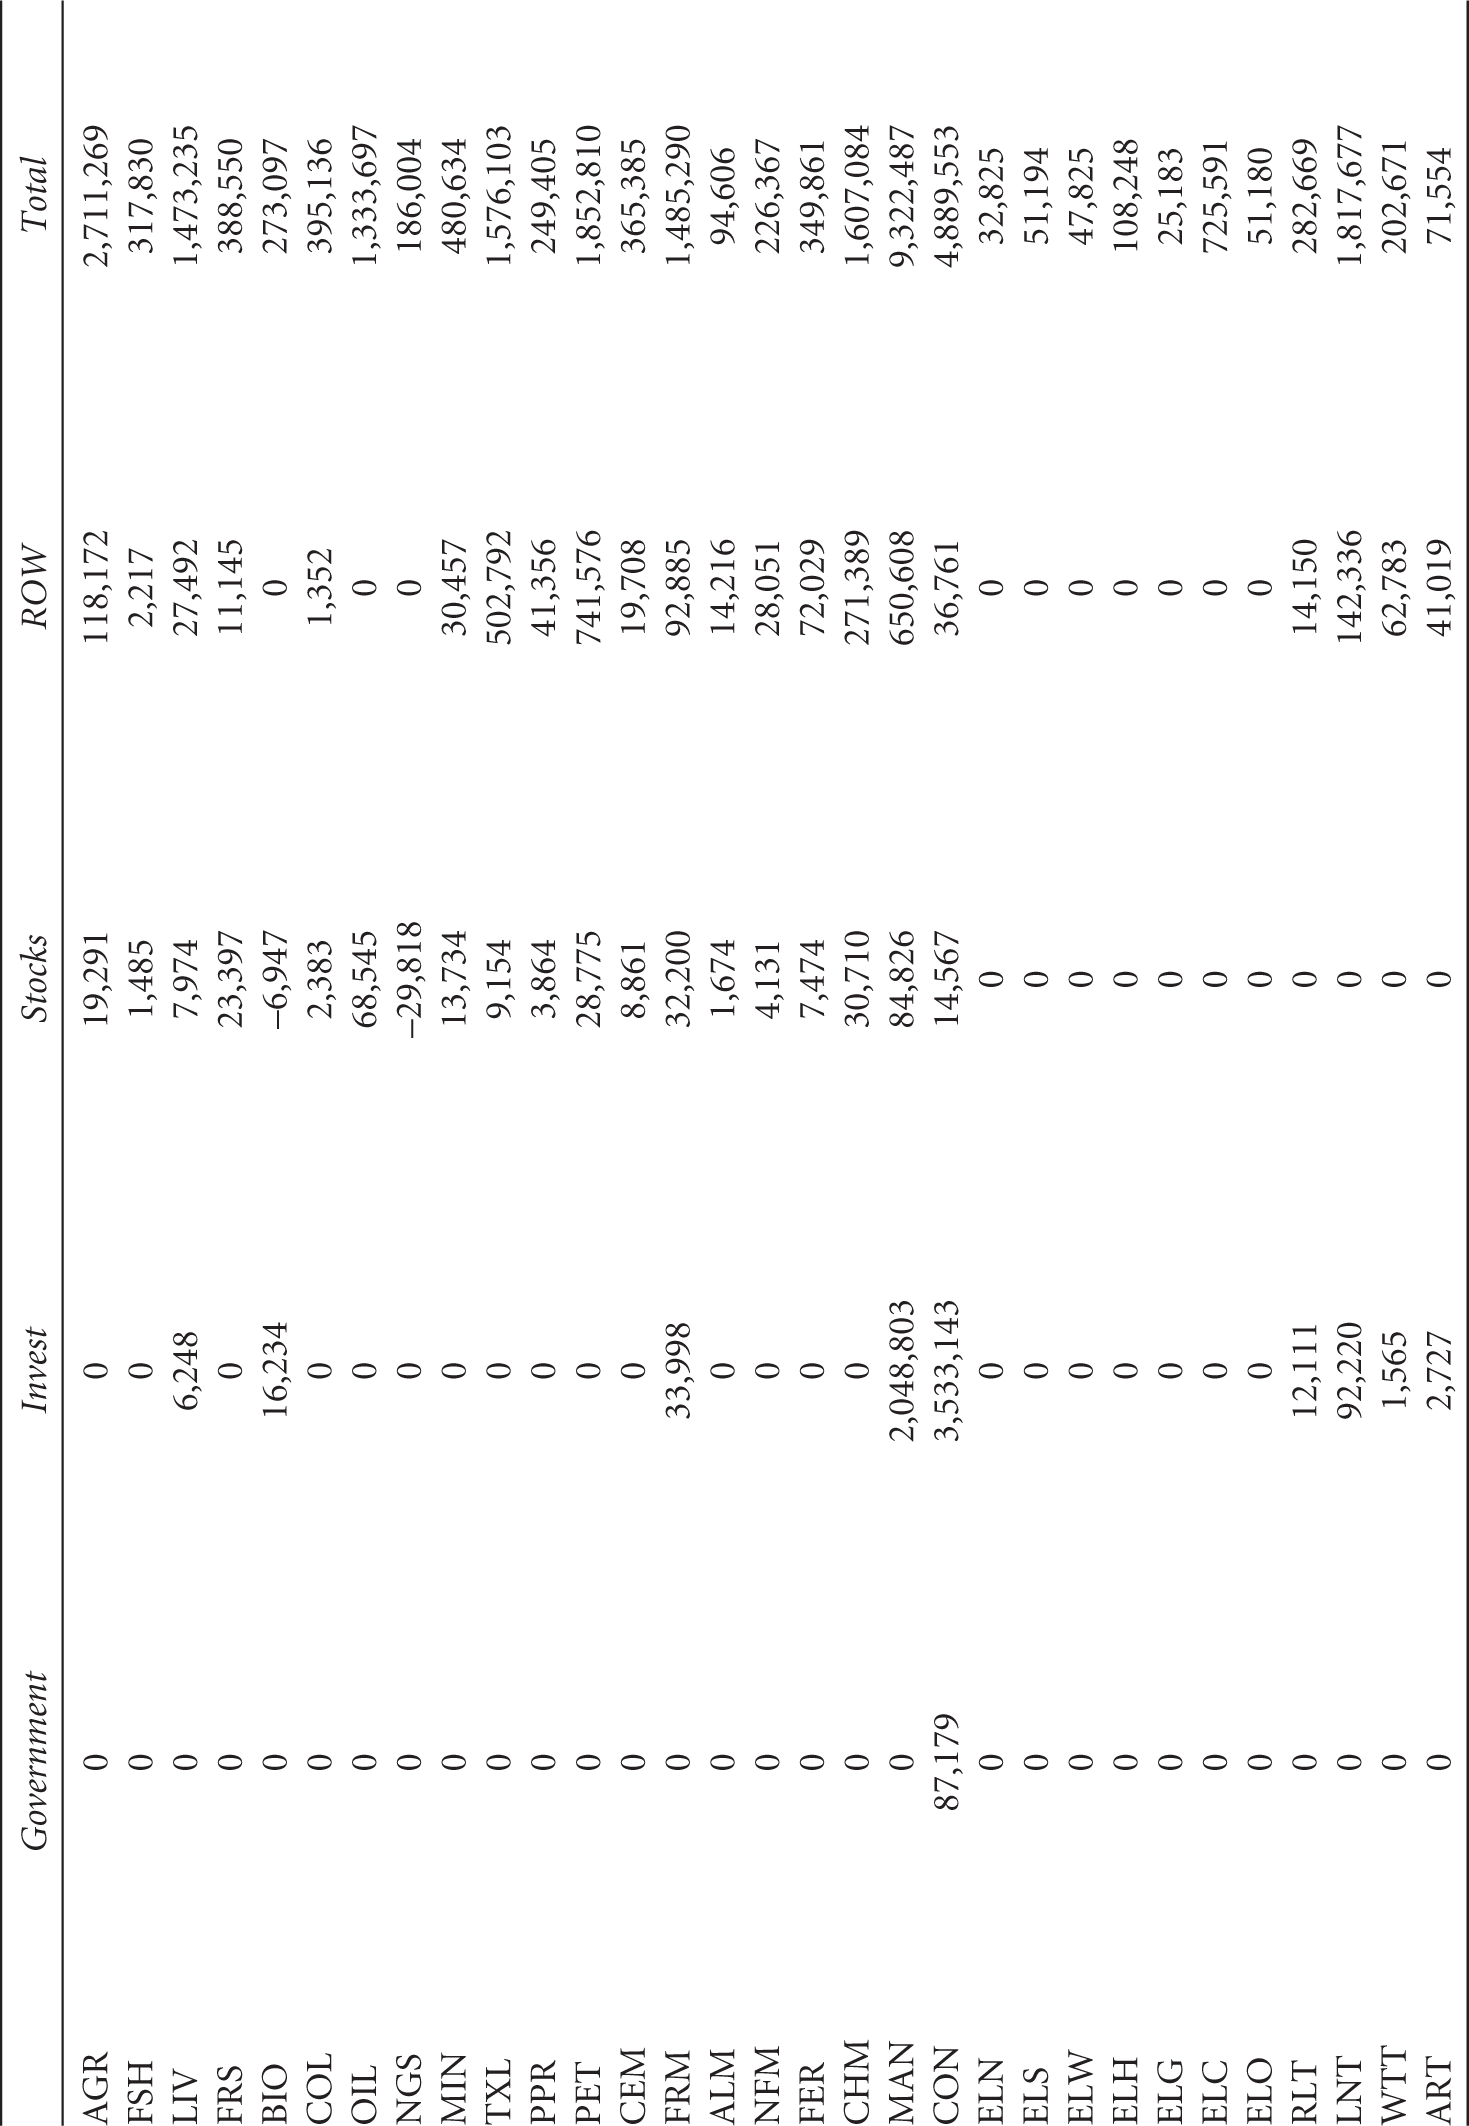
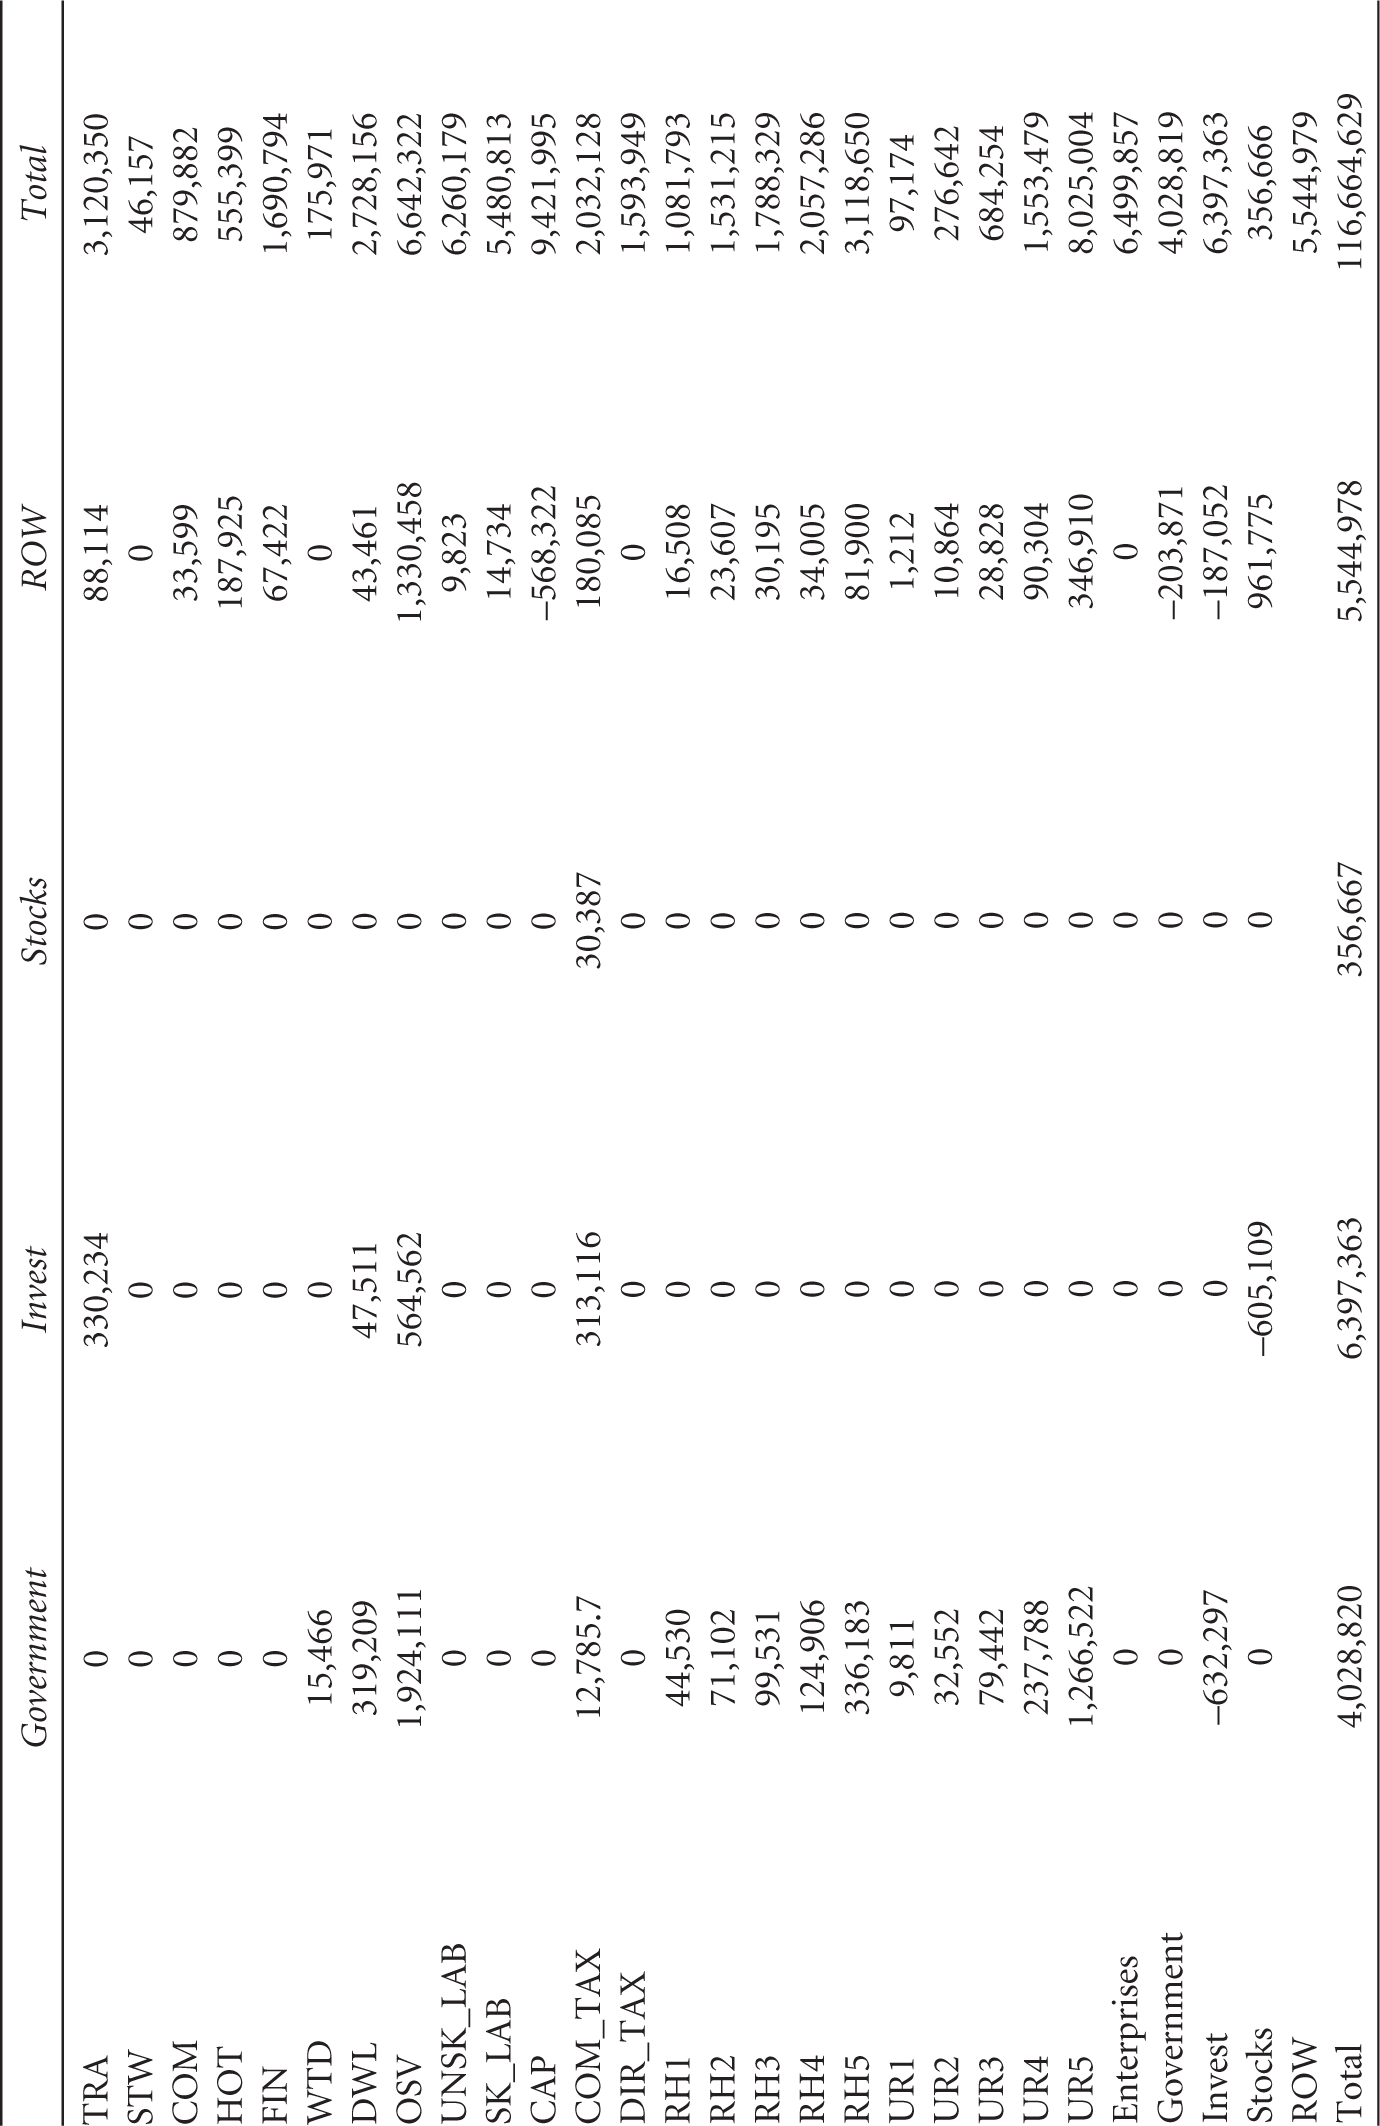
The SAM of India: 2021–2022 (Unit ₹ Crore)
| AGR | FSH | LIV | FRS | BIO | COL | OIL | NGS | MIN | TXL | PPR | |
| AGR | 78,508 | 104 | 186,889 | 0 | 18,973 | 1 | 0 | 1 | 936 | 64,006 | 699 |
| FSH | 0 | 4,989 | 0 | 0 | 621 | 0 | 0 | 0 | 0 | 2 | 0 |
| LIV | 0 | 10,552 | 9,780 | 0 | 2,688 | 0 | 0 | 0 | 45 | 3,054 | 0 |
| FRS | 0 | 0 | 18,163 | 626 | 1,297 | 0 | 1 | 0 | 38 | 51 | 18,588 |
| BIO | 0 | 0 | 0 | 0 | 8,948 | 16 | 8 | 11 | 89 | 6,605 | 1,210 |
| COL | 0 | 0 | 0 | 0 | 43 | 109 | 736 | 182 | 3,633 | 11,654 | 4,625 |
| OIL | 0 | 0 | 0 | 0 | 0 | 6,803 | 52,633 | 13,019 | 5,609 | 28 | 0 |
| NGS | 0 | 4 | 0 | 66 | 4 | 1,060 | 1,045 | 26,979 | 4,806 | 1,410 | 93 |
| MIN | 0 | 0 | 0 | 0 | 0 | 0 | 131 | 0 | 5,012 | 1,821 | 909 |
| TXL | 0 | 88 | 0 | 1,178 | 82 | 16 | 73 | 19 | 365 | 367,337 | 251 |
| PPR | 0 | 0 | 0 | 721 | 60 | 730 | 25 | 1,557 | 388 | 1,171 | 11 |
| PET | 33,596 | 508 | 0 | 5,602 | 2,582 | 2,735 | 940 | 7,592 | 2,767 | 2,408 | 106 |
| CEM | 0 | 0 | 0 | 0 | 0 | 1 | 0 | 12 | 3,030 | 202 | 31 |
| FRM | 0 | 0 | 0 | 0 | 0 | 0 | 151 | 21,090 | 375 | 66 | 130 |
| ALM | 0 | 0 | 0 | 8 | 1 | 0 | 0 | 0 | 57 | 166 | 292 |
| NFM | 0 | 0 | 0 | 21 | 2 | 0 | 0 | 0 | 142 | 410 | 720 |
| FER | 19,513 | 121 | 4,289 | 0 | 1,446 | 99 | 243 | 37 | 2,939 | 37,495 | 3,304 |
| CHM | 77,266 | 500 | 16,467 | 393 | 5,994 | 574 | 998 | 675 | 11,475 | 144,112 | 12,690 |
| MAN | 33,509 | 13,133 | 27,178 | 27,103 | 7,775 | 7,103 | 5,635 | 9,882 | 26,392 | 80,487 | 56,781 |
| CON | 0 | 1,998 | 162 | 1,262 | 212 | 4,970 | 3,274 | 6,408 | 44,136 | 57,749 | 10,607 |
| ELN | 654 | 0 | 0 | 2 | 39 | 33 | 13 | 4 | 255 | 1,702 | 251 |
| ELS | 1,019 | 0 | 0 | 3 | 62 | 52 | 21 | 6 | 398 | 2,655 | 391 |
| ELW | 952 | 0 | 0 | 3 | 58 | 49 | 19 | 6 | 371 | 2,480 | 365 |
| ELH | 2,104 | 0 | 0 | 7 | 50 | 107 | 43 | 13 | 821 | 5,479 | 807 |
| ELG | 501 | 0 | 0 | 2 | 30 | 26 | 10 | 3 | 196 | 1,306 | 192 |
| ELC | 14,449 | 3 | 0 | 50 | 102 | 736 | 292 | 90 | 5,636 | 37,628 | 5,544 |
| ELO | 1,019 | 0 | 0 | 3 | 62 | 52 | 21 | 6 | 398 | 2,654 | 391 |
| RLT | 2,032 | 724 | 2,434 | 724 | 387 | 2,318 | 744 | 783 | 1,612 | 6,294 | 886 |
| LNT | 10,870 | 1,827 | 13,026 | 3,998 | 3,492 | 5,670 | 2,777 | 3,233 | 6,859 | 35,891 | 4,829 |
| WTT | 193 | 18 | 231 | 23 | 78 | 10 | 17 | 44 | 47 | 597 | 84 |
| ART | 336 | 32 | 402 | 41 | 55 | 17 | 30 | 77 | 82 | 1,040 | 146 |
| TRA | 40,655 | 4,259 | 48,716 | 5,419 | 8,472 | 2,161 | 4,117 | 9,461 | 9,368 | 127,337 | 17,781 |
| STW | 0 | 0 | 0 | 24 | 1 | 196 | 0 | 85 | 1,095 | 1,417 | 0 |
| COM | 0 | 0 | 0 | 245 | 18 | 105 | 0 | 79 | 205 | 0 | 0 |
| HOT | 0 | 0 | 0 | 0 | 0 | 0 | 0 | 0 | 0 | 0 | 0 |
| FIN | 102,423 | 228 | 1,034 | 426 | 4,906 | 1,033 | 2,896 | 4,296 | 3,663 | 33,029 | 8,359 |
| WTD | 8,842 | 5 | 0 | 71 | 529 | 1,013 | 143 | 72 | 5,049 | 28 | 0 |
| DWL | 0 | 54 | 0 | 1,045 | 67 | 2,192 | 845 | 579 | 4,025 | 5,153 | 128 |
| OSV | 77,661 | 6,125 | 143 | 9,717 | 5,958 | 20,150 | 17,724 | 8,942 | 15,173 | 8,843 | 140 |
| UNSK_LAB | 1,173,842 | 148,120 | 615,988 | 178,127 | 106,014 | 25,025 | 26,031 | 16,853 | 55,184 | 177,527 | 18,243 |
| SK_LAB | 4,283 | 540 | 2,248 | 650 | 387 | 2,277 | 2,369 | 1,534 | 5,021 | 30,878 | 3,173 |
| CAP | 970,123 | 122,414 | 509,084 | 147,213 | 87,616 | 67,009 | 69,704 | 45,128 | 147,769 | 233,975 | 35,394 |
| COM_TAX | 21,775 | 1,422 | 8,838 | 3,627 | 3,988 | 4,812 | 4,576 | 7,245 | 10,782 | 27,615 | 7,894 |
| DIR_TAX | 0 | 0 | 0 | 0 | 0 | 0 | 0 | 0 | 0 | 0 | 0 |
| RH1 | 0 | 0 | 0 | 0 | 0 | 0 | 0 | 0 | 0 | 0 | 0 |
| RH2 | 0 | 0 | 0 | 0 | 0 | 0 | 0 | 0 | 0 | 0 | 0 |
| RH3 | 0 | 0 | 0 | 0 | 0 | 0 | 0 | 0 | 0 | 0 | 0 |
| RH4 | 0 | 0 | 0 | 0 | 0 | 0 | 0 | 0 | 0 | 0 | 0 |
| RH5 | 0 | 0 | 0 | 0 | 0 | 0 | 0 | 0 | 0 | 0 | 0 |
| UR1 | 0 | 0 | 0 | 0 | 0 | 0 | 0 | 0 | 0 | 0 | 0 |
| UR2 | 0 | 0 | 0 | 0 | 0 | 0 | 0 | 0 | 0 | 0 | 0 |
| UR3 | 0 | 0 | 0 | 0 | 0 | 0 | 0 | 0 | 0 | 0 | 0 |
| UR4 | 0 | 0 | 0 | 0 | 0 | 0 | 0 | 0 | 0 | 0 | 0 |
| UR5 | 0 | 0 | 0 | 0 | 0 | 0 | 0 | 0 | 0 | 0 | 0 |
| Enterprises | 0 | 0 | 0 | 0 | 0 | 0 | 0 | 0 | 0 | 0 | 0 |
| Government | 0 | 0 | 0 | 0 | 0 | 0 | 0 | 0 | 0 | 0 | 0 |
| Invest | 0 | 0 | 0 | 0 | 0 | 0 | 0 | 0 | 0 | 0 | 0 |
| Stocks | 0 | 0 | 0 | 0 | 0 | 0 | 0 | 0 | 0 | 0 | 0 |
| ROW | 35,142 | 63 | 8,162 | 148 | 235,873 | 1,135,414 | 0 | 94,388 | 52,338 | 33,363 | |
| Total | 2,711,268 | 317,830 | 1,473,235 | 388,550 | 273,097 | 395,136 | 1,333,698 | 186,004 | 480,634 | 1,576,103 | 249,405 |
| PET | CEM | FRM | ALM | NFM | FER | CHM | MAN | CON | ELN | ELS | |
| AGR | 0 | 66 | 460 | 0 | 0 | 1,144 | 4,394 | 522,334 | 5,273 | 241 | 404 |
| FSH | 0 | 0 | 0 | 0 | 0 | 28 | 107 | 34,027 | 96 | 0 | 1 |
| LIV | 0 | 0 | 0 | 0 | 0 | 35 | 134 | 144,852 | 2,022 | 93 | 139 |
| FRS | 25 | 256 | 54 | 5 | 13 | 1,637 | 6,286 | 55,937 | 119,559 | 271 | 404 |
| BIO | 14 | 63 | 553 | 49 | 122 | 295 | 1,133 | 16,635 | 163 | 90 | 90 |
| COL | 14,304 | 24,202 | 151,590 | 3,060 | 7,549 | 1,991 | 8,447 | 39,488 | 853 | 300 | 285 |
| OIL | 1,022,356 | 104 | 0 | 0 | 0 | 14,869 | 114,528 | 31,695 | 811 | 0 | 0 |
| NGS | 17,741 | 45 | 331 | 119 | 293 | 3,775 | 15,492 | 7,908 | 490 | 1 | 0 |
| MIN | 0 | 35,624 | 103,724 | 16,940 | 413,791 | 12,494 | 47,978 | 111,633 | 41,087 | 27 | 4 |
| TXL | 1,413 | 250 | 250 | 34 | 84 | 3,047 | 11,781 | 50,631 | 7,453 | 94 | 147 |
| PPR | 479 | 485 | 16 | 6 | 15 | 485 | 1,888 | 26,379 | 519 | 143 | 223 |
| PET | 18,128 | 3,983 | 24,646 | 981 | 2,419 | 2,893 | 12,128 | 28,139 | 18,377 | 4,015 | 5,448 |
| CEM | 0 | 21,552 | 304 | 5 | 13 | 484 | 1,859 | 27,622 | 260,970 | 500 | 678 |
| FRM | 0 | 2,671 | 390,951 | 1,034 | 2,551 | 54 | 206 | 392,519 | 433,932 | 1,376 | 2,144 |
| ALM | 0 | 408 | 5,616 | 3,039 | 7,496 | 260 | 998 | 47,430 | 8,741 | 10 | 16 |
| NFM | 0 | 1,007 | 13,853 | 7,496 | 18,492 | 641 | 2,462 | 117,007 | 21,562 | 25 | 40 |
| FER | 2,844 | 3,174 | 1,534 | 255 | 629 | 17,556 | 67,576 | 69,845 | 5,176 | 14 | 19 |
| CHM | 12,188 | 12,465 | 7,617 | 1,048 | 2,585 | 57,747 | 260,273 | 269,850 | 21,161 | 54 | 73 |
| MAN | 10,277 | 29,633 | 67,569 | 6,340 | 15,641 | 16,353 | 63,374 | 1,467,943 | 825,223 | 1,928 | 2,928 |
| CON | 5,039 | 12,418 | 29,512 | 2,477 | 6,110 | 6,392 | 24,830 | 205,196 | 4,976 | 357 | 555 |
| ELN | 169 | 661 | 2,334 | 55 | 137 | 242 | 937 | 3,626 | 8,021 | 14 | 0 |
| ELS | 264 | 1,031 | 3,640 | 86 | 213 | 377 | 1,461 | 5,656 | 12,509 | 0 | 22 |
| ELW | 247 | 963 | 3,400 | 81 | 199 | 352 | 1,365 | 5,283 | 11,686 | 0 | 0 |
| ELH | 545 | 2,128 | 7,511 | 178 | 440 | 777 | 3,015 | 11,671 | 25,814 | 0 | 0 |
| ELG | 130 | 507 | 1,791 | 43 | 105 | 185 | 719 | 2,782 | 6,153 | 0 | 0 |
| ELC | 3,744 | 14,616 | 51,589 | 1,225 | 3,022 | 5,338 | 20,710 | 80,160 | 176,981 | 0 | 0 |
| ELO | 264 | 1,031 | 3,639 | 86 | 213 | 377 | 1,461 | 5,654 | 12,506 | 0 | 0 |
| RLT | 7,080 | 1,036 | 6,018 | 348 | 859 | 1,119 | 4,701 | 30,373 | 30,356 | 121 | 0 |
| LNT | 42,226 | 7,877 | 34,735 | 2,177 | 5,371 | 8,270 | 34,127 | 173,109 | 79,538 | 662 | 1,221 |
| WTT | 266 | 98 | 571 | 33 | 81 | 100 | 397 | 3,343 | 1,402 | 9 | 15 |
| ART | 463 | 171 | 995 | 58 | 142 | 174 | 692 | 4,961 | 2,444 | 17 | 26 |
| PET | CEM | FRM | ALM | NFM | FER | CHM | MAN | CON | ELN | ELS | |
| TRA | 64,802 | 21,926 | 122,005 | 7,154 | 17,648 | 22,421 | 89,739 | 607,290 | 305,148 | 3,482 | 3,101 |
| STW | 0 | 0 | 0 | 0 | 0 | 8 | 31 | 4,308 | 59 | 2 | 5 |
| COM | 0 | 0 | 0 | 0 | 0 | 0 | 0 | 970 | 0 | 29 | 45 |
| HOT | 0 | 0 | 0 | 0 | 0 | 0 | 0 | 0 | 0 | 17 | 27 |
| FIN | 16,744 | 11,096 | 20,895 | 646 | 1,594 | 9,454 | 37,246 | 178,625 | 63,668 | 1,089 | 1,697 |
| WTD | 23 | 24 | 0 | 0 | 0 | 48 | 186 | 500 | 35,543 | 56 | 87 |
| DWL | 0 | 2,068 | 4,801 | 300 | 740 | 4,679 | 17,968 | 21,162 | 858 | 84 | 131 |
| OSV | 10,782 | 526 | 25,523 | 66 | 162 | 6,738 | 26,478 | 33,457 | 330,552 | 1,579 | 2,461 |
| UNSK_LAB | 12,398 | 24,079 | 61,047 | 2,651 | 6,540 | 17,460 | 68,890 | 579,944 | 882,820 | 1,714 | 3,086 |
| SK_LAB | 3,991 | 4,188 | 10,618 | 461 | 1,137 | 3,037 | 11,982 | 100,872 | 410,054 | 3,929 | 7,072 |
| CAP | 159,818 | 85,277 | 167,107 | 7,257 | 17,902 | 73,957 | 291,712 | 1,453,088 | 444,631 | 9,619 | 17,314 |
| COM_TAX | 24,696 | 11,160 | 64,981 | 2,636 | 6,504 | 8,969 | 36,165 | 281,071 | 191,205 | 861 | 1,288 |
| DIR_TAX | 0 | 0 | 0 | 0 | 0 | 0 | 0 | 0 | 0 | 0 | 0 |
| RH1 | 0 | 0 | 0 | 0 | 0 | 0 | 0 | 0 | 0 | 0 | 0 |
| RH2 | 0 | 0 | 0 | 0 | 0 | 0 | 0 | 0 | 0 | 0 | 0 |
| RH3 | 0 | 0 | 0 | 0 | 0 | 0 | 0 | 0 | 0 | 0 | 0 |
| RH4 | 0 | 0 | 0 | 0 | 0 | 0 | 0 | 0 | 0 | 0 | 0 |
| RH5 | 0 | 0 | 0 | 0 | 0 | 0 | 0 | 0 | 0 | 0 | 0 |
| UR1 | 0 | 0 | 0 | 0 | 0 | 0 | 0 | 0 | 0 | 0 | 0 |
| UR2 | 0 | 0 | 0 | 0 | 0 | 0 | 0 | 0 | 0 | 0 | 0 |
| UR3 | 0 | 0 | 0 | 0 | 0 | 0 | 0 | 0 | 0 | 0 | 0 |
| UR4 | 0 | 0 | 0 | 0 | 0 | 0 | 0 | 0 | 0 | 0 | 0 |
| UR5 | 0 | 0 | 0 | 0 | 0 | 0 | 0 | 0 | 0 | 0 | 0 |
| Enterprises | 0 | 0 | 0 | 0 | 0 | 0 | 0 | 0 | 0 | 0 | 0 |
| Government | 0 | 0 | 0 | 0 | 0 | 0 | 0 | 0 | 0 | 0 | 0 |
| Invest | 0 | 0 | 0 | 0 | 0 | 0 | 0 | 0 | 0 | 0 | 0 |
| Stocks | 0 | 0 | 0 | 0 | 0 | 0 | 0 | 0 | 0 | 0 | 0 |
| Row | 399,350 | 26,513 | 93,510 | 26,177 | 57,555 | 43,601 | 311,228 | 2,067,510 | 79,161 | 0 | 0 |
| Total | 1,852,810 | 365,385 | 1,485,290 | 94,607 | 226,367 | 349,861 | 1,607,084 | 9,322,486 | 4,889,553 | 32,825 | 51,194 |
| ELW | ELH | ELG | ELC | ELO | RLT | LNT | WTT | ART | TRA | STW | |
| AGR | 421 | 888 | 246 | 5,366 | 405 | 0 | 9,582 | 0 | 0 | 29,524 | 0 |
| FSH | 1 | 1 | 1 | 11 | 1 | 0 | 0 | 0 | 39 | 3,277 | 0 |
| LIV | 116 | 236 | 107 | 1,976 | 140 | 10,020 | 0 | ||||
| FRS | 337 | 686 | 312 | 5,748 | 407 | 0 | 27,389 | 0 | 0 | 5,703 | 0 |
| BIO | 90 | 90 | 90 | 12,600 | 1,573 | 27 | 2,943 | 90 | 38 | 4,622 | 19 |
| COL | 254 | 778 | 460 | 108,106 | 250 | 292 | 0 | 0 | 0 | 4,848 | 0 |
| OIL | 0 | 0 | 0 | 27 | 0 | 2,619 | 0 | ||||
| NGS | 0 | 0 | 2,779 | 42 | 0 | 766 | 14,838 | 6,072 | 113 | 1,295 | 9 |
| MIN | 4 | 12 | 7 | 1,610 | 19 | 15,367 | 0 | ||||
| TXL | 138 | 303 | 72 | 2,078 | 147 | 1,562 | 1,212 | 6,893 | 156 | 27,510 | 811 |
| PPR | 210 | 461 | 110 | 3,155 | 224 | 1,392 | 3,148 | 3,283 | 113 | 6,952 | 206 |
| PET | 1,134 | 11,265 | 1,679 | 88,259 | 5,466 | 7,352 | 168,538 | 43,772 | 679 | 168,166 | 2,463 |
| CEM | 141 | 1,402 | 334 | 10,987 | 680 | 1,758 | 0 | ||||
| FRM | 2,017 | 4,433 | 675 | 30,352 | 1,515 | 0 | 0 | 0 | 2 | 19,468 | 0 |
| ALM | 15 | 33 | 8 | 232 | 16 | 3,760 | 0 | ||||
| NFM | 38 | 83 | 20 | 573 | 39 | 9,276 | 0 | ||||
| FER | 4 | 39 | 9 | 308 | 19 | 0 | 0 | 0 | 6 | 13,666 | 176 |
| CHM | 15 | 151 | 36 | 9,470 | 73 | 515 | 11,816 | 3,069 | 73 | 74,109 | 849 |
| MAN | 3,201 | 6,347 | 1,002 | 44,521 | 5,372 | 3,673 | 94,126 | 12,121 | 4,768 | 223,379 | 2,398 |
| CON | 523 | 1,149 | 273 | 7,865 | 557 | 19,580 | 113,128 | 145 | 3,584 | 33,296 | 5,508 |
| ELN | 0 | 0 | 0 | 0 | 0 | 555 | 931 | 165 | 19 | 529 | 0 |
| ELS | 0 | 0 | 0 | 0 | 0 | 866 | 1,453 | 257 | 30 | 826 | 1 |
| ELW | 20 | 0 | 0 | 0 | 0 | 809 | 1,357 | 240 | 28 | 771 | 0 |
| ELH | 0 | 45 | 0 | 0 | 0 | 1,786 | 2,998 | 530 | 62 | 1,704 | 1 |
| ELG | 0 | 0 | 11 | 0 | 0 | 426 | 715 | 126 | 15 | 406 | 0 |
| ELC | 0 | 0 | 0 | 307 | 0 | 14,483 | 20,578 | 3,641 | 427 | 11,704 | 8 |
| ELO | 0 | 0 | 0 | 0 | 22 | 865 | 1,452 | 257 | 30 | 826 | 1 |
| RLT | 0 | 0 | 93 | 14,611 | 190 | 149 | 15,126 | 1,417 | 682 | 6,216 | 961 |
| LNT | 1,149 | 2,525 | 508 | 2,679 | 1,035 | 1,337 | 73,121 | 4,848 | 1,609 | 48,859 | 4,203 |
| WTT | 14 | 30 | 7 | 207 | 15 | 13 | 268 | 62 | 4 | 6,078 | 7 |
| ART | 24 | 53 | 13 | 366 | 26 | 88 | 1,788 | 412 | 24 | 687 | 13 |
| ELW | ELH | ELG | ELC | ELO | RLT | LNT | WTT | ART | TRA | STW | |
| TRA | 2,913 | 6,510 | 480 | 32,591 | 4,238 | 2,883 | 55,189 | 10,881 | 933 | 105,887 | 1,161 |
| STW | 5 | 7 | 5 | 14 | 2 | 0 | 4,326 | 1,306 | 0 | 16,970 | 769 |
| COM | 43 | 94 | 22 | 644 | 46 | 902 | 142,203 | 1,441 | 85 | 12,739 | 24 |
| HOT | 25 | 55 | 13 | 378 | 27 | 1,262 | 15,321 | 0 | 0 | 0 | 0 |
| FIN | 1,597 | 3,509 | 835 | 24,028 | 1,703 | 5,029 | 77,210 | 3,356 | 6,972 | 62,840 | 163 |
| WTD | 82 | 180 | 43 | 1,231 | 87 | 1,107 | 15,470 | 5,141 | 589 | 67 | 10 |
| DWL | 123 | 271 | 64 | 1,857 | 132 | 0 | 11,144 | 1,393 | 245 | 12,378 | 258 |
| OSV | 3,118 | 5,088 | 1,210 | 32,528 | 924 | 27,847 | 75,681 | 16,982 | 5,422 | 43,077 | 905 |
| UNSK_LAB | 3,338 | 6,376 | 1,458 | 28,422 | 2,793 | 82,193 | 356,814 | 8,684 | 8,466 | 553,277 | 10,748 |
| SK_LAB | 7,652 | 14,615 | 3,343 | 65,148 | 6,401 | 15,797 | 68,578 | 1,669 | 1,627 | 414,484 | 2,066 |
| CAP | 18,731 | 35,778 | 8,183 | 159,478 | 15,670 | 84,147 | 365,296 | 8,891 | 8,667 | 1,088,715 | 11,004 |
| COM_TAX | 334 | 2,150 | 675 | 27,816 | 967 | 4,966 | 63,939 | 7,839 | 1,746 | 72,695 | 1,,418 |
| DIR_TAX | 0 | 0 | 0 | 0 | 0 | 0 | 0 | 0 | 0 | 0 | 0 |
| RH1 | 0 | 0 | 0 | 0 | 0 | 0 | 0 | 0 | 0 | 0 | 0 |
| RH2 | 0 | 0 | 0 | 0 | 0 | 0 | 0 | 0 | 0 | 0 | 0 |
| RH3 | 0 | 0 | 0 | 0 | 0 | 0 | 0 | 0 | 0 | 0 | 0 |
| RH4 | 0 | 0 | 0 | 0 | 0 | 0 | 0 | 0 | 0 | 0 | 0 |
| RH5 | 0 | 0 | 0 | 0 | 0 | 0 | 0 | 0 | 0 | 0 | 0 |
| UR1 | 0 | 0 | 0 | 0 | 0 | 0 | 0 | 0 | 0 | 0 | 0 |
| UR2 | 0 | 0 | 0 | 0 | 0 | 0 | 0 | 0 | 0 | 0 | 0 |
| UR3 | 0 | 0 | 0 | 0 | 0 | 0 | 0 | 0 | 0 | 0 | 0 |
| UR4 | 0 | 0 | 0 | 0 | 0 | 0 | 0 | 0 | 0 | 0 | 0 |
| UR5 | 0 | 0 | 0 | 0 | 0 | 0 | 0 | 0 | 0 | 0 | 0 |
| Enterprises | 0 | 0 | 0 | 0 | 0 | 0 | 0 | 0 | 0 | 0 | 0 |
| Government | 0 | 0 | 0 | 0 | 0 | 0 | 0 | 0 | 0 | 0 | 0 |
| Invest | 0 | 0 | 0 | 0 | 0 | 0 | 0 | 0 | 0 | 0 | 0 |
| Stocks | 0 | 0 | 0 | 0 | 0 | 0 | 0 | 0 | 0 | 0 | 0 |
| ROW | 0 | 2,603 | 0 | 0 | 0 | 0 | 0 | 47,687 | 24,300 | 0 | 0 |
| Total | 47,825 | 108,248 | 25,183 | 725,591 | 51,180 | 282,669 | 1,817,676 | 202,671 | 71,554 | 3,120,351 | 46,158 |
| COM | HOT | FIN | WTD | DWL | OSV | UNSK_LAB | SK_LAB | CAP | COM_TAX | DIR_TAX | |
| AGR | 0 | 53,999 | 0 | 1,710 | 0 | 73,332 | 0 | 0 | 0 | 0 | 0 |
| FSH | 0 | 647 | 0 | 1 | 0 | 10 | 0 | 0 | 0 | 0 | 0 |
| LIV | 0 | 59,436 | 0 | 7 | 0 | 85,895 | 0 | 0 | 0 | 0 | 0 |
| FRS | 0 | 0 | 0 | 19 | 0 | 111 | 0 | 0 | 0 | 0 | 0 |
| BIO | 343 | 8,022 | 230 | 139 | 227 | 10,767 | 0 | 0 | 0 | 0 | 0 |
| COL | 0 | 0 | 0 | 9 | 0 | 131 | 0 | 0 | 0 | 0 | 0 |
| OIL | 0 | 0 | 0 | 0 | 0 | 51 | 0 | 0 | 0 | 0 | 0 |
| NGS | 1,533 | 1,054 | 0 | 1 | 2 | 97 | 0 | 0 | 0 | 0 | 0 |
| MIN | 0 | 0 | 0 | 2 | 0 | 244 | 0 | 0 | 0 | 0 | 0 |
| TXL | 1,072 | 6 | 376 | 17 | 2,899 | 4,290 | 0 | 0 | 0 | 0 | 0 |
| PPR | 58,063 | 0 | 9,694 | 95 | 45,259 | 16,222 | 0 | 0 | 0 | 0 | 0 |
| PET | 24,654 | 922 | 0 | 8,246 | 31,788 | 60,688 | 0 | 0 | 0 | 0 | 0 |
| CEM | 0 | 5 | 0 | 5 | 0 | 32 | 0 | 0 | 0 | 0 | 0 |
| FRM | 0 | 0 | 0 | 10,274 | 0 | 8,222 | 0 | 0 | 0 | 0 | 0 |
| ALM | 0 | 0 | 0 | 1 | 0 | 112 | 0 | 0 | 0 | 0 | 0 |
| NFM | 0 | 0 | 0 | 1 | 0 | 276 | 0 | 0 | 0 | 0 | 0 |
| FER | 1,415 | 1 | 0 | 1,020 | 0 | 15,585 | 0 | 0 | 0 | 0 | 0 |
| CHM | 7,163 | 69 | 0 | 4,496 | 2,229 | 64,087 | 0 | 0 | 0 | 0 | 0 |
| MAN | 44,239 | 104,266 | 29,716 | 4,317 | 29,318 | 176,370 | 0 | 0 | 0 | 0 | 0 |
| CON | 27,730 | 20,360 | 14,889 | 22,546 | 52,179 | 259,682 | 0 | 0 | 0 | 0 | 0 |
| ELN | 45 | 101 | 2,950 | 14 | 416 | 2,370 | 0 | 0 | 0 | 0 | 0 |
| ELS | 71 | 158 | 4,600 | 23 | 649 | 3,696 | 0 | 0 | 0 | 0 | 0 |
| ELW | 66 | 147 | 4,298 | 21 | 606 | 3,453 | 0 | 0 | 0 | 0 | 0 |
| ELH | 146 | 325 | 9,494 | 46 | 1,339 | 7,627 | 0 | 0 | 0 | 0 | 0 |
| ELG | 35 | 77 | 2,263 | 11 | 319 | 1,818 | 0 | 0 | 0 | 0 | 0 |
| ELC | 1,004 | 2,232 | 65,203 | 319 | 9,195 | 52,385 | 0 | 0 | 0 | 0 | 0 |
| ELO | 71 | 157 | 4,599 | 23 | 649 | 3,695 | 0 | 0 | 0 | 0 | 0 |
| RLT | 3,068 | 2,304 | 9,014 | 461 | 2,568 | 4,814 | 0 | 0 | 0 | 0 | 0 |
| LNT | 12,243 | 9,300 | 15,192 | 1,907 | 23,034 | 68,702 | 0 | 0 | 0 | 0 | 0 |
| WTT | 10,118 | 3,803 | 25,017 | 21 | 1,599 | 50,431 | 0 | 0 | 0 | 0 | 0 |
| ART | 139 | 262 | 50 | 37 | 122 | 648 | 0 | 0 | 0 | 0 | 0 |
| COM | HOT | FIN | WTD | DWL | OSV | UNSK_LAB | SK_LAB | CAP | COM_TAX | DIR_TAX | |
| TRA | 20,247 | 33,176 | 5,947 | 4,833 | 17,903 | 79,857 | 0 | 0 | 0 | 0 | 0 |
| STW | 72 | 71 | 0 | 0 | 0 | 11,367 | 0 | 0 | 0 | 0 | 0 |
| COM | 23,213 | 13,038 | 48,958 | 68 | 35,246 | 190,506 | 0 | 0 | 0 | 0 | 0 |
| HOT | 23,363 | 1,000 | 50,174 | 0 | 4,289 | 45,871 | 0 | 0 | 0 | 0 | 0 |
| FIN | 45,502 | 7,479 | 12,774 | 3,754 | 58,718 | 136,099 | 0 | 0 | 0 | 0 | 0 |
| WTD | 1,357 | 231 | 16,855 | 760 | 2,322 | 24,009 | 0 | 0 | 0 | 0 | 0 |
| DWL | 45,126 | 11,172 | 22,263 | 242 | 25,574 | 76,154 | 0 | 0 | 0 | 0 | 0 |
| OSV | 150,006 | 17,026 | 89,613 | 4,571 | 55,377 | 185,983 | 0 | 0 | 0 | 0 | 0 |
| UNSK_LAB | 160,392 | 54,664 | 92,632 | 11,338 | 225,869 | 441,308 | 0 | 0 | 0 | 0 | 0 |
| SK_LAB | 30,827 | 40,952 | 364,325 | 25,989 | 1,224,323 | 2,567,582 | 0 | 0 | 0 | 0 | 0 |
| CAP | 139,431 | 94,605 | 718,296 | 63,620 | 817,742 | 1,188,955 | 0 | 0 | 0 | 0 | 0 |
| COM_TAX | 34,676 | 14,330 | 24,216 | 5,006 | 30,550 | 92,238 | 0 | 0 | 0 | 0 | 0 |
| DIR_TAX | 0 | 0 | 0 | 0 | 0 | 0 | 0 | 0 | 0 | 0 | 0 |
| RH1 | 0 | 0 | 0 | 0 | 0, | 0 | 318,473 | 278,824 | 363,117 | 0 | 0 |
| RH2 | 0 | 0 | 0 | 0 | 0 | 0 | 465,240 | 407,319 | 465,162 | 0 | 0 |
| RH3 | 0 | 0 | 0 | 0 | 0 | 0 | 550,154 | 481,662 | 515,712 | 0 | 0 |
| RH4 | 0 | 0 | 0 | 0 | 0 | 0 | 663,903 | 581,250 | 472,060 | 0 | 0 |
| RH5 | 0 | 0 | 0 | 0 | 0 | 0 | 956,022 | 837,001 | 292,767 | 0 | 0 |
| UR1 | 0 | 0 | 0 | 0 | 0 | 0 | 33,586 | 29,404 | 7,553 | 0 | 0 |
| UR2 | 0 | 0 | 0 | 0 | 0 | 0 | 97,701 | 85,538 | 19,861 | 0 | 0 |
| UR3 | 0 | 0 | 0 | 0 | 0 | 0 | 217,482 | 190,406 | 22,979 | 0 | 0 |
| UR4 | 0 | 0 | 0 | 0 | 0 | 0 | 531,368 | 465,215 | 49,755 | 0 | 0 |
| UR5 | 0 | 0 | 0 | 0 | 0 | 0 | 2,426,250 | 2,124,192 | 106,558 | 0 | 0 |
| Enterprises | 0 | 0 | 0 | 0 | 0 | 0 | 0 | 0 | 6,499,857 | 0 | 0 |
| Government | 0 | 0 | 0 | 0 | 0 | 0 | 0 | 0 | 606,613 | 2,032,128 | 1,593,949 |
| Invest | 0 | 0 | 0 | 0 | 0 | 0 | 0 | 0 | 0 | 0 | 0 |
| Stocks | 0 | 0 | 0 | 0 | 0 | 0 | 0 | 0 | 0 | 0 | 0 |
| ROW | 12,451 | 0 | 47,155 | 0 | 25,848 | 626,548 | 0 | 0 | 0 | 0 | 0 |
| Total | 879,881 | 555,400 | 1,690,795 | 175,971 | 2,728,156 | 6,642,322 | 6,260,179 | 5,480,813 | 9,421,995 | 2,032,128 | 1,593,949 |
| RH1 | RH2 | RH3 | RH4 | RH5 | UR1 | UR2 | UR3 | UR4 | UR5 | ENT | |
| AGR | 187,186 | 239,900 | 287,185 | 234,355 | 193,311 | 10,284 | 32,993 | 37,968 | 78,800 | 211,919 | 0 |
| FSH | 24,281 | 32,733 | 35,685 | 39,924 | 42,217 | 2,213 | 5,173 | 10,609 | 20,153 | 57,281 | 0 |
| LIV | 63,119 | 121,319 | 208,555 | 191,388 | 188,535 | 6,054 | 15,206 | 31,208 | 72,073 | 202,733 | 0 |
| FRS | 20,933 | 19,130 | 17,721 | 14,121 | 6,954 | 1,905 | 2,384 | 2,841 | 2,565 | 1,532 | 0 |
| BIO | 25,409 | 35,436 | 36,160 | 39,092 | 34,262 | 6,635 | 3,495 | 1,772 | 1,772 | 1,772 | 0 |
| COL | 447 | 475 | 382 | 249 | 123 | 217 | 341 | 346 | 382 | 258 | 0 |
| OIL | 0 | 0 | 0 | 0 | 0 | 0 | 0 | 0 | 0 | 0 | 0 |
| NGS | 0 | 0 | 0 | 0 | 0 | 0 | 0 | 0 | 0 | 105,557 | 0 |
| MIN | 0 | 0 | 0 | 0 | 0 | 0 | 0 | 0 | 0 | 0 | 0 |
| TXL | 49,274 | 63,834 | 75,222 | 89,334 | 92,474 | 5,169 | 13,102 | 18,690 | 37,283 | 125,641 | 0 |
| PPR | 1,669 | 2,149 | 2,474 | 2,658 | 2,677 | 193 | 414 | 828 | 1,866 | 5,371 | 0 |
| PET | 16,103 | 20,934 | 28,126 | 43,615 | 62,714 | 2,115 | 5,094 | 11,867 | 31,899 | 54,928 | 0 |
| CEM | 584 | 621 | 499 | 326 | 161 | 284 | 445 | 452 | 500 | 337 | 0 |
| FRM | 0 | 0 | 0 | 0 | 0 | 0 | 0 | 0 | 0 | 0 | 0 |
| ALM | 0 | 0 | 0 | 0 | 0 | 0 | 0 | 0 | 0 | 0 | 0 |
| NFM | 0 | 0 | 0 | 0 | 0 | 0 | 0 | 0 | 0 | 0 | 0 |
| FER | 0 | ||||||||||
| CHM | 15,137 | 20,272 | 24,409 | 31,010 | 38,628 | 1,908 | 2,793 | 7,708 | 17,166 | 51,528 | 0 |
| MAN | 327,912 | 374,559 | 328,679 | 327,401 | 394,516 | 24,969 | 83,827 | 216,194 | 173,007 | 695,867 | 0 |
| CON | 0 | 0 | 0 | 0 | 0 | 0 | 0 | 0 | 0 | 206,268 | 0 |
| ELN | 262 | 433 | 592 | 726 | 742 | 71 | 158 | 327 | 767 | 1,499 | 0 |
| ELS | 409 | 675 | 923 | 1,132 | 1,158 | 111 | 246 | 511 | 1,197 | 2,338 | 0 |
| ELW | 382 | 631 | 863 | 1,058 | 1,082 | 104 | 230 | 477 | 1,118 | 2,185 | 0 |
| ELH | 971 | 1,601 | 2,190 | 2,685 | 2,746 | 263 | 583 | 1,211 | 2,838 | 5,546 | 0 |
| ELG | 201 | 332 | 454 | 557 | 570 | 55 | 121 | 251 | 589 | 1,150 | 0 |
| ELC | 5,749 | 9,479 | 12,967 | 15,900 | 16,262 | 1,559 | 3,453 | 7,170 | 16,806 | 32,843 | 0 |
| ELO | 409 | 675 | 923 | 1,132 | 1,157 | 111 | 246 | 510 | 1,196 | 2,338 | 0 |
| RLT | 1,795 | 2,832 | 3,572 | 4,669 | 9,274 | 353 | 1,276 | 2,533 | 8,548 | 58,933 | 0 |
| LNT | 39,965 | 66,799 | 90,989 | 120,316 | 140,509 | 4,872 | 11,361 | 26,736 | 67,885 | 259,649 | 0 |
| WTT | 3,614 | 6,717 | 4,607 | 4,517 | 7,608 | 83 | 315 | 654 | 709 | 4,151 | 0 |
| ART | 0 | 5 | 1 | 4 | 368 | 0 | 0 | 0 | 0 | 10,278 | 0 |
| RH1 | RH2 | RH3 | RH4 | RH5 | UR1 | UR2 | UR3 | UR4 | UR5 | ENT | |
| TRA | 35,664 | 50,804 | 63,672 | 88,147 | 140,124 | 4,322 | 10,119 | 21,981 | 54,761 | 304,319 | 0 |
| STW | 0 | 0 | 0 | 0 | 0 | 0 | 0 | 0 | 0 | 4,009 | 0 |
| COM | 26,344 | 30,482 | 29,881 | 30,551 | 48,975 | 2,492 | 4,360 | 9,146 | 20,122 | 172,963 | 0 |
| HOT | 10,496 | 16,605 | 22,579 | 27,891 | 32,935 | 1,495 | 3,481 | 8,011 | 20,099 | 82,059 | 0 |
| FIN | 14,339 | 14,436 | 27,856 | 40,912 | 96,953 | 1,701 | 5,824 | 11,144 | 32,239 | 421,352 | 0 |
| WTD | 629 | 1,495 | 2,640 | 3,367 | 3,811 | 375 | 938 | 1,988 | 5,157 | 18,347 | 0 |
| DWL | 36,132 | 47,453 | 55,518 | 80,248 | 203,146 | 9,176 | 22,376 | 61,374 | 184,754 | 1,342,523 | 0 |
| OSV | 69,075 | 98,399 | 123,322 | 170,726 | 271,395 | 8,371 | 19,598 | 42,573 | 106,062 | 589,411 | 0 |
| UNSK_LAB | 0 | 0 | 0 | 0 | 0 | 0 | 0 | 0 | 0 | 0 | 0 |
| SK_LAB | 0 | 0 | 0 | 0 | 0 | 0 | 0 | 0 | 0 | 0 | 0 |
| CAP | 0 | 0 | 0 | 0 | 0 | 0 | 0 | 0 | 0 | 0 | 0 |
| COM_TAX | 25,376 | 33,294 | 38,675 | 45,915 | 58,166 | 2,926 | 6,223 | 11,906 | 27,584 | 128,019 | 0 |
| DIR_TAX | 0 | 0 | 0 | 0 | 56,066 | 0 | 0 | 0 | 154,642 | 671,204 | 712,037 |
| RH1 | 0 | 0 | 0 | 0 | 0 | 0 | 0 | 0 | 0 | 0 | 60,341 |
| RH2 | 0 | 0 | 0 | 0 | 0 | 0 | 0 | 0 | 0 | 0 | 98,785 |
| RH3 | 0 | 0 | 0 | 0 | 0 | 0 | 0 | 0 | 0 | 0 | 111,074 |
| RH4 | 0 | 0 | 0 | 0 | 0 | 0 | 0 | 0 | 0 | 0 | 181,162 |
| RH5 | 0 | 0 | 0 | 0 | 0 | 0 | 0 | 0 | 0 | 0 | 614,777 |
| UR1 | 0 | 0 | 0 | 0 | 0 | 0 | 0 | 0 | 0 | 0 | 15,608 |
| UR2 | 0 | 0 | 0 | 0 | 0 | 0 | 0 | 0 | 0 | 0 | 30,125 |
| UR3 | 0 | 0 | 0 | 0 | 0 | 0 | 0 | 0 | 0 | 0 | 145,117 |
| UR4 | 0 | 0 | 0 | 0 | 0 | 0 | 0 | 0 | 0 | 0 | 179,049 |
| UR5 | 0 | 0 | 0 | 0 | 0 | 0 | 0 | 0 | 0 | 0 | 1,754,572 |
| Enterprises | 0 | 0 | 0 | 0 | 0 | 0 | 0 | 0 | 0 | 0 | 0 |
| Government | 0 | 0 | 0 | 0 | 0 | 0 | 0 | 0 | 0 | 0 | 0 |
| Invest | 73,639 | 211,409 | 255,925 | 397,921 | 9,610,62 | –3,913 | 18,928 | 132,241 | 402,812 | 2,169,477 | 2,597,211 |
| Stocks | 0 | 0 | 0 | 0 | 0 | 0 | 0 | 0 | 0 | 0 | 0 |
| ROW | 4,285 | 5,297 | 5,082 | 5,440 | 7,969 | 699 | 1,542 | 3,028 | 6,129 | 19,419 | |
| Total | 1,081,793 | 1,531,215 | 1,788,329 | 2,057,286 | 3,118,650 | 97,174 | 276,642 | 684,254 | 1,553,479 | 8,025,004 | 6,499,857 |
| Government | Invest | Stocks | ROW | Total | |||||||
| AGR | 0 | 0 | 19,291 | 118,172 | 2,711,269 | ||||||
| FSH | 0 | 0 | 1,485 | 2,217 | 317,830 | ||||||
| LIV | 0 | 6,248 | 7,974 | 27,492 | 1,473,235 | ||||||
| FRS | 0 | 0 | 23,397 | 11,145 | 388,550 | ||||||
| BIO | 0 | 16,234 | –6,947 | 0 | 273,097 | ||||||
| COL | 0 | 0 | 2,383 | 1,352 | 395,136 | ||||||
| OIL | 0 | 0 | 68,545 | 0 | 1,333,697 | ||||||
| NGS | 0 | 0 | –29,818 | 0 | 186,004 | ||||||
| MIN | 0 | 0 | 13,734 | 30,457 | 480,634 | ||||||
| TXL | 0 | 0 | 9,154 | 502,792 | 1,576,103 | ||||||
| PPR | 0 | 0 | 3,864 | 41,356 | 249,405 | ||||||
| PET | 0 | 0 | 28,775 | 741,576 | 1,852,810 | ||||||
| CEM | 0 | 0 | 8,861 | 19,708 | 365,385 | ||||||
| FRM | 0 | 33,998 | 32,200 | 92,885 | 1,485,290 | ||||||
| ALM | 0 | 0 | 1,674 | 14,216 | 94,606 | ||||||
| NFM | 0 | 0 | 4,131 | 28,051 | 226,367 | ||||||
| FER | 0 | 0 | 7,474 | 72,029 | 349,861 | ||||||
| CHM | 0 | 0 | 30,710 | 271,389 | 1,607,084 | ||||||
| MAN | 0 | 2,048,803 | 84,826 | 650,608 | 9,322,487 | ||||||
| CON | 87,179 | 3,533,143 | 14,567 | 36,761 | 4,889,553 | ||||||
| ELN | 0 | 0 | 0 | 0 | 32,825 | ||||||
| ELS | 0 | 0 | 0 | 0 | 51,194 | ||||||
| ELW | 0 | 0 | 0 | 0 | 47,825 | ||||||
| ELH | 0 | 0 | 0 | 0 | 108,248 | ||||||
| ELG | 0 | 0 | 0 | 0 | 25,183 | ||||||
| ELC | 0 | 0 | 0 | 0 | 725,591 | ||||||
| ELO | 0 | 0 | 0 | 0 | 51,180 | ||||||
| RLT | 0 | 12,111 | 0 | 14,150 | 282,669 | ||||||
| LNT | 0 | 92,220 | 0 | 142,336 | 1,817,677 | ||||||
| WTT | 0 | 1,565 | 0 | 62,783 | 202,671 | ||||||
| ART | 0 | 2,727 | 0 | 41,019 | 71,554 | ||||||
| Government | Invest | Stocks | ROW | Total | |||||||
| TRA | 0 | 330,234 | 0 | 88,114 | 3,120,350 | ||||||
| STW | 0 | 0 | 0 | 0 | 46,157 | ||||||
| COM | 0 | 0 | 0 | 33,599 | 879,882 | ||||||
| HOT | 0 | 0 | 0 | 187,925 | 555,399 | ||||||
| FIN | 0 | 0 | 0 | 67,422 | 1,690,794 | ||||||
| WTD | 15,466 | 0 | 0 | 0 | 175,971 | ||||||
| DWL | 319,209 | 47,511 | 0 | 43,461 | 2,728,156 | ||||||
| OSV | 1,924,111 | 564,562 | 0 | 1,330,458 | 6,642,322 | ||||||
| UNSK_LAB | 0 | 0 | 0 | 9,823 | 6,260,179 | ||||||
| SK_LAB | 0 | 0 | 0 | 14,734 | 5,480,813 | ||||||
| CAP | 0 | 0 | 0 | –568,322 | 9,421,995 | ||||||
| COM_TAX | 12,785.7 | 313,116 | 30,387 | 180,085 | 2,032,128 | ||||||
| DIR_TAX | 0 | 0 | 0 | 0 | 1,593,949 | ||||||
| RH1 | 44,530 | 0 | 0 | 16,508 | 1,081,793 | ||||||
| RH2 | 71,102 | 0 | 0 | 23,607 | 1,531,215 | ||||||
| RH3 | 99,531 | 0 | 0 | 30,195 | 1,788,329 | ||||||
| RH4 | 124,906 | 0 | 0 | 34,005 | 2,057,286 | ||||||
| RH5 | 336,183 | 0 | 0 | 81,900 | 3,118,650 | ||||||
| UR1 | 9,811 | 0 | 0 | 1,212 | 97,174 | ||||||
| UR2 | 32,552 | 0 | 0 | 10,864 | 276,642 | ||||||
| UR3 | 79,442 | 0 | 0 | 28,828 | 684,254 | ||||||
| UR4 | 237,788 | 0 | 0 | 90,304 | 1,553,479 | ||||||
| UR5 | 1,266,522 | 0 | 0 | 346,910 | 8,025,004 | ||||||
| Enterprises | 0 | 0 | 0 | 0 | 6,499,857 | ||||||
| Government | 0 | 0 | 0 | –203,871 | 4,028,819 | ||||||
| Invest | –632,297 | 0 | 0 | –187,052 | 6,397,363 | ||||||
| Stocks | 0 | –605,109 | 0 | 961,775 | 356,666 | ||||||
| ROW | 5,544,979 | ||||||||||
| Total | 4,028,820 | 6,397,363 | 356,667 | 5,544,978 | 116,664,629 | ||||||