
Abstract
A well-known property of vowel duration is that it tends to be mediated by vowel height: higher vowels are usually shorter than lower vowels (aka “intrinsic vowel duration”). Results from previous work on a limited number of languages suggest two possible scenarios: (A) vowel duration is entirely driven by the duration of the gesture necessary to reach the tongue height target of the specific vowel, (B) vowel duration targets are part of the cognitive representation of the vowel. However, a third scenario has been put forward theoretically: (C) the duration of the vocalic gesture partially determines vowel duration, but a vowel duration target for each vowel category is also necessary. This study set out to investigate vowel duration data from Northern Italian to assess which of the three scenarios finds support. The first formant frequency (F1) of vowels was used as a proxy for tongue height position, and directed acyclic graph theory was employed to determine the causal relationship between vowel duration, vowel category, and F1. Bayesian modeling results suggest a robust non-linear effect of F1 on vowel duration, together with a direct effect of vowel category, which matches scenario (C).
1 Introduction
A well-known property of vowel duration is that higher vowels tend to be shorter than lower vowels, and lower vowels tend to be longer than higher vowels (Lieberman & Kubaska, 1979). This phenomenon is commonly referred to as “intrinsic vowel duration.” Despite the notoriety of this tendency, only a limited number of languages have been investigated so far (e.g., American English in Lieberman & Kubaska, 1979; Tauberer & Evanini, 2009; Toivonen et al., 2015; Turk et al., 1994; Wilson & Chodroff, 2017; Dutch in Bundgaard, 1980; Swedish in Toivonen et al., 2015; see Toivonen et al., 2015 for a more comprehensive review). Moreover, competing explanatory models of intrinsic vowel duration have been proposed in the literature, and to date, there is still disagreement as to which is the correct one.
In this study, I report on acoustic data of vowel duration in Northwestern Italian. While no conclusive evidence can be drawn from this single study, I will propose a hybrid explanation of intrinsic vowel duration, by which intrinsic vowel duration is the product of both vowel-independent gestural duration and vowels-specific durational targets. It is hoped that future studies will consider and further assess this hypothesis, with a more diverse pool of languages and with articulatory data.
2 Explaining intrinsic vowel duration
Probably one of the most debated aspects of intrinsic vowel duration is its status in the synchronic grammar of languages that show it and which motor-cognitive processes or mechanisms are behind it.
The literature on intrinsic vowel duration has proposed two alternative mechanisms: (a) intrinsic vowel duration is the product of the time required to go from an initial articulatory configuration to the target articulation of the vowel category (the “articulatory distance” hypothesis); and (b) each vowel category has a specified durational target related to categorical vowel height (the “categorical duration” hypothesis). The following sections review each of these mechanisms.
2.1 Intrinsic vowel duration as articulatory distance
Some work on intrinsic vowel duration sought to explain the phenomenon with the duration of the gesture(s) needed to reach the target articulation for the specified vowel, as for example argued in Lieberman and Kubaska (1979). Both the lingual and jaw target can be thought to play a role in the coarticulation of vowel and consonant gestures. Jaw displacement is known to be relevant in vowel production, so that lower vowels show greater jaw opening (Kawahara et al., 2017; Lindblom & Sundberg, 1971; Menezes & Erickson, 2013). On the other hand, in the production of consonants, the jaw is in a more raised position (Warren & Jacks, 2005). This means that in the alternation between consonantal and vocalic gestures, greater jaw lowering will be required in low vowels than in height vowels, thus requiring more time to reach the target jaw position. A similar argument has been made for lingual coarticulation. Figure 1 shows idealized trajectories of the tongue body articulator in the sequences [ka] and [ke], based on data in Ladefoged and Maddieson (1996). The tongue body is closer to the palate (i.e., “higher” in the vocal tract) in consonantal articulations than in vocalic articulations: the tongue body position for [k] is higher than that of [e] and [a] in the figure. To produce the vowels [e] and [a], the tongue body has to lower: taking [k] as the reference, the vocalic target is lower in [a] than [e]. In other words, the distance from the origin (i.e., the articulation for [k]) to the vocalic target is greater in [a] than in [e], as reflected by the longer trajectory in the former than the latter.
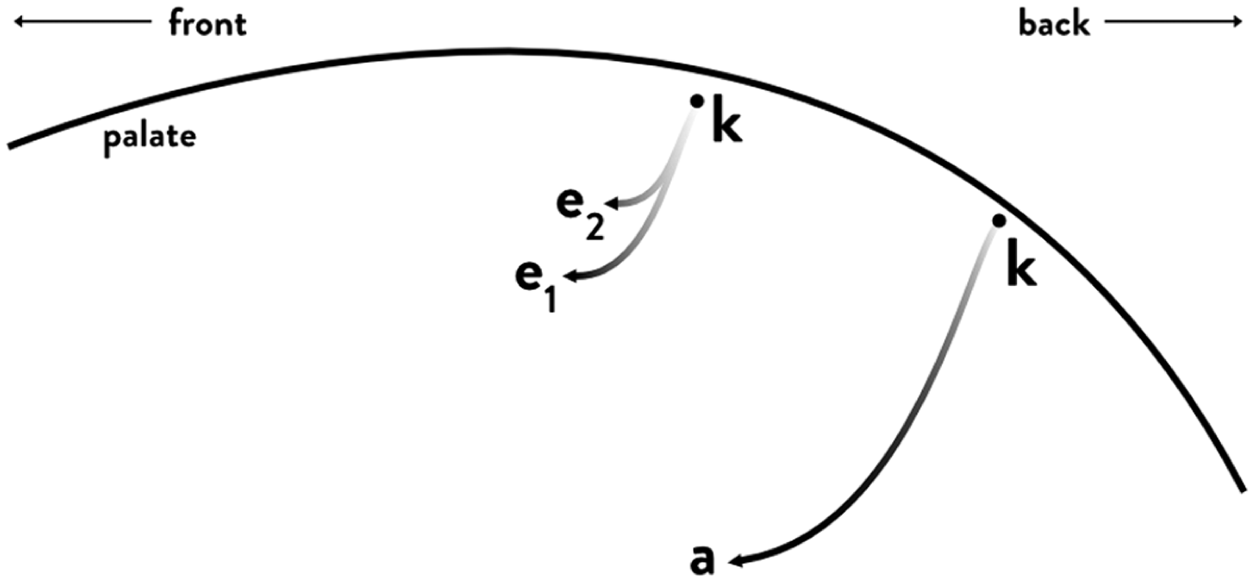
Idealized articulatory trajectory of the tongue dorsum in the production of [ka] and [ke]. The black dots labeled “k” indicates the position of the tongue dorsum during [k] while the arrows indicate the trajectory of the dorsum from [k] to the target position of [a] and [e]. In the case of [e], two tokens are shown, one of which is slightly closer to [k] than the other. See text for details.
Since the distance to cover from [k] to [a] is greater than the distance to cover from [k] to [e], [a] will have a longer duration than [e]. The “articulatory distance” hypothesis states that the duration of a vowel is entirely determined by the physical distance the articulators involved in the production of the vowel have to cover. This hypothesis has been tested in Turk et al. (1994), who looked at the speech of one American English speaker using electromagnetic articulography. Turk et al. (1994) found that vowel duration could be predicted by the articulatory distance alone and thus classified the phenomenon of intrinsic vowel duration as a bio-mechanical phenomenon. It is worth noting that since both the tongue and the jaw are expected to determine the articulatory distance, there should be minimal differences in the effect of distance depending on whether the consonant is lingual or labial. In other words, vowels preceded and/or followed by labial consonants might show the same degree of articulatory distance effect, driven by the jaw. Since the focus of this study is on whether specified duration targets are needed on top of the articulatory distance effect, we will discuss the possible effect of consonantal place of articulation to a minimum extent, and we reserve a more thorough treatment to future work which focus directly on the specific weights of lingual vs jaw coarticulation.
2.2 Intrinsic vowel duration as specified durational targets
On the other hand, in the categorical duration scenario (B), the duration of each vowel is part of the representation of the vowel and articulatory distance to the target does not affect vowel duration. In other words, vowel duration is entirely determined by the represented categorical duration target of each vowel category. This is the scenario proposed, among others, by Toivonen et al. (2015) and Bermúdez-Otero (2010). Their claim is that, while the source cross-linguistic tendency of intrinsic vowel duration can be rooted in bio-mechanical processes, a language can phonologise these processes (i.e., durational targets become under the control of the speaker) and further stabilize them (i.e., they become part of the phonology) so that the original bio-mechanical effect is lost and synchronically only an effect of vowel category is found. In other words, different vowels are expected to have different target durations but within each vowel category, articulatory distance should not affect vowel duration.
Toivonen et al. (2015) tested the categorical duration hypothesis using acoustic data from American English and Swedish. They used the frequency of the first formant (F1) as a proxy to articulatory distance: higher F1 approximately corresponds to lower vowels and hence longer distances from a consonantal constriction target. Both in American English and Swedish, they report categorical vowel height has an effect on duration, but crucially, within vowel category, they report no effect of F1 on vowel duration (no quantified regression coefficients were reported). These results are in line with the categorical duration hypothesis.
2.3 Articulatory distance with categorical duration
Logically, one could devise a scenario that combines the articulatory distance and the categorical duration hypotheses. The expectation from such scenario (C, let’s call it the “physio-categorical” hypothesis) is that a categorical durational difference between vowels should coexist with a bio-mechanical effect of articulatory distance. In other words, while different vowels show different durational targets not predictable by articulatory distance alone, the latter should also affect vowel duration within each vowel category. In other words, both bio-mechanical and categorical effect should be detectable. The physio-categorical hypothesis is not supported by the work discussed above, but the study presented in this paper offers preliminary evidence that a scenario that combines the articulatory distance and categorical duration scenarios might be possible.
3 Research hypotheses
This paper sets out to test the three scenarios against pre-existing data from Northwestern Italian by assessing acoustic data with a causal inference approach (details below). Note that each scenario involves a different model of (cognitive) representation of the durational makeup of segments. Since such models can differ widely depending on the specific speech, phonetic, and phonological framework one adopts (e.g., Bermúdez-Otero, 2015, 2017; Browman & Goldstein, 1992; Fowler, 1980; Goldstein & Pouplier, 2014; Kelso et al., 1986; Tilsen, 2016; Turk, Shattuck-Hufnagel, 2020), no attempt will be made in this study to propose a particular model of representation. Furthermore, the scenarios investigated in this study are of an abstract enough nature that the details of implementation based on different frameworks bears little influence. Instead, we hope the results reported here will continue to inform the debate in relation to this matter by bringing to the table evidence for the hybrid scenario (C) and that researchers working within different frameworks may opt to consider the results in light of their expectations. The following section relates the scenarios to specific statistical hypotheses, as informed by a Bayesian causal inference approach (McElreath, 2019).
While the details of how the three scenarios would be implemented representationally depend on the specific framework, statistically it is possible to assess the three scenarios against empirical data. This study used pre-existing data that were deemed suitable for such investigation. Specifically, we analyzed recordings of read speech in an unpublished study on Northwestern Italian, in which a comprehensive set of segmental contexts were represented and controlled for (for details, see the Methods section). 1
Since the available data is acoustic rather than articulatory, we have opted to use the first formant frequency (F1) as a proxy to articulatory vowel height as in Toivonen et al. (2015), whereby higher F1 values correspond to lower vowel articulations and hence greater articulatory distances. While we recognize the imperfect correspondence between acoustic and articulatory measures, we believe the correspondence between F1 values and vowel height is robust enough to be used in this investigation, also considering its accepted status as a good correlate of vowel height (Chládková et al., 2015; Toivonen et al. 2015). The author is planning an articulatory study that will complement the study reported here, and future articulatory work by other researchers is encouraged.
3.1 Causal inference and directed acyclic graphs
This study employs a Bayesian causal inference approach advocated by McElreath (2019), which is based on the application of Directed Acyclic Graph (DAG) theory to linear modeling. DAGs are a graphical representation of the causal relationship between variables of interest. Figure 2 shows the DAGs of each of the three scenarios (A–C). The arrows indicate the presence and direction of a (hypothesized) direct causal relationship between the two variables they connect. When a variable a causally determines a variable b which in turn determines a variable c, we talk of a case of mediation, by which the effect of a on c is mediated by b. In this case, a does not have a direct effect on c.
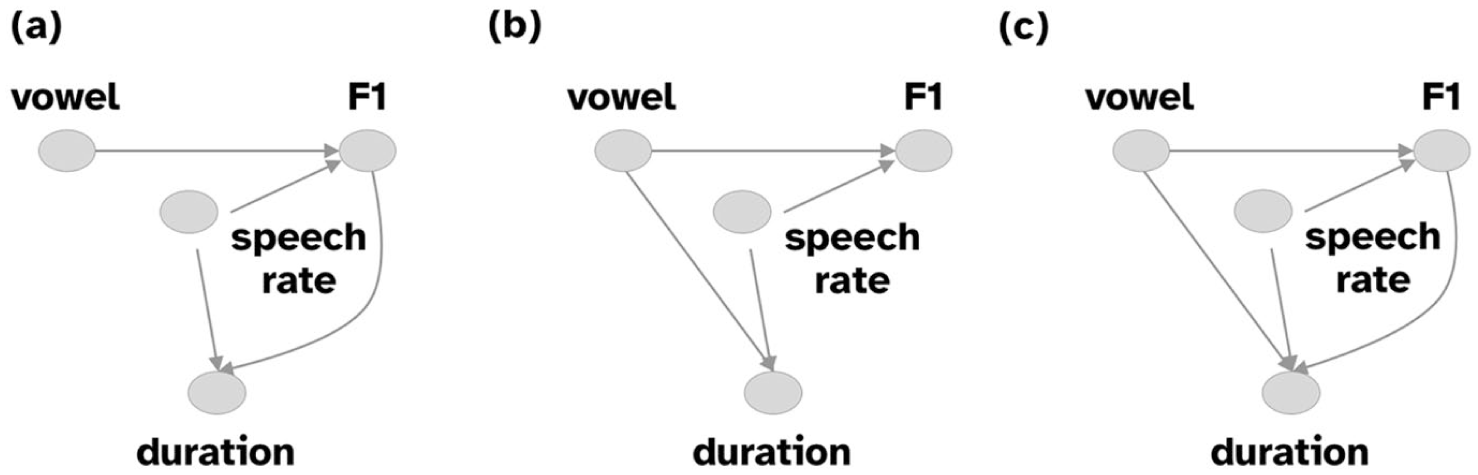
Directed Acyclic Graph representation of three scenarios indicating the causal relationships between vowel category, F1, vowel duration, and speech rate.
The main variables of interest are vowel category, F1 (as a proxy to articulatory distance), and vowel duration. Speech rate (measured as the number of syllables per second, see below) is also an important variable in which it could be a confounding variable, affecting (in principle) both vowel duration and F1. Speech rate is included in the DAGs of the three scenarios.
According to scenario A, the articulatory distance scenario, vowel duration is caused by F1 and speech rate, but not vowel category. In other words, vowel category should be independent of vowel duration (i.e., they should not be statistically correlated, or, linear model coefficients for vowel category should be practically 0), once controlling for F1 and speech rate. In scenario B, the categorical duration scenario, vowel category and vowel duration should not be independent (i.e., linear model coefficients of vowel category should not be practically 0), while F1 and vowel duration should be (i.e., linear model coefficients of F1 should be practically 0). Finally, in scenario C, the physio-categorical scenario, both vowel category and F1 should not be independent of vowel duration, that is, both should be statistically correlated with vowel duration, again once controlling for speech rate. In other words, once the mediating effect of F1 on vowel duration is controlled for, vowel quality should still affect vowel duration.
To summarize, these are the expectations derived from each of the three scenarios, when controlling for speech rate:
A. Articulatory distance: The vowel category determines F1 (i.e. the tongue position), which in turn determines the vowel duration (i.e., the vocalic gesture duration).
B. Categorical duration: The vowel category determines F1 and the vowel duration.
C. Physio-categorical: The vowel category determines F1 which in turn determines vowel duration, but vowel duration is also partially determined by vowel category.
3.2 Statistical hypotheses
The different expectations of each scenario allow us to assess the following statistical hypotheses. In a model fit to vowel duration, which includes vowel category, F1, and speech rate as predictors:
A. Articulatory distance: The coefficients of vowel category are practically 0 and the coefficient of F1 is not practically 0.
B. Categorical duration: The coefficients of vowel category are not practically 0, and the coefficient of F1 is practically 0.
C. Physio-categorical: The coefficients of vowel category and F1 are not practically 0.
4 Methods
The data used in this study come from a study that focused on the durational properties of voiced intervals in Italian (https://osf.io/xdgfz/). 2 Participants read sentences with target words presented on a screen. Both audio and electroglottographic recordings were made in the original study. This study is based on the audio recordings only.
4.1 Participants
A total of 19 native speakers of Italian participated in the study (median age = 42, age range = 18–59; 15 female, 4 male). The inclusion criteria were being a native speaker of Northwestern Italian from the Verbano-Cusio-Ossola province (Piedmont, Northern Italy), 18 years old or more, with no reported hearing or speaking disorders, with normal or corrected to normal vision. Since the speakers were all from a very restricted geographical area, they are quite homogeneous in terms of the variety of Northwestern Italian they speak.
4.2 Procedure
The participants were recorded while reading sentences including /CVCo/ target words presented on a computer screen with PsychoPy (Peirce, 2009), in a quiet room in Verbania (the county seat of the VCO province, Italy). Time-synchronized audio and electroglottographic data was collected using a Glottal Enterprises EG2-PCX2 electroglottograph and a RØDE Lavalier microphone, at a sample rate of 44,100 Hz (16-bit; down-sampled to 22,050 Hz for analysis). Only the audio recordings were analyzed for this paper. The acquisition of the signals was controlled with Audacity 2.1 running on a MacBook Pro (Retina, 13-inch, Mid 2014). The recordings were made in 2018.
4.3 Materials
Forty-three target words were created according to the form /CVCo/ (where /o/ is the phoneme /o/), with primary stress on the first syllable, using all permutations of C = /p, t, k/ and V = /i, e, a, ɔ, u/ (the following two words were excluded because they are profanities: peto and caco, see Section A for the full list). The choice of segments was constrained by the research question of the original study which was on the voiced interval between the two voiceless consonants of the target words. Due to this, the target words contain voiceless stops only. Only five vowels were included due to the restriction of the second consonant being a singleton. 3 Of the 43 target words, nine were real words. In open stressed syllables, vowels tend to have longer duration in Italian, duration not being a distinctive feature (in mainstream analyses that assume stress position to be): e.g., cheto /ˈketo/ [ˈke: to] “quiet.” This makes the first vowel in the target words long. Note that all the analyses were run on the (stressed) first vowel in the target words (i.e., the target vowel). The full list of target words can be found in the Appendix, Table A1.
The following frame sentences were used (where X is the CVCo target word): Scrivete X sul foglio “Write X on the sheet,” Ha detto X sei volte “S/he said X six times,” Sentivo X di nuovo “I heard X again,” Ripete X da sempre “S/he’s repeating X since always.”
4.4 Data processing
The recordings were subject to force alignment with SPPAS (Bigi, 2015), the output of which was manually corrected by the author in Praat (Boersma & Weenink, 2018), following the criteria described in Machač and Skarnitzl (2009). These are: vowel onset corresponds to the appearance of higher formants; vowel offset corresponds to the disappearance of higher formants. The duration of the target vowels was extracted from the corrected alignment and was the distance in milliseconds between the marked vowel onset and offset. Formant measurements from within the target vowel were obtained using the FastTrack plugin (Barreda, 2021) in Praat. FastTrack applies machine learning methods to extract robust formant and f0 measurements with automatic selection of optimal settings. The only user input is the maximum frequency of five formants: this can be selected based on the height of the participants. Since participant height was not recorded, it was guesstimated based on the author’s recollection of the participants. Formant measurements were manually checked, and the maximum frequency was adjusted, according to the heuristics described in the plugin documentation. For each vowel, the median (or average) formant values for the first three formants were collected for each of five intervals (0–20%, 20%–40%, 40%–60%, 60%–80%, 80%–100%). All subsequent analyses are based on the median value taken from the central interval (40%–60%). Moreover, speech rate was calculated as the number of syllables per second, for each sentence individually.
4.5 Data analysis
We modeled vowel duration as a function of vowel category (/a, e, i, ɔ, u/) F1, and speech rate using Bayesian models fitted with brms (Bürkner, 2017) in R. The choice of Bayesian statistics vs Null Hypothesis Significance Testing (NHST, Perezgonzalez, 2015) is grounded in the ongoing statistical reform which is a response to the research crises (Fanelli et al., 2017; Gelman & Loken, 2014; Pashler & Wagenmakers, 2012; Scheel, 2022; Scheel et al., 2020; Schooler, 2014; Starns et al., 2019; Yarkoni, 2022). Specifically, the “New Statistics” movement (Cumming, 2013) and the “Bayesian New Statistics” branch (Kruschke & Liddell, 2018) call for a shift from statistical significance testing to estimation. Furthermore, NHST as practiced by researchers has been criticized for being an inconsistent hybrid of Fisherian and Neyman–Pearson frequentism (Gigerenzer, 2004, 2018; Gigerenzer et al., 2004; Mayo, 2018). For all this reasons, the author has adopted a fully Bayesian approach.
The main feature that sets Bayesian inference apart from NHST is that for each model parameter, a full probability distribution, called a posterior probability distribution or posterior for short, is estimated, rather than a point-estimate with standard error as in NHST. This is possible through the combination of prior probability distributions defined on each parameter and the probability of the data given the prior, as per Bayes’ Theorem. Prior probability distributions represent the researcher’s prior belief that the parameter values have a defined probability distribution (some values are more likely than others). It is common practice in Bayesian inference to use so-called weakly informative priors: these are very generic priors that gently constrain estimation to the exclusion of very unlikely values (like extreme effects or impossible values), while avoiding undue influence on the posteriors. All posterior distributions can be then summarized using quantile-based central intervals, called Credible Intervals (CrIs), which are interpreted as indicating the range of values the specific parameter might take on at a particular probability level (this is unfortunately mistakenly taken as the interpretation of frequentist Confidence Intervals, Cassidy et al., 2019). These CrIs are taken as the basis for inference, without a binary decision as to whether an effect “exists” or not. For a more thorough introduction to Bayesian inference, we refer the reader to Etz et al. (2018), Vasishth et al. (2018), and McElreath (2020).
Before inclusion in the statistical models, vowel duration was logged then transformed to z-scores. Note that z-scoring was done across participants, rather than the usual within-participant transformation. Across-data normalization improves numerical stability during estimation and enhances sampler efficiency by placing predictors on a common scale. Within-participant normalization was not performed, in light of the inclusion of group-level (aka random) intercepts by participant in the models, which obviates the need to standardize data within participant. Speech rate was also logged and z-transformed. A log-transformation is useful since speech rate cannot be negative (much like segment duration) and z-scoring predictors helps with model convergence. Z-scoring of variables also helps with prior specification. Z-scored data was transformed back to their original scale for plotting the model predictions. Very weakly informative priors were employed (see details in the Results section). Prior predictive checks were performed to assess their goodness, which was satisfactory. The models were run with four chains and 2,000 iterations each (1,000 of which for warm-up). The models reported in this paper fully converged. For technical details and the model summaries, see the study repository (link below).
The following section reports the results of two models: a linear model and a model which includes non-linear terms. Note that both models were not pre-registered and that the decision of using non-linear terms in the second model was informed by the results of the linear model. When reporting results in the text, we will adopt 90% credible intervals (CrIs), which indicate there is a 90% probability that the “true” coefficient value is within the CrI range (note that this is often mistaken to be the interpretation of frequentist Confidence Intervals, (Tan & Tan 2010; Foster, 2014). However, a selection of CrIs will also be reported in tabular form.
4.6 Open research practices
The repository of this study can be found at: https://github.com/stefanocoretta/vow-height. The data used in the study is distributed as an R package, available for installation from GitHub: https://github.com/stefanocoretta/coretta2018itaegg. A rendered version of the analysis code of this study, including the code of the models reported here, can be found at https://stefanocoretta.github.io/vow-height/code/01_analysis.html.
5 Results
5.1 Linear modeling
Figure 3 shows the raw data used in the models reported in this and the following sections. The horizontal axis is F1, first logged and then z-scored within each participant (note that in the models, standardization was done across participants, since the group-level effects take care of variation between participants). The vertical axis has vowel duration, again, first logged and then z-scored within each participant. Each vowel is represented with a different color. From the plot, we can see that the relationship between F1 and duration is positive (to different degrees) in /a, e, ɔ/, while it is either slightly negative or perhaps null in /i/ and /u/. The model discussed in this section aims at addressing this relationship.
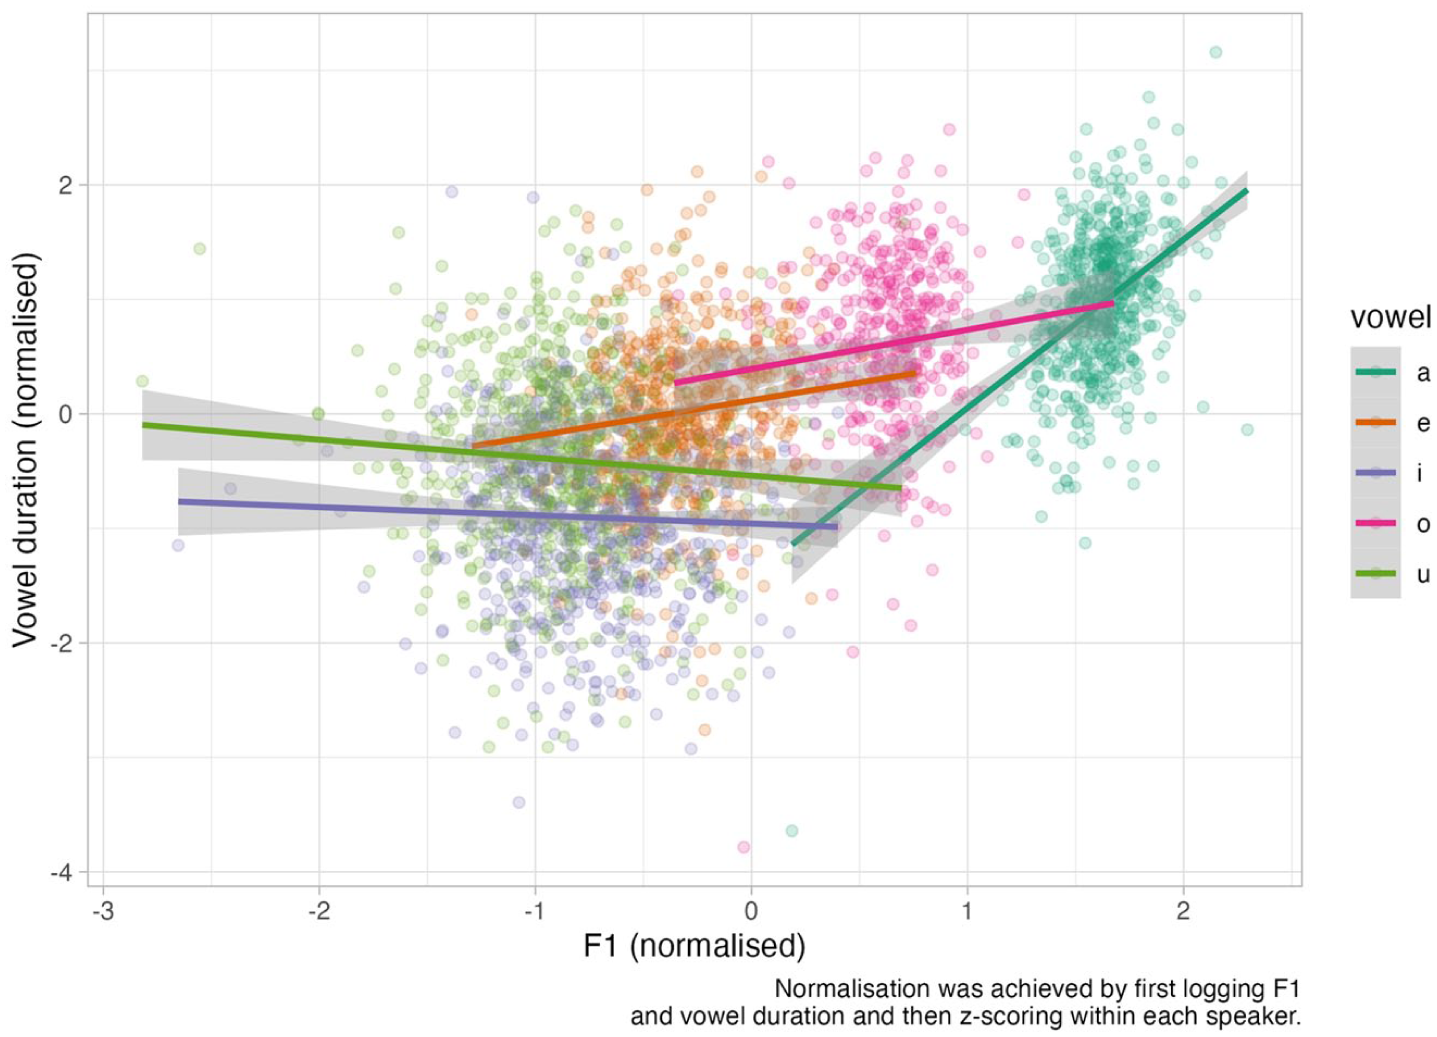
Raw data of F1 and vowel duration, with regression lines by vowel as generated by the ggplot2 smooth geometry.
We fitted a Bayesian linear model using a Gaussian distribution with standardized logged vowel duration as the outcome variable and the following predictors: vowel quality (/a, e, i, ɔ, u/), standardized F1 (z-scores), an interaction between vowel quality and F1, standardized logged speech rate, a group-level (aka random) intercept by speaker and group-level slopes for vowel, F1 and their interaction by speaker. Vowel quality was coded using the indexing method rather than standard R contrasts: this coding allows the model to fit mean vowel duration for each vowel quality, rather than a mix of intercept and differences from the intercept (McElreath, 2019). Indexing in R is achieved by suppressing the intercept with the 0 + syntax. Note that the choice of coding of categorical predictors has no impact on the estimated predictions and effects.
The use of a Gaussian distribution with logged values is equivalent to the use of a log-normal distribution. This is appropriate with segment duration values, since they are bounded to positive numbers (i.e., they cannot be negative).
The following weakly informative priors were used: a Gaussian prior with mean 0 and SD 1 for the intercept and the coefficients of vowel quality and standardized logged F1 (standardization was applied across participants rather than within, since the group-level effects take care of individual differences, as mentioned in the Methods section), a Gaussian prior with mean 0 and SD 0.1 for the coefficient of standardized speech rate, a Half-Cauchy prior with mean 0 and SD 0.1 for the SD of the group-level intercepts and the model’s SD, an Lewandowski-Kurowicka-Joe (LKJ) prior with 2 as the value of the shape parameter. Here is the R code of the model formula:
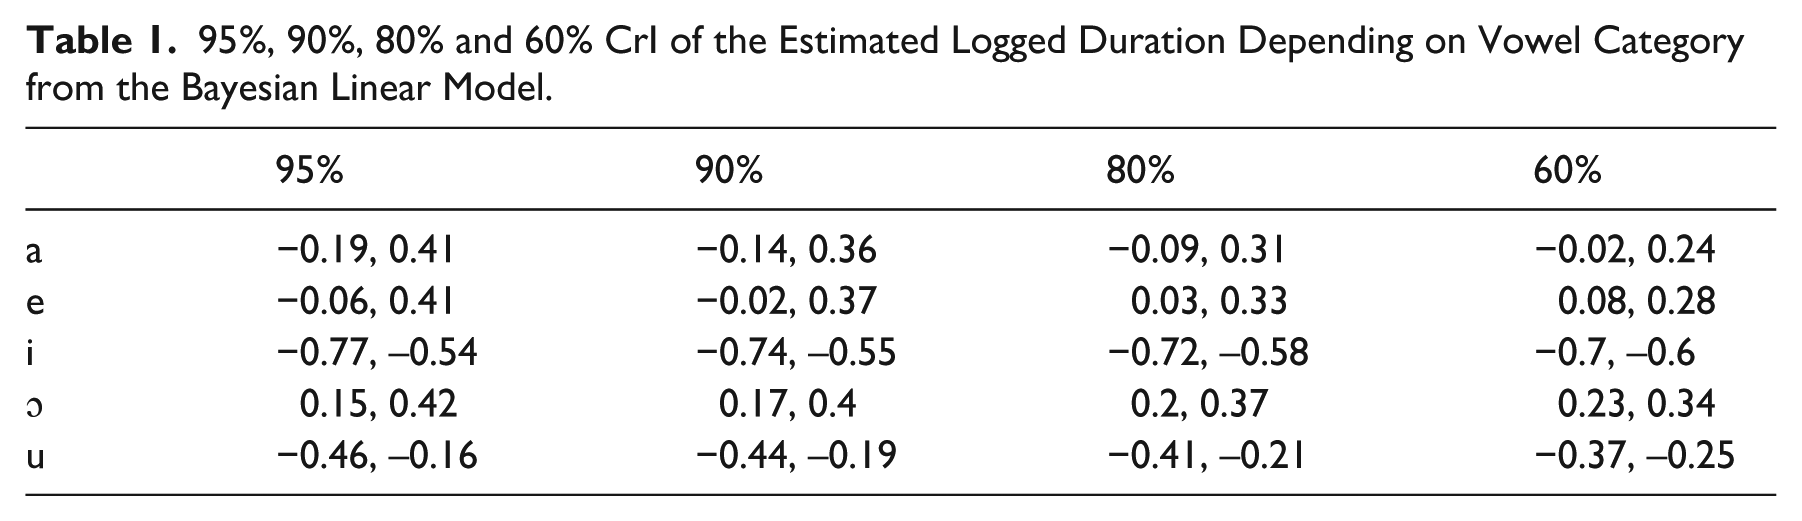
According to the model, the direct effect of F1 on vowel duration (for an average vowel) is an increase between + 0.2 and + 0.35 standard units of logged duration (with a mean of 0.28) at 90% confidence for every standard unit increase of F1. In other words, higher F1 values correspond to longer vowel duration. However, the direct effect of F1 is not sufficient to explain vowel duration: vowel quality exercises an additional direct effect on vowel duration. This additional effect is robust for /i, ɔ, u/ at 95% confidence, given that the 90-80-60% CrIs of each span only positive or negative values (see Table 1). At least for these vowels, duration cannot be explained by F1 alone.
95%, 90%, 80% and 60% CrI of the Estimated Logged Duration Depending on Vowel Category from the Bayesian Linear Model.
Moreover, the direct effect of F1 on vowel duration is moderated by vowel quality. According to the model, the predicted 90% CrI of the F1 effect on vowel duration for each vowel is (from largest to smallest effect) [0.50, 0.80] for /a/, [0.26, 0.63] for /e/, [0.16, 0.54] for /ɔ/, [−0.12, 0.17] for /i/, and [−0.17, 0.14] for /u/. All vowels except /i/ and /u/ show a robust positive effect of F1 on vowel duration. The effect of /i/ and /u/ is much more uncertain, with both negative and positive values, distributed symmetrically around 0. Figure 4 shows the vowel duration as predicted by F1, split by vowel, based on the Bayesian linear model. The dashed line in each vowel panel indicates the mean F1 of each vowel as found in the raw data, for reference.
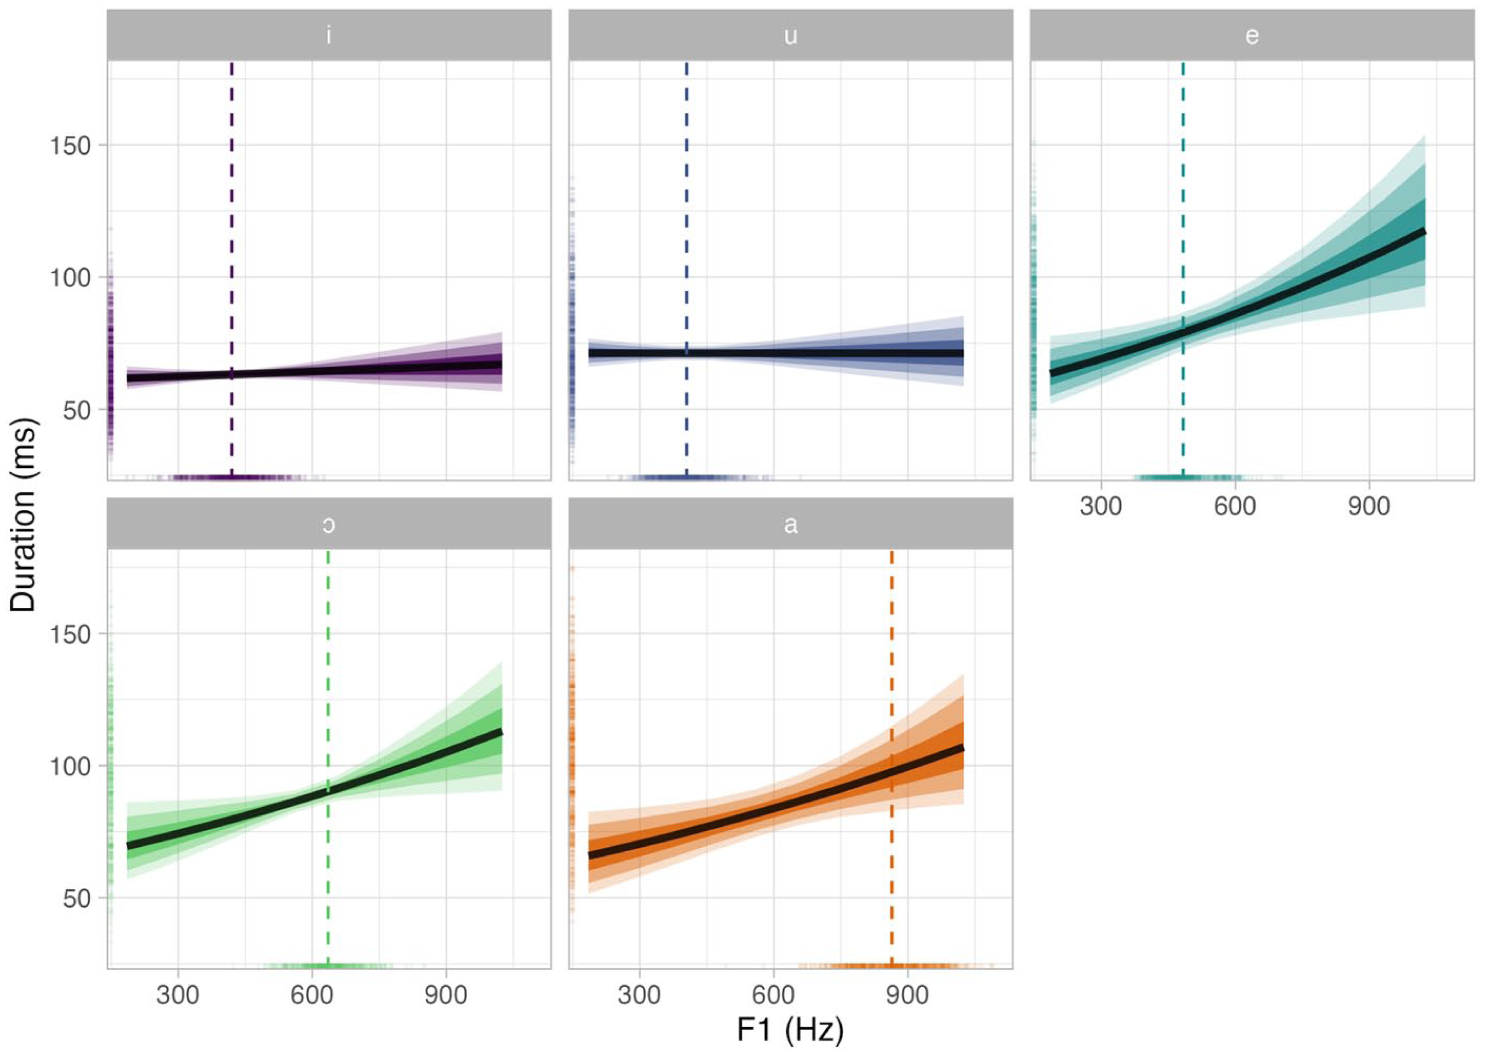
Predicted vowel duration by F1 and vowel (based on Bayesian linear modeling).
The interaction of consonant place of articulation with F1 merits a brief mention in light of the articulatory distance hypothesis. As mentioned in the literature review, both tongue and jaw-related coarticulation could drive the effect of articulatory distance on vowel duration, so that greater lingual and/or jaw displacements correspond to longer duration. Since both tongue and jaw matter in the relationship between distance and vowel duration, we should not observe different effects of F1 (as a proxy of distance) on vowel duration depending on place of articulation. Indeed, the model results do not indicate a clear difference in the effect of F1 by place of articulation. Figure 5 shows the estimated effect of F1 on vowel duration by vowel and by C1/C2 place of articulation. Only the homorganic combinations are shown in the plot (the plot with all the combinations can be found in the online supplement: https://stefanocoretta.github.io/vow-height/code/01_analysis.html). Within each vowel panel, there is no strong indication of difference of F1 effect for the labial/labial combination vs the lingual combinations. We have no explanation for the results of /o/ but note that for the velar and labial context, there is a lot of uncertainty. We leave answering the question of what is happening with /o/ to future work.
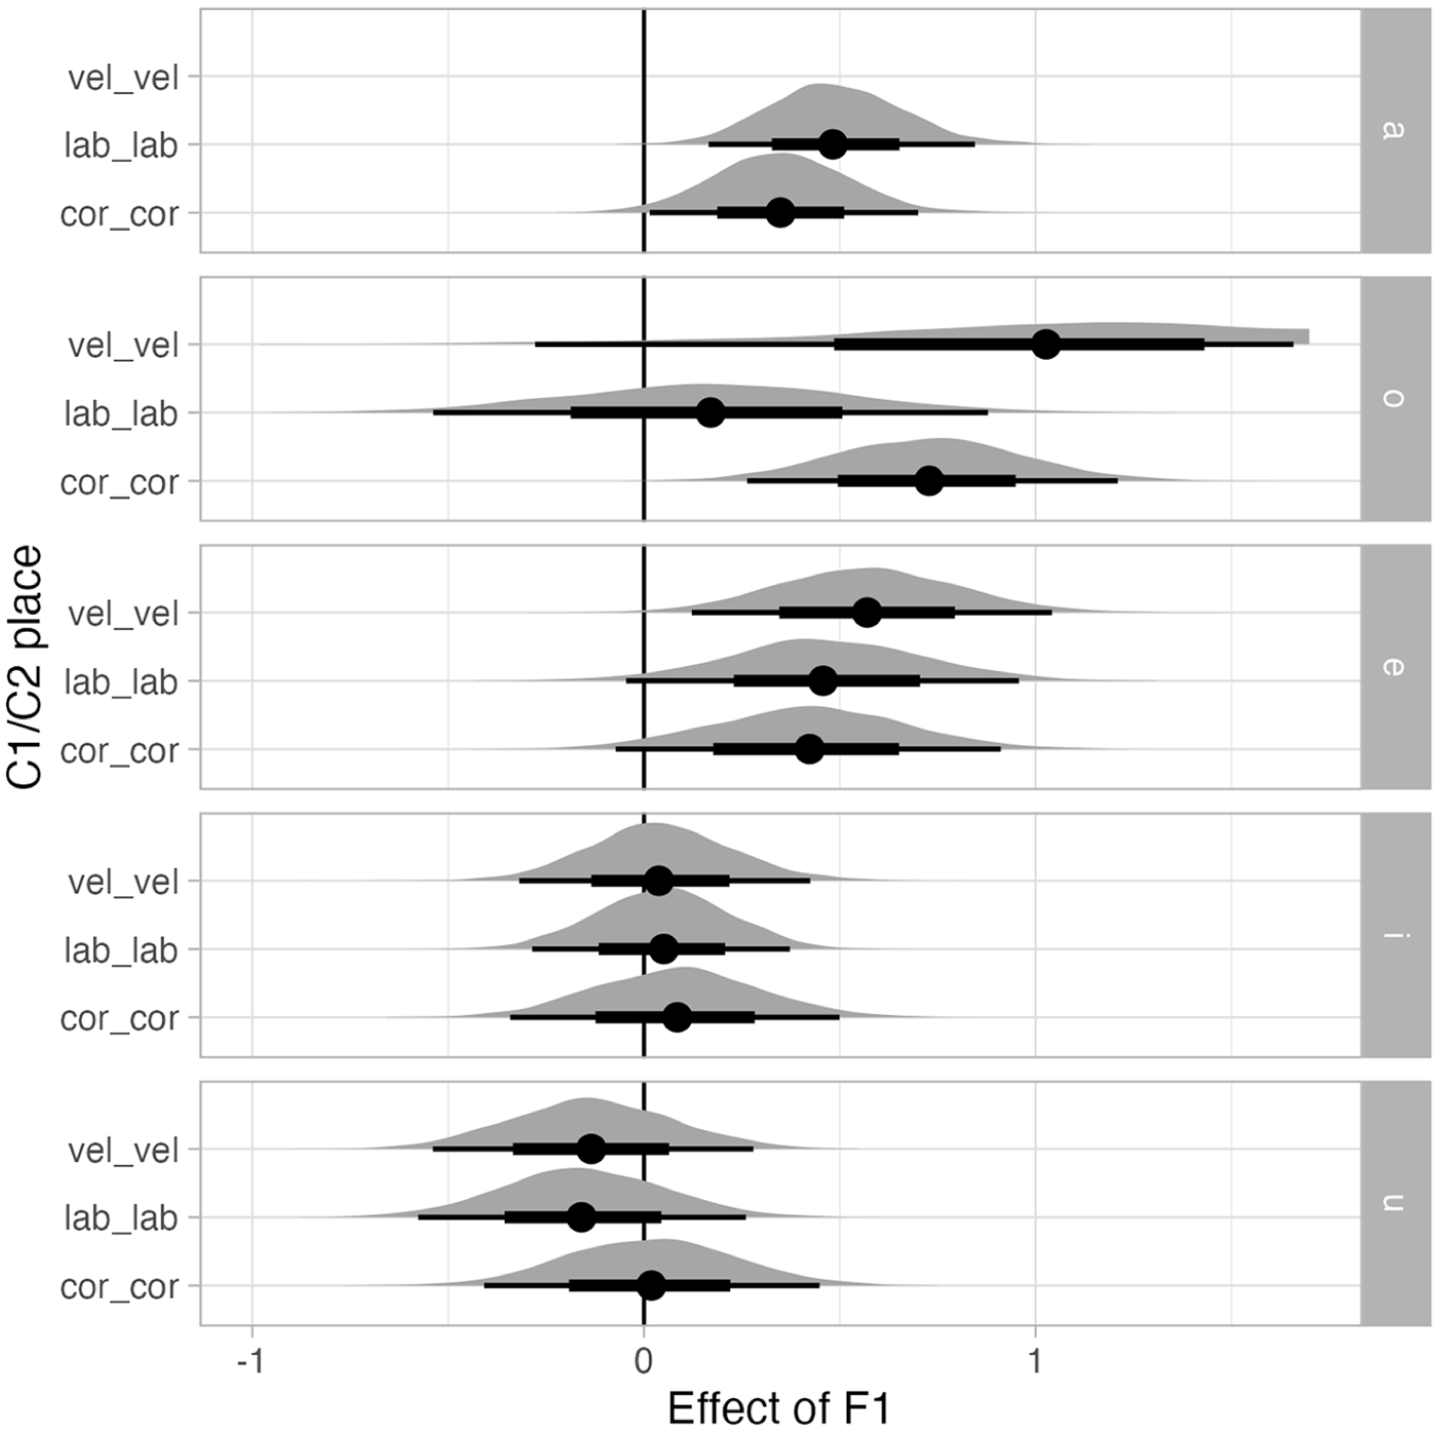
Effect of F1 on vowel duration, by vowel and C1/C2 place of articulation (only homorganic combinations are shown). Based on Bayesian linear modeling.
5.2 Non-linear modeling
The results from linear modeling suggest a potential pattern related to vowel height: the high vowels /i/ and /u/ have possibly no effect of F1 on vowel duration (or if it does, it is smaller than the other vowels), with /e, ɔ, a/ showing a robust effect. In the linear modeling approach of the previous section, the different effect of F1 depending on vowel duration was modeled by the interaction between F1 and vowel category. In other words, the interaction captured the different F1 slope for each vowel. However, when comparing the slopes of each vowel, we can notice that the effect of F1 depends on the height of the vowel.
We can thus assume that the pattern of increasing F1 effect from highest to lowest vowel suggests that the F1 effect is moderated by the specific F1 value itself. In other words, the effect of F1 on vowel duration is not linear: when F1 is low the effect is smaller, when F1 is high the effect is bigger. In terms of statistical modeling, this type of mediation (of the effect of a predictor depending on the value of the predictor itself) can be achieved with non-linear models, such as Generalized Additive (Mixed) Models (GAMMs). Given that a non-linear effect of F1 would capture the interaction between F1 and vowel directly, no F1/vowel interaction term is needed in the non-linear model (the non-linearity of the effect of F1 takes care of the interaction), so the GAMM model does not include the F1/vowel interaction. Indeed, as explained later in this section, the non-linear effect of F1 seems to effectively capture the increasing F1 slope by vowel of the linear model.
A Bayesian GAMM was fitted with a Gaussian distribution to standardized logged vowel duration (z-scores) with the following predictor terms: a parametric effect of vowel (to model differences in average vowel duration by vowel), a smooth term over standardized F1 (to model the non-linear effect of F1), a smooth term over standardized logged speech rate (to model the non-linear effect of speech rate), a factor smooth interaction over F1 by speaker with vowel as a by-variable (to model by-speaker differences of the effect of F1), and a factor smooth interaction over speech rate by speaker with vowel as a by-variable (to model by-speaker differences of the effect of speech rate). We used a Gaussian prior with mean 0 and SD 1 for the intercept and predictors’ coefficients, a Half-Cauchy distribution for the model’s SD and a Half-Cauchy distribution for the SD of the smooth terms. The model’s R code:
We repeat here the hypotheses from the introduction, now reinterpreted in light of the expectations of the non-linear modeling.
A. Articulatory distance: The coefficients of vowel category are practically 0 and the coefficient of F1 is not practically 0.
B. Categorical duration: The coefficients of vowel category are not practically 0 and the coefficient of F1 is practically 0.
C. Physio-categorical: The coefficients of vowel category and F1 are not practically 0.
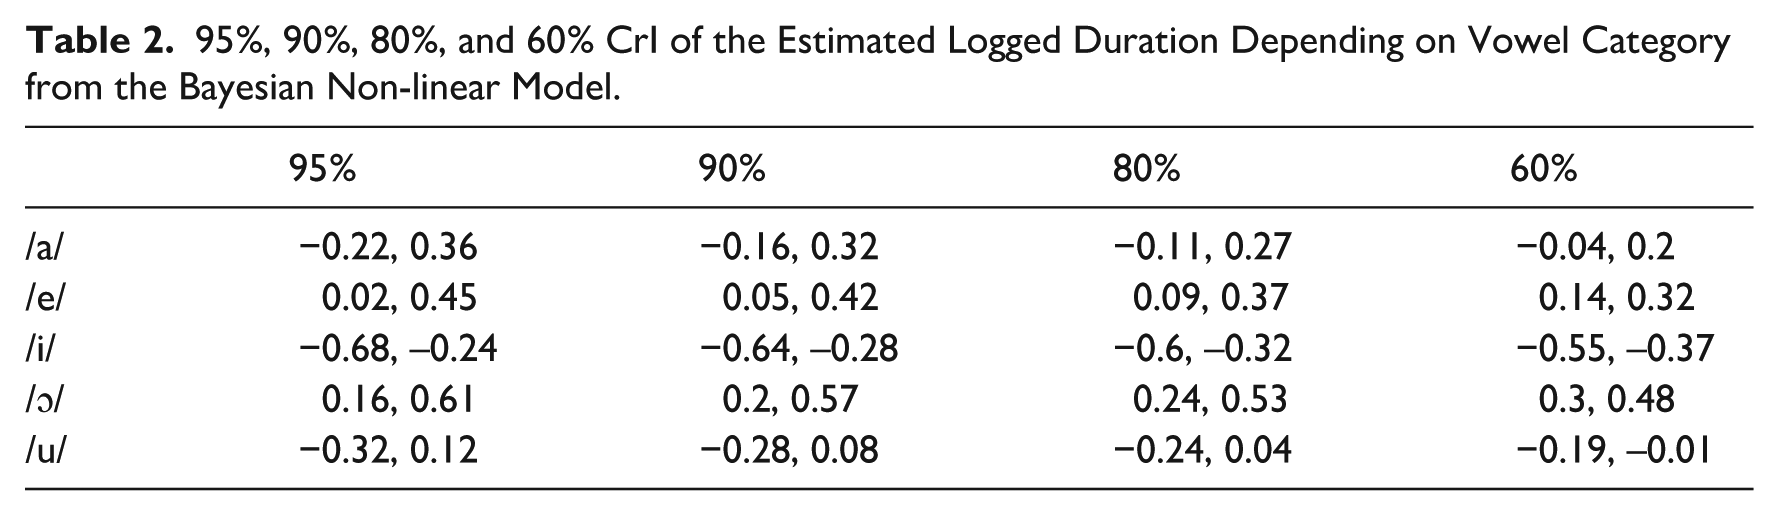
The model predictions are shown in Figure 6. A selection of CrIs are reported in Table 2. Overall, the results of non-linear modeling clearly suggest that the coefficients of the parametric term of vowel are robustly different from 0 (at least for /e, i, ɔ), thus indicating that F1 alone is not sufficient to predict vowel duration. These results are in line with the physio-categorical scenario (C), by which vowel category affects vowel duration both directly and via F1, once speech rate is accounted for. This outcome implies that vowel duration targets should be present in each vowel category representation (whatever this might look like depending on the specific linguistic model) and that they are not just the result of bio-mechanical processes.
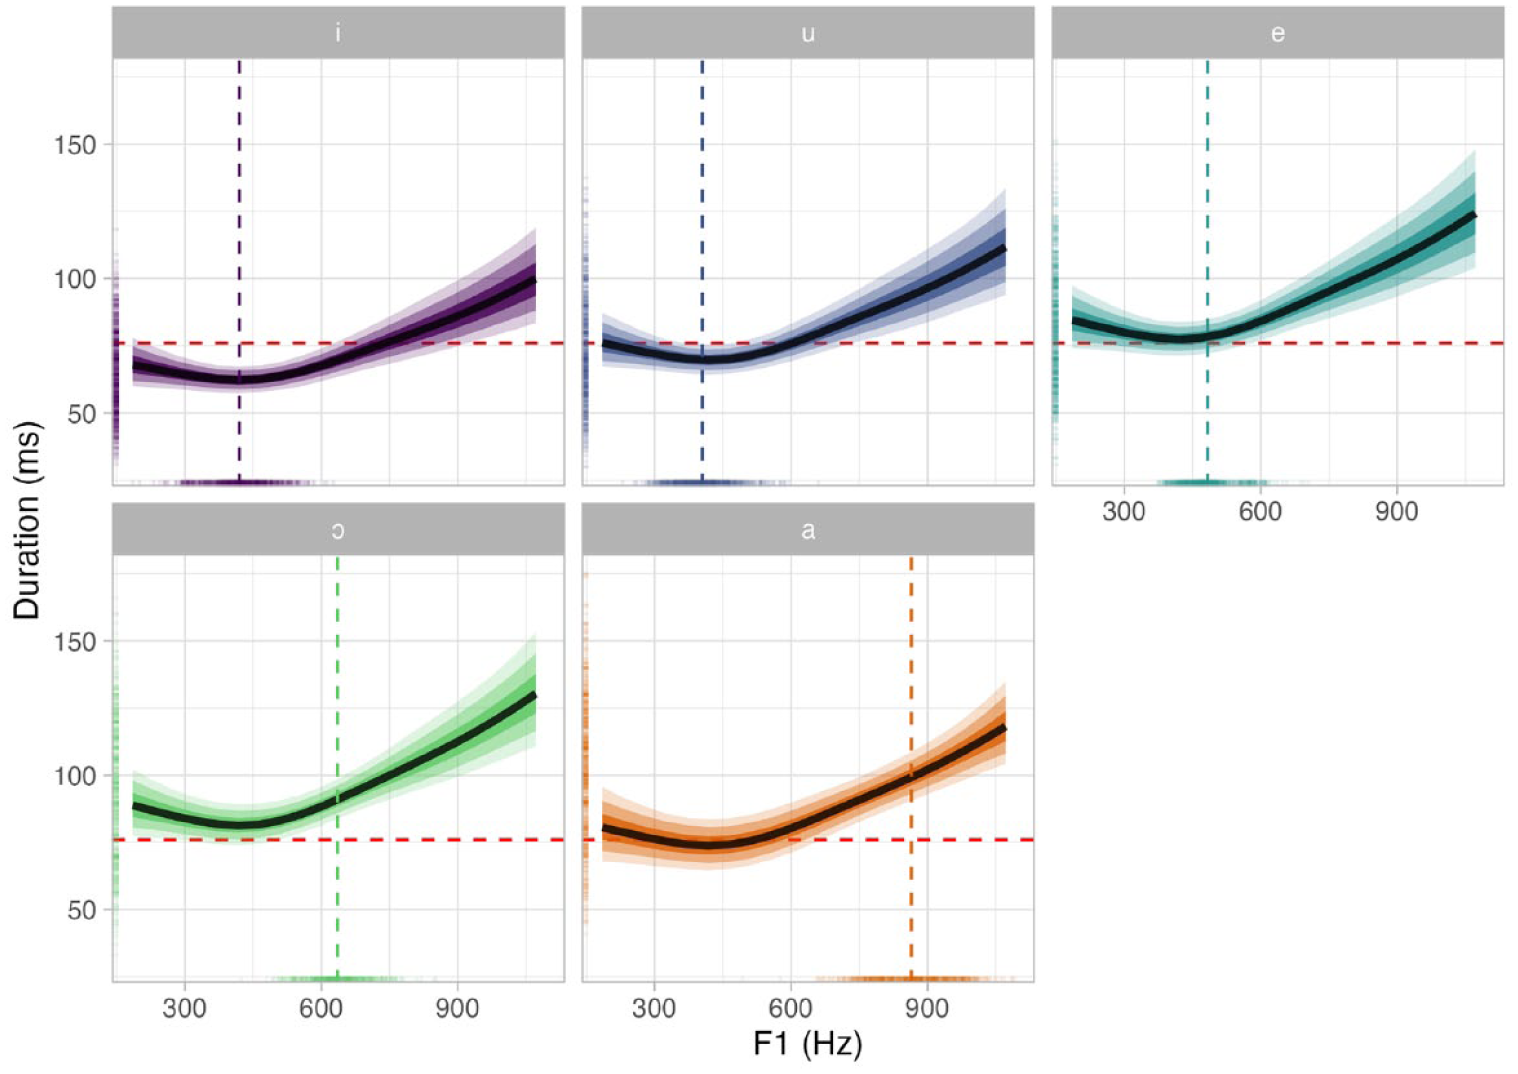
Predicted vowel duration by F1 and vowel (based on Bayesian non-linear modeling). The vertical dashed bars represent the mean F1 for each vowel individually as obtained from the raw data. The horizontal red dashed line corresponds to the overall mean vowel duration which is useful as a reference to compare the height of the predicted curves. The colored ticks on the axes represent the raw observations.
95%, 90%, 80%, and 60% CrI of the Estimated Logged Duration Depending on Vowel Category from the Bayesian Non-linear Model.
Moreover, the results of the effect of F1 on vowel duration show that the effect is not linear: at higher F1 values (i.e., the lower the vowel), the effect is stronger. At lower F1 values (i.e., the higher the vowel), the effect magnitude decreases until it is basically null. Possibly—although with great uncertainty—for vowels with F1 lower than 400 Hz, the effect reverses and lower F1 values correspond to a slightly shorter vowel. Figure 6 includes vertical dashed lines that represent the observed mean F1 for each vowel (as it was done in Figure 4). Interestingly, when looking at Figure 6, one can see that the mean F1 for /i/ and /u/ falls on the inflection of the predicted effect of F1 on vowel duration, while the mean F1 of the lower vowels is placed on the steeper portions of the curve. This is in line with the pattern observed in the linear model: the lower vowels had a stronger F1 effect, as modeled by the F1/vowel interaction. In other words, the F1/vowel interaction of the linear model is here captured by the non-linearity of the F1 effect in the non-linear model. It is possible that ceiling effects are at play on high vowels: high vowels can only be as high as the palate allows, while low vowels allow for much more variation in terms of jaw lowering. Future articulatory work should look at this aspect.
6 Discussion
The results of the analysis of vowel duration in Northwestern Italian show a robust effect of vowel category coexisting with an effect of articulatory distance as proxied by F1. In other words, the distance that the articulators have to travel to reach the target of any particular vowel is not sufficient to explain vowel duration (everything else being equal). However, some of the variation in vowel duration can be explained by articulatory distance (assuming F1 is a good proxy of articulatory distance). These patterns indicate that scenario (C), the physio-categorical scenario, is the likely scenario:
C. Physio-categorical: The vowel category determines F1 which in turn determines vowel duration, but vowel duration is also partially determined by vowel category.
In terms of cognitive representation of vowel duration, the case of Northwestern Italian shows that the duration of each vowel is not simply a bio-mechanical product of articulatory distance. Further processes or vowel-specific durational targets are necessary to fully explain vowel duration. The specific nature of such processes or durational targets is heavily dependent on the framework or model of production and perception one assumes, and a full treatment will not be attempted here. This procedural and representational characteristics can in fact be accommodated in a variety of “phonetological” frameworks (Coretta, 2023), including speech, phonetic and phonological models such as Bermúdez-Otero (2015), Browman and Goldstein (1992), Turk and Shattuck-Hufnagel (2020). In principle, no specific model has an advantage in dealing with the patterns described in this paper, and the development of an analysis within those models is left to future work.
6.1 Diachronic and developmental considerations
Toivonen et al. (2015) argue that in American English and Swedish, while one can observe an overall positive relationship between F1 and vowel duration when pooling data from all vowels, this relationship disappears when looking within each vowel. They thus argue that a bio-mechanical effect of tongue height, while it might have constituted the source of the gradient relationship between tongue height and vowel duration, is now fully controlled by specific durational targets. The results from Toivonen et al. (2015) together with those presented in this paper speak to the question of how the relationship between tongue height and vowel duration emerges and changes diachronically and/or developmentally.
Tentatively, I argue that the diachronic/developmental path begins with scenario (A), where a fully bio-mechanical effect generates the duration-tongue height relationship, then morphs into scenario (C), where the bio-mechanical effect is reinterpreted categorically and enhanced (e.g., Carignan, 2021; Stevens & Keyser, 1989) to form specific durational targets as observed here in Northwestern Italian, with the subsequent loss of the original bio-mechanic effect to produce scenario (B) as observed in Toivonen et al. (2015) in other languages. Once again, the details of this process vary depending on the adopted framework, although a promising one is the life cycle of phonological processes by Bermúdez-Otero (2015), which stipulates the trajectory just described diachronically through the processes of phonologisation (from a bio-mechanical effect to a phonetic effect under the control of the speaker, but not yet fully phonological, A to C) and that of stabilization (from a phonetic effect to a fully phonological process, C to B). Developmentally, an interesting point comes from a study by Buder and Stoel-Gammon (2002), which suggests that children of Swedish do not seem to show intrinsic vowel differences before about 30 months of age. If this is indeed the case, this would make a good first piece of evidence for a developmental trajectory of intrinsic vowel duration differences. Both the diachronic and developmental aspects of intrinsic vowel duration should be look into in future meta-analytical work.
Finally, the non-linear nature of the effect of F1 and the different duration targets of each vowel further indicate that, at least in Northwestern Italian, “phonological” height is not sufficient, and instead one has to consider the actual articulatory distance.
6.2 Limitations
Two main caveats are in order. First, F1 is a good correlate of height (Chládková et al., 2015; Toivonen et al., 2015), but not a perfect one. Future work should look at articulation measures to assess “height” in a more direct way, or better gestural duration (along the lines of whas was done in Turk et al. (1994). 4 Second, some of the target words were real words (9 out of 43). Future studies should address a potential difference in effects between real and nonce words directly, by manipulating lexical status as part of the design (in the design of the study that produced the data analyzed here, the selection of target words was based on getting all of the possible combinations of vowels and stops, which has led to a minority of the words being real words).
To conclude this discussion, future investigations of the so-called intrinsic vowel duration phenomenon should cover a wider variety of languages, should attempt to replicate the results from previous work—including the present one—using articulatory measures and greater sample sizes to decrease uncertainty of the estimated effects, and develop framework-specific accounts of the observed patterns once such patterns have been more robustly established (on this last point, see Gigerenzer, 2018).
7 Conclusion
This study set out to investigate whether articulatory distance alone (operationalized as the first vowel formant, F1) can explain vowel duration in Northwestern Italian. The results of Bayesian linear and non-linear modelling of vowel duration shows a robust effect of vowel category coexisting with an effect of F1. We argued that these results match a scenario in which vowel category determines F1 and F1 determines vowel duration, but vowel category has also a direct effect on vowel duration. Specifically, we found a non-linear effect of F1 on vowel duration, by which predicted duration decreases until about 400 Hz, plateaus, then increases. Given the different F1 means of each vowel category, the observed relationship between vowel duration and F1 within each category is predicted to vary: this matches the results of the linear model, which suggested that the lowest vowel /a/ has a stronger positive effect of F1, while the high vowels /i/ and /u/ have virtually no effect. Finally, and crucially, vowel category had a direct effect on vowel duration (both in the linear and non-linear model), indicating that F1 alone, or articulatory distance, is not sufficient to correctly explain vowel duration. Rather, I suggest that further processes or durational targets of each vowel should are necessary to fully explain vowel duration (the “how” depends on specific linguistic models). The details of such processes and representations are left to future investigations.
Footnotes
Appendix
Acknowledgements
I am deeply thankful for the very constructive discussions we had with Dr Stephen Nichols, Dr Donald A. Morrison, and Dr Ricardo Bermúdez-Otero about the results presented here.
Funding
The author received no financial support for the research, authorship, and/or publication of this article.
Ethics and consent
Ethics approval to undertake this work was obtained from the University Research Ethics Committee (UREC) of the University of Manchester (REF 2016-009976).
Data accessibility statement
The repository of this study can be found at: https://github.com/stefanocoretta/vow-height. The data used in the study is distributed as an R package, available for installation from GitHub: https://github.com/stefanocoretta/coretta2018itaegg. A rendered version of the analysis code of this study, including the code of the models reported here, can be found at ![]() .
.