
Abstract
The study aimed to examine whether L1 speech rhythm affects L2 speech by assessing how the speech rhythm of Japanese L2 English speakers differed from native speakers. We chose Japanese and English because they differ markedly in the phonological properties that likely contribute to speech rhythm. Speech rhythm was measured by the variability of vowel and consonant intervals using rate-normalized rhythm metrics (VarcoV and VarcoC; nPVI-V and nPVI-C) and %V. The study utilized recordings of spoken sentences in English by 10 native Australian English speakers; and in English and also in Japanese by 10 native Japanese speakers (who had limited experience in speaking English). Experiment 1 compared the rhythm of L1 English (by measuring 1,750 vowels and 3,093 consonants from 20 sentences) and L1 Japanese (1,923 vowels and 2,097 consonants from 10 sentences). The results showed that for all measures, Japanese had reduced durational variability in both consonant and vowel intervals compared with English. In Experiment 2, we examined the rhythm characteristics of L1 and L2 English using 40 sentences (including the 20 in Experiment 1). The results showed that vowel and consonant intervals were less variable in L2 (Japanese English) than in L1 (Australian English) speech, mirroring the results of Experiment 1. Overall, the results are consistent with the proposal that L1 (Japanese) speech rhythm influenced L2 (English) speech.
1 Introduction
Different languages can have different vowel and consonant sounds (segmental characteristics), and also different ways of using intonation, timing, and stress (suprasegmental characteristics). This raises the question of whether somebody’s first language (L1) will influence how they speak a second language (L2). Studies have shown such an influence, mostly by examining segmental characteristics (e.g., Bohn & Flege, 1992; Kewley-Porr et al., 1996; Tsukada, 1999). However, an L1 influence is less clear in studies that have examined suprasegmental features (e.g., Grenon & White, 2008; Li & Post, 2014; White & Mattys, 2007), despite that the suprasegmental characteristics of L2 speech can also be distinctive (see Anderson-Hsieh et al., 1992). For example, Grenon and White (2008) tested the difference between L1 and Japanese L2 speakers of Canadian English on a suprasegmental measure of the intraclass variability of vowels and consonant duration. They summarized their results by stating that the L2 productions were essentially comparable to those of the native Canadian English speakers.
The measures that Grenon and White (2008) used were %V, VarcoV, and rPVI_C (see Table 1 for the formal definitions), measures that are part of what traditionally have been called speech “rhythm metrics.” In general, the results of studies investigating whether L1 speech rhythm (as defined by these metrics) influences L2 rhythm have been inconsistent. For instance, White and Mattys (2007) found that when Spanish or English L1 speakers spoke English or Spanish as an L2, their first language rhythm appeared to influence the rhythm of their L2 speech. Yet, an influence of first language rhythm was not observed on a traditional rhythm measure (VarvoV), when French speakers (Tortel & Hirst, 2010) or Mandarin and Cantonese speakers (Mok & Dellwo, 2008) produced British English. We followed up these studies by identifying why the results of past studies may have not been clear cut, and based on these considerations, we designed our study to facilitate observing an effect of L1 on L2 rhythm if there is one. Before we present the details of this study, we outline the factors that we considered.
Summary of Rhythm Metrics Used.
The first factor to be considered is a general one and concerns whether what we have been calling the traditional speech rhythm metrics actually capture speech rhythm. Although tackling this issue is more appropriate for an article aimed at specifically addressing this concern, it is fitting to briefly review the evidence that the measures capture some aspect of speech rhythm. The main metrics created to measure speech rhythm are based on the view that rhythm is related to the temporal aspects of speech and use the durational properties of vowels and consonants (see Table 1).
Evidence consistent with the proposal that speech rhythm relates to the temporal information comes from studies such as that by Ramus et al. (1999), which showed adult French listeners could distinguish Japanese from English even if the signal was resynthesized to leave only durational cues. This has been shown to even occur with babies. For example, French babies (tested within the first 5 days after delivery) could distinguish English from Japanese that had been low pass filtered (cutoff at 400 Hz) to reduce segmental information (Nazzi et al., 1998). In a more direct study of rhythm perception and the current measures, Fuchs (2023) recently showed that the vowel rhythm metrics, nPVI-V, VarcoV, and a consonantal one, VarcoC (see Table 1) accounted for the bulk of the explained variation in rhythm perception.
There may, however, always be doubts that a single parameter such as speech timing can adequately index speech rhythm. Bearing this in mind, it is important to emphasize that the specific interest of this study is simply whether an analysis (based on the traditional rhythm metrics) of L1 Japanese speaking their native language and L2 English provides evidence consistent with L1 influencing the suprasegmental characteristics of L2 speech. We will revisit the issue of the measurement of rhythm in Section 3.3.
Another concern about the rhythm metrics is that they may be affected by nuisance variables. That is, some rhythm metrics may be unduly influenced by aspects of the stimuli other than speech rhythm. For example, indices of rhythm include the standard deviations of the duration of the vocalic (ΔV) and consonantal (ΔC) intervals or the proportion of vocalic intervals (%V, Ramus et al., 1999). However, ΔV and ΔC have been found to be correlated with speaking rate such that faster speech rates result in less measured variability (Grabe & Law, 2002). This likely creates a confound because L2 speakers may speak at different rates than native ones.
There are, however, speaking rate-normalized interval measures of vowel and consonant intervals (e.g., VarcoV/C, Dellwo et al., 2006), and these metrics also tend to be better associated with rhythm perception and more robust. For example, Fuchs (2023) found that the variation in the perception of rhythmicity could only be accounted for by rhythm metrics that had been normalized for speech rate. This finding meshes with earlier work (e.g., Wiget et al., 2010) that found that the VarcoV and nPVI-V measures were preferable because they were robust to variation in speech rate and relatively robust to variation in sentence materials, speakers, and transcribers. Furthermore, Loukina et al. (2011) and Fuchs (2016) have endorsed the nPVI-V and VarcoV measures as the most reliable ones. Note that there is also a rate-normalized version for consonant intervals (nPVI-V/C, Low, 1998; Low et al., 2000).
A potential criticism of using speech rate normalized measures is that this procedure appears to implicitly assume that the durational manifestations that are associated with rhythm (e.g., in English, strong and weak syllable alterations) stay the same in slow and fast speech. The results of Strangert (1985) indicate that this is, in fact, the case. She tested whether prominence structures (stressed/unstressed syllables) change between different speech rates by having participants vary their speech between fast, normal, and slow speech rates. Then, she calculated ratios between the mean unstressed syllable duration and the stressed syllable duration. She found that the stressed/unstressed syllable distinction was essentially maintained at different speech rates. Taking all of this into account, this study only used metrics that are speech rate normalized or appear to be unaffected by speech rate (e.g., Dellwo & Wagner, 2003 showed that there was no correlation between %V and speech rate). The metrics this study used are listed in Table 1.
In addition to speaking rate, studies have shown that at least some rhythm metrics are sensitive to such things as the vowel and consonant segmentation procedures (Gut, 2012). Likewise, it has been shown that different speech elicitation procedures (e.g., read speech vs. spontaneous speech) can produce different nPVI-V scores (c.f., scores for Spanish in Thomas & Carter, 2006 and White & Mattys, 2007). Furthermore, when different speech materials are used (e.g., when languages are being compared), it has been shown that the selection of test sentences can affect rhythm scores (Arvaniti, 2012).
Given these concerns, care needs to be exercised in the design of a study to avoid these potential measurement issues. So, in addition to using measures that are not influenced by speech rate, we implemented consistent segmentation procedures (see Section 2.1) and the same elicitation procedures (read speech). For the cross-language contrast (L1 vs. L2), we selected sentences at random from phonetically balanced corpora (i.e., sentences containing phonemes according to their frequency of occurrence in a language, Gibbon et al., 1997).
The second factor is sample size, which is an important factor in estimating any effect. There is a trade-off between collecting more data to increase the informativeness of a study and the restriction on sample size due to the resources that are available (Lakens, 2022). A problem with past studies is that some may have been underpowered. For instance, White and Mok (2018) tested only five participants who each read aloud three prose passages; Mok and Dellwo (2008) tested six Cantonese and five Mandarin speakers who each read aloud two prose passages; Li and Post (2014) tested five participants in two L2 groups who each read aloud 20 sentences; and Grenon and White (2008) tested six L1 Japanese and six L1 English speakers who each read aloud five sentences.
Simply based on participant numbers, these studies are underpowered. However, because both participants and items are random variables, a single linear mixed effect (LME) model analysis can be conducted to take account of both (Baayen et al., 2008). In this regard, Brysbaert and Stevens (2018) have pointed out that a power analysis of LME models should be based on the total observations per condition. In the studies listed earlier, the total number of vowels and consonants produced was not specified, so it is difficult to evaluate their power. We used the mixedpower package (Kumle et al., 2018) to estimate how many observations would be required for a power of 0.8 to detect an effect for the key comparison (see Section 2.1).
Another factor that may have contributed to divergent study outcomes concerns the degree of difference in rhythm between L1 and L2. Given that the traditional rhythm metrics may be noisy, one thing that can be done to facilitate detecting an effect of L1 rhythm on L2 speech is to examine the situation where the rhythm of the first language and second language are substantially different, especially with respect to likely variability in segment duration. So, we chose two languages that are often cited as having different speech rhythms, English and Japanese (Tajima et al., 2003). Japanese and English may differ in their rhythm for several reasons. For instance, in her summary of why Japanese may have a different perceived rhythm in comparison to English, Beckman (1982) argued that, for an utterance of comparable length, there were two major differences between Japanese and English. One is that because the syllabic structure is simpler and vowels are usually much shorter in Japanese, the Japanese utterance will likely have more syllables than the English utterance, and such a difference would be expected to make syllable durations more variable in English than in Japanese. The other is that the Japanese syllables will lack the radical variations in length due to the lexical stress that the English syllables will have.
One property of Japanese that Beckman (1982) did not specifically mention was its mora structure. Mora can be viewed as components of syllable structure. There are five types of mora: CV, CCV, V, a nasal coda usually represented as N, and a geminate consonant, signified as Q, that represents the doubling of a consonant that follows it. According to Otake et al. (1993), more than 60% of all possible morae are of the simple CV type. It is tempting to suggest that Japanese rhythm is a product of the durational properties of the morae. Indeed, it has been suggested that morae have an approximately equal duration (Jinbo, 1980).
However, a reason that Beckman may not have mentioned morae is that although they are important in Japanese phonetics, phonology, and speech processing, there is considerable debate as to how and whether they affect speech rhythm (Beckman, 1982; Warner & Arai, 2001). Warner and Arai (2001) propose that the mora rhythm of Japanese is not due to within-mora durational compensation per se (see Kawahara, 2017), but due to phonological and structural factors that listeners use in parsing speech. They provide details of the general factors for why Japanese might be rhythmically different from English. These factors include the following four: (1) The lack of an effect of pitch accent on duration. That is, Japanese has been considered a pitch accent language in which lexical accent is realized almost solely by pitch (Hoequist, 1983; Kaiki et al., 1992). (2) The lack of reduction of unaccented vowels in Japanese (Tsujimura, 1996). (3) The lack of an opposition or alternation between accented and unaccented vowels in Japanese. Indeed, Mori et al. (2014) showed large differences in the variability of vowel duration in function versus content words for English and Japanese. That is, for function words, English speakers shortened reduced vowels to less than 60% of the mean duration, and for content words, lengthened stressed vowels to about 140%–150%. On the contrary, Japanese speakers varied vowel duration within a range of less than 40% of their mean irrespective of stress placement. (4) The statistical predominance of CV syllables in Japanese (Kubozono, 2015; Otake, 1990).
For current purposes, what is important is that many of the factors cited by Warner and Arai (2001), especially vowel duration variability (as per the Mori et al., 2014 study), should be readily indexed up by the current rhythm metrics because they were designed to specifically measure duration variability.
It is important to point out that simply testing languages that have very different rhythm characteristics does not guarantee that an influence of L1 on L2 rhythm will be found (assuming that there is one). For instance, as mentioned, Grenon and White (2008) used two rhythm metrics (VarcoV and %V) and found no difference between Japanese L2 English scores and native English ones (as mentioned later for a possible reason). So, in addition to language selection, it is important that the study design incorporates the factors listed earlier as well as the following one.
The final factor concerns the stage at which to best test L2 learners. There is evidence that the L2 rhythm shifts toward the L1 pattern as a function of L1 use and exposure. For example, in a small-scale study, White and Mok (2018) showed that after residing in English-speaking countries for 12 months, the rhythm of five Cantonese L1 speakers’ English productions showed a clear shift to an English speech rhythm (as measured by VarcoV and %V). This change toward the L1 rhythm might explain why Grenon and White (2008) found no significant difference between the VarcoV and %V scores of Japanese L2 speakers of English and native speakers. That is, Grenon and White tested Japanese English speakers who had taken intermediate or advanced course level in English and spent on average 2 years in a country where English was spoken. It is possible, then, that part of the reason that they did not observe an effect of L1 on L2 rhythm was because their participants’ experience in producing English had reduced the influence of their L1 Japanese rhythm. Given this, it would be best to test for an L1 influence on L2 speech rhythm by selecting speakers who had relatively little experience speaking in their L2. So, this study recruited native Japanese learners of English whose experience in speaking English was limited (see Section 2.1, Experiment 2).
In this study, two experiments were conducted that incorporated the factors mentioned earlier. Before examining whether an L1 rhythm transfers to an L2 (Experiment 2), it is crucial to first demonstrate that the rhythms of native speakers of the languages (in this case Japanese and English) are different as measured by the rhythm metrics employed in the L2 study. Although this may seem a basic requirement, it is worth pointing out that Grenon and White (2008) did not find a significant difference in VarcoV scores between the native Japanese and English productions. Thus, the aim of Experiment 1 was to confirm that the rhythm measures we will use (see Table 1) do indeed distinguish Japanese from English speech rhythm.
2 Experiment 1. Variability in Japanese and English speech segment durations
Based on the relevant durational properties of spoken Japanese and English (e.g., that stress in English typically produces high variability in vowel durations, as discussed earlier), it was hypothesized that compared with Japanese, English would have higher variability in vowel durations (i.e., higher VarcoV and nPVI-V). It was expected that the vowel proportion measure (i.e., %V) would be larger in Japanese compared with English (Grenon & White, 2008). This is because, compared with English, Japanese has more vowel instances due to its relatively simple syllable structure (Otake, 1990); conversely, Japanese has fewer consonant instances than English due to the wider range of syllable structures in the latter. For consonants, it was expected that stress in English would induce durational contrasts (e.g., Cho & Keating, 2009) and that this would be absent in Japanese, so VarcoC and nPVI-C would be higher in English. Likewise, the different syllable structures between the two languages might contribute to differences in consonant variability. That is, the simple structure of Japanese may allow for more consistent consonant durations compared with English which has more diverse syllable structures including consonant clusters.
2.1 Method
2.1.1 Participants
Ten Japanese and 10 Australian English female speakers participated. All of the speakers resided in Sydney at the time of recording. The Japanese speakers (Mage = 27.5 years, ranging from 22 to 31 years) consisted of 10 “inexperienced speakers” of English whose mean length of residence (MLOR) in Australia was relatively short (MLOR = 2.43 months, ranging from 1 week to 6 months). All participants were either university graduates or undergraduate students who had begun to learn English as a foreign language in Japan at approximately age 13. Importantly, as students in secondary school, their compulsory English education classes were conducted under the Course of Study (2011–2019) unlike the revised Ministry of Education, Culture, Sports, Science and Technology (MEXT) (2019) Course of Study that focused more on a grammar-translation method than conversation and speaking English. As such, these participants were inexperienced speakers of English in daily life.
The 10 monolingual Australian English speakers were students recruited at Western Sydney University (Mage = 26.1 years, ranging from 19 to 34 years). All participants reported no history of speech, vision, or hearing problems. The research was approved by the human research ethics committee at Western Sydney University (H11018). Written informed consent was obtained from each participant before the experiment.
2.1.2 Materials
The materials consisted of (Australian) English and Japanese speech segments, all produced by native speakers. More specifically, the English materials were 1,750 vowels and 3,093 consonants (total N = 4,843) segmented from 20 spoken sentences selected from the Harvard Corpus (IEEE, 1969; see Supplemental Material). The Japanese materials were 1,923 vowels and 2,097 consonants (total N = 4,020) segmented from 10 spoken sentences (spoken in standard “Tokyo” Japanese) selected from an IBM Research corpus (as used by Yamada et al., 2008; see Supplemental Material). The selection of sentences from phonetically balanced English and Japanese sentence lists was aimed at having phoneme frequencies as they typically occur in English and Japanese, respectively. Although the IEEE Harvard corpus is well documented, there were no details provided by Yamada et al. (2008) concerning how the list they report was constructed. Given this, some caution needs to be exercised in referring to the current materials as phonetically balanced.
2.1.3 Recording
The audio recordings of the spoken sentences were conducted in a sound-treated recording booth at The MARCS Institute, Western Sydney University. The Japanese and English speakers were asked to read the list of Japanese and English sentences, respectively, one at a time, out loud in a neutral tone while being recorded. Participants practiced reading the sentences silently to themselves before reading them aloud. Participants were told to speak in their normal conversational voice at a comfortable rate. The set of sentences was recorded twice for each participant, but only the first production was used unless errors or disfluencies occurred in the first production. Each sentence was presented for participants to utter on a 17″ LCD computer monitor using DMDX software (Forster & Forster, 2003). The audio recordings were made using an externally connected lapel microphone (an AT4033a audio-technica microphone) in 44.1 kHz, 16-bit mono.
2.1.4 Segmentation procedures
Vowels and consonants were segmented using Praat (Boersma & Weenink, 2013) by following the commonly used conventions (White & Mattys, 2007). For example, the placement of a vowel–consonant boundary was determined by the end of the pitch period before a break in formant structure associated with a significant drop in waveform amplitude. Additional criteria used to place the boundary in certain contexts included the vowel offset being glottalized, a change in the shape of successive pitch periods (e.g., lengthening or doubling), the onset of visible frication before fricatives, the appearance of nasal formant structure and a waveform amplitude minimum before nasals, and the beginning of the pitch period at the onset of vocalic formant structure being associated with the appearance of pitch periods consistent with the body of the vowel. Aspiration following stop release was included within the consonantal interval.
2.1.5 Acoustic measurements
All the segmented vowel and consonant intervals (as mentioned earlier) were extracted using a tailored Matlab script. Following widely used conventions (White & Mattys, 2007), pauses and disfluencies were excluded. Then, a set of rhythm metrics was used to measure the global durational variability of vowel and consonant intervals (VarcoC, VarcoV, and %V) and the local pairwise variability (nPVI-V and nPVI-C).
2.1.6 Power analysis
The data were analyzed using linear mixed models (further details are mentioned later) as such models allow for between-participant and between-item variance to be simultaneously estimated (see Baayen et al., 2008). However, methods for calculating power for such models have yet to become standardized. We followed the recommendations of Kumle et al. (2021) and used the mixedpower R package (Kumle et al., 2018). The simulation-based power analyses of the mixedpower package are based on models that have been fitted with lme4. To obtain such a model, we used the Faux R package (DeBruine, 2021) to set up the appropriate factorial design and simulate the data based on an estimate of mu and sigma values of Japanese and English segment durations from previous work (Kawase, 2016) for the number of segments and participants to be used (as mentioned later). The mixedpower analysis, with the number of simulations = 1,000 and critical value (t) = 2.00, indicated that the total number of 8,863 data points (based on 10 participants per group) gave a power above 0.8 to detect an effect for the key comparison (a difference between the language groups on Varco scores).
2.1.7 Linear mixed models
Linear mixed models can include both fixed effects (i.e., the main effects and interactions) and random effects (here, participants and items) and their associated variance components and correlation parameters (e.g., random intercepts and slopes). Barr et al. (2013) recommend that, where possible, the maximal model, that is, the full variance–covariance structure of random effects should be fitted. More recently, Bates et al. (2015) and Matuschek et al. (2017) have demonstrated by using simulations that fitting overparameterized models can result in considerable loss of power. As such, the models we used typically included random intercepts for participants but not random slopes by participants if including these resulted in a model that did not converge or was singular.
2.2 Results
The data were examined by fitting linear mixed models (estimated using the REML and nloptwrap optimizer) with fixed effects including Language group (native English and native Japanese) and Segment type (consonant and vowel), except for the specific vowel measure (%V), which included only Language group as a fixed effect. The model formula is given for each analysis (as discussed later). The data analyses were performed using the lme4 1.1-25 package in R 4.0.3 (Bates et al., 2014). Visual inspection of residual plots was conducted for each analysis, and these did not reveal any obvious deviations from normality. Except where noted, all the following statistical analyses were conducted using the same procedures. Note that the standardized parameters were obtained by fitting the model on a standardized version of the dataset, and 95% confidence intervals (CIs) and P-values were computed using the Wald approximation. Effects sizes were calculated using the effect size R package (Ben-Shachar et al., 2020).
2.2.1 Mean duration of consonant and vowel intervals
To examine the consonant and vowel duration data, we fitted a linear mixed model to predict segment duration with Language (native English; native Japanese) and Segment type as fixed effects (consonant; vowel) (formula: Duration ~ Language + Segment type + Language: Segment type). The model also included Segment type, sentence and speaker, as random effects (formula: list[~1 + Segment type | sentence, ~1 | speaker]). The model’s total explanatory power was moderate (conditional R2 = 0.19) and the part related to the fixed effects alone (marginal R2) was 0.14.
The effect of Language was significant, β = −0.01, 95% CI [−0.02, −3.98e-03], t(8854) = −2.91, p < .01, η2 = 0.12, 95% CI [0.01, 1.0], SD. β = −0.26, 95% CI [−0.44, −0.09], with mean English segment durations (0.09 s) greater than Japanese (0.08 s). The effect of Segment type was significant, β = 0.03, 95% CI [0.03, 0.04], t(8854) = 18.55, p < .001, η2 = 0.96, 95% CI [0.94, 1.0], SD. β = 0.71, 95% CI [0.63, 0.78], with vowel durations (M = 0.11 s) greater than consonants (M = 0.07 s). The interaction effect of Segment type and Language was not significant, β = 4.45e-03, 95% CI [−1.12e-03, 0.01], t(8854) = 1.57, p = .117, η2 = 0.1, 95% CI [0.0, 1.0], SD. β = 0.10, 95% CI [−0.02, 0.21].
2.2.2 Durational variability of consonant and vowel intervals (VarcoC and VarcoV)
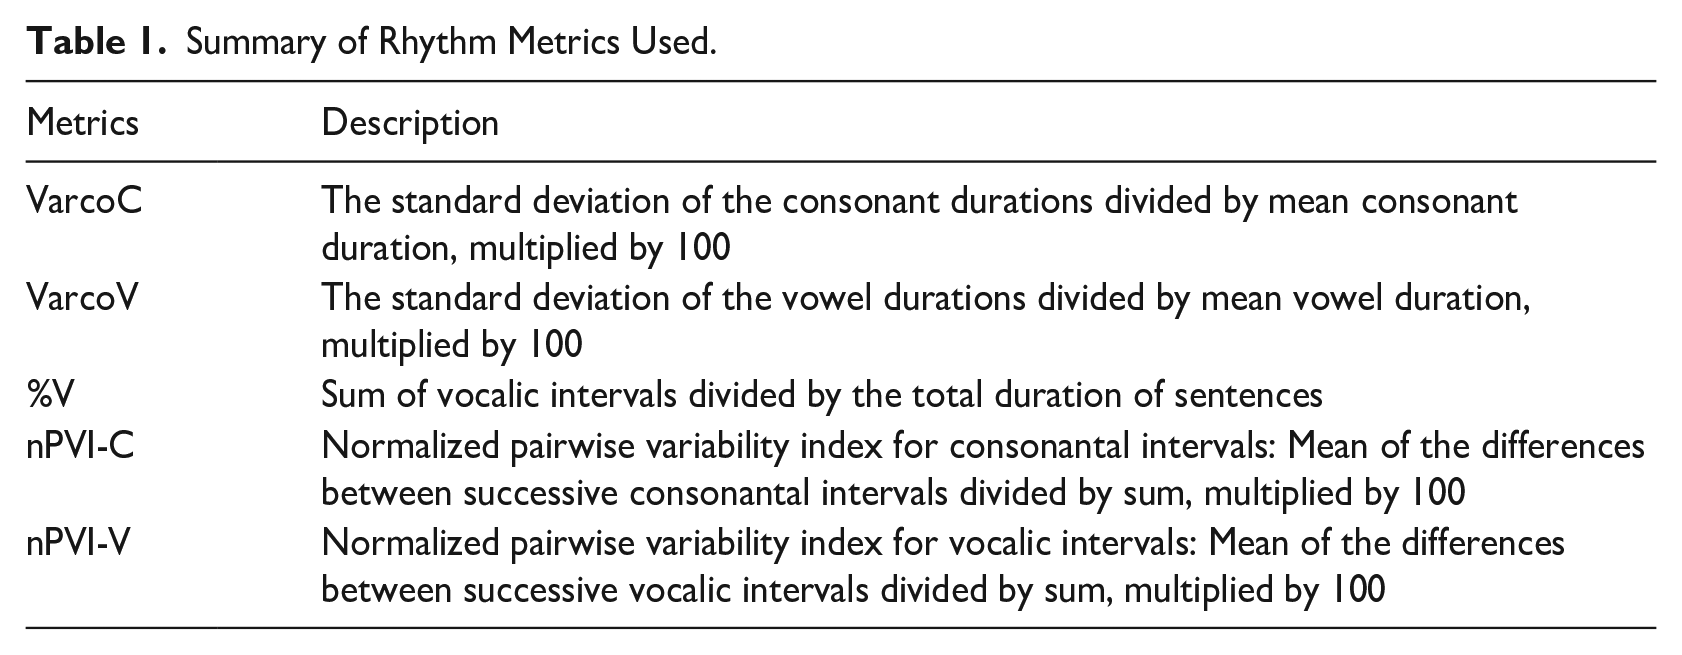
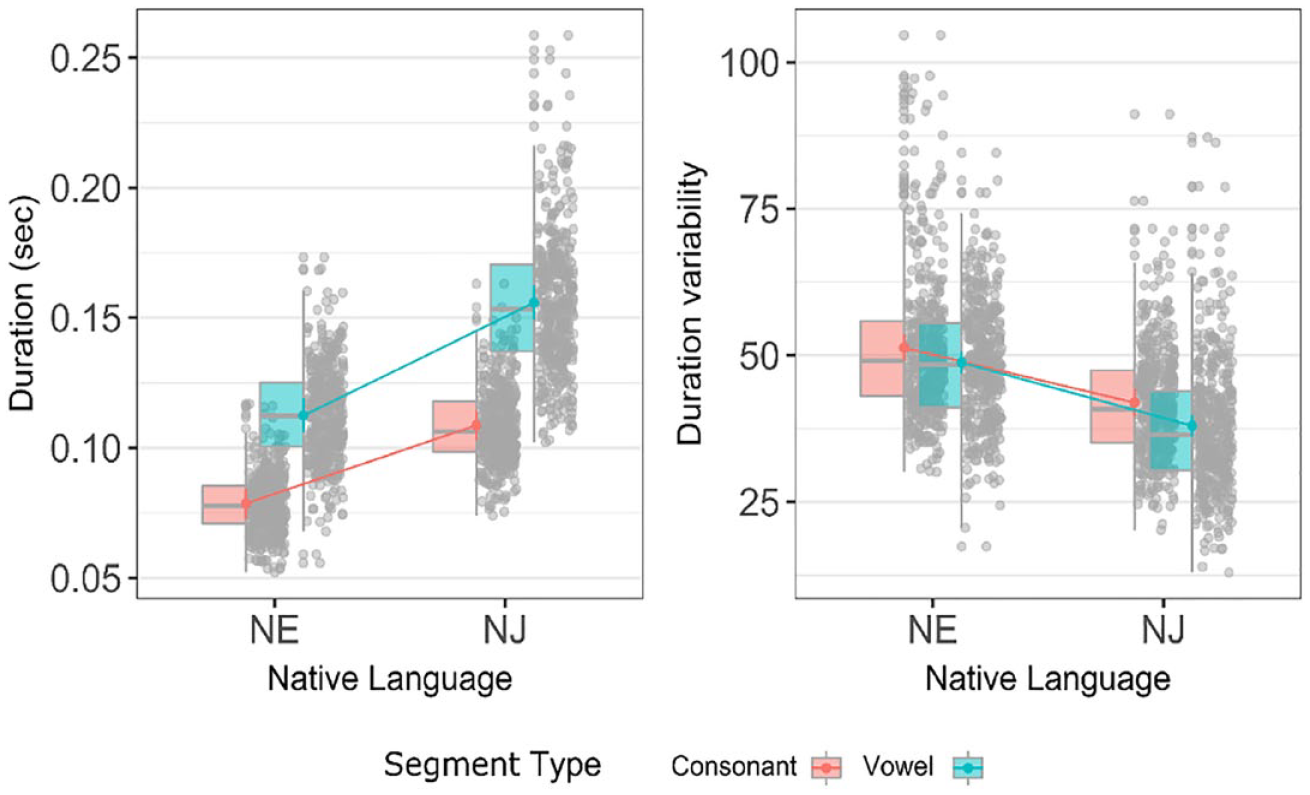
The variability of consonant and vowel intervals in English and Japanese was analyzed using the coefficients of variation (VarcoV and VarcoC). Figure 1 shows the mean duration and mean durational variability of consonant and vowel intervals (VarcoC and VarcoV, respectively) produced in native English and native Japanese speech.
Duration (left panel) and duration variability (Varco, right panel) of consonant and vowel intervals for native English (NE) and native Japanese (NJ) speakers.
A linear mixed model was fitted to predict the coefficient of variation (Varco) data with Language group and Segment type as fixed effects (formula: Varco ~ Language group + Segment type + Language group: Segment type). The model included sentence and speaker as random effects (formula: list[~1 | sentence, ~1 | speaker]). The model’s total explanatory power was reasonable (conditional R2 = 0.29) and the part related to the fixed effects (marginal R2) was 0.18.
The effect of Language group was significant, β = −11.50, 95% CI [−15.00, −8.00], t(593) = −6.44, p < .001, η2 = 0.58 [0.36, 1.00], SD. β = −1.05, 95% CI [−1.37, −0.73] with greater durational variability among the native English productions (M = 50.0) compared with the native Japanese ones (M = 41.9). The effect of Segment type, that is, vowels (M = 47.29); consonants (M = 46.50), was not significant, β = −0.35, 95% CI [−2.16, 1.47], t(593) = −0.37, p = .710, η2 = 0.005, 95% CI [0.0, 1.0], SD. β = −0.03, 95% CI [−0.20, 0.13]. The interaction effect of Language group on Segment type was significant, β = 3.41, 95% CI [0.26, 6.56], t(593) = 2.12, p < .05, η2 = 0.008, 95% CI [0.0 1.0], SD. β = 0.31, 95% CI [0.02, 0.60]; as can be seen in the right panel of Figure 1, for English utterances, consonants had only slightly more variable durations than vowels (Mconsonant − Mvowel = 0.35), but for Japanese utterances, vowel durations were more variable (Mconsonant − Mvowel = −3.06).
2.2.3 Proportion of vowel intervals (%V)
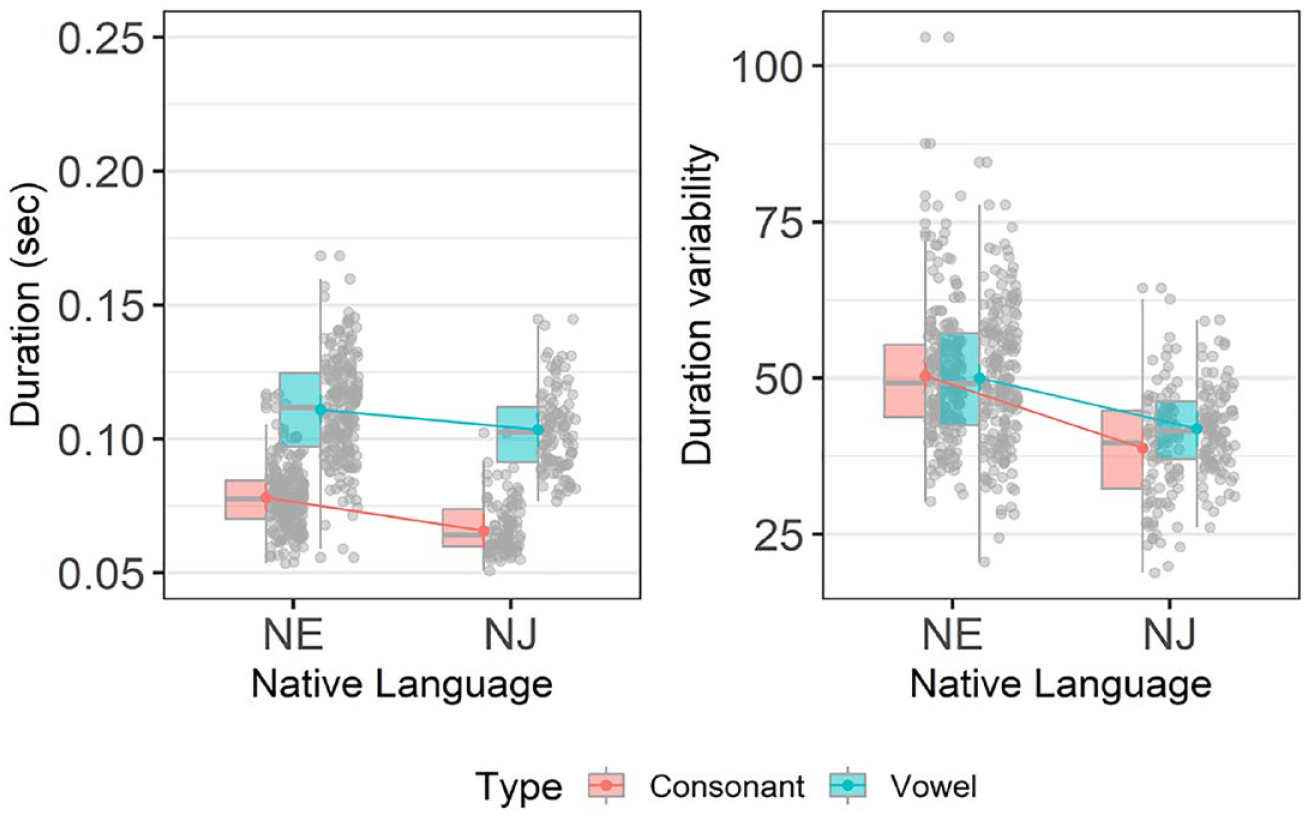
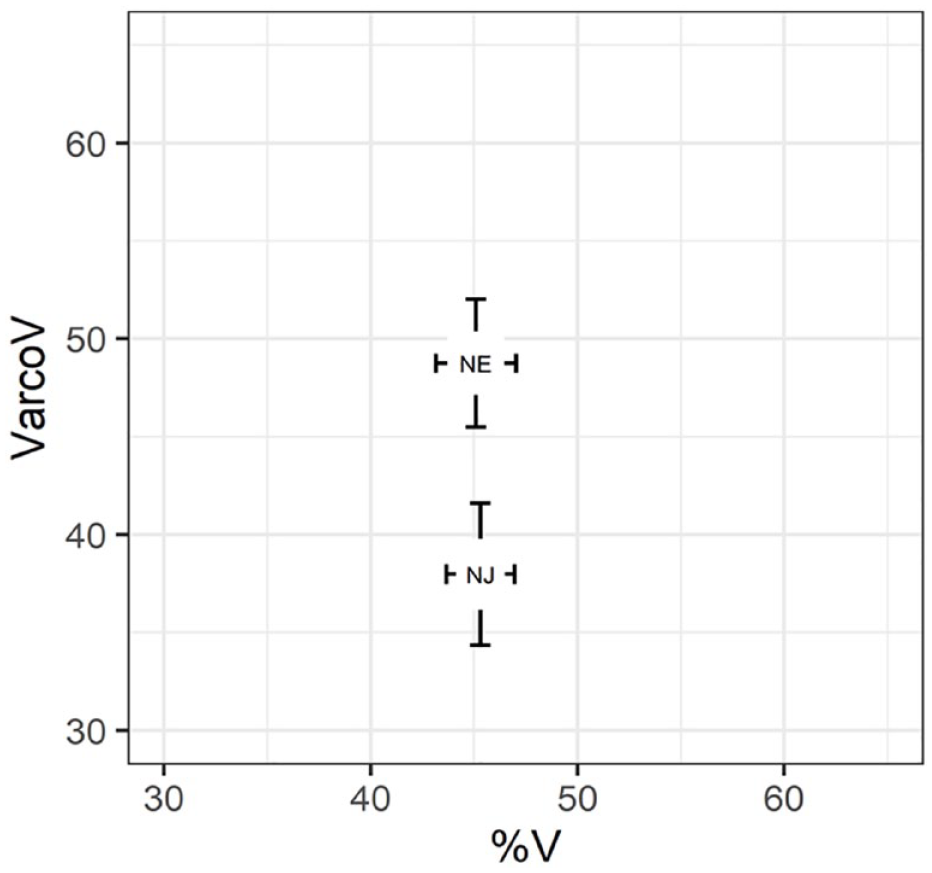
Figure 2 depicts the relationship between VarcoV and %V. To analyze the proportion of vowel intervals (%V), we fitted a linear mixed model to predict %V with the Language group as fixed effects (formula: %V ~ Language group). The model included sentence and speaker as random effects (formula: ~1 | sent, ~1 | speaker). The model’s total explanatory power was substantial (conditional R2 = 0.87) and the part related to the fixed effects alone (marginal R2) was 0.57.
VarcoV and %V for native English (NE) and native Japanese (NJ) speakers (error bars indicate ±1 standard error).
The effect of Language group was significant, β = 0.14, 95% CI [0.1, 0.18], t(296) = 7.03, p < .001, η2 = 0.54, 95% CI [0.37, 1.0], SD. β = 1.62, 95% CI [1.16, 2.07] with the proportion of vowel intervals for Japanese (M = 58.9%) larger than that of English (M = 44.6%).
2.2.4 Pairwise variability index (nPVI-C, nPVI-V)
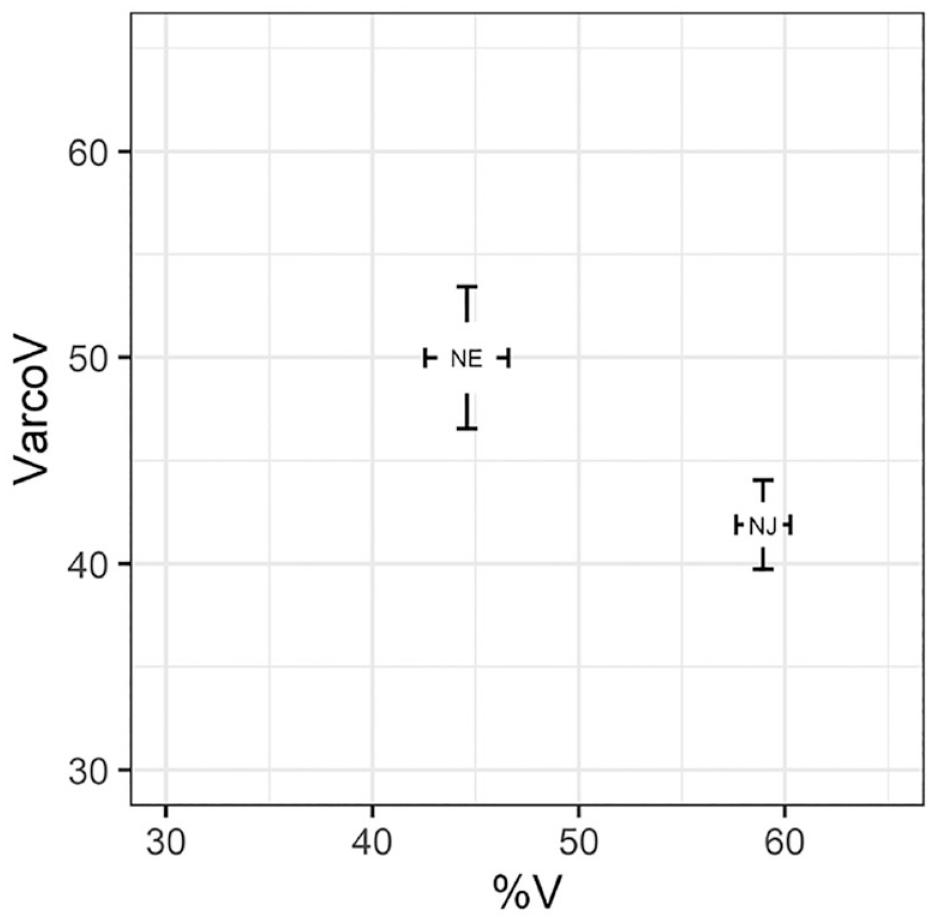
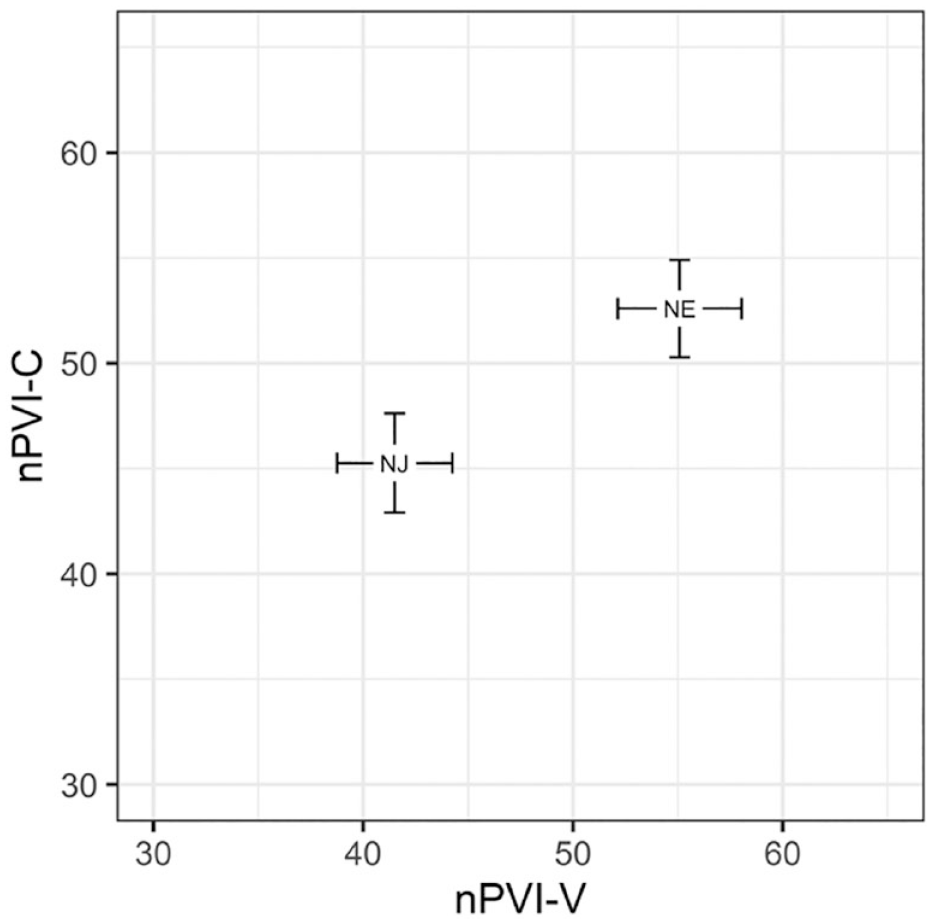
The mean nPVI-C and mean nPVI-V scores and associated standard errors are shown in Figure 3. As with the previous data, we fitted a linear mixed model to predict nPVI with Language group and Segment type as fixed effects (formula: npvi ~ Language group + Segment type + Language group: Segment type). The model included sentence and speaker as random effects (formula: list[~1 | sentence, ~1 | speaker]). The model’s total explanatory power was substantial (conditional R2 = 0.39) and the part related to the fixed effects alone (marginal R2) was 0.19.
Pairwise variability index of consonant (nPVI-C) and vowel intervals (nPVI-V) for native English (NE) and native Japanese (NJ) speakers (error bars indicate ±1 standard error).
The effect of Language group was significant, β = −6.99, 95% CI [−12.01, −1.98], t(591) = −2.73, p = .006, η2 = 0.38, 95% CI [0.16, 1.0], SD. β = −0.55, 95% CI [−0.94, −0.15] with English (M = 53.93) higher than Japanese (M = 43.56). The effect of Segment type was significant, β = 7.19, 95% CI [5.21, 9.17], t(591) = 7.11, p < .001, η2 = 0.03, 95% CI [0.01, 1.0], SD. β = 0.56, 95% CI [0.41, 0.71], with nPVI-V (M = 52.94) larger than nPVI-C (M = 47.97). The interaction effect of Language group and Segment type was significant, β = −6.67, 95% CI [−10.10, −3.25], t(591) = −3.82, p < .001, η2 = 0.03, 95% CI [0.01, 1.0], SD. β = −0.52, 95% CI [−0.79, −0.25].
To explore this interaction, Bonferroni adjusted comparisons were conducted using the emmeans R package (Lenth, 2020) that uses the Kenward-Roger method to estimate degrees of freedom. For the English utterances, there was a significant effect of Segment type, with greater variability in consecutive vowel intervals compared with consecutive consonant ones, estimate = 7.1, SE = 1.01, t(550) = 7.110, p < .0001. For the Japanese productions, the differences between the variability in consecutive vowel compared with consecutive consonant intervals were not significant, estimate = 0.52, SE = 1.43, t(550) = 0.363, p = .717. Further analyses revealed a significant effect (greater variability) for native English compared with Japanese productions for consecutive consonant intervals, estimate = 6.99, SE = 2.56, t(37.8) = 2.73, p = .0095, and vowel intervals, estimate = 13.67, SE = 2.56, t(37.7) = 5.34, p < .0001.
2.3 Discussion
We found that there were significant differences between English and Japanese on the three rhythm-associated measures, Varco, %V, and the Normalized Pairwise Variability Index. Given the possibility of item-specific effects, it is important to assess whether the values we obtained with our items are like those of other similar studies (e.g., that used read speech). A comparison of VarcoV and nPVI-V scores confirms that this was the case, with the scores from other studies showing more variation in English than in Japanese. For example, for VarcoV, the mean VarcoV for English L1 talkers over several studies was 60.4 (White & Mattys, 2007 = 64; Grenon & White, 2008 = 52; Wiget et al., 2010 = 64; He, 2010 = 59; Algethami & Hellmuth, 2024 = 63). The result of this study was 50 (slightly on the low side). For Japanese L1 talkers, the mean VarcoV was 46.7 (Grenon & White, 2008 = 56; Nagao & Ortega-Llebaria, 2021= 44 & 40). The result of this study was 42 (again on the low side). For these other studies, the difference in VarcoV between English and Japanese (L1) was 13.7, and for this study was 8; thus, if anything, the results for this study underestimated the difference.
Over several studies, the mean score of nPVI-V for English L1 talkers was 67 (White & Mattys, 2007 = 73; Wiget et al., 2010 = 70.5; Grabe & Low, 2008 = 57.2; He, 2010 = 67). The result for this study was 57.5. Over studies of Japanese L1 talkers, the mean nPVI-V was 45.2 (Grabe & Low, 2008 = 40.9; Ramus, 2002 = 47; Dellwo & Fourcin, 2013 = 49; Mairano & Romano, 2011 = 44). The mean for the current results was 43.8. So, for other studies, the difference in nPVI-V results between English and Japanese (L1) was 22.2, and for this study, it was 13.7. Thus, if anything, the results of this study underestimated the difference.
The mean %V score for English (44.6%, similar to that reported by Arvaniti, 2012, 45.7%) was smaller than that for Japanese (58.9%). These results are consistent with the idea that the presence of stress in English productions leads to larger variability. There was also reduced variability for Japanese compared with English consonant segments, a finding consistent with the view that stress in English induces durational variability in consonants (e.g., Cho & Keating, 2009). Overall, the current results confirm that there are cross-linguistic rhythm differences in English and Japanese; a result that licenses the further exploration of L1 influence on L2 productions.
3 Experiment 2: L1 English and Japanese L2 English rhythm comparison
In Experiment 2, we investigated the main question of whether L1 rhythm affects L2 speech rhythm by comparing L1 English productions with those of Japanese learners of English (henceforth Japanese English). Given the results from Experiment 1 that Japanese and English have different rhythms, we would expect an L1 rhythm influence on L2 to manifest in terms of the durational variability of Japanese speakers’ English vowels and consonants to be lower than those of native English speakers. As mentioned earlier, some studies that have investigated such variability have found little influence of L1 on L2 speech production (e.g., White & Mattys, 2007). However, at least one study has shown an L1 L2 effect for VarcoC with Cantonese-accented and Mandarin-accented English (Mok & Dellwo, 2008). In testing the hypothesis, we employed the rate-normalized Varco and nPVI metrics as well as the %V measure as in previous studies (e.g., Grenon & White, 2008; White & Mattys, 2007).
Note that there have been reports of considerable inter-speaker variation in the various scores. For instance, Wiget et al. (2010) showed both inter-speaker and inter-stimulus variations with five speakers and five sentences in Standard Southern British English, with the observed variations particularly large in vowel durations (e.g., VarcoV, nPVI-V). Given the potential for such individual variation, it is important to examine the individual speaker scores for the various metrics that showed a difference between the Japanese English and native English speakers (i.e., Varco and nPVI). In this regard, we ascertained the consistency of the measures across speakers and sentences is to calculate intraclass correlations (ICCs). ICC is often used to assess the reliability of raters but here we used it to determine the reliability of the rhythm measures (for vowels and consonants) across items and participants.
3.1 Method
3.1.1 Participants
The same participants that participated in Experiment 1 were tested in Experiment 2.
3.1.2 Materials
The materials were L1 and (Japanese) L2 English vowels and consonants from 40 spoken IEEE Harvard English sentences (see Supplemental Material). For native English, there were 3,511 vowels and 6,132 consonants (total N = 9,643); for Japanese English, there were 3,613 vowels and 6,222 consonants (total N = 9,835). The difference in the numbers above was due to the insertion of vowels and consonants in non-native pronunciations (Hancin-Bhatt & Bhatt, 1997; Yazawa et al., 2015).
The rationale for adding extra items for the critical L1 versus L2 English comparison was that any influence of L1 (Japanese) rhythm on L2 (English) productions may be weaker than the difference in rhythm between the L1 languages. That is, the key contrast for the study is between the Japanese L2 speakers of English and their L1 English counterparts. Several studies have reported that the difference in measures such as VarcoV between the L2 learner and the L1 control diminishes with L2 experience (e.g., Li & Post, 2014; White & Mok, 2023). Then it is important to have stable estimates of L2 speech, hence we added more items. Given that any influence of L1 (Japanese) rhythm on L2 (English) productions may be weaker than the difference in rhythm between the L1 languages, the number of data points was increased in this experiment by doubling the number of sentences used. For native English, the productions of the 20 sentences obtained in Experiment 1 were used along with those of 20 additional sentences. Note that due to the addition of these 20 extra sentences, the outcome of the rhythm metrics for L1 English will not exactly match those of Experiment 1, although they would be expected to be very similar.
As per Experiment 1, all sentences by all speakers were segmented into vocalic and consonantal intervals using Praat (Boersma & Weenink, 2013) by following the conventions outlined in Experiment 1 and White and Mattys (2007).
3.2 Results
The extracted interval durations for both speaker groups were examined using linear mixed models. The fixed effects included speaker groups (Japanese English and native English speakers) and Segment type (consonant and vowel). The model also included random intercepts for participants as well as random slopes by participants for the interval and speaker group types (except for when the model did not converge or was singular; note that each formula is given).
3.2.1 Mean durations of consonant and vowel intervals
Figure 4 (left panel) shows mean consonant and vowel durations by L1 and L2 English speakers. A linear mixed model was fitted to predict Duration with Speaker group and Segment type as fixed factors (formula: Duration ~ Speaker group + Segment type + Language group: Segment type). The model included Segment type, sentence and speaker, as random effects (formula: list[~1 + Segment type | sentence, ~1 | speaker]). The model’s total explanatory power was moderate (conditional R2 = 0.25) and the part related to the fixed effects (marginal R2) was 0.20.
Duration (left panel) and durational variability (right panel) of consonant and vowel intervals for the English sentences by native English (NE) and native Japanese (NJ) speakers.
The effect of Language group was significant, β = 0.03, 95% CI [0.02, 0.04], t(19468) = 7.71, p < .001, η2 = 0.83, 95% CI [0.69,1.0], SD. β = 0.51, 95% CI [0.38, 0.64], with the mean length of L2 English utterances (M = 0.13 s) longer than the L1 utterances (M = 0.09 s). The effect of Segment type was significant, β = 0.03, 95% CI [0.03, 0.04], t(19468) = 18.29, p < .001, η2 = 0.94, 95% CI [0.9,1.0], SD. β = 0.58, 95% CI [0.52, 0.64] with the vowels (M = 0.13 s) longer than the consonants (M = 0.09 s). The interaction effect between Speaker group and Segment type was significant, β = 0.01, 95% CI [0.01, 0.02], t(19468) = 8.82, p < .001, η2 = 0.004, 95% CI [0.0, 1.0], SD. β = 0.23, 95% CI [0.18, 0.28].
Bonferroni adjusted contrasts, using the emmeans R package (Length, 2020) were conducted to compare durations within Segment type and within speaker group (i.e., Japanese English vs. native English speakers). For the consonant intervals, there was a significant difference between the two speaker groups, estimate = 0.03, SE = 0.004, t(18.8) = 7.714, p < .0001, with Japanese English productions being longer than native English ones. There was also a significant difference for vowel intervals, estimate = 0.04, SE = 0.004, t(20.3) = 10.924, p < .0001, indicating that vowel duration was longer in the Japanese English speaker’s productions than the native English ones.
For the native English speaker group, the analysis showed that vowel interval durations were longer than the consonant ones, estimate = 0.03, SE = 0.002, t(56.9) = 18.29, p < .0001. This was also the case for the Japanese English speaker group, estimate = 0.05, SE = 0.002, t(56.0) = 25.62, p < .0001.
3.2.2 Durational variability of consonant and vowel intervals (VarcoC and VarcoV)
Further analyses were conducted to examine the durational variability of consonant and vowel intervals in English and Japanese using the VarcoC and VarcoV measures. Figure 4 (right panel) shows mean consonant and vowel durational variability for native and Japanese English. A linear mixed model was fitted to predict the variability of segment durations (varco) with Speaker group (formula: varco ~ Speaker group + Segment type + Speaker group: Segment type) as fixed effects. The model included Segment type, sentence and speaker, as random effects (formula: list[~1 + Segment type | sentence, ~1 | speaker]). The model’s total explanatory power was substantial (conditional R2 = 0.36) and the part related to the fixed effects (marginal R2) was 0.19.
There was greater durational variability for the native English speakers (M = 50.0) than for the Japanese English ones (M = 39.95), that is, a significant effect of Speaker group, β = −9.37, 95% CI [−11.26, −7.47], t(1591) = −9.71, p < .001, η2 = 0.89, 95% CI [0.8, 1.0], SD. β = −0.76, 95% CI [−0.92, −0.61].
The effect of Segment type was significant, β = −2.54, 95% CI [−5.03, −0.04], t(1591) = −1.99, p < .05, η2 = 0.16, 95% CI [0.03, 1.0], SD. β = −0.21, 95% CI [−0.41, −3.62e-03], with consonants (M = 46.61) being more variable than vowels (M = 43.36). The interaction effect of group on Segment type was not significant and negative, β = −1.41, 95% CI [−3.35, 0.52], t(1591) = −1.43, p = .151, η2 = 0.001, 95% CI [0.0, 1.0], SD. β = −0.12, 95% CI [−0.27, 0.04].
3.2.3 Proportion of vowel intervals (%V)
The relationship between VarcoV and %V is depicted in Figure 5. The percent vowel (%V) data as a function of Speaker group was analyzed using a linear mixed model, that is, with Speaker group and Segment type as fixed factors (formula: %V ~ Speaker group + Segment type + Speaker group: Segment type); stimulus Sentence and Speaker were included as random effects (formula: list[~1 | sent, ~1 | spkr]). The model’s total explanatory power was substantial (conditional R2 = 0.55); the part related to the fixed effects (marginal R2) was 3.41e-04. The effect of Speaker group was non-significant, β = 0.21, 95% CI [−1.63, 2.06], t(795) = 0.23, p = .821, η2 = 0.002, 95% CI [0.0, 1.0]; SD. β = 0.04, 95% CI [−0.29, 0.36].
VarcoV and %V for the English sentences by native English (NE) and native Japanese (NJ) speakers (error bars indicate ±1 standard error).
3.2.4 Pairwise variability index (nPVI-C, nPVI-V)
Figure 6 shows nPVI-C and nPVI-V for the native English and Japanese speakers producing English sentences. A linear mixed model was conducted to predict nPVI with Speaker group (native English; Japanese English speakers and Segment type [consonant; vowel] as fixed factors) (formula: npvi ~ Speaker group + Segment type + Speaker group: Segment type). The model included Sentence and Speaker as random effects (formula: list[~1 | sentence, ~1 | speaker]). The model’s total explanatory power was reasonable (conditional R2 = 0.28) and the part related to the fixed effects (marginal R2) was 0.19.
Pairwise variability indices of consonant (nPVI-C) and vowel intervals (nPVI-V) for the spoken English sentences by native English (NE) and native Japanese (NJ) speakers (error bars indicating ±1 standard error).
The effect of Speaker group was significant, β = −7.89, 95% CI [−9.83, −5.96], t(1590) = −8.00, p < .001, η2 = 0.91, 95% CI [0.83, 1.0], SD. β = −0.60, 95% CI [−0.75, −0.45]). The effect of Segment type was also significant, β = 4.83, 95% CI [3.28, 6.38], t(1590) = 6.11, p < .001, η2 = 0.91, 95% CI [0.006, 1.0], SD. β = 0.37, 95% CI [0.25, 0.48]. The interaction between the effect of Speaker group and Segment type was also significant, β = −6.13, 95% CI [−8.32, −3.93], t(1590) = −5.48, p < .001, η2 = 0.02, 95% CI [0.01, 1.0], SD. β = −0.46, 95% CI [−0.63, −0.30].
Additional Bonferroni-adjusted comparisons were conducted using the emmeans R package (degrees of freedom estimated by the Kenward-Roger method). For the native English productions, there was greater variability in consecutive vowel intervals compared with the consonant ones, estimate = 4.83, SE = 0.791, t(1,1537) = 6.106, p < .0001. No difference in variability was found for the Japanese English speaker productions, Estimate = 1.30, SE = 0.790, t(1,1536) = 1.639, p = .101. For each Segment type, native English productions were more variable compared with the Japanese English ones; for consecutive vowels, estimate = 14.02, SE = 0.986, t(1,39) = 14.224, p < .0001, and consonant intervals, estimate = 7.89, SE = 0.986, t(1,39) = 8.004, p < .0001.
3.2.5 Inter-speaker variation
The ICC coefficients were obtained using the Psych package (Revelle, 2021); we used a two-way model that treats both speakers and items as randomly sampled from a population (Shrout & Fleiss, 1979), and we use Koo and Li (2016) as a guideline for the interpretation of the ICC score.
Figure 7 shows individual data for durational variability (VarcoV and VarcoC) for Japanese English and native English speakers. For the Japanese English productions, the VARCO measure had good consistency. For VarcoV, ICC = 0.77, 95% CI [0.58–0.89] and for VarcoC, ICC = 0.72, 95% CI [0.497–0.87]. For the native English data, VARCO had excellent consistency. For VarcoV, ICC = 0.85, 95% CI [0.72–0.93] and for VarcoC, ICC = 0.92, 95% CI [0.85–0.96].
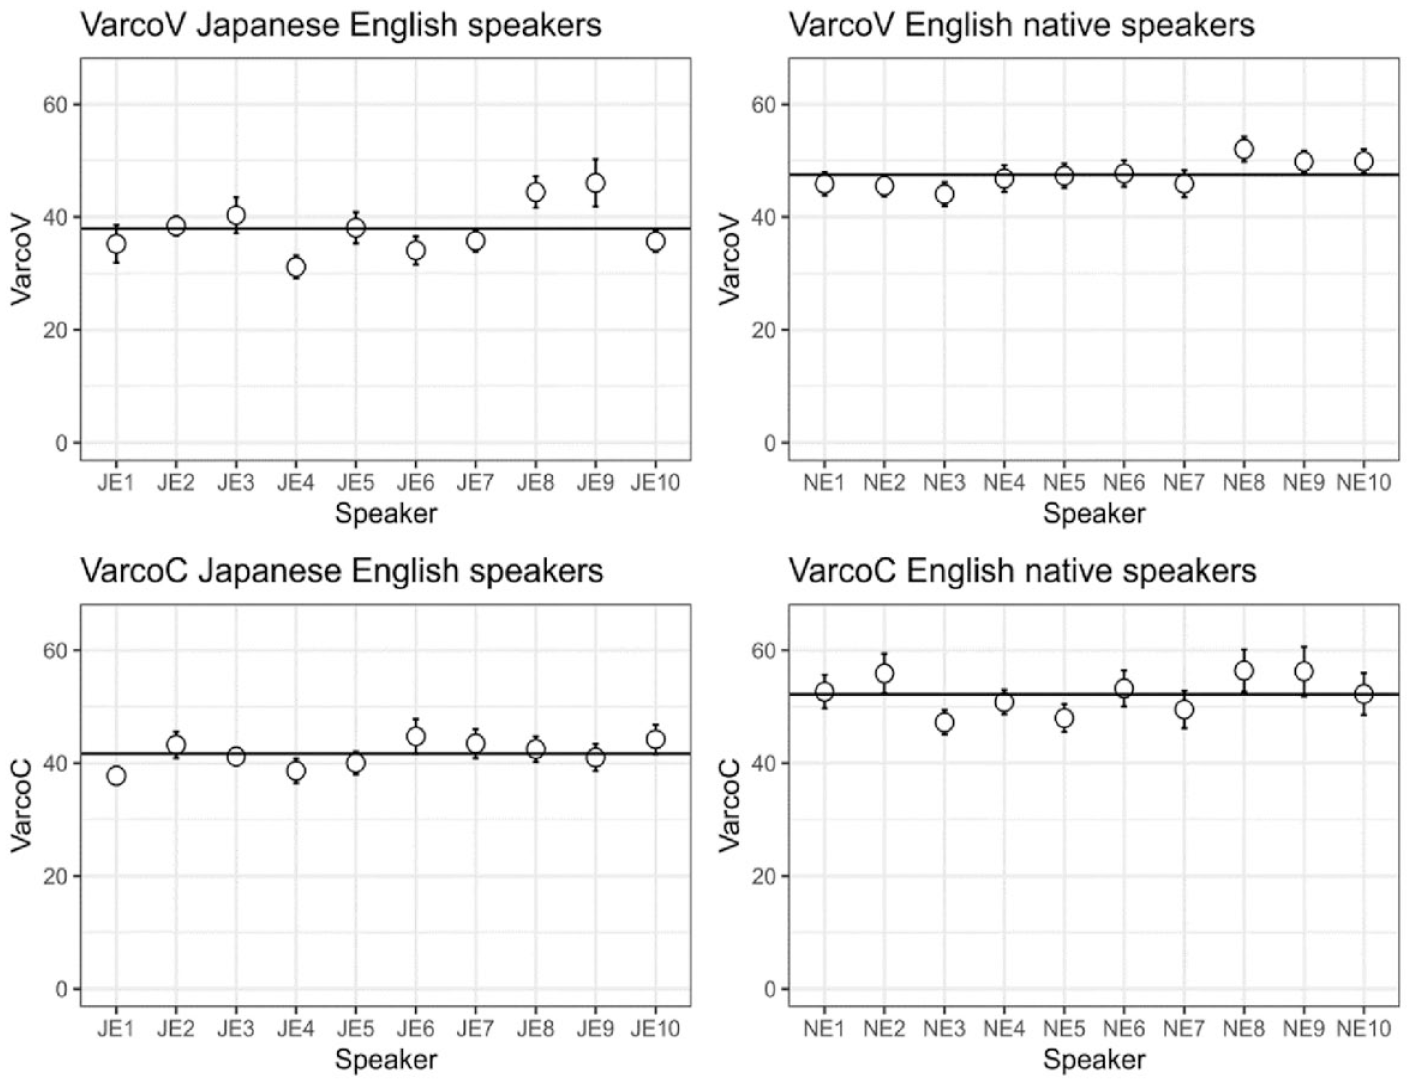
Mean VarcoV (top panels) and VarcoC scores for the Individual Japanese English (left) and native English speakers (the whiskers show ±1 standard error, the horizontal line shows the group mean).
Figure 8 shows individual data for the nPVI measures (nPVIV and nPVIC) for Japanese English and native English speakers. For the Japanese English productions, the nPVIV measure had good consistency, ICC = 0.69, 95% CI [0.524–0.81]. The consistency of the PVIV measure for the native English productions was excellent, ICC = 0.82, 95% CI [0.72–0.89]. The nPVIC were similarly consistent across speakers and items. For the Japanese English speakers, ICC = 0.66, 95% CI [0.490–0.80], and for the native English speakers, ICC = 0.73, 95% CI [0.60–0.84].
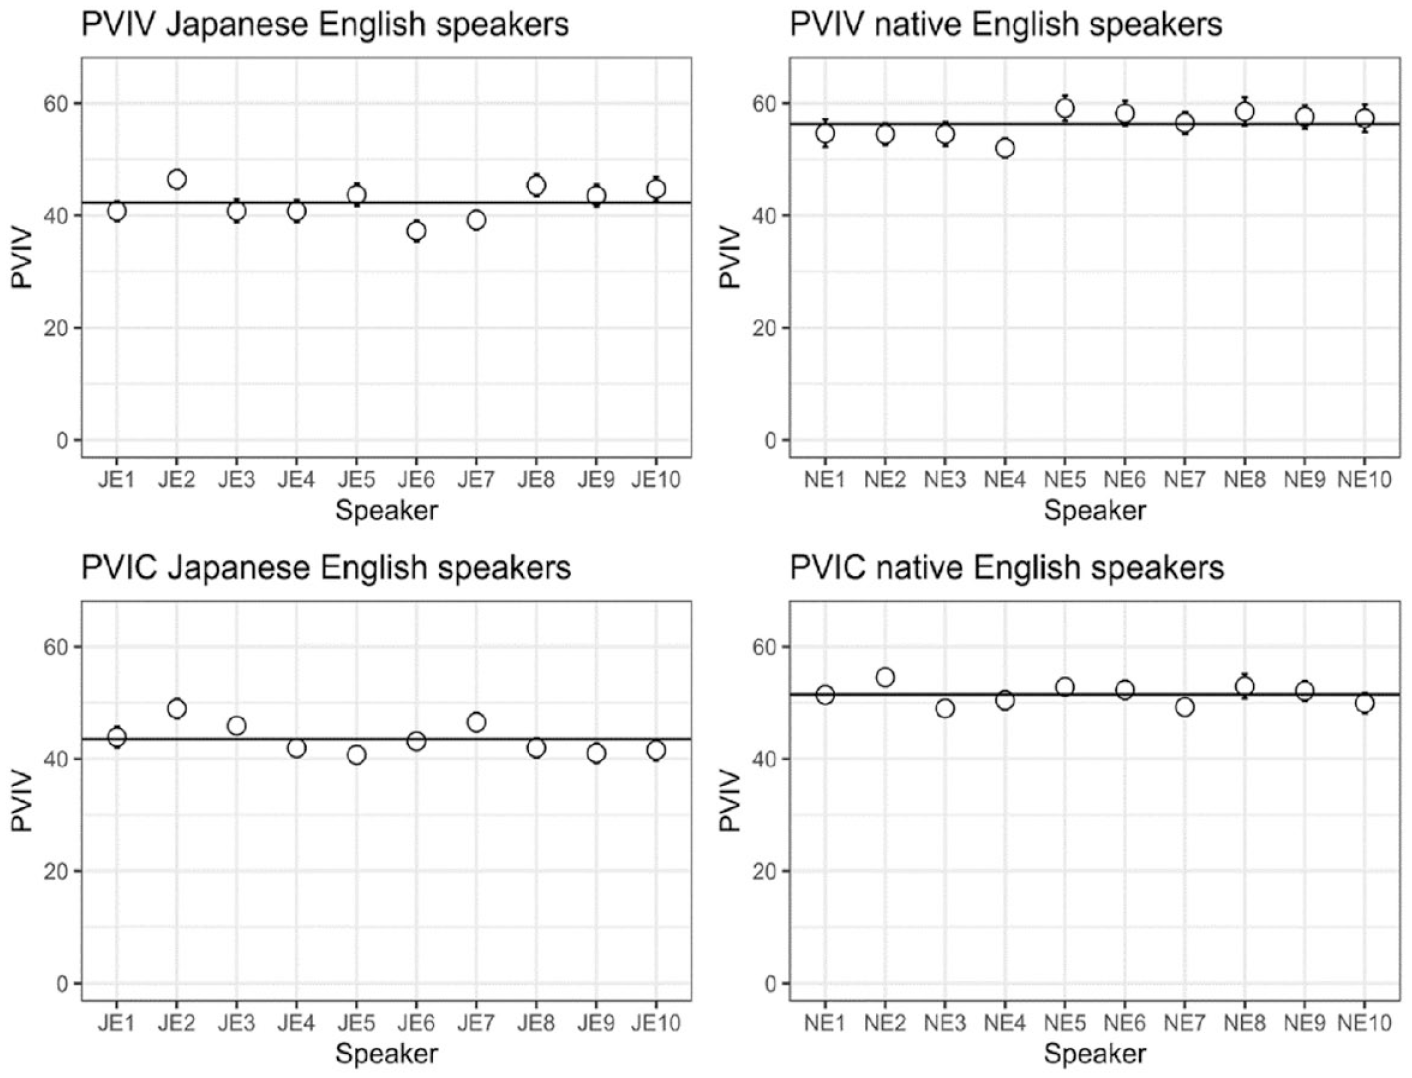
Mean PVIV scores (top panels) and PVIC scores for the individual Japanese English (left) and native English speakers (the whiskers show ±1 standard error, the horizontal line shows the group mean).
3.3 Discussion
Compared with the native English productions, the Japanese English ones showed smaller variability for vowel intervals using the rate-normalized VarcoV and nPVI-V measures (these measures were consistent across individual speakers and items). These results suggest that these Japanese learners of English produced vowel duration patterns that were influenced by those of their L1 Japanese, that is, keeping vowel duration more constant compared to the vowel variations for the stressed and unstressed syllables of L1 English. That is, the result is consistent with the hypothesis that when two languages differ substantially in their rhythm characteristics, and when speakers have limited experience speaking the L2, there will be a significant influence of the L1 language on the speech rhythm of the L2 (Mok & Dellwo, 2008; White & Mattys, 2007).
We found that the percentage of vowel durations in relation to the total duration (%V) was not significantly different for the Japanese English and native English productions (unlike Varco and nPVI). This pattern of results in which %V for the L2 speakers is more similar to that of L1 speakers of the target language (e.g., English) than the VarcoV or nPVI measures was also found by Ding and Xu (2016) who tested Mandarin Chinese learners of English. These results suggest that %V may be more sensitive to the content of what is being read aloud (e.g., consonant clusters in English) than it is to the rhythmic properties of the L1 (here, Japanese). For example, Mori et al. (2014) found that %V did not differ between Japanese English and native English L1 speakers on English materials and suggested that this null result should not be surprising because both groups of speakers read the same English sentences with the same syllable structures.
Furthermore, this study found a robust reduction in variability in consonant durations for the Japanese English speakers compared with the native English ones, that is, reduced variability was found for Japanese English compared to native English with rate-normalized VarcoC and nPVI-C. The reduced variability was similar to what was found when comparing native Japanese to English consonant durations in Experiment 1, suggesting an influence of L1 Japanese consonant duration pattern on L2 English. As addressed previously, stress can affect the durational contrasts of consonants (Cho & Keating, 2009), so it is possible that Japanese learners of English could not produce the English-like variability due to unsuccessful stress placement.
4 General discussion
This study investigated whether a speaker’s L1 rhythm (as indexed by traditional metrics) could influence their L2 speech production, taking into account factors that may have led to variability in previous outcomes. That is, we examined whether the Japanese (L1) rhythm affects the English (L2) productions of Japanese learners who had limited English experience. To address the issue, a series of analyses were performed to examine differences in duration and durational variability of consonant and vowel intervals (1) between Japanese and English speakers, to establish that the languages have measurably different rhythms; and (2) between Japanese English and native English speakers, to establish whether the rhythms of the two “Englishes” differ.
In the comparison of Japanese and English speaker productions, there was reduced variability for consonant and vowel intervals for Japanese compared with English. This finding of less variability in vowel duration is plausibly due to a lack of stress in Japanese. Previous research (e.g., White & Mattys, 2007) has shown reduced variability in languages that do not employ stress contrast (e.g., Spanish) compared with languages that do (e.g., English). The results of the comparison between Japanese English and native English speakers had marked similarities to those for the contrast between Japanese and English. That is, variability for consonant and vowel intervals was reduced, which can be taken as an index of an apparent L1 Japanese rhythm influence on L2 English.
An alternate interpretation of the variability results (Figure 1) might be that variability around shorter segments is less, simply because it is constrained more due to differences perceptually more salient (a manifestation of Weber’s law). However, such an explanation cannot account for the pattern in Figure 4, because the results show that English had a shorter mean duration for C and V but more variability. In reference to the idea that the salience of variability is influenced by segment duration (i.e., the difference is more salient with shorter durations), we refer to perception studies that suggest that this does not seem to be the case. For example, the work of Friberg and Sundberg (1995) indicates that sensitivity to the duration of tone sequences is stable over a wide range of inter-onset intervals between 100 and 250 ms, with a similar large range shown for speech (Klatt & Cooper, 1975).
A different interpretation of the variability results is that the reduced variability observed in the Japanese English speaker productions was not wholly due to the influence of their L1 but may have been possibly influenced by a general tendency for beginning learners of any language to produce less variable segment durations. Some support for this interpretation comes from a study by Ordin and Polyanskaya (2015), who showed that the durational variability of German speakers of English differed as a function of how native-like their English was rated (with non-native-like productions being less variable).
Although this finding by Ordin and Polyanskaya is suggestive that less practiced speakers will show less variability in segment durations, it should be noted that in the Ordin and Polyanskaya study, the durational variability of the German learners of English was greater than that of French learners of English (so the speaker’s L1 language had a clear influence). Furthermore, there is a potential confound in the Ordin and Polyanskaya study. The selection of the “beginners” group of German English speakers was not based on these participants being beginning learners of English, but rather that their English attracted low ratings on a native English-like judgment scale. It may be that this rating was based on their English having a non-English-like rhythm, and as such, less variable segments, rather than less segment variability being a general property of beginning learners of English. Moreover, the data from Grenon and White (2008) showed that the productions of English Japanese speakers were more variable than the native Japanese speakers, showing that there is no general tendency for L2 productions to always produce less variable segments.
This study used some of the traditional measures that have been used to index speech rhythm. It should be pointed out, however, that researchers disagree on how best to conceptualize and subsequently measure speech rhythm. For example, Turk and Shattuck-Hufnagel (2013) proposed that there are three main ways of conceptualizing speech rhythm. The first is that it relates to periodicity in timing; the second is that it is about grouping and prominence structure derived from serial ordering, and the last is that rhythm is linked to surface timing patterns. The rhythm metrics used in this study fall within the last of these categories, and since these only tapped a single aspect of speech rhythm (speech duration variability), the study is clearly limited. Although, to be fair, the aim of this study was to simply use the traditional metrics of duration variability, rather than develop new or different measures. That is, this work aimed to demonstrate how a study, using measures that have been traditionally associated with speech rhythm, can be used to investigate a putative effect of L1 on L2. As such, our results are very specific; to be more general. For example, when applied to different language pairs, other measures may be needed; ones that reliably index differences between the selected languages, or measures that enjoy a clearer consensus as indices of speech rhythm (although it is not clear what these might be).
One possibility is that future work might examine non-auditory indicators of speech rhythm. For example, He (2018) argues that speech rhythm is fundamentally based on cyclical jaw movements. Moreover, studies have found differences in the jaw motion patterns of L1 and L2 (Japanese) speakers of English (Erickson et al., 2014) and suggested that acquiring native patterns of syllable jaw displacements may aid L2 rhythm acquisition (Wilson et al., 2020). Indeed, our recent study (Kawase et al., 2023) looked at the benefit that people get in speech identification in noise from seeing the jaw motion of the talker (i.e., mouth and lip motion was occluded), which we called a visual speech rhythm effect. We used the same inexperienced L2 English Japanese talkers as in the current experiment and showed that for these talkers there was no visual speech rhythm effect. Importantly, we found a visual speech rhythm effect from seeing the jaw motion of more experienced L2 English Japanese talkers (and of course, seeing native English talkers).
In conclusion, the results of this study are consistent with the proposition that L1 rhythm properties influence L2 speech production (and that this influence can be indexed by the traditional rhythm metrics). This does not mean that one’s L1 language is the only factor that influences L2 rhythm and new rhythm metrics may be needed (see Davis & Kim, 2023). Furthermore, it is unclear whether beginning L2 speakers share some general rhythmic properties that need to be taken into account when assessing evidence of L1 rhythm transfer.
Supplemental Material
sj-docx-1-las-10.1177_00238309241247210 – Supplemental material for Impact of Japanese L1 Rhythm on English L2 Speech
Supplemental material, sj-docx-1-las-10.1177_00238309241247210 for Impact of Japanese L1 Rhythm on English L2 Speech by Saya Kawase, Chris Davis and Jeesun Kim in Language and Speech
Footnotes
Acknowledgements
This research was conducted as part of the first author’s Ph.D. thesis, which was supported by the Australian Endeavour Scholarship. The authors would like to thank Dr. Leo Chong for assisting in the preparation of stimuli for the data collection and extend their gratitude to the participants.
Data availability
Funding
The author(s) disclosed receipt of the following financial support for the research, authorship, and/or publication of this article: This work was supported by the Australian Research Council (DP150104600).
Supplemental material
Supplemental material for this article is available online.
References
Supplementary Material
Please find the following supplemental material available below.
For Open Access articles published under a Creative Commons License, all supplemental material carries the same license as the article it is associated with.
For non-Open Access articles published, all supplemental material carries a non-exclusive license, and permission requests for re-use of supplemental material or any part of supplemental material shall be sent directly to the copyright owner as specified in the copyright notice associated with the article.