
Abstract
Speech perception is a multisensory process: what we hear can be affected by what we see. For instance, the McGurk effect occurs when auditory speech is presented in synchrony with discrepant visual information. A large number of studies have targeted the McGurk effect at the segmental level of speech (mainly consonant perception), which tends to be visually salient (lip-reading based), while the present study aims to extend the existing body of literature to the suprasegmental level, that is, investigating a McGurk effect for the identification of tones in Mandarin Chinese. Previous studies have shown that visual information does play a role in Chinese tone perception, and that the different tones correlate with variable movements of the head and neck. We constructed various tone combinations of congruent and incongruent auditory-visual materials (10 syllables with 16 tone combinations each) and presented them to native speakers of Mandarin Chinese and speakers of tone-naïve languages. In line with our previous work, we found that tone identification varies with individual tones, with tone 3 (the low-dipping tone) being the easiest one to identify, whereas tone 4 (the high-falling tone) was the most difficult one. We found that both groups of participants mainly relied on auditory input (instead of visual input), and that the auditory reliance for Chinese subjects was even stronger. The results did not show evidence for auditory-visual integration among native participants, while visual information is helpful for tone-naïve participants. However, even for this group, visual information only marginally increases the accuracy in the tone identification task, and this increase depends on the tone in question.
Keywords
1 Introduction
Speech perception is more than just an auditory event: it is a multisensory/multimodal process (Campbell, Dodd, & Burnham, 1998; Massaro, 1998). What we hear can be affected by what we see. For instance, seeing the face of the speaker normally helps the listener perceive speech better (Bailly, Perrier, & Vatikiotis-Bateson, 2012; Hirata & Kelly, 2010; Sumby & Pollack, 1954), especially in noisy environments (e.g., Burnham, Lau, Tam, & Schoknecht, 2001; Mixdorff, Hu, & Burnham, 2005). Similarly, seeing the face of a speaker also aids hearing impaired listeners in decoding the auditory speech signal (Desai, Stickney, & Zeng, 2008; Smith & Burnham, 2012).
One of the possible reasons why visual information benefits human speech perception is that it provides complimentary information about the place of articulation, which is sometimes difficult to deduce from auditory information alone (Binnie, Montgomery, & Jackson, 1974). For example, the unvoiced consonants /p/ (a bilabial) and /k/ (a velar), the voiced consonant pair /b/ and /d/ (a bilabial and alveolar, respectively), and the nasal /m/ (a bilabial) and the nasal alveolar /n/ (Massaro & Stork, 1998) are minimal pairs that are easy to confuse based on auditory information alone (Potamianos, Neti, Gravier, Garg, & Senior, 2003). Facial information, such as the shape of the lips, the position of the jaw, and the motion of the cheeks, helps listeners disambiguate between such confusable minimal pairs (Jiang, Alwan, Keating, Auer, & Bernstein, 2002).
While congruent visual information during articulation generally improves speech perception (Cutler & Chen, 1997; Ye & Connine, 1999), discrepant visual information can alter speech perception, which has been exemplified in the now classic McGurk effect (McGurk & MacDonald, 1976). McGurk and MacDonald demonstrated how visual information about the place of articulation (lip movements) can modify phonetic perception: observers perceived an auditory [ba] paired with a visual [ga] as “da.” Access to visual information about the source of speech can thus have clear effects on speech perception. This perceptual fusion between auditory and visual information is caused by the fact that the human visual system is highly sensitive to the distinction between labials (/b/ and /m/, for instance) and non-labials (such as /d/ and /n/) (Sekiyama, 1997). In other words, with the McGurk effect, visual information that is discrepant (in terms of place of articulation—lip movements) with the auditory signal misleads and biases perceptual judgment, whereas it normally helps auditory perception in the natural auditory-visual congruent situation.
Since McGurk and MacDonald (1976) first reported this fusion effect between auditory and visual information, a number of studies have been carried out across languages to investigate the nature of the effect with various combinations of auditory and visual syllables. The McGurk effect has been found in native speakers of various languages: for instance, English (McGurk & MacDonald, 1976), German and Spanish (Fuster-Duran, 1996), Dutch and Cantonese (de Gelder, Bertelson, Vroomen, & Chen, 1995), Italian (Bovo, Ciorba, Prosser, & Martini, 2009), Thai (Burnham & Dodd, 1996), Japanese (Sekiyama & Tohkura, 1991), and Chinese (Sekiyama, 1997). The majority of the studies tested one single language with native subjects; other studies tested one language with non-native and native subjects, for example, Austrian German with Hungarian subjects (Grassegger, 1995) and a series of cross-culture/intercultural studies on the McGurk effect that tested two languages with native and non-native subjects was also carried out to examine the inter-language differences in terms of the magnitude of the McGurk effect (Burnham & Dodd, 2018; Hayashi & Sekiyama, 1998; Sekiyama, 1997; Sekiyama & Tohkura, 1991).
The McGurk effect has been established as a language- and culture-dependent phenomenon: there is a robust McGurk effect in English-speaking languages/cultures, while it is relatively weak in Asian languages/cultures. Comparing native speakers of Japanese with native speakers of American English, Sekiyama (1994) reported that the English subjects showed a larger McGurk effect than the Japanese subjects. Subsequently, Sekiyama (1997) found that the native speakers of Japanese showed a larger McGurk effect than Mandarin Chinese speakers. In line with these results, Burnham and Lau (1998) found a larger McGurk effect in English speakers as compared to Cantonese speakers.
Sekiyama (1997) proposed two major factors to explain why there are inter-language differences in the McGurk effect (weaker in Asian languages, stronger in English-speaking cultures). One is a cultural factor, which has been developed as the face-avoidance hypothesis. In some Asian cultures, like the Japanese and Chinese, as a social rule, it is discouraged to directly look at the speakers, which might suppress access to the information needed to integrate the visual stimuli with auditory information, even in a face-to-face communicative setting. The other factor is based on a linguistic characteristic of many Asian languages, and is known as the tone hypothesis. Tonal languages (such as Mandarin) and semi-tonal languages (such as Japanese) have fewer phonemes (consonants, vowels, and syllables) and a simpler syllabic and phonological structure (in Japanese, at least) compared to English. Because of this, the lip-read information may be used less in speech processing (Sekiyama & Burnham, 2008). Therefore, the more tonal the language, the greater the reliance on auditory information, and thus a less strong McGurk effect (Burnham & Lau, 1998; Magnotti et al., 2015).
In order to test the tone hypothesis, Burnham and Lau (1998) explored the effect of tonal information on auditory reliance in the McGurk effect, by presenting both tonal (Cantonese) and non-tonal (English) language speakers with McGurk stimuli ([ba] [ga]) in which the tone on syllables either varied or remained constant (pronounced by Cantonese and Thai speakers) across trials. They found that Cantonese subjects relied more on auditory information alone than (Australian) English subjects did; this reliance on auditory information was stronger in the condition with tone variation compared to stimuli where tone was kept constant.
Crucially, tone languages, such as Mandarin Chinese, do not only rely on phonological distinctions between vowels and consonants, but additionally use tones to distinguish word meanings. This is different from most European languages, which almost exclusively rely on phonological distinctions at the segmental level. For instance, if the Mandarin Chinese syllable /ma/ is produced with a rising tone, it means “hemp,” whereas it means “scold” when produced with a falling tone. Pitch accent languages, such as Japanese, also have some tonal properties (high and low pitch), but to a much smaller extent than Mandarin Chinese. Scholars such as Sekiyama (1997) and Magnotti et al. (2015) have explored the McGurk effect in native speakers of Mandarin Chinese (as described above), although in all cases they targeted the McGurk effect at the segmental level of speech (mainly consonant perception). Consonant perception is fairly susceptive to visual information, because place of articulation is a major determinant (i.e., lip-read), and that is relatively more visually salient, while the present study extends the auditory-visual integration to the suprasegmental level, that is, the four Mandarin Chinese tones.
Previous studies have shown that visual information plays a role in Chinese tone perception (e.g., Chen & Massaro, 2008; Han, Goudbeek, Mos, & Swerts, 2018; Mixdorff et al., 2005; Reid et al., 2015; Shaw, Chen, Proctor, Derrick, & Dakhoul, 2014), although the effects of visual information are subtle. For example, based on visual information only, native speakers of Cantonese can still distinguish Cantonese tones significantly above chance under certain conditions (Burnham, Ciocca, & Stokes, 2001). Similarly, Chen and Massaro (2008) asked Mandarin perceivers to identify Mandarin Chinese tones in the visual-only condition, and they found that the performance of native speakers is statistically significant above chance. The fact that visual information does provide relevant cues for tone identification points to the potential of multisensory integration at the tone level, possibly leading to a McGurk effect. Although it is unclear what the exact visual cues are for tone identification, there is some evidence for the existence of visual cues for individual Mandarin tones. Specifically, tone identification has been found to mainly depend on the (intensity of the) movements of the mouth, head/chin, and neck: specifically, there is little to no activity for tone 1, some activity for tone 2 and tone 4 (although very brief for tone 4), with tone 3 having the most activity, namely a dipping head/chin. Duration (time) differences between the tones may be caused by variation in the movements of the mouth, as more complex movements would require more time to be realized (Chen & Massaro, 2008). Similarly, Vatikiotis-Bateson and Yehia (1996) and Yehia, Kuratate, and Vatikiotis-Bateson (2002) found strong correlations between head movements and F0. Such visual cues that relate to more general movements of the head have previously also been reported to function as correlates of larger scale prosodic structures in other languages, for example, quick movements of the head that co-occur with pitch accents (Krahmer & Swerts, 2007). Whether there is auditory-visual integration in Mandarin Chinese in the form of a tonal McGurk effect is one of the two main research questions of this study. To answer this question, we constructed various combinations of congruent and incongruent auditory and visual tone stimuli and presented them to test Chinese participants.
The other main question is whether visual information affects tone perception for non-native speakers differently. More specifically, we investigate the relative contribution of auditory and visual information in Mandarin Chinese tone identification in tone-naïve speakers. Sekiyama argued in her study (1994) that Japanese listeners as native speakers are sensitive to the discrepancy and incompatibility between the auditory and visual information in the cross-dubbed material, and they therefore tend to separate the conflicting visual information from the auditory information, when audition provides sufficient information (i.e., in a noise-free speech condition). The American participants in her study, on the other hand, showed a larger McGurk effect, because they tend to integrate the information when they perceive the stimuli as unintelligible, as evidenced by the fact that the magnitude of the McGurk effect is the largest when American participants were presented with Japanese stimuli (leading to the so-called intelligibility hypothesis by Sekiyama in 1997). In addition, apart from a difference in the strength of the effect, the pattern of confusion (i.e., how the auditory percept is affected by visual cues) may also differ between groups of participants, given that the tones are phonologically relevant for only one of the compared languages.
In summary, we aim to answer two questions in this study: the first question is whether a McGurk effect can also be discerned at the tone level in native speakers of Mandarin Chinese. Secondly, we want to know how visual information affects tone perception for native speakers and non-native (tone-naïve) speakers. More specifically, we compare the relative contribution of auditory and visual information during Mandarin Chinese tone perception with congruent and incongruent auditory and visual materials for speakers of Mandarin Chinese and speakers of non-tonal languages. In general, we assume that (native and tone-naïve) participants mainly depend on auditory information when they have to identify Mandarin Chinese tones: both groups of participants are expected to identify the congruent stimuli more accurately than the incongruent ones, because (congruent) visual information can facilitate speech perception, especially for perceivers who lack comprehensive knowledge of the language (tone-naïve participants), while this additional value of visual cues would be less important for native participants.
When participants are presented with the incongruent experimental materials, we consider three types of possible outcomes: non-integration, integration, and attenuation. For example, if the auditory input is mid-rising tone 2, but the visual input is high-level tone 1, and it turns out that the participant’s percept is either tone 1 or tone 2, then this would indicate that perceivers choose to ignore the information in one channel and give preference to the other channel (non-integration). Another possible outcome is that the participants perceive a tone that is different from both tone 1 and tone 2 and that, consequently, these cues were combined into a novel percept (e.g., a high-falling tone 4 or low-dipping tone 3); this would be a case of integration, as perceivers appear to combine the acoustic and visual channel and integrate them into a “new” tone. The third possible outcome would be a case where participants perceive a non-existing tone, whose height is between high (tone 1) and middle (tone 2) and the direction is in between rising and level (which we would call attenuation). Our current study will allow us to test whether the perceptual results can be explained in terms of integration or non-integration. It is not possible to differentiate between the first and third scenarios (attenuation), because of the nature of the experiment. With four obligatory response categories, participants still need to choose one of the two modalities, but their choice might be less certain. We expect that non-integration is most likely to happen for native Chinese participants (who are likely to ignore the visual channel), given that they can perfectly identify tones without seeing the speaker’s face if the auditory information is clear. However, predicting the patterns that will emerge for the tone-naïve participants will be less straightforward. Given visual information would be more pronounced among tone-naïve participants, integration or non-integration are both likely to happen. The precise process might also depend on the difficulty tone-naïve participants have with identifying certain tones. In particular, it seems that the high-level tone 1 is more likely to be confused by inconsistent visual cues, as there are little or no visual activities in the nature of this tone. Since tone 3 is the mostly visually salient one (Mixdorff et al., 2005), it is expected that visual cues for tone 3 will exert the most influence on tone perception. Specific potential mixed patterns are expected to be found in the actual experimental results (which we present in the form of a confusion matrix).
2 Methodology
Two groups of participants (native Chinese and non-tonal language speakers) were tested with Chinese tone combinations of auditory-visual congruent stimuli (AxVx) and incongruent stimuli (AxVy). Accuracy, defined as the percentage correct identification of a tone based on its auditory realization, was used as the dependent variable.
2.1 Participants
A total of 142 participants comprised the two groups with different language backgrounds. The tone-naïve group consisted of 81 non-tonal language speakers (mean age 22, 49 female), mainly with a Dutch language background (n = 65). They were recruited from the participant pool for students of Communication and Information Sciences at Tilburg University. The other group consisted of 61 native speakers of Mandarin Chinese (mean age 25, 45 female) who were enrolled as students at Tilburg University, and they were recruited on campus. The participants either received 0.5 course credit for their participation or a gift card worth 5 euros.
2.2 Stimuli
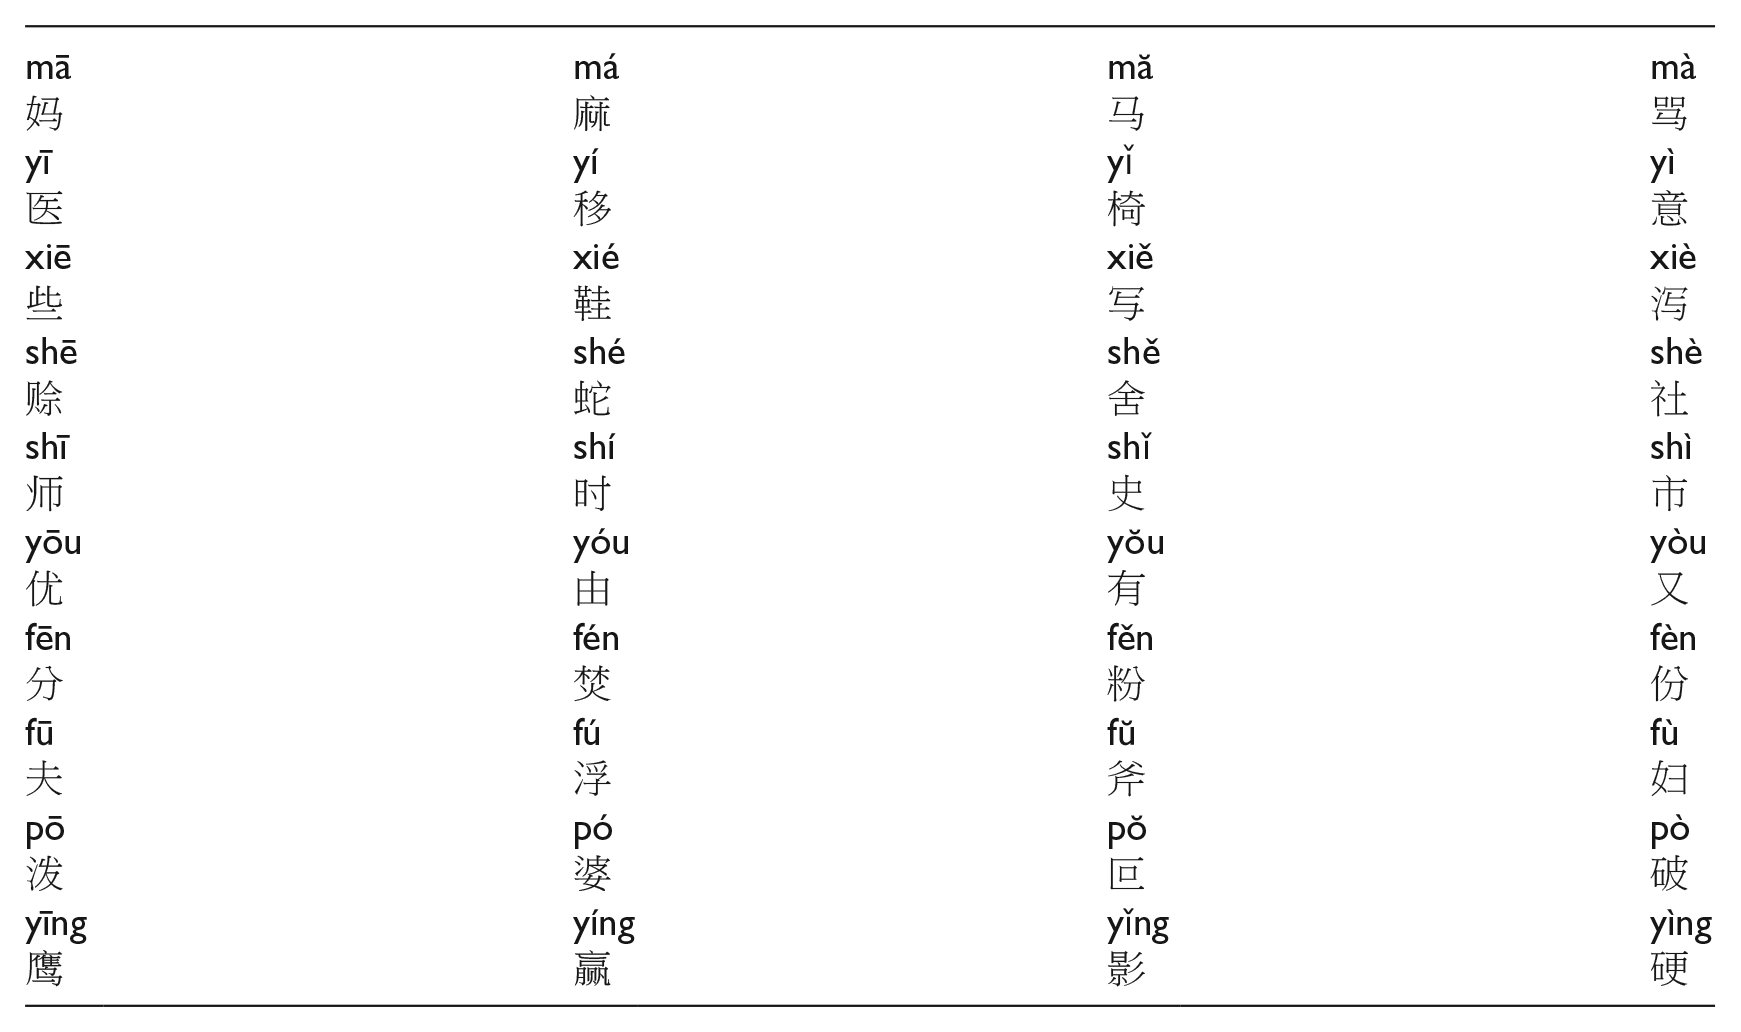
A word list with 10 Mandarin monosyllables (e.g., ma, ying . . .) was constructed (based on stimulus material from Francis, Ciocca, Ma, & Fenn, 2008, and from Chen & Massaro, 2008, previously used by Han et al., 2018). Each of these syllables was chosen in such a way that the four tones would generate four different meanings, resulting in 40 (10 syllables × 4 tones) different existing words in Mandarin Chinese (see the Appendix for a complete list of the stimuli).
A female native Mandarin Chinese speaker (age 31) produced the 40 words. She was given the instruction to “pronounce these words as if you were addressing someone who is not a Chinese speaker.” There were no other instructions or constraints imposed on the way the stimuli should be produced. Every stimulus was pronounced twice. We used a Sony HDR-XR550VE camera to record the speaker’s image and sound, resulting in one long video clip containing 80 words (40 words, each produced twice).
Windows Movie Maker (2018) was used to segment the long clip into individual tokens, with each token containing one syllable. All individual tokens last 2 seconds. We used Adobe Premiere Pro CC 2019 to create congruent and incongruent experimental stimuli by separating the image and the sound of one video into two channels and mixing the audio from one syllable with the image of the other. Care was taken to get precise synchronization between audio and video signals. These were aligned at syllable onset and the negligible perceptual temporal discrepancies at the syllable offset for incongruent tones were not discernable for our participants. In this way, for each stimulus, there are 12 incongruent combinations (A1V2, A1V3, A1V4, A2V1, A2V3, A2V4, A3V1, A3V2, A3V4, A4V1, A4V2, A4V3, where A refers to the audio channel and V to the video channel) and four congruent combinations (A1V1, A2V2, A3V3, A4V4). In order to ensure uniformity, the congruent stimuli were also cross-spliced: for each stimulus, the image is taken from the first recorded clip, and the sound from the second video clip. In total, 160 (10 syllables × 16 combinations) experimental stimuli were constructed.
In addition, to make sure that the participants would always attend the visual information, instead of focusing on the auditory channel alone, a 2-second silent video clip was created with a visible red dot on a still face (see Figure 1). When participants saw this red dot video, they had to press a designated button. Four of these video clips were mixed into those 160 tonal materials. 1

Screenshot of the red dot video.
2.3 Procedure
All sessions were conducted in a sound-attenuated room. E-Prime 3.0 software (Psychology Software Tools, Pittsburgh, PA) was used to set up and run the experiment. The full procedure consisted of three blocks: instruction, practice trials, and test trials. Before the experiment started, participants were asked to fill out a questionnaire that assessed their language background in order to be able to assign each participant to one of the participant groups (i.e., native speaker of Mandarin Chinese, native speaker of a non-tonal language). Native speakers of languages with tonal properties other than Mandarin Chinese were excluded from participation (there were four of them in total: two Norwegian, one Yoruba, and one Lithuanian). After that, a brief instruction about Mandarin Chinese tones was first displayed on the screen (see Figure 2): “there are four tones in Mandarin Chinese: the first tone is a High-Level tone, symbolized as ‘ ¯ ’, the second tone is a Mid-Rising tone, symbolized as ‘ ̷ ’, the third tone is a Low-Dipping tone, symbolized as ‘ ˅ ,’ and the fourth tone is a High-Falling tone, symbolized as ‘ \ .’
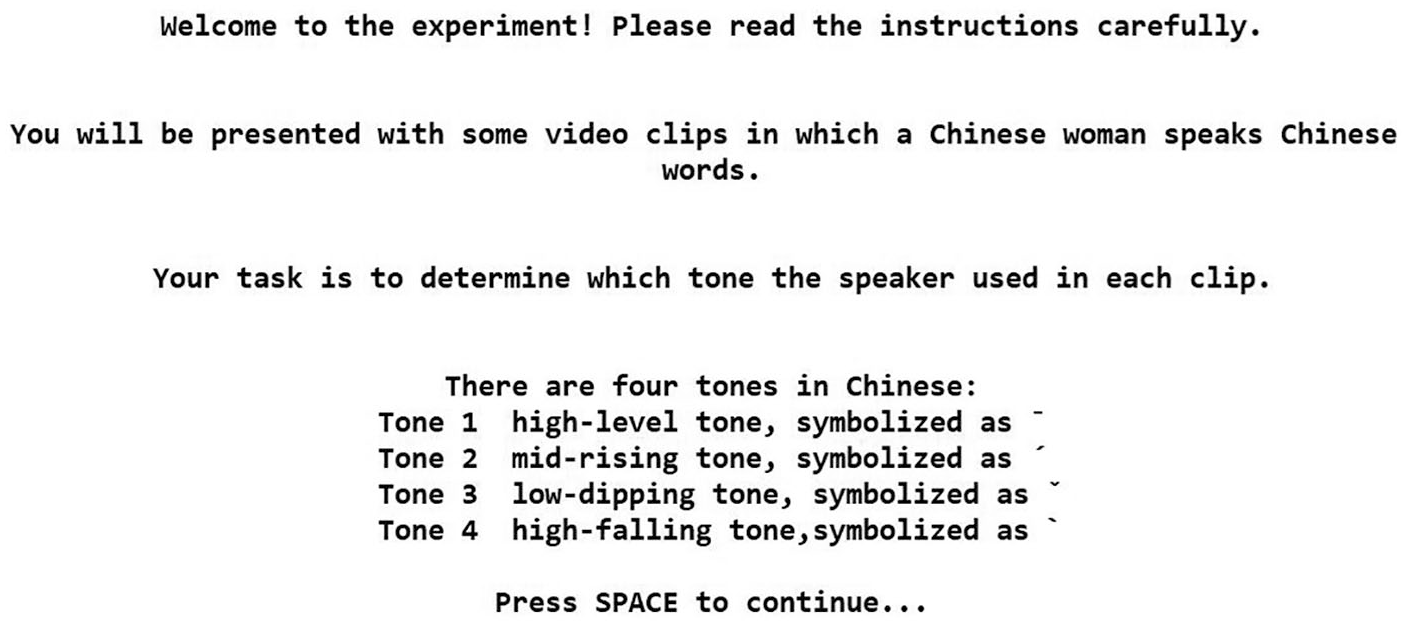
Screenshot of a brief introduction for Mandarin Chinese tones.
The task of the participants was to identify the tones they perceived from the videos, written as “to determine which tone the speaker used.” Six practice trials (five tonal video clips with a different speaker from the speaker in the test trial and one red dot clip) were included to familiarize participants with the testing procedure. After the practice trials, the experiment leader checked with the participants whether they had fully understood the concept of tones (in particular the symbols) and the task. 2 Then, the testing part of the study started (Figure 3 illustrates the testing path). The 164 test stimuli (160 tonal clips and four red dot clips) were presented in an individually randomized order (operated by E-Prime). The time for participants to give responses was 10 seconds, and there was no feedback (correct or wrong) given for their responses. Responses given outside the 10 seconds were treated as missing values.

Time course of the testing stimuli.
Participants wore headsets, and were seated directly in front of the PC running the experiment. All stimuli were presented at a comfortable hearing level. The participants were instructed to press the designated keys with the corresponding tone symbols and the red dot on them (“ ¯ ,” “ ̷ ,” “ ˅ ,” “ \ ,” “RD,” see Figure 4) as accurately and as quickly as possible after they made their decisions. Their responses were recorded automatically by E-prime.

Picture of the designated keys with tone symbols and red dot (RD).
3 Results
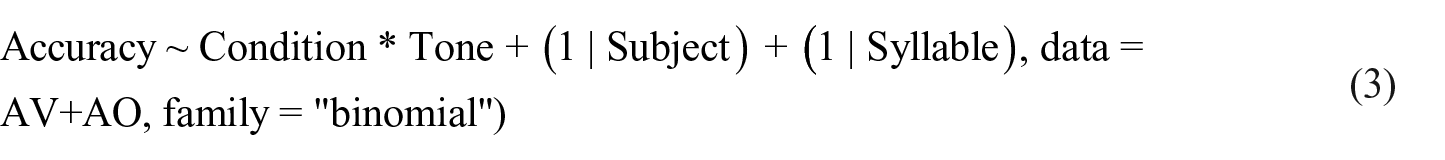
This study is designed to investigate the perception of incongruent auditory-visual Mandarin Chinese tonal information. The experiment has a complete 2 × 2 design with congruency (congruent or incongruent) as the main within-subject factor and language background (native speakers of Mandarin Chinese or non-tonal languages) as the major between-subject factor. We included tone as another within-subject factor, and other factors, namely subject and syllable, were introduced as random factors. The results were analyzed by fitting a linear mixed-effects model (in R 3.6.0) for the dependent variable (the proportion of correct responses) 3 for both participant groups separately (Baayen, 2008) and by presenting confusion matrices for each auditory-visual combination. A correct response is defined as the proportion of correct identification of a tone based on auditory input. In addition, since there are four tones as the options, the basic chance of giving a correct response is 25%.
3.1 How would a McGurk effect work at the tone level for native speakers of Chinese?
To answer this first question, the performance of the 61 native Chinese participants was analyzed. Statistically, an effect of auditory-visual integration would be apparent in a main effect of congruency. To investigate this, it is necessary to incorporate random effects of subjects as well as syllables. In order to do so, we fitted a linear mixed-effects model in R (version 3.6.0, R Core Team, 2019) using the package lme4 (Bates, Maechler, Bolker, & Walker, 2015). Following Barr, Levy, Scheepers, and Tily (2013), who recommend fitting a so-called maximal model containing all random slopes and intercepts, we started out with a maximal model and removed random slopes until the model fit reached convergence. In our case, the first model that converged was a random intercept only model 4 :
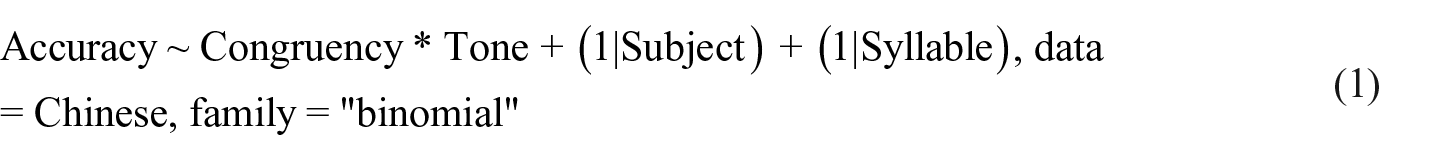
This model fitted the data reasonably well (AIC = 568.8, log likelihood = −278.4), but did not yield a significant effect of congruency (β = 0.22, SE = 0.75, z = 0.30, p = 0.77), indicating that participants judged congruent stimuli (M = .994, SD = 0.071) equally well as incongruent stimuli (M = .995, SD = 0.067). The analysis did reveal a significant effect of tone (β = 0.48, SE = 0.16, z = 2.955, p = 0.003), reflecting small but statistically significant differences between (some of) the very high levels of performance for the individual tones (Mtone1 = .995, SD tone1 = 0.070, Mtone2 = .989, SD tone2 = 0.104, Mtone3 = .997, SD tone3 = 0.057, Mtone4 = .999, SD tone4 = 0.020). Finally, there was no significant interaction between congruency and tone (β = −0.05, SE = 0.33, z = −0.16, p = 0.87). Foreshadowing the discussions, we deem it quite likely that the absence of a significant effect is due to ceiling effects caused by the very high accuracy. This is less likely to happen in our sample of tone-naïve listeners.
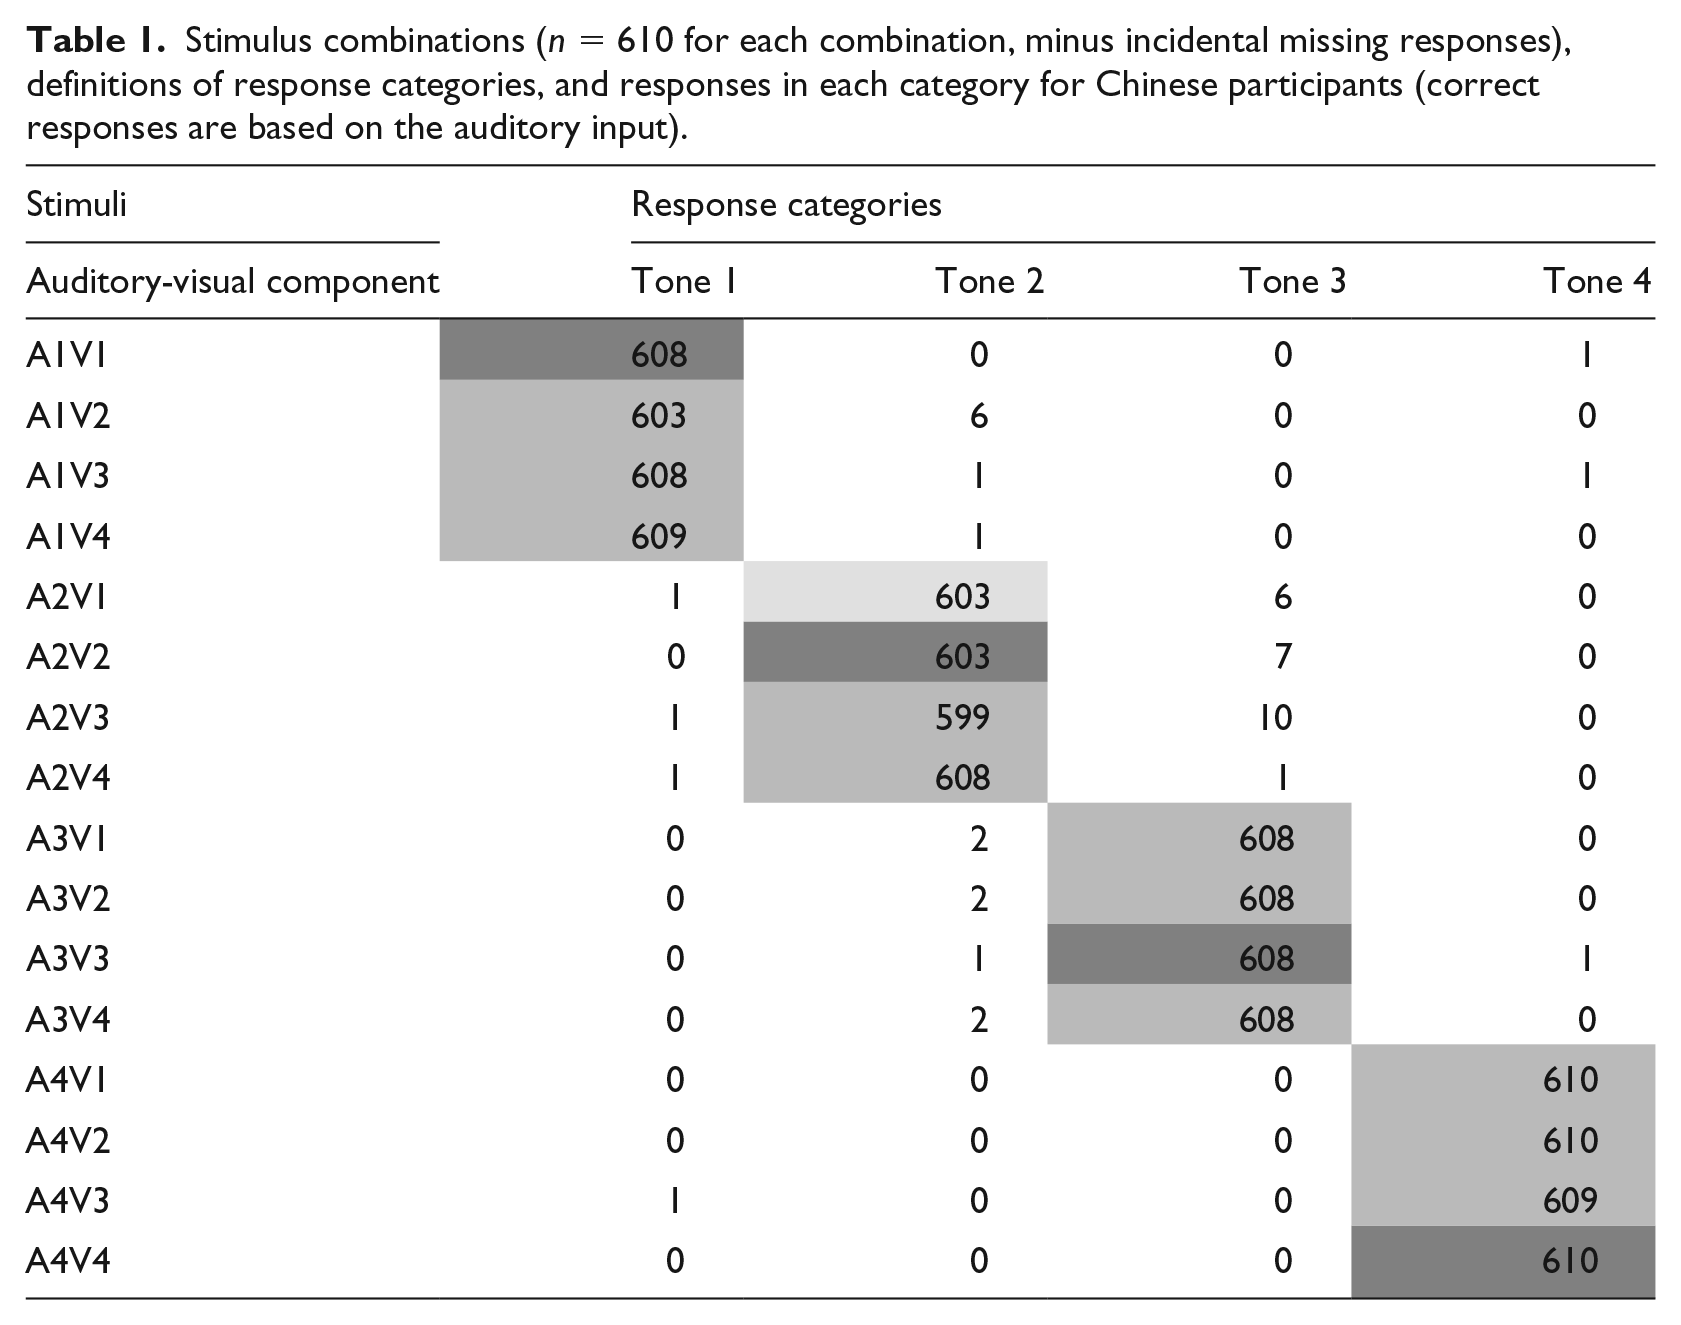
Table 1 gives the correct responses for each tone as a function of the various AV combinations. The data in the confusion matrix shows that the Chinese participants did indeed perform very well in this tone identification task. Native speakers of Chinese had no difficulty identifying the tones in the discrepant stimuli. The scores in Table 1 indicate that the perception of native Chinese is totally driven by the auditory input. Accordingly, the additional visual information did not affect native speakers significantly, even when the visual cues do not match the auditory information.
Stimulus combinations (n = 610 for each combination, minus incidental missing responses), definitions of response categories, and responses in each category for Chinese participants (correct responses are based on the auditory input).
3.2 How much do visual cues affect tone-naïve listeners in identifying Mandarin Chinese tones?
While the first set of analyses shows that visual cues did not significantly influence native Chinese in identifying Mandarin tones, we now focus on the performance of the 81 tone-naïve listeners (mainly Dutch) to see how they responded to congruent and incongruent stimuli. To answer this question, we again started to fit a maximal linear mixed-effects model. The first model fit that reached convergence was the following 5 :
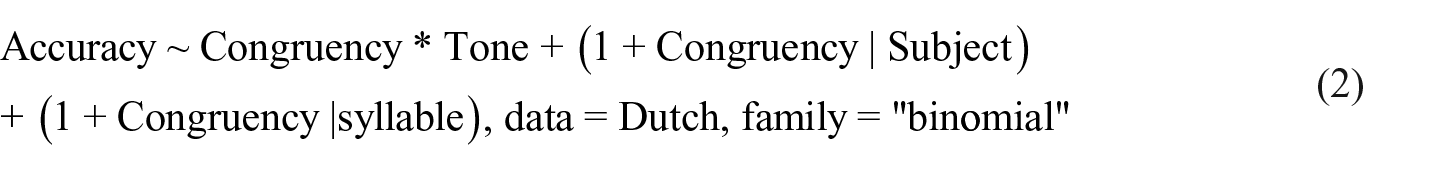
This model showed significant effects of both independent variables and their interaction. The effect of congruency (β = 0.83, SE = 0.11, z = 7.55, p < 0.001) indicated that listeners judged congruent stimuli (M = .43, SD = 0.50) more accurately than incongruent stimuli (M = .36, SD = 0.48). When there is a discrepancy between visual cues and acoustic information (incongruent stimuli), listeners tend to rely more on the auditory input than the visual cues (M = .36 vs. M = .25; t (9719) = 15.05, p < .001). In addition, the significant effect of tone shows the difficulty our tone-naïve listeners have with tone 4 (Mtone4 = .21, SDtone4 = 0.40) and how well they do with tone 3 (Mtone3 = .55, SDtone3 = 0.50; Mtone1 = .35, SDtone1 = 0.48; Mtone2 = .41, SDtone2 = 0.49). Finally, these effects are qualified by a significant interaction between congruency and tone (β = −0.21, SE = 0.04, z = −5.28, p < 0.001), mostly indicating that the judgment accuracy of tone 3 and tone 4 is not affected much by congruency, but the accuracy of tone 1 and 2 judgments increases when the auditory and visual information are consistent.
The tonal confusion matrix (Table 2) might give more insight into the way they perceive Mandarin tones.
Stimulus combinations (n = 810 for each combination, minus incidental missing responses), definitions of response categories, and responses in each category for tone-naïve participants (correct responses are based on the auditory input).
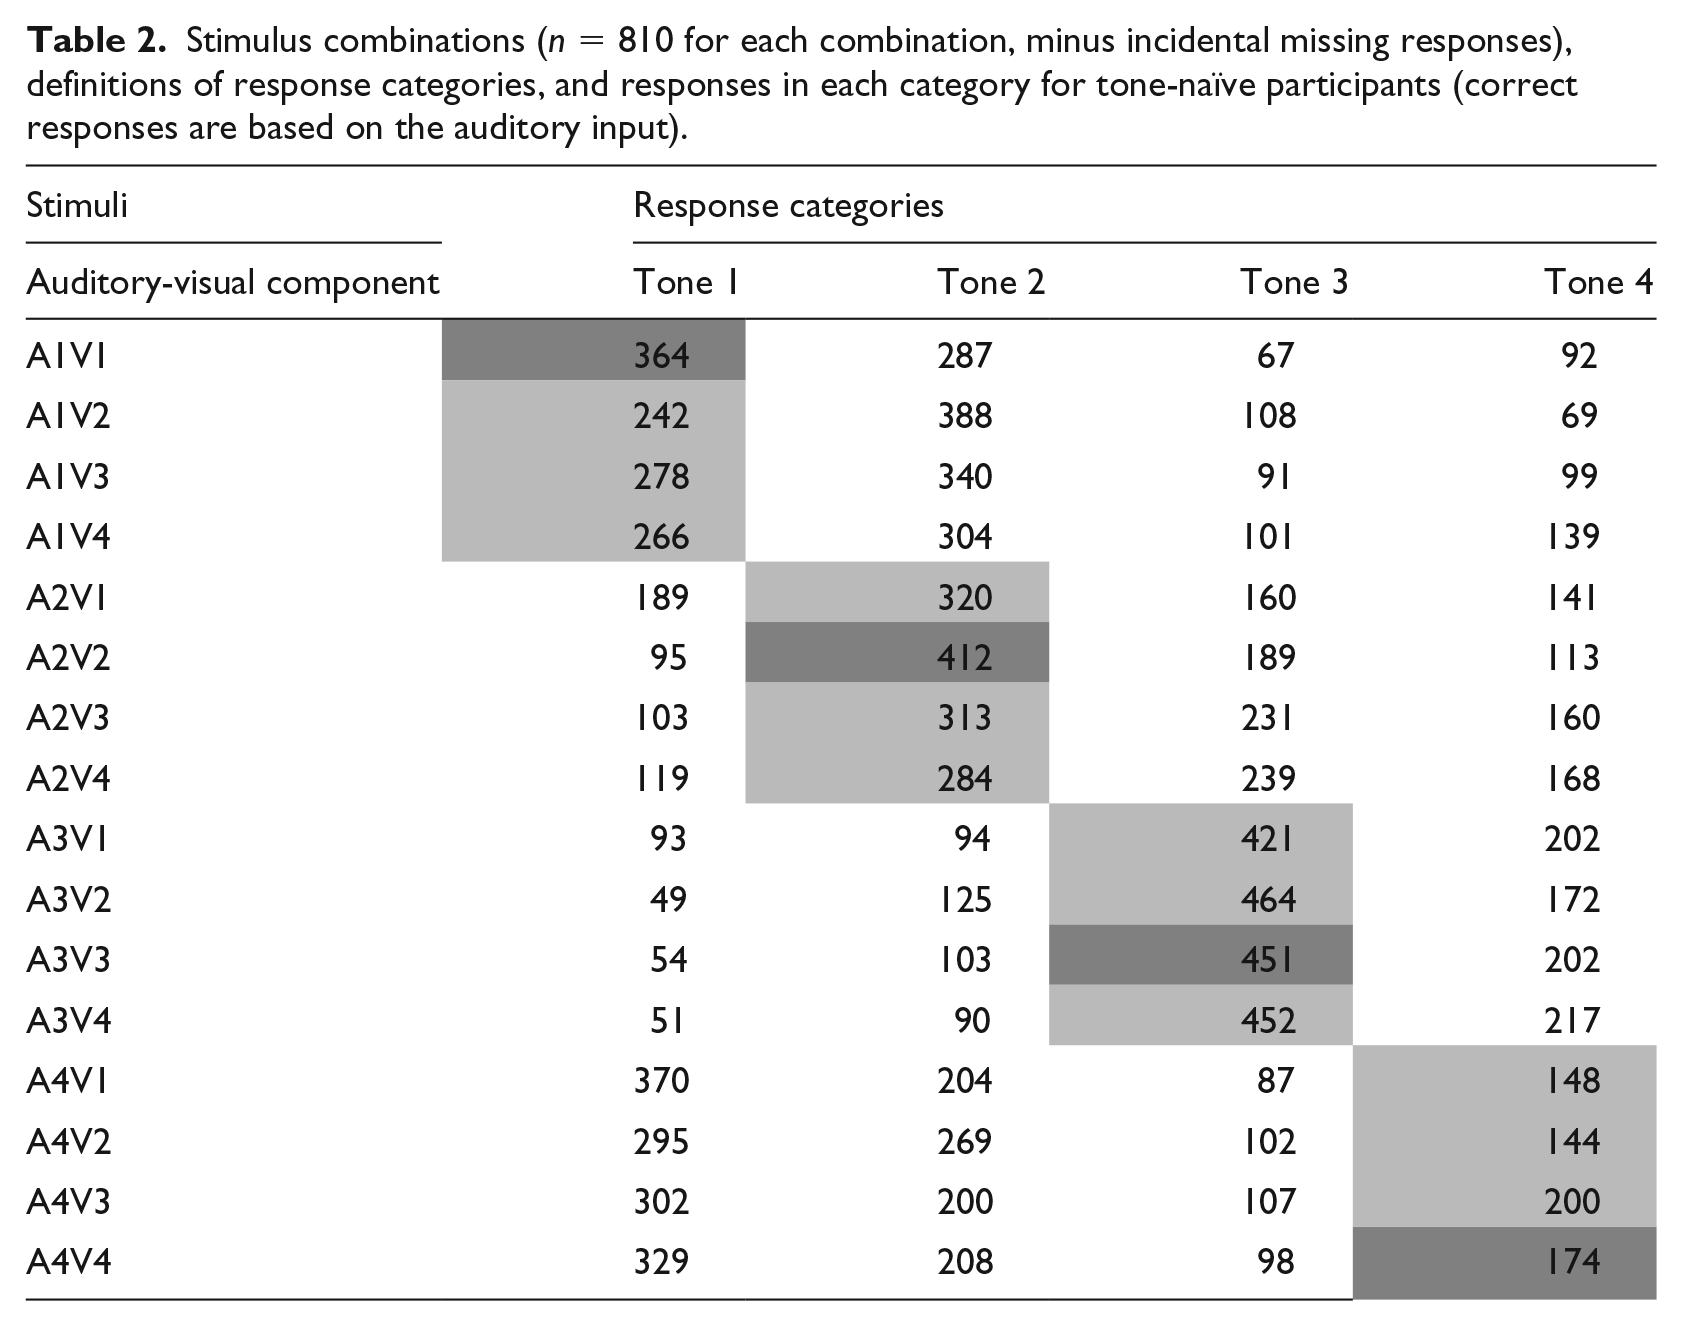
The data in Table 2 shows that the low-dipping tone 3 is the least confusing tone for tone-naïve participants (M = .56 and M = .55 for congruent and incongruent stimuli, respectively, with M = .55 being the average of the three incongruent variations), while the high-falling tone 4 is the most commonly misidentified tone (M = .22 and M = .20 for congruent and incongruent stimuli, respectively, with M = .20 being the average of the three incongruent variations). For the incongruent stimuli, tone 4 is mostly confused with the high-level tone 1 (M = .41 in congruent and M = .40 in incongruent stimuli, with M = .40 being the average of the three incongruent variations), although the confusions are not necessarily symmetrical: tone 1 was mostly confused with mid-rising tone 2 (M = .35 and M = .42 for congruent and incongruent stimuli, respectively), rather than with tone 4. Tone 2 is mostly confused with tone 3 (i.e., when tone-naïve participants heard a rising tone 2, but saw a falling tone 4, they most likely perceived it as low-dipping tone 3), and tone 3 was most likely to be perceived as tone 4. Notably, for tone-naïve participants, not all the congruent stimuli were easier to identify than the incongruent ones (e.g., the accuracy for A3V3 was lower than for A3V2). As mentioned above, there is an interaction between tone and congruency; the congruency differently influenced the identification of individual tones: congruent visual information contributed more to the identifications of tone 1 and tone 2 than to tone 3 and tone 4.
3.3 What are the roles of congruent and incongruent visual information in tone perception?
Our results show that congruent stimuli are judged more accurately than incongruent stimuli. However, this could be due to two effects (or a combination of them). An obvious first explanation is that perceivers benefit from additional congruent visual information, which increases the accuracy of their tone identification of congruent stimuli compared to that of incongruent stimuli. Alternatively, perceivers could be hampered by incongruent audio-visual information, making their identification less accurate compared to audio-visually congruent stimuli. In order to assess the contribution of visual information, we compared our current results with those of a previous study (Han, Goudbeek, Mos, & Swerts, 2019) in which 43 different Dutch listeners judged the same stimuli (uttered by four speakers), but in an audio-only condition. If performance in the audio-only condition is worse than in the congruent audio-visual condition, that would be evidence for the first explanation, where congruent visual information aids tone identification. Alternatively, if performance in the audio-only condition is better than or similar to that in the congruent audio-visual condition, that would be evidence for the idea the incongruent visual information hampers performance.
As before, we fitted a linear mixed-effects model with accuracy as the dependent variable and condition (audio-only versus (congruent) audio-visual) and tone as independent variables. Syllable and subject (and initially, speaker 6 ) were introduced as random effects, and the first model that converged was as follows:
This model showed a (very) small effect of condition (β = 0.45, SE = 0.16, z = 2.77, p = 0.006), indicating that performance in the audio-visual condition was slightly better (M = .43, SD = 0.50) than in the audio-only condition (M = .42, SD = 0.49). This effect was quantified by a significant interaction between condition and tone (β = −0.17, SE = 0.04, z = −4.17, p < 0.001), showing that accuracy for tone 2 improves with additional visual information, while some tones are unaffected (tone 1 and tone 4), and tone 3 gets somewhat worse. Most of this is likely related to the inherent differences in classification accuracy of tones, as reflected by the main effect of tone (β = −0.12, SE = 0.02, z = −5.05, p < 0.001). As before, tone 3 is the most accurately identified tone (M = .59, SD = 0.50) and tone 4 is the most difficult one to identify (M = .24, SD = 0.43), with the other two tones in between (Mtone1 = .43, SDtone1 = 0.50, Mtone2 = .44, SDtone2 = 0.50). While this result is strictly speaking compatible with the interpretation that visual information is helpful, it only marginally increases the accuracy, and this increase depends on the tone in question. On the other hand, these data provide counterevidence for the idea that adding visual information is harmful in itself.
4 Discussion and conclusion
In this study, we tried to answer two questions: firstly, whether a McGurk effect can also be discerned at the tone level in native speakers of Mandarin Chinese. Secondly, how visual information affects tone perception for native speakers and non-native (tone-naïve) speakers. To do this, we extended the existing body of auditory-visual integration (McGurk effect) studies to the suprasegmental level of Mandarin Chinese tones. When comparing the relative contribution of auditory and visual information during Mandarin Chinese tone perception in a noise-free condition with congruent and incongruent auditory and visual Chinese material for native speakers of Chinese and non-tonal languages (mainly Dutch), we found that visual information did not significantly contribute to the tone identification for native speakers of Mandarin Chinese, and when there is a discrepancy between visual cues and acoustic information (native and tone-naïve), participants tend to rely more on the auditory input than on the visual cues. Unlike the native speakers of Mandarin Chinese, tone-naïve participants were significantly influenced by the visual information during their auditory-visual integration, and they identify tones more accurately in congruent stimuli than in incongruent stimuli.
Strictly speaking, this study is different from the original McGurk study and the other studies that applied a McGurk effect to speakers of different languages (e.g., Sekiyama, 1997): instead of exploring consonant perception, we focused on tone identification and the visual cues that improve/alter the acoustic perception. This implies a shift from lip-reading (visual cues for consonants perception) to a focus on the whole face, head, and neck movements (visual cues for tone identification). However, this study is still one that investigates possible audio-visual interactions across tonal and non-tonal language speakers. The concept of the McGurk effect was applied to the way the experimental material was created: various tone combinations of the auditory and visual information were used.
The finding that native speakers of Mandarin Chinese mainly relied on the acoustic information of the input when the acoustic information is clear (no added noise or stimulus degradation) and that visual information neither improved nor hampered the tone identification for native Chinese speakers (they identify the congruent stimuli equally well as the incongruent ones) implies that they were able to ignore the visual information, which is in line with our prediction of non-integration for native participants. However, the lack of integration we observed among native Chinese participants does not imply that there is no McGurk effect at the tone level. The absence of a significant visual effect could be due to ceiling effects caused by the very high accuracy. To avoid the emergence of such a ceiling effect, follow up experiments could use a degraded audio signal (as in Burnham et al., 2001) to show a potential fusion of auditory and visual channels in native speakers. Note that despite this experimental incentive to look at faces, that Chinese subjects were forced to have a look at the face, due to the experimental set-up that included stimuli that required a visual task (identify red dots), and may have unlearned to pay attention to visual cues in the facial area. This may then still be consistent with the outcome of the Japanese speech processing experiment (Sekiyama, 1994), in which participants initially paid attention to the visual information and then separated it subsequently from the auditory information, because they sensed the discrepancy between the two channels. If that was indeed the case, then it would suggest that integration did in fact occur among native participants, but it was so early and fast that it could not be captured by our experiment (the participants have to wait to give their response after the stimulus is displayed). In connection with the issue of a ceiling effect in accuracy, it may be useful for future studies to also look at measures (e.g., reaction times) other than accuracy among the native speakers in order to detect a potential effect of visual cues (Chen, 2003; Ladd & Morton, 1997; Vanrell, Mascaró, Torres-Tamarit, & Prieto, 2013).
While native Chinese participants most likely ignored the visual information, tone-naïve participants identified more tones accurately when stimuli were congruent than with incongruent stimuli (in other words, they did take visual information into account in the tone identification task). However, we also found that tone-naïve participants, just as the native participants, relied more on auditory information than visual information when perceiving an unintelligible language (Mandarin Chinese), which is also in line with our hypothesis. The confusion matrix revealed some patterns for cases where tone-naïve participants were presented with incongruent experimental stimuli: whenever tone 1 was presented (i.e., the auditory input is tone 1) with incongruent visual cues (i.e., A1V2, A1V3, or A1V4), tone 2 was chosen as the answer most often in all three of the incongruent conditions. When tone 2 or tone 3 were in the auditory channel, tone-naïve participants gave their answers based on the auditory information (i.e., they picked tone 2 or tone 3 as their answer most often). When the auditory input was tone 4, the majority of the answers were tone 1. Therefore, for incongruent combinations in tone 1, we see one possible example of “non-integration” (as discussed in the introduction) giving preference to the visual channel (A1V2) and two examples of “integration” (A1V3 and A1V4) where the new tone 2 occurred as the majority response. For tone 4, we see similar patterns with both “integration” (A4V1) and “non-integration” (A4V2 and A4V3) occurring. The responses for incongruent conditions in tone 2 and tone 3 paint a different picture, given that the most often picked answer was still tone 2 or tone 3. That is, we see examples of “non-integration” as participants seemed to rely on the auditory channel in these cases. These varied effects indicate that auditory-visual integration happened among tone-naïve participants, albeit not for all incongruent stimuli. The reasons why a certain tone mostly is confused with another specific tone could be various. For example, one of the possible reasons for choosing tone 1 whenever tone 4 was presented could be that tone 1 is perceived as a kind of default tone, with an unmarked configuration (e.g., a tone without a clear contour). Thus, when the participants experience difficulties grasping the changing pattern of the pitch, they tend to choose the default tone, since pitch height and pitch contour are not mastered in parallel (Wang, Jongman, & Sereno, 2003). This can also be explained from a cross-linguistic perspective about the categorical nature of the perception of tone contrasts by speakers of tonal languages and speakers of non-tonal languages (e.g., Hallé, Chang, & Best, 2004; but also see Krishnan, Gandour, & Bidelman, 2010, for a different, more neurobiologically oriented perspective).
In addition, the tone confusion matrices revealed that the intrinsic characteristics of the tones appear to be the main contributors to tone identification. Tone 3 was the easiest tone for listeners to identify, irrespective of the visual information that had been added to the auditory information. Tone 4 was the most difficult one to correctly recognize. This is possibly due to their specific acoustic attributes—tone 3 has the longest duration and two intensity peaks, while tone 4 has the shortest duration, and only one intensity peak. Such features of the acoustic information have been preserved in the stimuli and they may have visual correlates as well (Mixdorff et al., 2005; Xu & Sun, 2002). For example, in the case of Mandarin tone 3 (low-dipping in terms of height and contour), the correlated head/neck motion during tone production should be signaled by a low-falling-rising movement. When present, these visual cues seem to be used by listeners during auditory-visual perception (Vatikiotis-Bateson, Kroos, Kuratate, Munhall, & Pitermann, 2000), which has been shown by our finding of a significant higher accuracy in the auditory-visual condition as compared to the audio-only condition. Such result indicates that visual information helps tone-naïve participants to identify Mandarin tones. However, it only marginally increases the accuracy, and this increase depends on the tone in question: the accuracy of tone 3 and tone 4 is not affected much by congruency, but the accuracy of tone 1 and 2 judgments increases when the auditory and visual information are consistent.
Note also that the visual cues from the speaker in these videos are natural and, consequently, fairly subtle. We did not give extra instructions to the speaker about how to read out the Chinese words/tones, except for the instruction that she had to imagine addressing a foreigner. Native listeners have no difficulties recognizing the tones, which indicates that these recordings are unambiguous for them. On the other hand, our tone-naïve listeners do rely somewhat on visual information to assist their tone identification. In that case, salient visual information may better serve the purpose of testing congruent and incongruent visual information in their auditory-visual integration. Although the introduction in our experiment (“speak to a foreigner”) to some extent already pushed the speaker to produce hyperarticulated speech, we realize that there is variation between speakers: some speakers are easier to be understood than others in terms of speech intelligibility (e.g., Cox, Alexander, & Gilmore, 1987; Ferguson, 2004) and the clarity of the visual cues they provide (e.g., Grant & Braida, 1991; Han et al., 2018). For future studies, it would be useful to employ multiple speakers to produce the stimuli, so that more hyperarticulated speaking styles could result in stronger incongruent visual information that could influence the native speakers, which would be favorable to a visual-only condition for native subjects.
In summary, native speakers of Mandarin Chinese who accurately identified the Chinese tones predominantly rely on auditory information of the input, even when incongruent visual information was present. Because of the high accuracy, a ceiling effect might have obscured auditory and visual integration among native Chinese participants, so the existence of a McGurk effect at the tone level cannot be entirely ruled out. Tone-naïve participants, on the other hand, were affected by visual information. However, while visual information is helpful for tone-naïve participants with incongruent stimuli, it only marginally increases the accuracy in the tone identification task compared to auditory information alone, and this increase depends on the tone in question. Relatively speaking, in a communicative context in which one can see the speaker’s face, acoustic information contributed more for tone-naïve listeners in their tone identification as compared to visual information. In addition, identification varies with individual tones, with tone 3 (the low-dipping tone) the easiest one to identify, whereas tone 4 (the high-falling tone) was the most difficult one to perceive and tone 3 and tone 4 are not affected much by incongruency, but the accuracy of tone 1 and 2 judgments increases when the auditory and visual information are consistent.
Footnotes
Appendix 1. List of words used for producing the stimuli
| mā 妈 |
má 麻 |
mă 马 |
mà 骂 |
| yī 医 |
yí 移 |
yǐ 椅 |
yì 意 |
| xiē 些 |
xié 鞋 |
xiě 写 |
xiè 泻 |
| shē 赊 |
shé 蛇 |
shě 舍 |
shè 社 |
| shī 师 |
shí 时 |
shǐ 史 |
shì 市 |
| yōu 优 |
yóu 由 |
yŏu 有 |
yòu 又 |
| fēn 分 |
fén 焚 |
fěn 粉 |
fèn 份 |
| fū 夫 |
fú 浮 |
fŭ 斧 |
fù 妇 |
| pō 泼 |
pó 婆 |
pŏ 叵 |
pò 破 |
| yīng 鹰 |
yíng 赢 |
yǐng 影 |
yìng 硬 |
Appendix 2
Full mixed-effect model outputs for the three models.
All models use treatment coding for the independent variables.
Funding
The authors disclosed receipt of the following financial support for the research, authorship, and/or publication of this article: The first author received financial support from the China Scholarship Council (CSC).