
Abstract
The recent discussion on the reproducibility of scientific results is particularly relevant for preclinical research with animal models. Within certain areas of preclinical research, there exists the tradition of repeating an experiment at least twice to demonstrate replicability. If the results of the first two experiments do not agree, then the experiment might be repeated a third time. Sometimes data of one representative experiment are shown; sometimes data from different experiments are pooled. However, there are hardly any guidelines about how to plan for such an experimental design or how to report the results obtained. This article provides a thorough statistical analysis of pre-planned experimental replications as they are currently often applied in practice and gives some recommendations about how to improve on study design and statistical analysis.
Introduction
The recent discussion about the non-reproducibility of scientific research results 1 brought statistical methods used in laboratory animal studies under closer inspection (see, e.g., the recent book by Lazic 2 for an extensive discussion of the wide range of problems involved). Minimal standards were defined that should be applied in preclinical studies involving animals,3,4 but in practice, these existing guidelines are often not followed. The warnings of statisticians about the consequences of the commonly applied procedures of study design and data analysis have a long history,5,6 but it seems only recently that the research community has become widely aware that there actually is a severe problem and that action has to be taken to improve the quality of preclinical research studies.7,8
Statistical expert reviewers in internal review boards for animal studies usually see a large number of proposals for animal trials and have the chance to develop some insight into the problems in experimental design and statistical analysis that frequently occur. To a certain extent, we see ourselves as consultants and want to give advice to lab researchers in order to improve their study designs. One particular point that we are regularly confronted with is the problem of experimental replication, where researchers claim that they have to replicate each experiment at least twice or else their research would not be accepted for publication. Although scientific journals usually do not have such statements in their guidelines, within certain research communities, peer reviewers request experimental replications on a regular basis. How such replications are summarised to prove reproducibility in practice appears to be quite problematic from a statistical point of view. There is also surprisingly little information about this topic to be found in the literature on study design for animal trials, apart from a very good article by Fitts. 9
The purpose of this article is to fill this gap in the literature and to discuss the statistical consequences when a whole experiment is repeated several times by the same research group under exactly the same conditions. Our intention is to provide a reference for preclinical researchers which allows them to choose a powerful study design that fully adheres to replicability demands. We will start with looking at 46 articles from the latest volume of Immunity, a top journal in the field of immunology, to illustrate the pervasiveness of the problem we address. Often researchers provide only the data from one ‘representative’ experiment, or they pool data from several experiments. We will explain why both strategies are problematic, particularly if the procedure has not been clearly specified a priori.
In the majority of cases, two or three independent experiments are performed. What often happens in practice is that two experiments are made, and if those have differing outcomes, then a third experiment will be performed. We will discuss the statistical properties of such a ‘two-out-of-three’ rule and argue that this design is not optimal in any case but that it only makes sense under the assumption that the effect under question does not vary too much between the separate experimental replications.
However, when asking researchers why they think it is a good idea to replicate the whole experiment, they usually argue that there might be huge differences between the observed effects due to unknown factors influencing the different experimental replicates. If this is actually the case, then three repetitions are not enough to capture this variation of the effect to be studied. Based on a simple simulation study, we will show that the allocation of a given number of animals can be optimised if more than three experimental replications are performed, each then including fewer subjects.
What we definitely do not recommend is to plan a single experiment with the usual settings, say at a significance level of α = 0.05 and with a power of 0.8, and then to repeat this experiment several times. On the one hand, it is unclear which results researchers are then actually going to report. Choosing a ‘representative’ experiment is certainly not a good idea because there will always be the tendency to report the ‘best’ experiment, which will introduce some bias. Pooling data is a better option but will result in much larger power than originally planned for and uses potentially more animals than needed. It is particularly bad practice to pool data only when this leads to significant results and otherwise to show data from a ‘representative’ experiment. A slightly better solution would be to report p-values from all performed experiments and then combine these p-values using, for example, Fisher’s combination test or any other of a wide range of available methods.10–13 However, in that case, again, the whole study based on independent experimental replicates is quite overpowered and uses too many animals. Moreover, as we will show, the approach is not valid in case of substantial between-replication variability.
Our favoured approach is to perform a pooled analysis of all experiments with a mixed model. This allows the – obviously important – between-replicates variability to be estimated explicitly, and one can finally report an estimate of the effect size expected for a typical replication. By means of simulation, we illustrate that this approach is superior to p-value combination if the effect size differs largely between replicates and furthermore allows the variation between replicates to be estimated.
Methods
To quantify the usage of experimental replications in practice, we looked at 46 articles from volume 51 of Immunity, one of the leading journals in immunology research. Figure legends from each article were examined for text passages which point towards replications of animal experiments. Replications of in vitro studies were not considered as relevant. A Microsoft Excel sheet is provided in the Supplemental Material, which contains the details of our findings, in particular how many independent experiments were used for some experiments, whether data were pooled or whether data from a representative experiment were shown.
Type I error and power are computed for different strategies how to report results from several independent experiments. The elementary probability computations involved are given in the Supplemental Material. All other results are based on simulations. The main simulation study involving mixed models was performed in SAS 9.4(TS1M3) vXX (SAS Institute, Cary, NC). Generation of plots and other simulations was performed in R 3.6.0 vXX (R Foundation for Statistical Computing, Vienna, Austria). Commented R code is provided in the form of an R Markdown report using knitr. The SAS code for the main simulation study and the resulting csv files used to generate Figures 2 and 3 are provided in the Supplemental Material, making our findings fully reproducible.
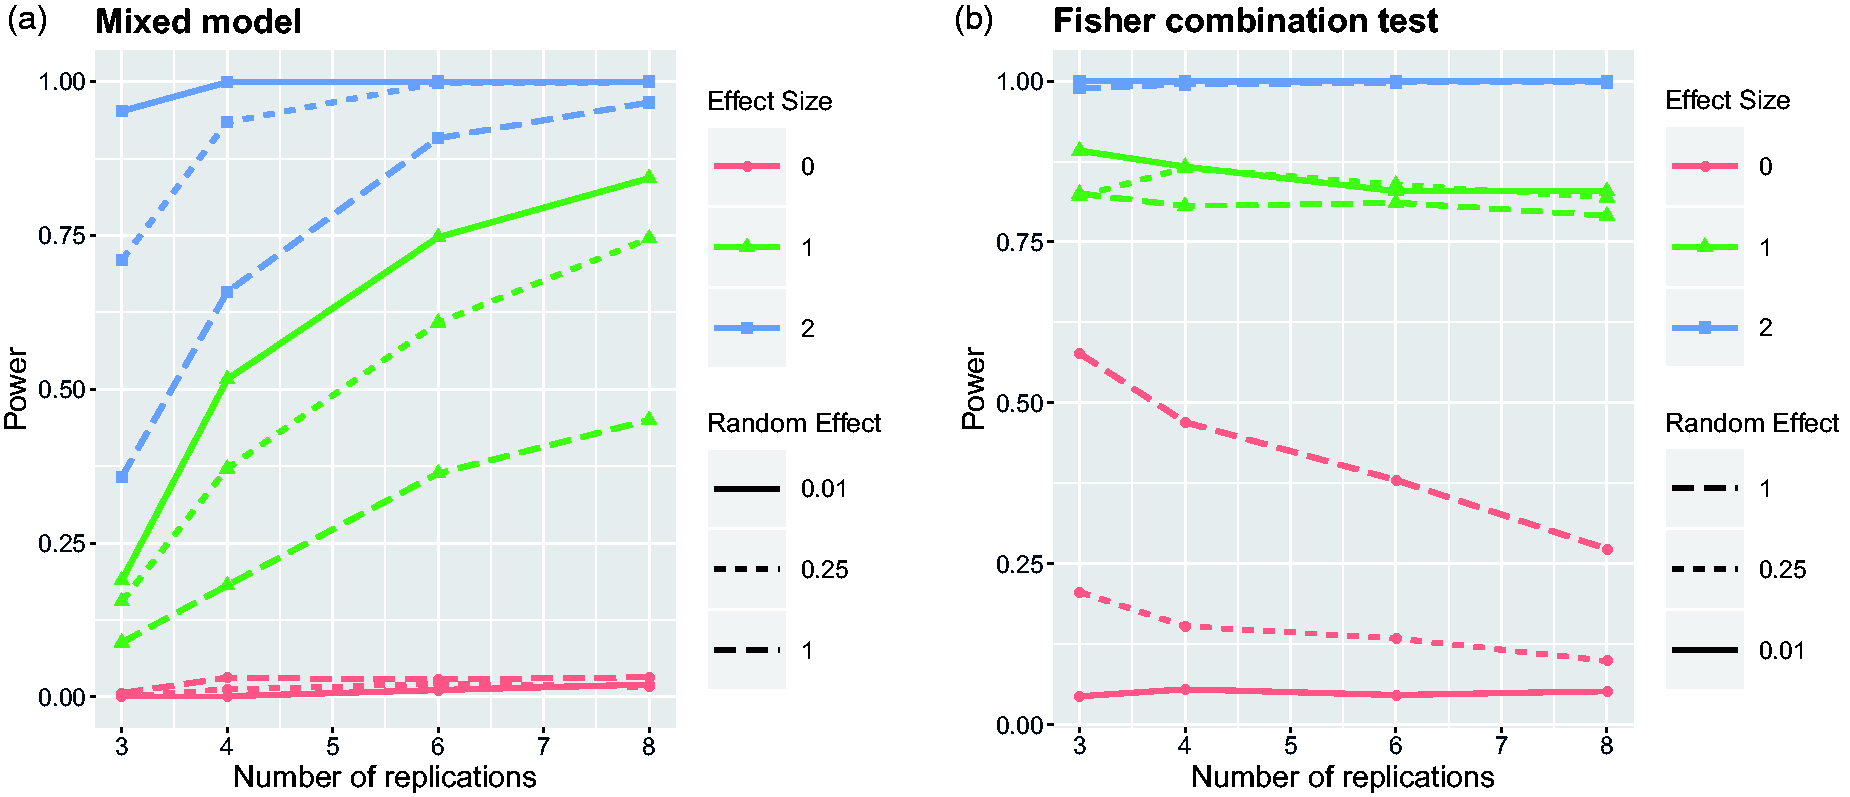
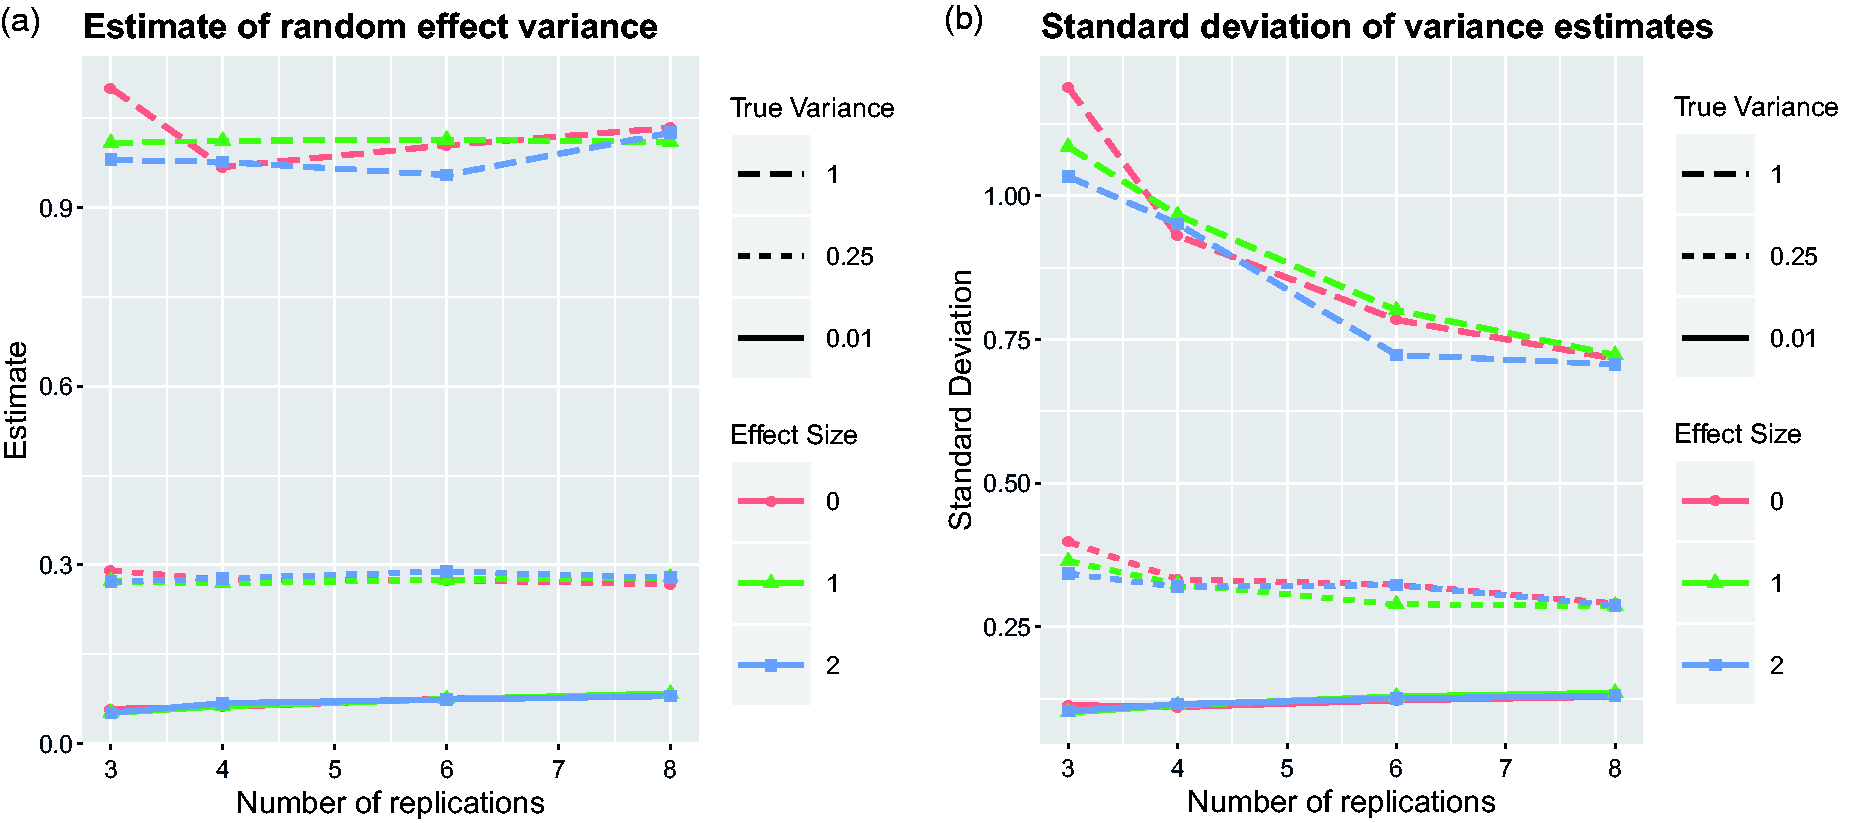
Power of Fisher’s combination test as a function of the sample size n for three independent experiments analysed with two-sample t-tests at a significance level of α = 0.05. Effect sizes are measured in standard deviations. Power of the mixed model and Fisher’s combination test to detect the treatment effect depending on the number of replications. Nine scenarios have been simulated by considering all combinations of three effect sizes Estimates of the variation of treatment effects between replicates from the mixed model. Average over simulation runs and corresponding standard deviation are plotted for the same nine scenarios as in Figure 2.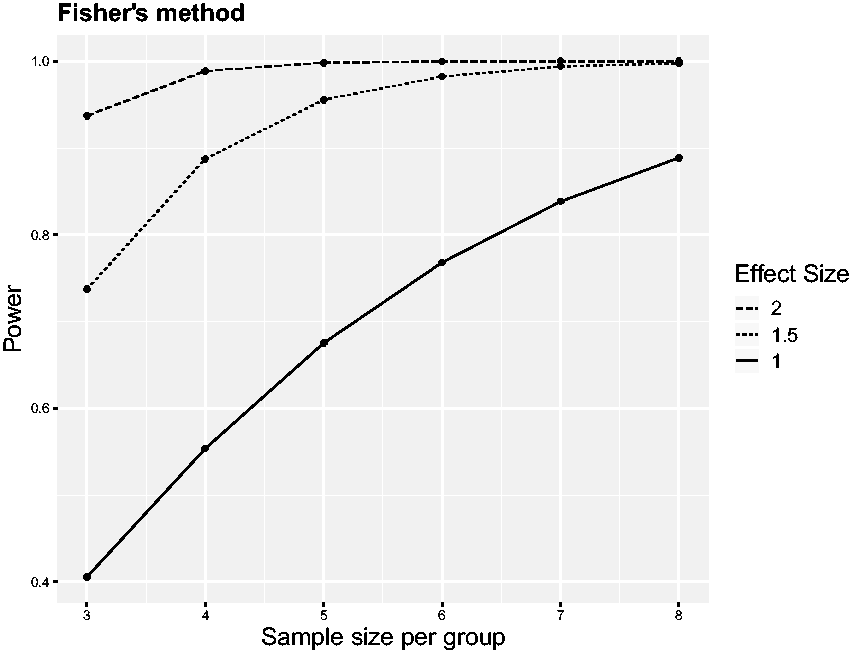
Results
The scope of the problem
The five issues from volume 51 of Immunity include 46 research articles. Six of those did not contain any animal experiments at all, and another three articles used zebrafish, drosophila or rabbits, respectively, as the animal model. In our analysis, we will hence focus on the 37 articles which include animal experiments with mice. Among those are 25 articles having at least one figure with data representative of several independent experiments. If the exact number of independent experiments is given, then most often this is either two or three, quite rarely also four. However, the exact number is frequently not even specified. Instead, the information is given that data are ‘representative of at least two experiments’, ‘of at least three experiments’, ‘of two or three experiments’ and so on.
In 22/37 articles, there is at least one figure legend indicating that data were pooled from several experiments. Again, in the majority of cases, data from two or three experiments were pooled, but sometimes also from four or more. Once again, the exact number is often not clearly specified. In 13 articles, both representation and pooling of independent experiments occurred, sometimes within the same figure legend. A particularly bad example can be found in the legend of figure 1 of Bachem et al., 14 where it is stated that ‘All experiments were performed at least twice, and each experimental group included n ≥ 3 animals. Data are representative or pooled’. Neither the number of experiments nor the number of animals per experiment is specified, and it is not even clear if data are representative or pooled. Another example, where pooling and representation are combined even more creatively is Vacchio et al. 15 where the legend of Figure 1 states: ‘Data are representative of 4 independent experiments, 2 of which (with n = 5 [Zbtb7bAD] and 7 [Ctrl] mice) are summarized in the graphs at the right’.
Only 3/37 articles with mice experiments do not mention any replication of experiments. None of the other 34 articles describes in the statistical methods section how independent experiments were accounted for. All the information that can be found, which is in virtually all cases insufficient, is given in the figure legends. No objective decision criteria are presented which would explain why a representative experiment is shown or why data are pooled. Almost always, the presented graphs are ornamented with different numbers of asterisks which are supposed to indicate certain levels of statistical significance. The corresponding p-values themselves are not provided, although this would be much preferable. 16 There seems to be no awareness at all that after selecting data from different experiments as one pleases, the concept of statistical significance becomes entirely meaningless.
Given the current practice, there are just too many ways that data sets can be tweaked to obtain p-values which are below a desired significance level: choosing the experiment with the most desirable result as representative, continuing to repeat experiments until significance has been achieved through pooling, potentially not including data from experiments which do not fit the hypothesis to be tested and so on. The reporting of the number of animals per experiment is often even worse, and undocumented attrition will further contribute towards biased results.
We want to point out that the problems described here are not unique to the journal Immunity. This serves only as a representative for a wide range of journals, including for example Nature Immunology, Science Immunology, Cancer Immunology Research, Journal of Experimental Medicine and so on. Investigating figure legends in these journals, as we did here, would lead to similar results.
Most common reporting strategies
In this section, we will quantify the statistical problems which arise for the most common reporting strategies we have seen. Although the following results are already alarming enough, our computations assume that researchers stick to some pre-planned strategy of how to analyse repeated experiments. If researchers have the possibility of changing their strategy depending on their experimental results, then the probability of type I errors will further increase. For that reason, we think it is absolutely necessary that the research culture changes and that journals request experimental designs which are less prone to delivering false-positive results and which have been clearly specified in advance.
Our brief survey of articles from Immunity suggests that researchers most often perform two or three replications, which coincides with our experience as board members of the animal ethics committee. Often, they plan one experiment at a significance level of α = 0.05 with a power of 0.8 to detect a specific effect. Then, they request two or three times the number of animals needed for one such experiment but without actually specifying how they want to analyse the resulting data from independent experiments. We will provide here the consequences on type I error and on power when using five different analysis strategies:
Strategy 1: Report the best of two independent experiments. Strategy 2: Two independent experiments must be significant. Strategy 3: Report the best of three independent experiments. Strategy 4: Three independent experiments must be significant. Strategy 5: Two out of three experiments must be significant.
Probability of type I error and power for the different strategies to report the results from three experimental replicates, assuming a nominal type I error probability of 0.05 and a nominal power of 0.8.
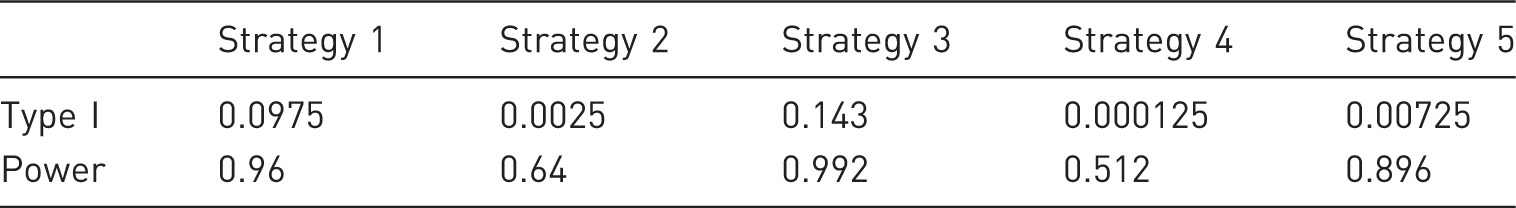
Strategies 1 and 3 assume that two or three independent experiments were performed, and only the results of the ‘best’ experiment are presented, that is, the experiment with the most significant treatment effect. For apparent reasons, and confirmed by our results, this is not a good idea. While the resulting power is close to 1, the probability of a type I error becomes hugely inflated: 0.0975 for two experiments and 0.143 for three experiments. However, given the common practice of reporting a ‘representative’ experiment, we are afraid that the ‘choose-the-best’ approach is applied quite frequently.
With strategies 2 and 4, an effect is only concluded to be significant if all experiments which were performed gave significant results. Such a procedure is extremely conservative, as its overall power to detect significant treatment effects drops to 0.64 in the case of two experiments and to 0.51 in the case of three experiments. It is quite unlikely that any preclinical researcher would actually want to adhere to such an approach.
The final strategy considers an effect to be significant if at least two out of three experiments lead to a p-value below the chosen significance level. With this procedure, one could omit the third experiment if the first two already led to the same result (with both either significant or not significant). According to researchers involved in such studies, this strategy is actually often applied informally, even when in the end only one representative data set is presented in the publication. The two-out-of-three procedure gives an overall power of 0.9 when planning for a nominal power of 0.8 for each individual experiment. At the same time, the overall probability of committing a type I error is < 0.01 for α = 0.05. In view of the ongoing discussion of the problematic nature of taking p-values as the exclusive basis of statistical analysis,6,17 these characteristics are actually not too bad. If preclinical researchers followed such a protocol rigorously, it could help to increase the reproducibility of published research because the probability of reporting false-positive results is substantially reduced. However, the ‘two-out-of-three’ decision procedure does not make optimal use of the data when there is reason to assume that the actual effect size does not differ between replications of the full experiment. Better alternatives include methods for combining p-values or considering a combined analysis of all three experiments, as proposed below.
We have seen that apart from presenting a ‘representative’ data set, researchers also often present results after pooling data from independent experiments. This results in a larger sample size than planned, which will apparently yield an increase in statistical power. If the single experiment was already planned to detect a specific effect size with a certain power, then the pooled data set will be overpowered for the same effect size. In other words, too many animals will have been used. If the decision of pooling is made only after the data have been looked at, then the procedure just turns into some form of p-hacking, specifically if there is no control over the number of experiments which are used for pooling. Furthermore, if the results from the independent experiments are not reported individually, then the question of reproducibility is actually no longer addressed. A first step in the right direction would be to report p-values of each independent experiment and then perform some p-value combination. For the ease of presentation, in our discussion of the combination of p-values, we will focus on Fisher’s method, although there are many other combination procedures available which might perform better in certain situations. 13
Combination of p-values
Fisher’s method for combining k p-values
To illustrate the advantages of Fisher’s method over the ‘two-out-of-three’ rule, consider a situation where the three experiments led to p-values p1 = 0.04, p2 = 0.06 and p3 = 0.06. Only the first experiment was significant at the α = 0.05 level, and a rigorous application of strategy 3 would lead to the conclusion that one cannot reject the null hypothesis. However, Fisher’s method gives a combined p-value of 0.007, resulting in a clear rejection of the null hypothesis. Even in the case that one experiment ‘did not work’ and gives a rather large p-value – say, p3 = 0.07 – the resulting combined p-value of 0.047 is still < 0.05. Finally, consider a situation where p1 = p2 = p3 = 0.1, that is, in all three experiments, the significance criterion was just missed, and thus none of the original three strategies would suggest to reject the null hypothesis. Still, Fisher’s method efficiently combines this information into a combined p-value of 0.032.
These simple examples illustrate that the combination of p-values is more powerful than the strategies presented in Table 1. The power curves in Figure 1 provide a more systematic overview for small sample sizes ranging from n = 3 to n = 8. These were obtained by simulating t-test statistics from three independent experiments and then applying Fisher’s combination procedure. Simulations were repeated 1,000,000 times for each combination of sample size and effect size, and the proportion of runs with a combined p-value of < 0.05 was used to estimate power. The corresponding R code is provided in the Supplemental Material.
Effect sizes are measured in standard deviations, which is often done for convenience in preclinical studies when not much information about the actual variation of the outcome variable is available. Effect sizes of 1.5 (or 2) standard deviations are quite typical for animal experiments, and performing only a single experiment, eight (or five) animals, respectively, would be needed to achieve an approximate power of 0.8 at a significance level of α = 0.05. In comparison, the power of Fisher’s combination test is already very close to 1 both for n = 8 at effect size 1.5 and for n = 5 at effect size 2. In fact, only four animals per group would be needed at effect size 1.5 to achieve a power close to 0.8, which is half the number needed according to the sample-size calculation for a single experiment. Figure 1 also shows that n = 8 would be sufficient to achieve a power of 0.8 for an effect size of one standard deviation, which is often considered a very small effect for preclinical studies.
Simple pooling of data might lead to a similar increase of power, but then one has no information about the outcome of individual experiments. One advantage of the p-value combination approach is that one can report the results of the individual experimental replicates but still has one valid p-value to summarise the conclusion made from the combined evidence of all three experiments. However, one caveat of Fisher’s method is that it works best for one-sided tests. For two-sided hypotheses, one has to split the problem into two one-sided tests and perform the combination test separately at the desired significance level divided by two. It should be noted that Fisher’s method is simple and very efficient if all experimental replicates have the same sample size. If the sample size varies between experimental replicates – which might occur for example in case of drop-outs – then an alternative method based on weighted Z-scores might be preferable. 18
In the next section, we will illustrate the problems that can arise with p-value combination tests when there is a lot of variation in estimated effect sizes between experiments. Furthermore, p-value combination does not address the question of replicability of an experiment. To answer this question, we have to use a different statistical approach.
Mixed-model analysis
The method of combining p-values is particularly suitable under the assumption that the effect of interest does not vary between experimental replicates. However, researchers and reviewers often argue that they need to replicate whole experiments because the measured effect may vary a lot between replicates. Often, the cause of such variation is beyond the control of the researcher. Hence, it is desirable to account for that variation explicitly by a joint analysis of the data from all three experiments. In such an approach, the experimental replication is used as an additional factor – a so-called blocking variable. 19 Furthermore, it would be desirable to estimate the amount of variation of the treatment effect between replications.
This brings up a few questions which we are going to illustrate using the following particularly simple setting. Assume that in an experiment, the effect of some active treatment is compared to a sham treatment or placebo where the outcome Y is some metric variable. A suitable model to use in this situation is the two-factorial analysis of variance:

One could now proceed and use the methodology of general linear models to estimate the unknown parameters of that model, that is, μ, αi, βj, γij. However, compared to the analysis of a single replicate, there are more parameters to be estimated. In case of two treatments and three replicates, taking into account the identifiability constrictions, the model would require two further β parameters and even four γ parameters to be estimated. The number of degrees of freedom spent to estimate these parameters becomes very large relative to the sample size, and this hampers precise estimation. Therefore, so-called random effects models were proposed, which do not require explicitly estimating some parameters of the model, but rather assume that those parameters follow a pre-specified distribution, for example a normal distribution with a mean equal to 0. With this assumption, all that is required now is the estimation of a single parameter: the standard deviation of the random effect.
Mixed models which include a random effect for the blocking variable were often shown to be more powerful than the so-called fixed-effects models, even if the implicit distributional assumption is only a rough approximation. In our case, it is reasonable to assume that βj and γij follow a bivariate normal, which extends the univariate normal distribution by also assuming some correlation between β and γ. Still, only three parameters (standard deviations of β and γ, and their correlation) would have to be estimated instead of six. Moreover, the standard deviation of γ is a relevant quantity, as it allows the variability of the treatment effect to be quantified. One can easily compare this number to the estimated treatment effect to obtain some impression of how much the latter varies across replications.
Simulation study
To highlight the key principles involved, we simplify the setting of the simulation study even further and assume in the model above that
We consider three different effect sizes,
In the previous section, we focused on the consequence of repeating an experiment three times, where n = 8 per group is a commonly chosen sample size. Here, we want to compare experimental designs to different numbers of replication. Keeping the total number of animals constant, we let the number of replications vary between
For each of the different simulation settings, identified by the values of
The first thing to observe is that in case of
The power curves of Fisher’s combination test tell a completely different story. For both small and large treatment effects, it seems that Fisher’s method provides larger power than the linear mixed model, specifically in cases when there are only few replicates. However, one can see that the combination test controls the type I error for the hypothesis
Figure 3 provides some information about the possibility of estimating the variation of treatment effects between replications of experiments. The estimates do not seem to depend too much on the overall treatment effect, and the number of replicates also has a rather negligible influence on the average of the variance estimate. However, the second plot of Figure 3 clearly shows that the standard deviation of the estimated variance
Estimated probability of type I error
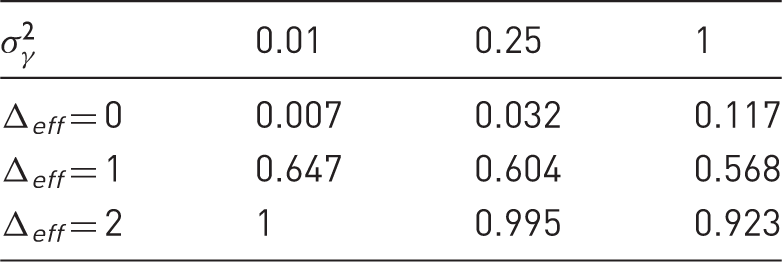
The first observation is that with increasing
Discussion
A primary goal of study design in animal trials is to ensure that the sample size is not too large and not too small. If the sample size is too small, then no scientifically meaningful conclusions can be drawn. However, if the sample size is too large, then more animals have to suffer than is strictly necessary, which is against the ethical requirements summarised in the 3Rs (Replacement, Reduction and Refinement). Clearly, our discussion above shows that performing sample-size calculations for a single experiment and then repeating that experiment two or three times violates these principles because the resulting total number of animals used in the overall experiment is too large. Performing sample size calculations for p-value combination tests based on simulations can substantially reduce the required number of animals, but this approach only works when the effect size is fairly stable between different replicates. If there is variation between replicates, then the linear mixed model is definitely the best option to analyse the data, in terms of both controlling the type I error and enabling quantification of the variation between replicates.
The estimates for the variance of effect sizes between replications shown in the first plot of Figure 3 are slightly larger than the nominal values for small values of
The problem of experimental replication and establishing whether there is a treatment effect and if it varies between replicates is somehow similar to statistical questions occurring in meta-analysis, where the variation of effect sizes between studies is also typically modelled by a random effect.23,24 However, there are a few particularities which make the situation of experimental replications in animal trials different. First of all, the researcher has the luxury of completely planning the experimental setting, including the number of replications and sample size per replicate. This allows the statistical properties of different designs to be studied in advance and then the best one to be chosen, whereas in meta-analysis, one typically has to work with the number of published articles which are available for one’s research question. On the other hand, the sample sizes of articles included in a meta-analysis are typically much larger than those considered in animal trials, which makes distributional assumptions for the mixed model more likely to hold.
Our simulation study suggests that given a fixed total number of animals, that is, under economic constraints, it is better to perform many smaller experiments than only a few replications of larger experiments, particularly if one expects the observed effect sizes to change between replications. This finding seems to be quite intuitive because with more replicates, it becomes easier to estimate the variation between individual experiments. Having only three experiments, it is almost impossible to obtain a reliable estimate of the variance if there is actually variation between replications. This speaks against the ‘two-out-of-three’ rule if it is enacted with the intention of showing replicability of results and might actually be an important consideration to increase reproducibility of preclinical results.
We are aware that in terms of logistics and time constraints, it might not always be possible to repeat experiments too often in the same lab and that having many small experiments might be more expensive than having fewer larger experiments. However, our recommendation goes well with recent discussions that increasing variation in animal trials might be important in obtaining more reproducible results.25,26 One could imagine, for example, that several small replications are conducted in multiple labs which would naturally provide heterogeneity. Effects observed under such a design are certainly more likely to be reproducible than studies performed only by one lab.
Our discussion focused on pre-planned experimental replications, how these are applied in certain fields of preclinical research and the statistical consequences of this practice. We want to point out that replication studies are usually performed quite differently where, based on the results of one study, a replication study is specifically planned to confirm the original results (see Piper et al. 27 for an in-depth discussion about such replication studies). A different alternative to design replication studies in animal trials could be adaptive designs.28–31 The idea has been suggested already recently 32 but has not really been explored in practice. Adaptive designs might help to derive suitable sample sizes in experimental replicates, depending on the outcome of the first experiment, or discard replicates if appropriate. We believe that adaptive designs might have quite some potential in the context of preclinical research, but a more thorough discussion is beyond the scope of this article.
Finally, in our opinion, it is really important that journals publishing the results from animal studies become stricter in terms or statistical methodology. Shortcomings of experimental design and statistical analysis of animal studies were already being discussed extensively10 years ago,33,34 but changes in scientific culture are rather slow. 35 Recent efforts to establish preregistration of animal trials are laudable, but there is still much to be done. In particular, the practical application of experimental replication we have described here is extremely problematic. The reporting on the number of experiments and the number of animals used per experiment is extremely poor, which is bound to result in biased results. Researchers will tend to present those results which fit and to conceal results which contradict their hypotheses. Given the current practice, there is often no way of knowing how many experiments have actually been performed from which the ‘representative’ experiment was chosen. It would be a big improvement if journals requested study protocols which were approved by animal ethics committees. If not published, these could be given as a supplement. In general, such a policy would increase the transparency of preclinical research. In view of our particular discussion on replications of experiments, the relevant strategies should be outlined already in advance in the study protocol.
Footnotes
Acknowledgements
We want to thank Riem Gawish for helpful discussions which allowed us to understand better how experimental replications are performed in practice, for pointing out journals where pre-planned experimental replications are the rule rather than an exception, and for giving valuable feedback after reading the manuscript.
Declaration of Conflicting Interests
The author(s) declared no potential conflicts of interest with respect to the research, authorship and/or publication of this article.
Funding
The author(s) received no financial support for the research, authorship and/or publication of this article.
Supplemental material
Supplemental material for this article is available online.