
Abstract
Plasma lipid and glucose levels are important parameters for evaluating the onset and development of metabolic and cardiovascular diseases. In clinical and experimental studies of humans or mice, fasting is often required before testing plasma lipid and glucose levels. The rabbit is a valuable animal model for cardiovascular disease research. However, whether fasting is necessary for measuring plasma lipid and glucose levels in rabbits remains unclear. In the current study, 12 healthy Japanese white rabbits (males weighing 2.5–3.0 kg) were randomly divided into a chow diet group (n = 6) and a high cholesterol diet group (n = 6). They were fed either a standard chow diet or a chow diet supplemented with 0.5% cholesterol and 3% corn oil for 12 weeks. After 12 weeks, the plasma levels of total cholesterol, triglycerides, high-density lipoprotein cholesterol, low-density lipoprotein cholesterol and glucose were measured before and after various fasting durations (8, 12, 16, 20 and 24 h). The results showed that there were no significant differences in lipid levels between the fasting and non-fasting samples, whereas glucose levels were lower after 8 h of fasting than in the absence of fasting. Moreover, the glucose levels were restored to normal after 8 h of refeeding. These results indicate that fasting does not affect plasma lipid values in rabbits but that fasting is important for determining the glucose level in rabbits. These findings may be helpful for future rabbit experiments and beneficial for animal welfare.
Keywords
Introduction
Plasma lipid and glucose levels are extremely important parameters to measure during a health examination. Abnormal plasma lipid and/or glucose levels reflect the onset or aggravation of health problems associated with metabolic diseases such as obesity, fatty liver disease, diabetes and atherosclerosis.1,2 A typical lipid profile includes total cholesterol (TC), triglycerides (TG), high-density lipoprotein cholesterol (HDL-C), low-density lipoprotein cholesterol (LDL-C) and very low-density lipoprotein cholesterol (VLDL-C).2,3 Metabolic syndrome is usually diagnosed by measuring the plasma levels of TC, TG, HDL-C and LDL-C along with glucose level.4–6 High levels of plasma TC, TG and LDL-C are closely associated with atherosclerosis in both humans and laboratory animals. 7
In the clinical setting, blood samples are often collected from subjects after they have fasted for at least 8 h, and the ‘fasting’ plasma is traditionally used to measure lipid and glucose levels. 8 In laboratory animal studies, fasting is performed before blood acquisition, but the fasting time varies among studies. For example, for a typical metabolic study, mice are fasted 14–18 h (overnight) to study glucose utilization or 5–6 h (starting in the morning) to evaluate insulin action and plasma lipid levels. 9
The lipoprotein profile of rabbits is similar to that of humans; moreover, rabbits can rapidly develop hyperlipidaemia and atherosclerosis when fed a cholesterol-rich diet.10,11 Additionally, being a moderate-size animal model comparable to monkeys and pigs, rabbits are easy to handle and can provide sufficient tissue samples. Therefore, rabbits are widely used for studying the pathogenesis of cardiovascular disease.12,13 However, whether fasting is necessary to determine rabbit plasma lipid and glucose levels remains unclear. Also unknown is whether plasma lipid and glucose levels are affected by fasting duration. In this study, we fed rabbits a chow diet or a high cholesterol diet for 12 weeks and then examined the effects of fasting duration on plasma lipid and glucose levels and the recovery glucose level after refeeding.
Animals
Twelve healthy Japanese white rabbits (males weighing 2.5–3.0 kg) were provided by the Laboratory Animal Centre of Xi’an Jiaotong University. To avoid the interference of oestrogens, only male rabbits were used in this study. Per previous studies on the pathogenesis of lipid metabolism and cardiovascular diseases,14–17 the sample size was set at six for our study. Therefore, the rabbits were randomly divided into a chow diet group (n = 6) and a high cholesterol diet group (n = 6). All of the rabbits were housed in a clean, air-conditioned room under a 12 h light and 12 h dark cycle. The rabbits in the chow diet group were fed a standard chow diet of corn, soybean, lucerne powder, salt, dicalcium phosphate, a variety of vitamins and microelements and other ingredients (details provided in Supplementary Table 1). The rabbits in the high cholesterol diet group were fed the same chow diet supplemented with 0.5% cholesterol and 3% corn oil. Both of the diets were supplied by Beijing Ke Ao Xie Li Feed Co., Ltd. (Beijing, China). All of the rabbits were individually housed and given a restricted diet (100 g/day/rabbit) and free access to water for 12 consecutive weeks. To comply with the 3Rs principle, all of the rabbits used in this study were then designated to study atherosclerosis. Thus, at the end of our investigation, the rabbits were continuously maintained on a high cholesterol diet for the following arteriosclerosis study. The Laboratory Animal Administration Committee of Xi’an Jiaotong University approved this animal study according to the Guidelines for Animal Experimentation of Xi’an Jiaotong University and the Guide for the Care and Use of Laboratory Animals published by the US National Institutes of Health. The approval number is No. XJTULAC2014-005.
Materials and methods
Sample preparation
After 12 weeks of feeding the chow diet or high cholesterol diet, blood from each rabbit was collected from the ear artery at 8, 12, 16, 20 and 24 h after fasting. Blood samples were also collected after refeeding for 8, 12, 16, 20 and 24 h. The samples at the beginning of fasting (0 h of fasting) were identified as the control baseline samples. Briefly, the rabbits were restrained in a restrainer, and the ear was sterilized with 75% alcohol. An intravenous cannula was inserted into the ear artery and fixed tightly. Blood was drawn repeatedly with a syringe at various time points. After each sampling, saline was injected into the cannula to rinse the intravenous cannula and avoid needle blockage. All of the samples were collected in centrifuge tubes containing EDTA as an anticoagulant and were centrifuged at 3000 g for 15 min at 4℃ to collect plasma.
Measurement of plasma lipid and glucose levels
Plasma levels of TC, TG, HDL-C, LDL-C and glucose were determined by colorimetric assay kits (Biosino Bio-technology and Science, Beijing, China) according to the manufacturer’s instructions. All of the assays were based on enzyme-driven reactions. The TC Assay Kit can quantify both cholesterol esters and free cholesterol. The principle underlying the assay is that cholesterol esters are hydrolysed via cholesterol esterase into cholesterol, which is then oxidized by cholesterol oxidase into the ketone cholest-4-en-3-one plus hydrogen peroxide. Hydrogen peroxide with 4-chlorophenol and 4-aminophenazone (4-AA) in the presence of peroxidase (POD) produces a red-coloured quinonimine dye that absorbs at or near 500 nm. The intensity of the coloured complex formed is directly proportional to the TC concentration of the sample. The principle underlying the TG Assay Kit is that the lipase hydrolyses the triglyceride ester bond, yielding glycerol. In the presence of ATP and glycerol kinase, glycerol is converted to glycerol-3-phosphate, which is then oxidized by glycerol phosphate oxidase to yield hydrogen peroxide. Hydrogen peroxide reacts with 4-AA and POD, producing quinonimine dye. The principle underlying the HDL-C Assay Kit is that in the presence of magnesium chloride, LDL-C, VLDL-C and chylomicrons in the plasma can be precipitated by phosphotungstic acid, with only HDL-C remaining in the supernatant after centrifugation. Next, the HDL-C level is determined using the TC assay reagent, which functions similarly to the TC assay. The principle underlying the LDL-C Assay Kit is that LDL-C can be precipitated by polyvinyl sulfonic acid. After centrifugation, LDL-C is inaccessible in the supernatant, which is then measured with the TC assay reagent. The LDL-C concentration can be determined from the difference between the total cholesterol and the supernatant cholesterol. The principle underlying the Glucose Assay Kit is that glucose oxidase oxidizes glucose into gluconic acid and yields hydrogen peroxide. Hydrogen peroxide reacts with 4-AA and POD, producing quinonimine dye. For all of the assay kits, the accuracy is >90%. In this study, each sample was tested in duplicate.
Statistical analysis
The data are expressed as the mean ± standard error (SE). Student’s t-tests (for comparisons between two groups) or repeated measures analysis of variance (ANOVA, for comparisons of ≥3 groups) followed by Dunnett’s test (to compare the values of each treatment with the control values) were used for the statistical analyses via SPSS software version 17.0 (SPSS, Chicago, IL, USA). A p value less than 0.05 was considered statistically significant. Additionally, for the t-tests, the t value and degrees of freedom (df) are reported. For each ANOVA, the F value, df for the treatments (dfB) and the df for the error (dfW) are shown.
Results
The effect of fasting on rabbit plasma lipid levels
Before fasting, we measured the basal plasma TC, TG, HDL-C and LDL-C levels in non-fasted rabbits fed the chow diet or high cholesterol diet. The mean plasma levels of TC, TG, HDL-C and LDL-C in the chow diet group were 42.05 ± 4.79, 42.27 ± 3.29, 22.92 ± 1.17 and 31.72 ± 1.28 mg/dL, respectively. In contrast, in the high cholesterol diet group, the TC, TG, HDL-C and LDL-C levels were 736.59 ± 30.21, 67.86 ± 7.44, 30.43 ± 2.43 and 425.83 ± 16.46 mg/dL, respectively (Figure 1). In the high cholesterol diet group, the TC and LDL-C levels were 17.5- and 13.4-fold higher, respectively, than those of the chow diet group, whereas the TG and HDL-C levels of the high cholesterol group were 1.60- and 1.32-fold higher, respectively, than those of the chow diet group. All of the levels of the high cholesterol group were significantly greater than those of the chow diet group. The results of the Student’s t-tests were as follows: p < 0.0001, t = 22.71, df = 10 (TC); p = 0.0104, t = 3.15, df = 10 (TG); p = 0.0193, t = 2.78, df = 10 (HDL-C); p < 0.0001, t = 23.87, df = 10 (LDL-C).
The plasma lipid levels of non-fasted rabbits. The plasma levels of total cholesterol (TC), triglycerides (TG), high-density lipoprotein cholesterol (HDL-C) and low-density lipoprotein cholesterol (LDL-C) in rabbits fed a chow diet or a high cholesterol diet are shown. The data are expressed as the mean ± standard error. Student’s t-tests were used for statistical analysis. Significant differences between the diet groups are indicated by * for p < 0.05 and *** for p < 0.001.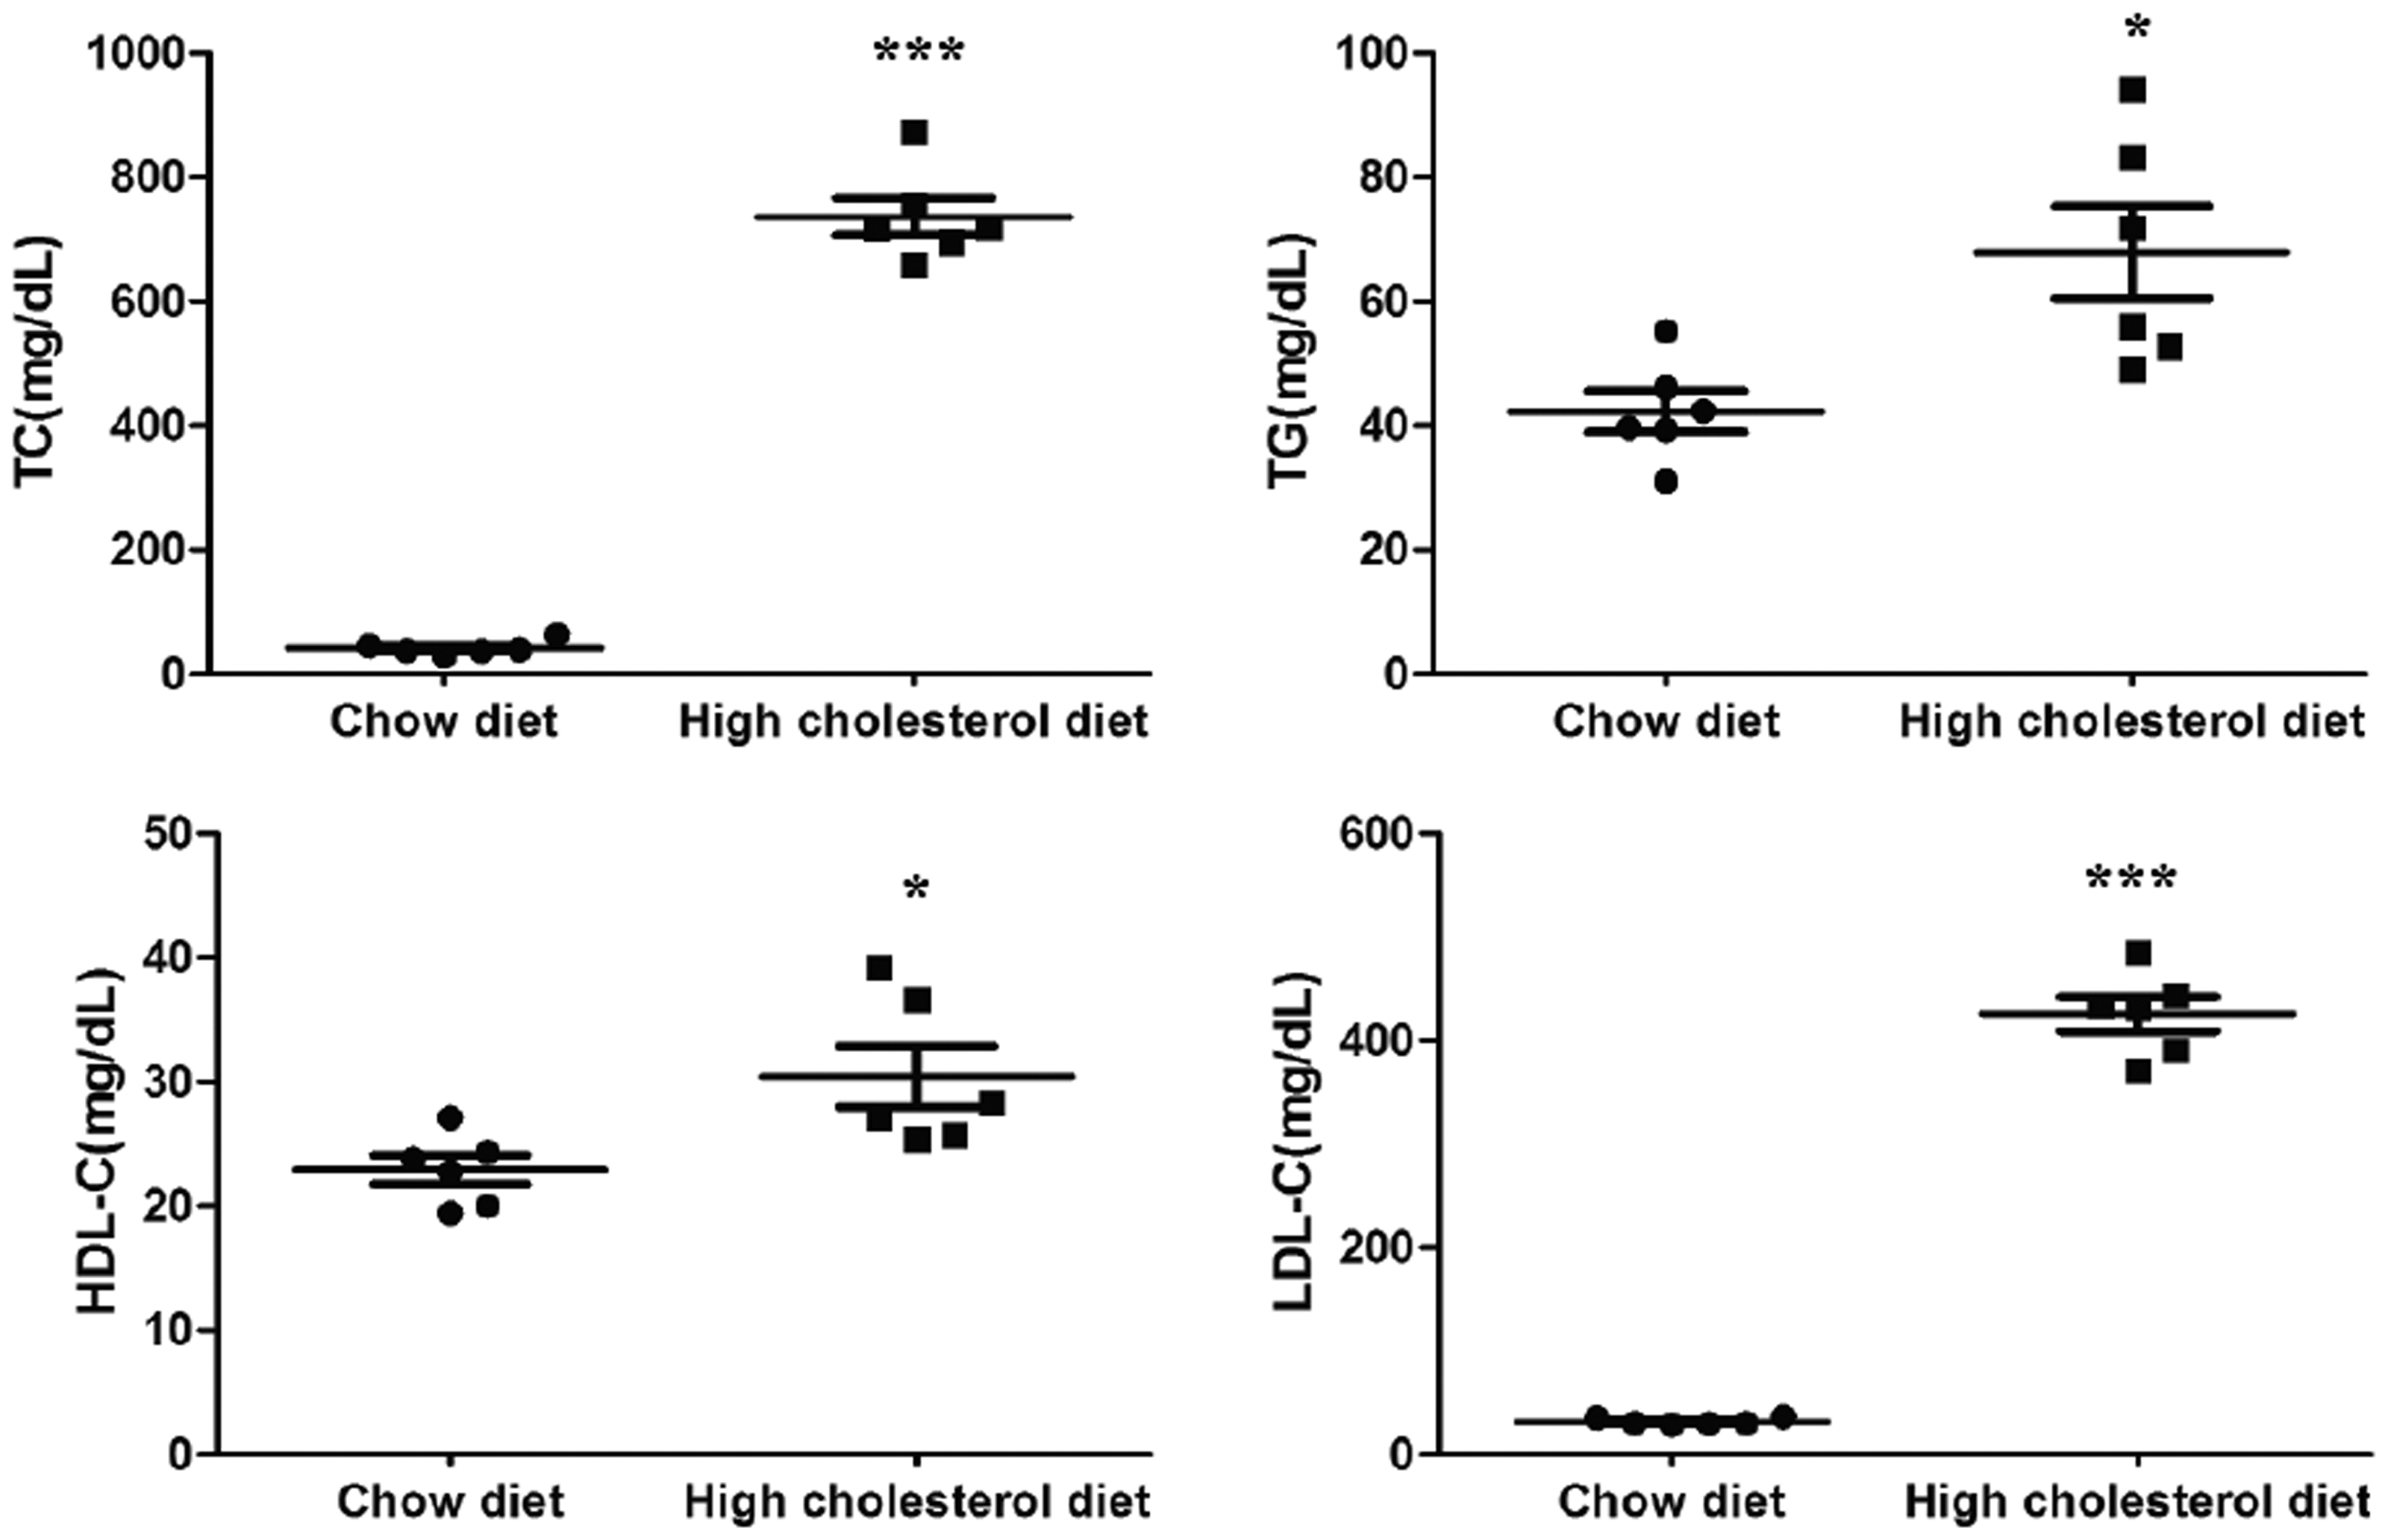
Next, we removed the food and measured the plasma lipid values at 8, 12, 16, 20 and 24 h after fasting. The results showed minimal changes in the plasma TC, TG, HDL-C and LDL-C levels in either group across the various time points of fasting, and there were no significant differences between the fasting and baseline lipid levels in either group (Figure 2). The repeated measures ANOVA yielded F values and p values of 2.568 and 0.0524, respectively (TC), 0.9426 and 0.4709, respectively (TG), 0.1391 and 0.9815, respectively (HDL-C) and 0.2873 and 0.9156, respectively (LDL-C), in the chow diet group; the F values and p values were 1.154 and 0.3591, respectively (TC), 0.9157 and 0.4869, respectively (TG), 0.8169 and 0.5491, respectively (HDL-C) and 2.423 and 0.0637, respectively (LDL-C), in the high cholesterol diet group. For all of the statistical analyses, dfB = 5, and dfW = 25. These data indicate that fasting does not affect rabbit plasma lipid levels and suggest that fasting is not necessary for plasma lipid level measurements in rabbits.
Fasting does not affect plasma lipid levels in rabbits fed a chow diet or a high cholesterol diet. The plasma levels of TC, TG, HDL-C and LDL-C after fasting for 8, 12, 16, 20 and 24 h are shown. The levels before fasting were used as the control values. The data are expressed as the mean ± standard error. Repeated measures ANOVA followed by Dunnett’s test (for comparisons between treatment and control values) was used for statistical analysis.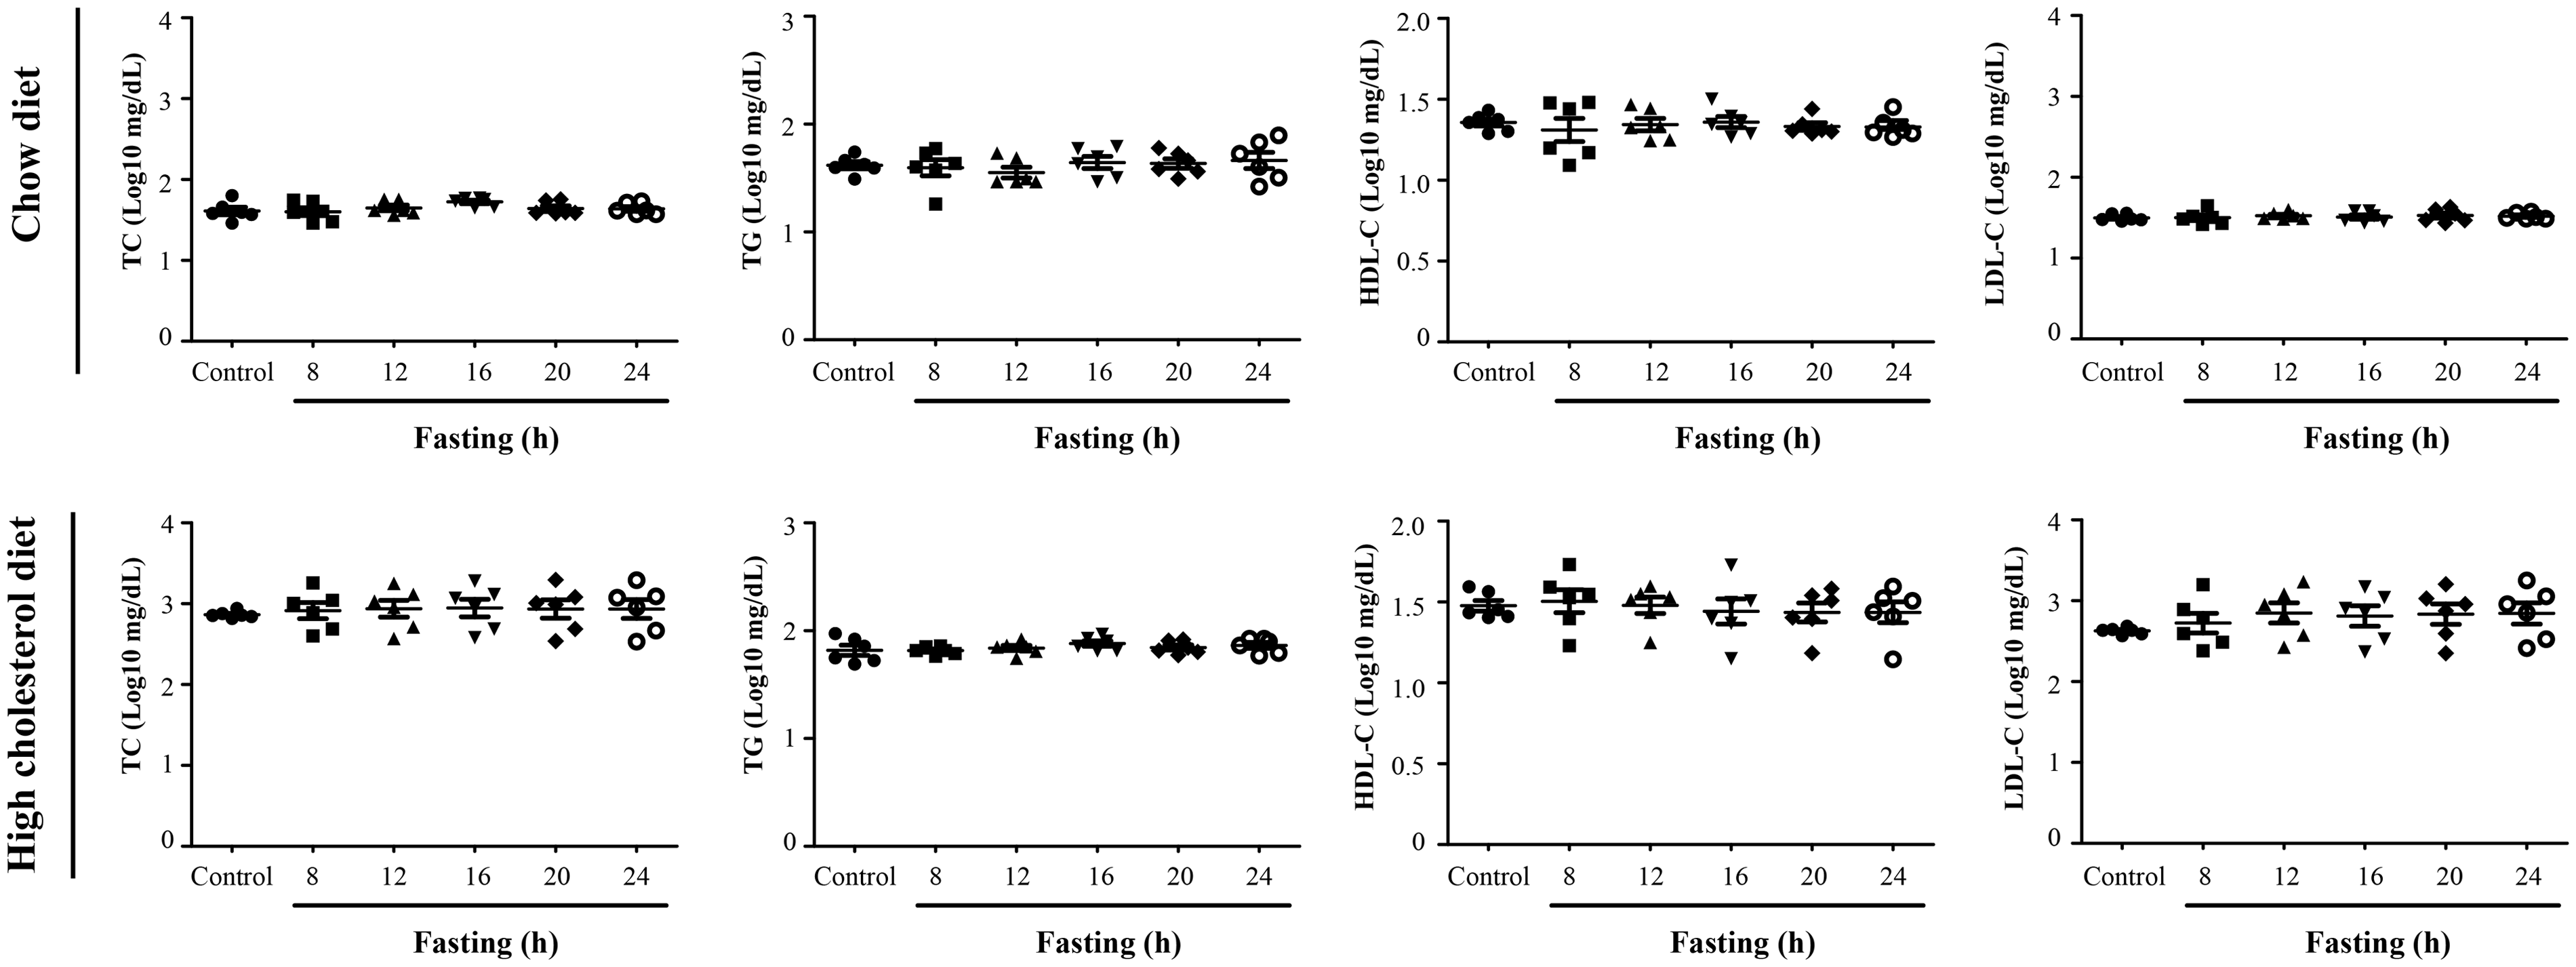
The effect of fasting on rabbit glucose levels
The glucose level of the rabbits without fasting was 149.56 ± 1.55 mg/dL in the chow diet group and 146.33 ± 244 mg/dL in the high cholesterol diet group. There was no significant difference between the two groups (p = 0.2901, t = 1.117, df = 10, Student’s t-test) (Figure 3(a)), suggesting that a high cholesterol diet does not affect glucose levels.
Fasting decreases plasma glucose levels in rabbits fed a chow diet or a high cholesterol diet. (a) There was no difference between the chow diet group and the high cholesterol diet group in glucose level. Student’s t-tests were used for statistical analysis. (b) The plasma glucose levels after fasting for 8, 12, 16, 20 and 24 h are shown. The levels before fasting were used as the control values. The data are expressed as the mean ± standard error. Repeated measures ANOVA followed by Dunnett’s test (for comparisons between treatment and control values) was used for statistical analysis. Significant differences between fasted and non-fasted (control) values are indicated by *** for p < 0.001.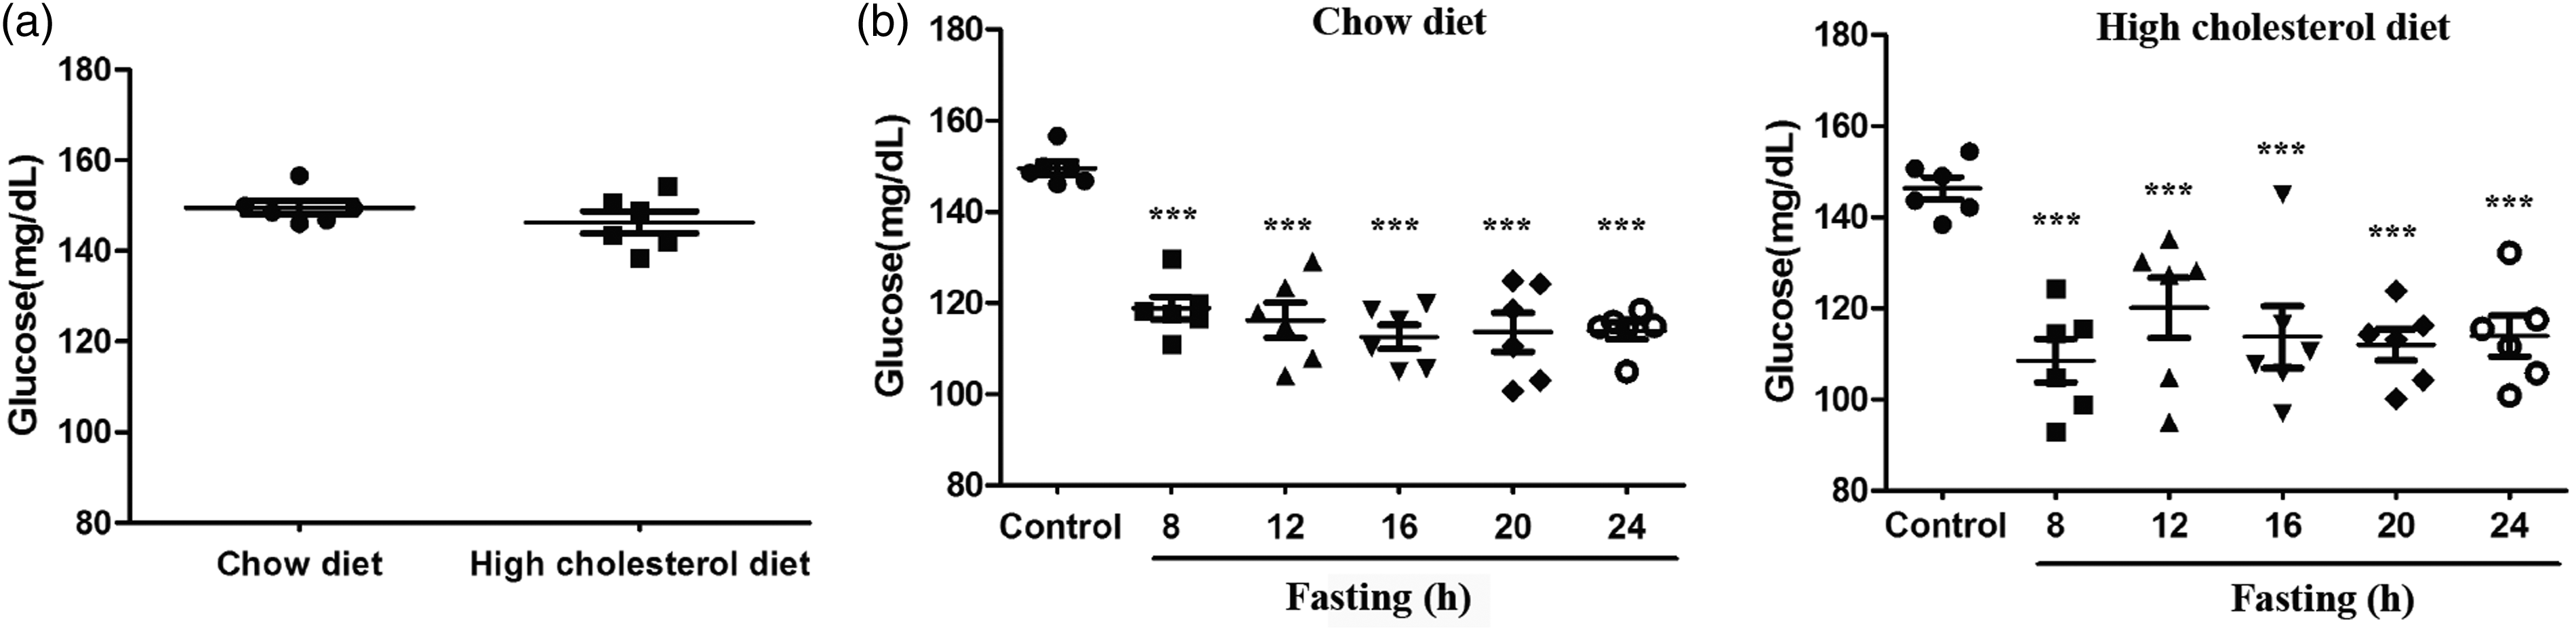
In the chow diet group, an 8 h fast decreased the glucose level from baseline to 118.84 ± 2.49 mg/dL, and the level stabilized at ∼115 mg/dL over the subsequent fasting time points. In the high cholesterol diet group, the glucose level decreased to 108.54 ± 4.77 mg/dL after 8 h of fasting and stabilized at ∼113 mg/dL throughout the following fasting time points (Figure 3(b)). In both groups, compared with the corresponding control (baseline) levels, the glucose levels significantly decreased after fasting. The repeated measures ANOVA results were as follows: p < 0.0001, F = 22.07, dfB = 5 and dfW = 25 in the chow diet group and p < 0.0001, F = 13.15, dfB = 5 and dfW = 25 in the high cholesterol diet group. These data demonstrated that fasting led to significant decreases in glucose level in both diet groups.
Glucose recovery after refeeding
We resumed the feeding of the corresponding diets to the two groups after 24 h of fasting and then measured the glucose levels after 8, 12, 16, 20 and 24 h of refeeding. After 8 h of refeeding, the glucose level was restored to ∼140 mg/dL in both the chow and high cholesterol diet groups; the levels were not significantly different from the glucose levels without fasting. The repeated measures ANOVA followed by Dunnett’s multiple comparison test (control vs. 8 h refeeding) showed no significant difference (p > 0.05) in glucose levels in either the chow diet group or the high cholesterol diet group (Figure 4). Throughout the subsequent refeeding time points (12, 16, 20 and 24 h), the glucose levels showed minimal changes.
Glucose levels are restored after the diet is resumed. The plasma glucose levels after refeeding for 8, 12, 16, 20 and 24 h are shown. The levels before fasting were used as the control values. The data are expressed as the mean ± standard error. Repeated measures ANOVA followed by Dunnett’s test (for comparisons between treatment and control values) was used for statistical analysis. Significant differences between the 24 h fasting and control values are indicated by *** for p < 0.001.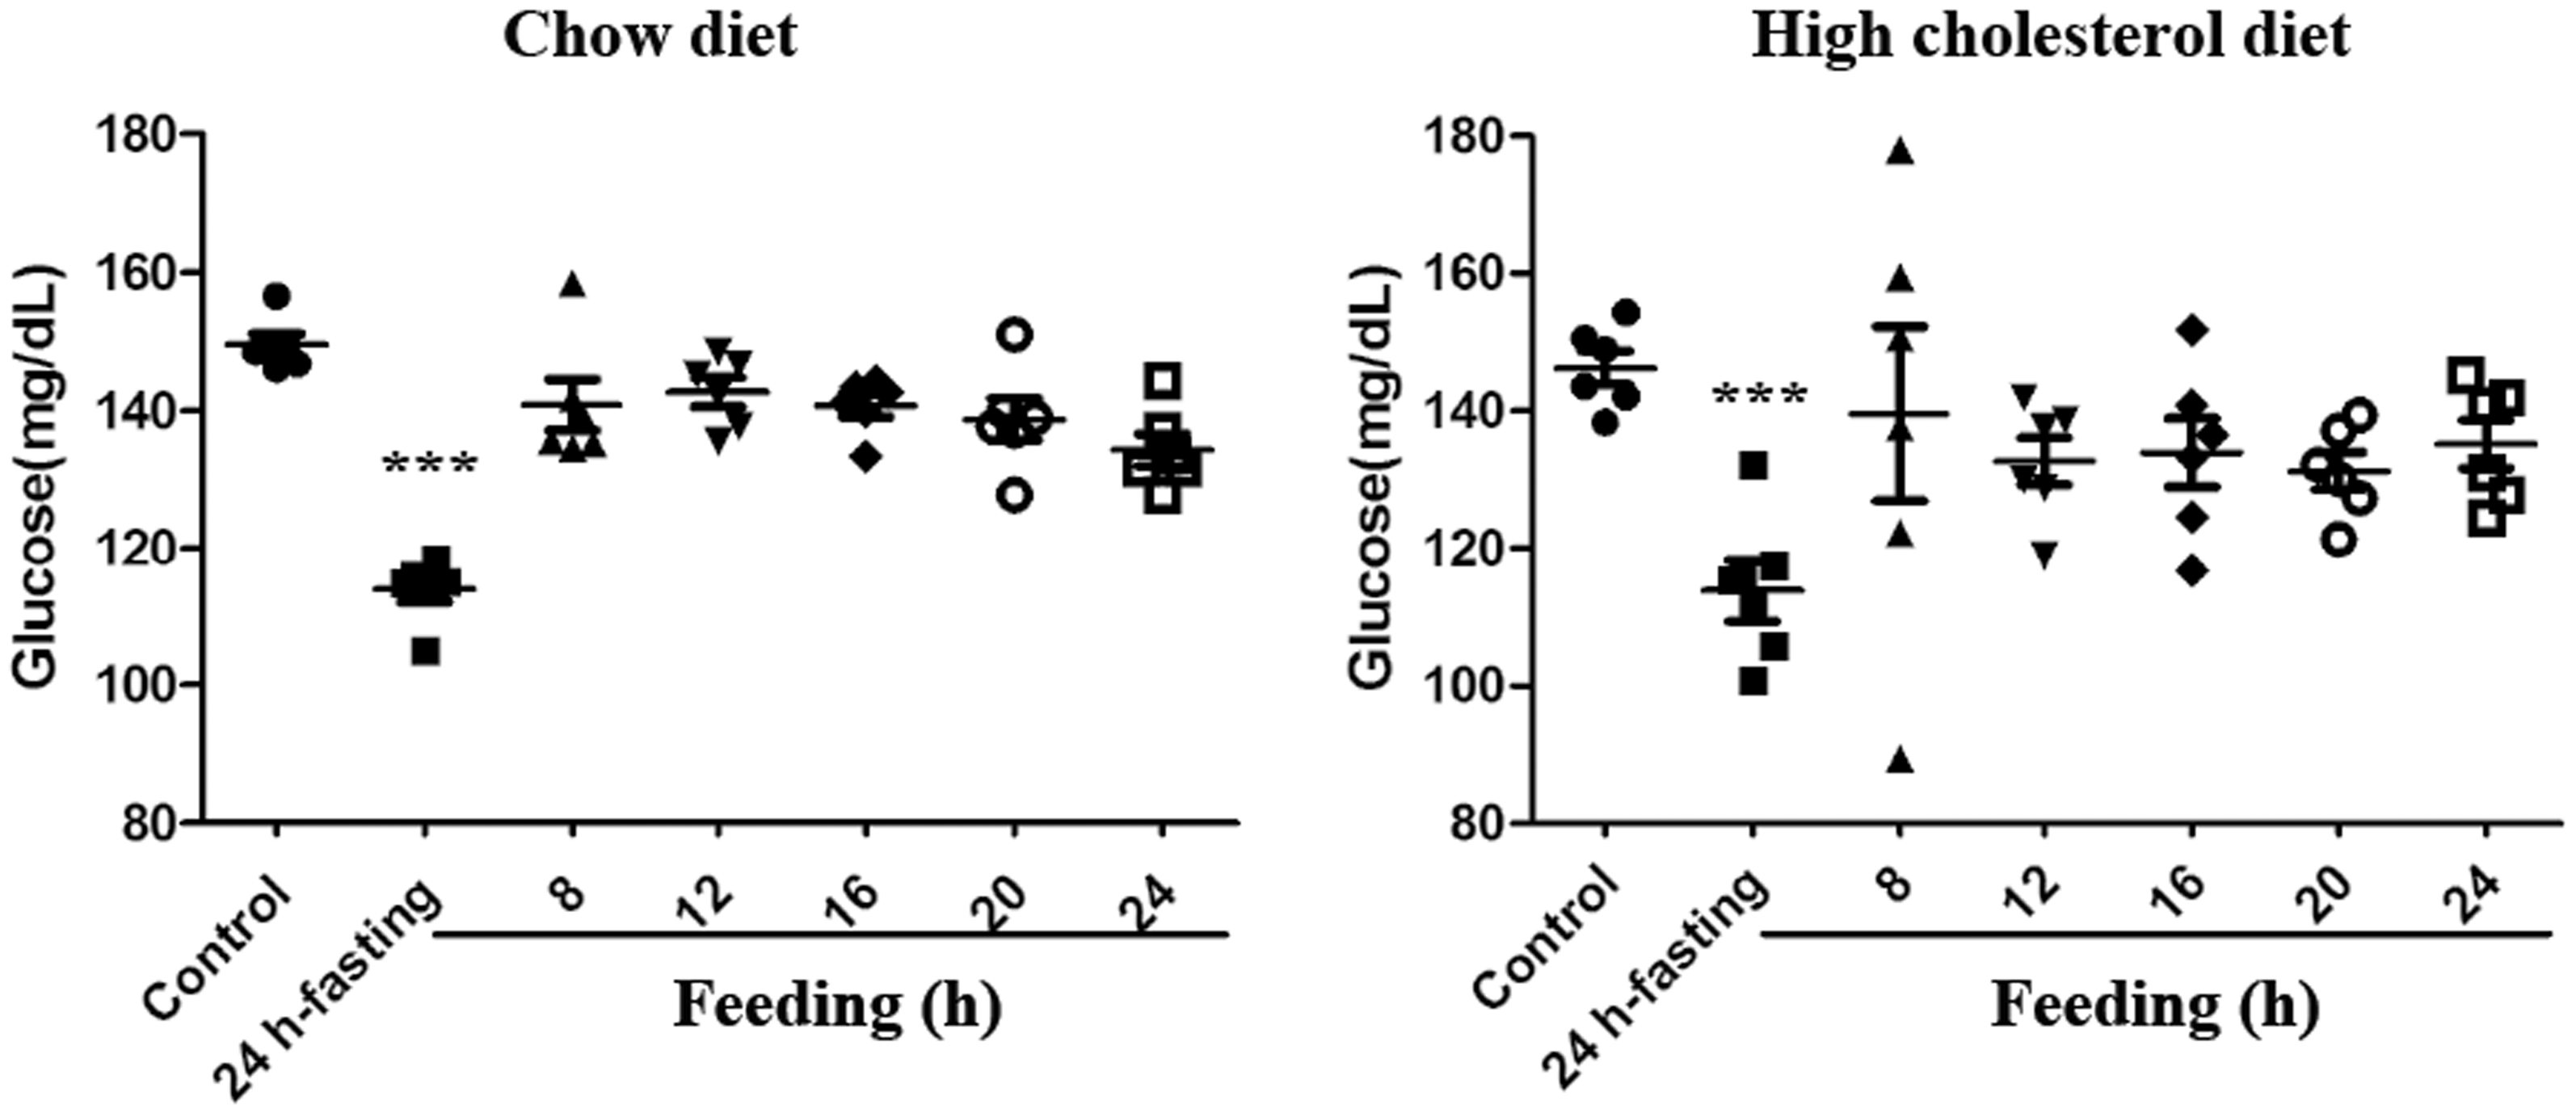
Discussion
Blood lipid and glucose levels are valuable indexes for evaluating the onset and progression of cardiovascular and metabolic diseases. There are strong association between plasma lipid levels and the risk of cardiovascular disease.18,19 For example, during atherosclerosis, lipids play a central role in the pathogenesis of plaque formation.20,21 In particular, a high level of LDL-C is an important risk factor for determining individual susceptibility to atherosclerosis and its complications.22,23 Similar to that in humans, the lipoprotein composition in rabbits is LDL-rich, and there is abundant cholesteryl ester transfer protein (an important regulator of reverse cholesterol transport) in rabbit plasma. 24 Therefore, rabbits have been widely used for studying the pathogenesis of cardiovascular and metabolic diseases.12,13 In the rabbit model, a close relationship exists between plasma lipid levels and atherosclerosis formation, and hyperlipidaemia accelerates atherosclerosis progression. 25 Therefore, plasma lipid levels are good indicators of atherosclerosis. Twelve weeks of a high cholesterol diet can induce typical hyperlipidaemia and atherosclerosis in rabbits. 26 In this study, we observed that the rabbits fed a high cholesterol diet for 12 weeks had markedly higher levels of TC, TG, HDL-C and LDL-C than did the rabbits fed the chow diet.
Although fasting for at least 8 h is conventionally required for testing clinical plasma lipid levels in humans, some reports have shown that fasting is not required to determine the lipid profile in humans.27,28 However, some reports have demonstrated that TG level measured in the non-fasted state is a better predictor of cardiovascular events, including ischaemic stroke, than is fasting TG level.29,30 In experimental studies using mice and rats, overnight fasting is commonly performed before measurement of plasma lipid levels.31–33 One study has shown that fasting has significant impacts on several parameters related to lipid metabolism in the rat liver. 34 In our study, we found that the levels of TC, TG, HDL-C and LDL-C in both the chow diet group and the high cholesterol diet group showed no significant changes from baseline during 24 h of fasting and that the fasting values were similar to the corresponding plasma lipid levels in the non-fasted state. These data indicate that fasting is not necessary for plasma lipid level measurement in rabbits. In a previous study, Van Sickle et al. assessed the effect of fasting on the plasma lipoprotein composition in cholesterol-fed diabetic rabbits. 35 Diabetic rabbits were fed ad libitum a cholesterol-rich diet (containing 0.5% cholesterol and 7% corn oil) for 10–14 days, and non-diabetic rabbits were fed a cholesterol-rich diet (containing 1.5% cholesterol and 6% corn oil) for 12–16 days. At the end of the feeding period, the rabbits were fasted for 48 h and the plasma lipid levels before and after 48 h of fasting were compared. The TC level was found to decrease by 216 ± 56 mg/dL (p < 0.05, paired t-test) after fasting in the non-diabetic rabbits, whereas the TG level showed no significant change. These data are inconsistent with the results of our study; this inconsistency may reflect study differences in diet formula, feeding period, feeding mode and fasting time.
In our study, the rabbits were fed a chow diet or a high cholesterol diet. Although we observed high levels of total cholesterol in the high cholesterol diet group, the triglyceride levels were low (<100 mg/dL) in both the chow diet and high cholesterol diet groups. These results suggest that the high cholesterol diet did not induce hypertriglyceridemia in the rabbits. Our conclusion is based on the findings of rabbits without hypertriglyceridemia; it is possible that in hypertriglyceridemia, plasma lipid levels are influenced by fasting.
Glucose, as the major source of energy, is critical for normal function in a number of tissues. 36 In humans, blood glucose level is usually measured 6 to 8 h after the last meal, and the normal range is 70 to 100 mg/dL. 37 In rabbits, the blood glucose reference range is 75 to 155 mg/dL. 38 In our study, the glucose levels of rabbits fed a chow or high cholesterol diet were measured. There was no effect of diet on glucose level, but fasting for 8 h significantly decreased the glucose levels. Extending the fasting time to more than 8 h did not further reduce the glucose levels. Resuming the diets restored the glucose levels to normal values. In a previous study, Haugel et al. used pregnant rabbits to study glucose utilization by the placenta and foetal tissues. 39 On day 25 of gestation, one group of rabbits was fed a commercial chow diet ad libitum until day 29 of gestation. The other group was fasted for 96 h. After 96 h of fasting, the glucose utilization by the placenta and the whole foetus did not decrease despite profound changes in the endocrine and metabolic maternal parameters. Ninety-six hours of fasting led to significantly lower glucose levels than those observed without fasting in pregnant rabbits (p < 0.001, t-test), which is consistent with our results.
In conclusion, while fasting is not necessary to measure plasma lipid levels in rabbits, it is important for glucose level determination. These findings provide a basis and reference for future studies using rabbits and can improve animal welfare.
Supplemental Material
Supplemental material for Fasting is not required for measuring plasma lipid levels in rabbits
Supplemental Material for Fasting is not required for measuring plasma lipid levels in rabbits by Rong Wang, Ruihan Liu, Lu Li, Baoning Liu, Liang Bai, Weirong Wang, Sihai Zhao and Enqi Liu in Laboratory Animals
Footnotes
Acknowledgement
We are grateful to Professor Jianglin Fan for English language editing.
Declaration of Conflicting Interests
The author(s) declare that there are no conflicts of interest related to the publication of this study.
Funding
The author(s) disclosed receipt of the following financial for the research, authorship, and/or publication of this article: This work was supported in part by the National Natural Science Foundation of China (grant number 81270348) and the Natural Science Foundation of Shaanxi Province (grant number 2014FWPT017).
References
Supplementary Material
Please find the following supplemental material available below.
For Open Access articles published under a Creative Commons License, all supplemental material carries the same license as the article it is associated with.
For non-Open Access articles published, all supplemental material carries a non-exclusive license, and permission requests for re-use of supplemental material or any part of supplemental material shall be sent directly to the copyright owner as specified in the copyright notice associated with the article.