
Abstract
Mouse experimental models of diet-induced weight gain are commonly used as analogs to human obesity; however, a wide variety of feeding methods have been used and the most effective way to maximize weight gain is not known. Maximizing weight gain may allow for a reduction in the number of animals required for a given experiment. The purpose of this study was how to cause the greatest amount of weight gain in CD-1 mice by modifying the composition and source of their diet. To accomplish this goal, we completed two experiments: (1) Effect of dietary macronutrient fat intake (60% (HF60), 45% (HF45), 30% (HF30), or 13.5% (CON) fat diet for 18 weeks); and (2) Effect of 1:1 mixed HF60 and CON diets. Outcome measures included food intake, body mass, and body composition, which were measured bi-weekly and statistically analyzed using a repeated measures analysis of variance (RM–ANOVA). In Experiment 1, the greatest increase in body and fat mass was observed in HF60 (36%) and HF45 (29%) compared with HF30 and CON (P < 0.05). In Experiment 2, HF + stock diet (SK) gained 25% more body mass and 70% more fat mass than HF (P < 0.05). Collectively, these findings suggest that using a high-fat based diet (>45% calories from fat), mixed with a stock diet, results in substantially more weight gain over a similar period, of time, which would allow an investigator to use ∼40% fewer animals in their experimental model.
In the past decade, the prevalence of overweight/obesity has reached epidemic levels in many parts of the world, resulting in a rise in morbidity and premature mortality.1,2 Studying the longitudinal effects of diet-induced weight gain in humans is problematic due to ethical considerations. Thus, rodent weight gain models are an attractive analog for human obesity. One limitation of the current studies is that a wide variety of weight gain methodology has been used and it is not clear which method most effectively maximizes weight gain.3–9
Through a series of investigations, our laboratory has sought to address this limitation in the current literature. We have previously demonstrated that mice that are group-housed (groups of five) and restricted from structured physical activity have greater weight gain than normal growth rates.10,11 Consistent with reports from other laboratories, we have also demonstrated that extremely high-fat diets (60% of calories from fat) result in excessive weight gain above normal growth. 10 Neither our laboratory nor others have specifically compartmentalized weight gain into lean and fat masses. The accounting of fat mass is important because this change, rather than body weight, underlies disease onset and progression. Beyond high-fat diets, other published research has demonstrated that diets which mix different types of non-commercially available foods appear to elicit more weight gain than a single source high-fat diet.4–7 The experiments described in this report were designed to contribute to our laboratory’s long-term goal of designing more effective mouse weight gain models and reducing the number of animals required for a given experiment. The purpose of this study was to show how the manipulation of dietary macronutrient content influences changes in total body, lean, and fat masses over a period of 18–22 weeks in outbred CD-1 mice.
Animals
The experiments described in this study were conducted at the University of Houston (Houston, TX, USA) where the University of Houston Institutional Committee for Animal Care and Use reviewed and approved all procedures described in this manuscript (protocol # 09-008). Specific-pathogen free CD-1 male mice were purchased from Charles River Laboratories (Wilmington, MA, USA). The animals were tattooed with an identification number on their tail using an AIMS Tattoo System (Binghampton, NY, USA). The mice were kept on a reverse 12:12 h light/dark cycle with lights off at 10pm (22:00) and off at 10am. The climate was precisely controlled by the animal facility to minimize fluctuations in ambient temperature (22 ± 1℃) and relative humidity (40 ± 5%). Mice were housed five per cage in standard microisolator cages (Tecniplast; Exton, PA, USA). We have previously demonstrated that mice housed in groups gain more weight than mice housed individually, so the present experiments were completed with mice housed in groups of five. 10 Aspen bedding was used for all experiments to minimize animal consumption of bedding. Animals were provided environmental enrichment in the form of a multidimensional mouse house (Tecniplast) and paper bedding material. No running wheel or other voluntary exercise device was placed in the cage to limit physical activity because we have previously demonstrated that exercise can limit weight gain. 11 The number of animals used in this study was determined based on preliminary studies from our laboratory using diet-induced weight gain in CD-1 mice.10–12
Materials and methods
Reduction, refinement, replacement approach
Dietary macronutrient content.
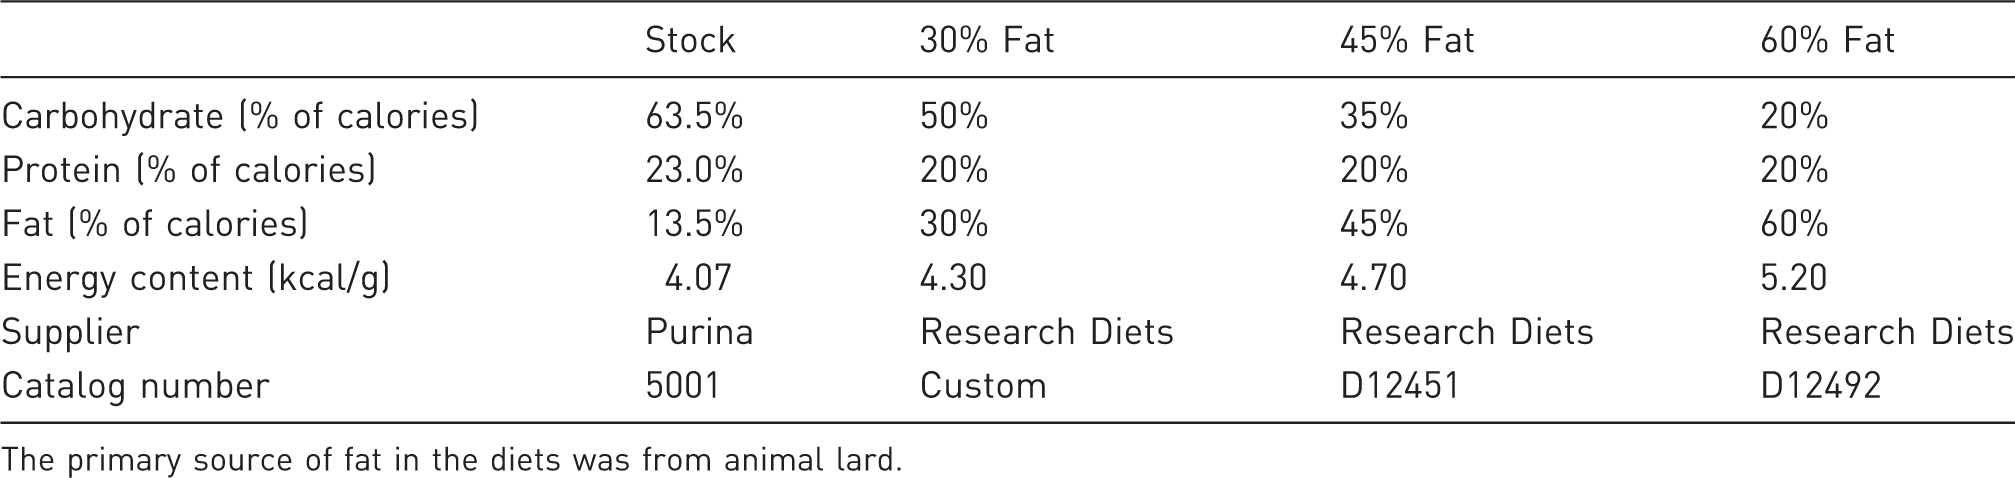
The primary source of fat in the diets was from animal lard.
Experiment 1: Effect of macronutrient fat content
Forty mice were randomly assigned (n = 10/group) to one of four groups: 13.5% of calories from fat (stock chow; CON), 30% of the calories from fat (HF30); 45% of the calories from fat (HF45); or 60% of the calories from fat (HF60). After the mice were allowed to acclimatize to the animal care facility for seven days, they were combined into two large holding cages and randomly removed and assigned to a given experimental group. Additional detail concerning the macronutrient and energy composition of the diet is presented in Table 1. All groups were provided ad libitum access to food and water for the 18 weeks of treatment in Experiment 1.
Total body mass and food intake measurement
Total body mass and food intake were measured at baseline and bi-weekly thereafter over a period of 18 weeks. The same calibrated digital scale was used for all measurements (WeighMax BX-500; City of Industry, CA, USA). Food was purchased from either PMI Nutrition International (St Louis, MO, USA; stock chow) or Research Diets Inc (New Brunswick, NJ, USA; 30%, 45%, and 60% fat chow) and was given in a bolus dose on wire cage lids, which was changed and weighed on a weekly basis. The food remaining in the cage lid (residual) and the food in the bottom of the cage (wasted) were combined, weighed, and recorded as unconsumed food. The total amount of food consumed was determined by the difference between total food given and the residual/wasted food. Total caloric intake was calculated by multiplying the total calories per gram of food and the total weight of food consumed (in grams). Food intake per cage was divided by 5 to express it relative to each mouse.
Body composition measurement
Body composition (lean and fat masses) was measured using a non-lethal, non-sedation technique (EchoMRI; Houston, TX, USA). Briefly, mice were gently placed in an Echo scanning tube, which is designed to minimize movement. The tube was then inserted into the Echo scanner and the measurement was started. The animal was scanned three times (total scan time 90 s), with the machine averaging the three measurements and providing a single result. The Echo scanner was calibrated each day that samples were analyzed using a liquid fat standard. An advantage of the Echo scanner was that mice did not need to be sedated in order to measure body composition. The daily variation of the Echo scanner was <3%, making it a reliable measure for longitudinal changes in body composition. 13
Experiment 2: Mixed diet approach
Ten mice were randomly assigned (n = 5/group) to one of two groups: 60% of calories from fat (HF) or a mixture of HF and stock diet (13.5%) (HF + SK). After the mice were allowed to acclimatize to the animal care facility for seven days, they were combined into two large holding cages and randomly removed and assigned to a given experimental group. Additional detail concerning the macronutrient and energy composition of the diet is presented in Table 1. The two groups were offered equal caloric amounts of chow and fresh food was provided weekly. Since the HF chow had a greater caloric density than the SK chow, mice were provided with different absolute weights of food in order to maintain similar caloric offerings. HF + SK received 116 ± 20 g of HF food and 116 ± 19 g of SK food each week on average. Mice in the HF group received 170 ± 30 g of HF food each week. Both groups had ad libitum access to food and water over the course of the 22-week experiment. Total body mass and body composition (lean and fat masses) were measured on a bi-weekly basis using the same techniques described above in Experiment 1. Each week, food that remained in the wire lid and any in the bedding was removed and weighed together. This weight was subtracted from the weight of food added at the beginning of the week to during food intake. Food intake data were expressed as calories per mouse, which were calculated after the fact using the caloric content of the chow for a given group. Body composition measurements were missing at week 18 because we had a temporary service problem associated with our EchoMRI analyzer.
Statistical analysis
All statistical testing was completed using SPSS version 19.0 (Chicago, IL, USA). Prior to formal statistical testing, data were checked for normality and constant error variance using the EXPLORE function in SPSS. Non-normal data were log-transformed prior to formal statistical testing (noted in the Results section). For Experiment 1, the key outcome variables were analyzed using a 4 (group: CON, HF30, HF45, and HF60) ×10 (time: 0, 2, 4, 6, 8, 10, 12, 14, 16, and 18 weeks) analysis of variance (ANOVA) with repeated measures on the second factor. Data were also analyzed for percent change from baseline using a 4 (group) ×9 (time) analysis of covariance (ANCOVA) with repeated measures on the second factor and the absolute baseline value included as a covariate. For Experiment 2, the key outcome variables were analyzed using a 2 (group: HF60 and HF60 + SK) × 11 (time: 0, 2, 4, 6, 8, 10, 12, 14, 16, 20, and 22 weeks) ANOVA with repeated measures on the second factor. Data were also analyzed for percent change from baseline using a 2 (group) × 10 (time) ANCOVA with repeated measures on the second factor and the absolute baseline value included as a covariate. The F-value for all tests was corrected for the repeated measures design using the Huynh–Feldt method and significance was set at P < 0.05. Location of significant effects was determined using a Tukey post hoc test. Values are presented as the mean ± SEM. We also calculated percent difference between significant values to present in the Results section and allow more complete assessment of the data.
Results
Experiment 1: Total body mass
A significant group × time interaction (F = 4.24; P = 0.002; Figure 1a) was found for total body mass. The greatest body mass gain was observed in HF45 and HF60, which were greater than HF30 and CON (13.5% calories from fat) beginning at week 6 (P = 0.002). HF45 gained 29% more mass than CON and HF60 gained 36% more weight than CON (P = 0.002). Numerically, HF30 gained 14% more weight than CON, but this difference did not reach statistical significance. Similarly there was no significant difference between HF60 and HF45, although HF60 did gain 7% more mass than HF45.
Effect of dietary fat content. This figure presents the total body (a), fat (b), and lean (c) mass response in four groups of CD-1 male mice. Mice were housed in groups of five and provided ad libitum access to a 60% (HF60), 45% (HF45), or 30% (HF30) of the calories from a fat or a stock control diet (13.5% kcal from fat, 28.5% kcal from protein, 58% kcal from carbohydrates, 4.07 kcal/g; LabDiet 5001). Body mass was measured using a digital scale and body composition (fat and lean masses) was measured using a small animal EchoMRI machine. Data represent the mean ± SEM. *Indicates HF60 and HF45 are significantly greater than HF30 and CON (P < 0.05). #Indicates an increase in lean mass over time in all groups (P < 0.05).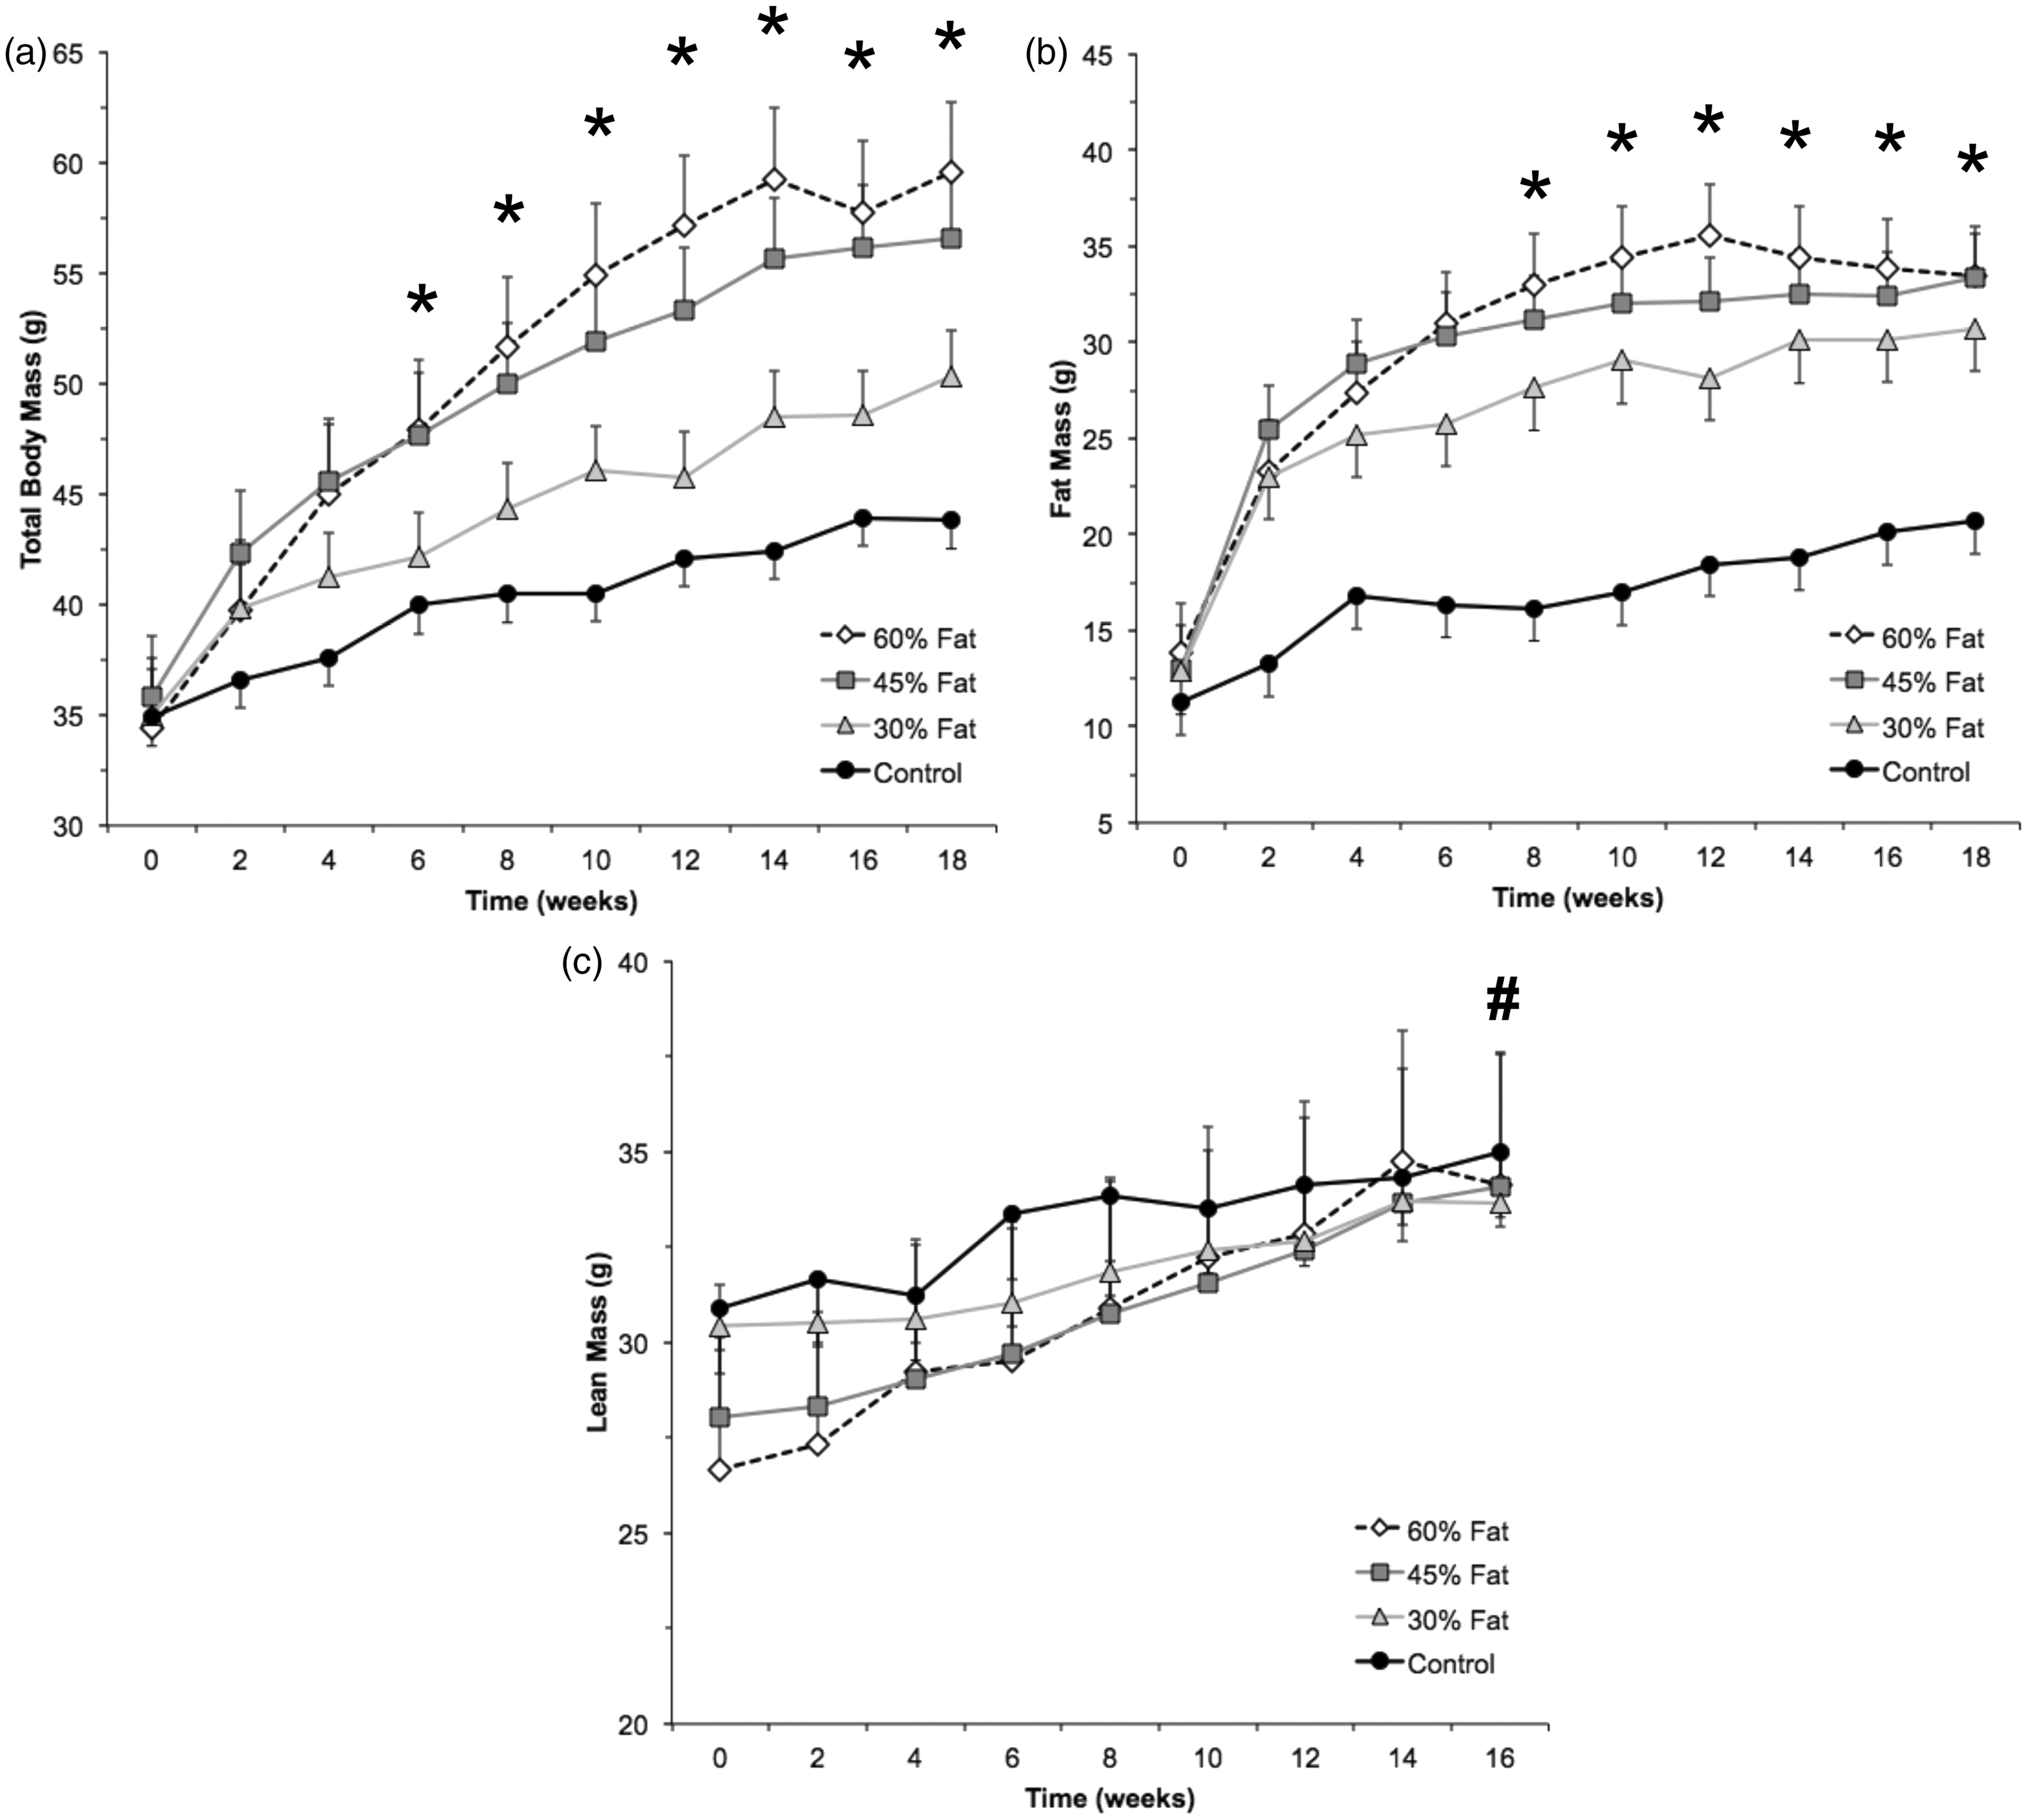
Experiment 1: Body composition
A significant group × time interaction was found for fat mass (F = 5.215; P < 0.001; Figure 1b), where HF60 and HF45 had significantly more body fat beginning at week 8 than either HF30 or CON (P’s). HF30 and CON were not different from each other. HF45 gained 105% more fat mass than CON (P) and HF60 gained 121% more fat mass than CON (P). Despite numerical differences, there was no significant difference between HF45 and HF60 for fat mass. When considering percent body fat, we found the same group × time interaction (F = 3.936; P < 0.001). The location of the significant effects was also the same, beginning at week 8; both HF45 and HF60 were significantly greater than HF30 and stock (data not shown). We found a significant time effect (F = 4.699; P = 0.002; Figure 1c) for lean mass, where all four groups, regardless of dietary treatment, gained a similar amount of lean mass over the course of the intervention. The average lean mass gain was 28% across the groups over 18 weeks (P = 0.002).
Experiment 1: Food intake
There was a numerical difference in total caloric intake among the groups across the entire experiment: HF60 (1913 kcal/mouse), HF45 (1806 kcal/mouse), HF30 (1495 kcal/mouse), and CON (2187 kcal/mouse). However, this effect was not close to reaching statistical significance (F = 1.482; P = 0.180).
Experiment 2: Total body mass
We found a significant group × time interaction (F = 3.177; P = 0.044; Figure 2a) for total body mass. Starting at week 10, HF + SK gained more body mass than HF (P = 0.044). Compared with the baseline values, HF + SK had a 66% increase in body mass compared with 41% for HF (P = 0.044). At week 22, HF + SK weighed 22% more than HF (P = 0.044).
Effect of mixed diet approach. This figure presents the total body (a), fat (b), and lean (c) mass response in two groups of CD-1 male mice. Mice were housed in groups of five and provided ad libitum access to either 60% of the calories from a fat diet or a mixed diet where half the calories were supplied by HF60 and the other half were supplied by the stock control diet (13.5% kcal from fat, 28.5% kcal from protein, 58% kcal from carbohydrates, 4.07 kcal/g). Body mass was measured using a digital scale and body composition (fat and lean masses) was measured using a small animal EchoMRI machine. Body composition measurements were missing at week 18 because we had a temporary service problem associated with our EchoMRI analyzer. Data represent the mean ± SEM.
 Indicates mixed diet significantly greater than HF60 (P < 0.05). #Indicates an increase in lean mass over time in all groups (P < 0.05).
Experiment 2: Body composition
We found a significant group × time interaction (F = 3.074; P = 0.039; Figure 2b) for fat mass. Starting at week 8, HF + SK had significantly more fat mass than HF. Over the course of the 22-week treatment, HF + SK experienced a 258% increase in fat mass, compared with a 175% increase for HF. Comparing groups revealed that HF + SK gained 70% more fat mass than HF. Lean mass increased by a similar amount (HF = 23%, HF + SK = 27%) between both groups (F = 29.567; P < 0.0001; Figure 2c), but did not significantly differ between groups.
Experiment 2: Food intake
In Experiment 2, HF + SK and HF were presented with a similar caloric amount of chow each week. We found that while there were numerical differences, the caloric intake did not differ statistically between the two groups. Specifically, HF + SK (2867 kcal/mouse) consumed 11% more calories per mouse over the course of the study than HF (2589 kcal/mouse). The greater food intake in HF (2589 kcal/mouse) than HF60 (1913 kcal/mouse) from Experiment 1 was explained by the fact that Experiment 2 lasted four weeks longer than Experiment 1.
Discussion
The present study sought to refine existing methods of diet-induced weight gain in mice. Through the methods, revisions proposed in this report, we have also demonstrated a means by which a researcher could reduce the number of experimental mice used. To our knowledge, this is the first study to report changes in both body mass and body composition (lean and fat masses) over extended periods of time. Our key findings were that when macronutrient fat content exceeds 45% of calories, mice tend to gain at least 105% more fat mass than when on a low-fat diet. Interpretation of this finding means that if a low-fat diet were used to examine diet-induced weight gain then at least three times the number of animals would be required. When comparing the 45% and 60% fat diets, we found another 16% increase in fat mass, which would reduce the number of animals required per group by another 20–30%. Our second key finding was that mixing a 60% fat diet with a lower fat stock diet increased fat mass gain by an additional 80% compared with a high-fat diet alone. In terms of reduction, this would decrease the number of animals required by another 20–30%. Collectively, these findings demonstrate that the most effective dietary manipulation to maximize weight gain in CD-1 mice is to mix a high-fat (>45%) with a low-fat stock diet. Since both of these diets are commercially available, other researchers could easily duplicate these feeding techniques. The refined methods that we describe in this report are associated with up to a 60% reduction in the number of animals that might be needed for a given experiment that investigates changes in fat mass.
Increases in body weight and fat mass are enhanced by using diets that contain a proportion of fat greater than or equal to 45%, which may lead to greater disease risks. We found that mice consuming either a 45% fat diet or a 60% fat diet experienced 29% and 36% increases in body weight over 18 weeks. This finding is consistent with another report suggesting that it is important to consider dietary fat content when designing a mouse model of diet-induced obesity. 9 However, previous studies have not consistently broken down total body mass changes into lean and fat masses. We further observed 105% and 121% increases in fat mass in mice consuming either a 45% fat diet or a 60% fat diet, respectively, with little difference regarding increases in lean mass. The response observed with the stock diet group was consistent with normal growth profiles provided by Charles Rivers Labs. The body composition breakdown is particularly important because increased fat mass underlies the metabolic changes that result in obesity-associated diseases.10,11,14 For example, increases in fat mass are associated with decreased production of adiponectin as well as increased production of leptin and pro-inflammatory cytokines (TNF-α, IL-1β, and IL-6). 15 By controlling for changes in fat mass, we are able to demonstrate that the feeding pattern described in this report mirrors body fat distributions in obese humans. Collectively, these results indicate that by increasing the amount of macronutrient fat content, it is possible to increase weight gain and reduce the number of animals needed for a desired outcome.
Once we established the threshold for macronutrient fat intake, our next objective was to further manipulate the diet to elicit additional increases in fat mass. As stated above, increasing fat mass will increase the statistical effect size and potentially reduce the number of animals required for a given experiment. In the present study, the mixed diet approach used in Experiment 2 enhanced weight/fat gain compared with a single high-fat chow alone, supporting the use of a mixed diet as a possible alternative to the ‘cafeteria’ diet.4–7 We provided mice with equal caloric amounts of either a 60% fat diet or a diet that was 50% high-fat food (60% fat) and 50% stock food (13.5% fat). We selected the 60% fat food as our foundation diet because it elicited the greatest numerical weight gain in our first experiment (effect of dietary fat content). The observed change in total body mass in the mixed diet group (HF + SK) was consistently greater than in the 60% fat only group and was also consistent with the profile that has been reported with cafeteria diets.3–5,8,9,16 Interestingly, our mixed diet enhanced the increase in fat mass despite a similar caloric intake between groups. Like the cafeteria diet, our mixed approach may have enhanced weight gain by providing variety. Much like humans, mice that are fed a variety of foods tend to have increased interest in eating and thus increased weight gain.8,16 Sampey et al. 7 reported that rodent diets that mix different food sources provide a better representation of human metabolic syndrome and obesity. South et al. 16 reported differences in brain chemistry between mice consuming a stock versus a cafeteria diet, suggesting that a cafeteria diet boosts feeding efficiency. One advantage of our mixed diet approach is that it uses commercially available food sources as opposed to non-commercial cafeteria diets, which may be expensive, time-consuming to prepare, and not controlled in terms of the nutritional composition. The approach we describe in Experiment 2 should further increase the statistical effect size associated with changes in fat mass, allowing for additional decreases in the sample size.
The present study was focused on providing empirical data to demonstrate how macronutrient fat content and mixed diets cause changes in total body, lean, and fat masses. While these objectives have been accomplished, there are a few limitations that will need to be addressed in future experiments. We opted to use outbred mice because this particular strain of mouse (CD-1) was known to have more mouse-to-mouse variability than other inbred strains. Also, CD-1 mice are known to be more prone to diet-induced weight gain making them the ideal model for the present investigation. Despite this, future experiments are needed to compare CD-1 mice with other strains of mice that are also used in obesity-related research. Since we have demonstrated significant effects in a highly variable mouse strain (CD-1), it is reasonable to speculate that our findings will translate to other inbred mouse strains with much less variability.
The key findings of the present study have extended our previous research in the area of mouse diet-induced weight by describing methods that could be used to reduce the number of animals required for a given experiment. It is our hope that the present findings will be useful to investigators who are evaluating the use of a mouse diet-induced weight gain model as an analog for human obesity.
Footnotes
Acknowledgments
The present study was partially supported by graduate student grants from the Texas Obesity Research Center (Houston, TX, USA) to Carpenter and Strohacker. All of the authors listed contributed to the design, collection, analysis, and preparation of the present manuscript.
Declaration of conflicting interests
None.