
Abstract
The aetiology of insulin resistance is still an enigma. Mouse models are frequently employed to study the underlying pathology. The most commonly used methods to monitor insulin resistance are the HOMA-IR, glucose or insulin tolerance tests and the hyperinsulinemic euglycaemic clamp (HIEC). Unfortunately, these tests disturb steady state glucose metabolism. Here we describe a method in which blood glucose kinetics can be determined in fasted mice without noticeably perturbing glucose homeostasis. The method involves an intraperitoneal injection of a trace amount of [6,6-2H2]glucose and can be performed repeatedly in individual mice. The validity and performance of this novel method was tested in mice fed on chow or high-fat diet for a period of five weeks. After administering the mice with [6,6-2H2]glucose, decay of the glucose label was followed in small volumes of blood collected by tail tip bleeding during a 90-minute period. The total amount of blood collected was less than 120 μL. This novel approach confirmed in detail the well-known increase in insulin resistance induced by a high-fat diet. The mice showed reduced glucose clearance rate, and reduced hepatic and peripheral insulin sensitivity. To compensate for this insulin resistance, β-cell function was slightly increased. We conclude that this refinement of existing methods enables detailed information of glucose homeostasis in mice. Insulin resistance can be accurately determined while mechanistic insight is obtained in underlying pathology. In addition, this novel approach reduces the number of mice needed for longitudinal studies of insulin sensitivity and glucose metabolism.
Introduction
The metabolic syndrome is one of the most important contemporary disease complexes in western societies.1,2 The syndrome is defined as a cluster of interrelated risk factors which predict a high incidence of cardiovascular disease and diabetes mellitus type 2. According to the International Diabetes Federation these risk factors include central obesity defined by increased waist circumference, hypertension, increased plasma triglyceride levels, reduced HDL cholesterol, hyperglycaemia and insulin resistance. 3
To elucidate the effects of multiple factors, such as gender, heredity and environment on development of the metabolic syndrome, a number of animal models have been introduced. From these models, mouse models are very important, since they can be genetically manipulated and hence offer the possibility to study the role of specific genes in the development of insulin resistance and/or changes in glucose metabolism independent from other circumstances.4–6 In addition, mice have a high reproduction rate and a relatively short lifespan which is essential for studies on parental effects (e.g. in metabolic programming) and healthy ageing. 7 Due to their small size, however, mouse experiments are limited by the amount of blood that can be taken, which is restricted to 8 mL/kg/14 days 8 by most animal ethical committees. In addition, infusion rates during complex stable isotope infusion protocols have to be adjusted to the high metabolic rate of mice and (surgical) handling of mice is complicated and requires specific skills. Therefore, some of the published mouse experiments are performed under restrained or even anaesthetized conditions which strongly influence rates of glucose turnover, making it difficult to interpret the results. 9
Simple parametric models like the homeostatic model assessment (HOMA-IR) are most commonly used to assess the degree of insulin resistance and glucose intolerance. These models are solely based on measurements of insulin and glucose concentration and are therefore not suited to study the (patho)physiology of interorgan relationships that could underlie perturbed insulin sensitivity, 10 Moreover, methods need to be developed to allow for longitudinal studies in individual mice to evaluate changes in tissue-specific insulin sensitivity. For this purpose, the kinetic or steady-state flux experiments are a good approach. To study insulin resistance in more detail, e.g. tissue-specific insulin sensitivity, a number of techniques are available from which the hyperinsulinemic euglycaemic clamp (HIEC) is regarded as the ‘gold standard’.11,12 The HIEC cannot be used for longitudinal studies of tissue-specific insulin sensitivity in individual mice, since the HIEC is invasive and can only be performed once in an individual mouse. 13 Less invasive techniques are glucose tolerance tests and insulin tolerance test, 14 but these tests only evaluate effects on whole body glucose metabolism under perturbing conditions and are not tissue-specific.
Longitudinal studies on changes in insulin sensitivity and glucose tolerance with sequential testing in individual mice depend on the ability to accurately perform measurements in small blood samples. We developed a blood sampling method by taking bloodspots via tail tip bleeding on filter paper as starting material for analyses of stable isotopically labelled compounds by gas chromatography-mass spectrometry (GC-MS). 15 Hereby, we were able to minimize the volume of blood required to measure concentrations of labelled compounds in blood over time. This approach can be implemented in other published methods. Galvin and colleagues, for instance, estimated glucose kinetics and insulin sensitivity from glucose and insulin data during an intravenous glucose tolerance test. 16 This method, however, perturbs the glucose and insulin concentrations due to the high amount of glucose given. Pacini et al. 17 introduced a similar method for mice, in which data were analysed using the minimum model technique, according to a two-compartment model. During this experiment, mice were kept under anaesthesia on a heating pad and seven blood samples were taken of 75 μL each. The large volume of blood withdrawn in this method perturbs the circulation severely which makes interpretation of the data difficult.
We hypothesized that the combination of a trace amount of stable isotopically labelled glucose, combined with collection of small blood samples on filter paper and GC-MS analysis, would enable us to obtain the necessary data to calculate glucose kinetics at prevailing glucose and insulin concentrations during fasting. In this study, we present a method to calculate glucose kinetics and correlate these kinetic data with parameters of the HOMA-IR under prevailing glucose and insulin concentrations. To this purpose, a small amount of stable isotopically labelled
Animals
Male C57BL/6J mice (25.3 ± 1.4 g), aged 8–12 weeks, were included (n = 40). The animals were obtained from Harlan Laboratories (Horst, The Netherlands). After arrival, animals were allowed to recover for one week in groups of six animals in plexiglas cages, receiving a commercially available lab chow ad libitum (RMH-B, Arie Blok Diervoeding, Woerden, The Netherlands). Mice were subsequently housed individually for one week with cage enrichment after which the first blood glucose kinetics test (day 0) was performed. Next, mice remained on lab chow or received a high-fat diet (36% (wt/wt) bovine tallow, i.e. 60% energy from fat) 21 for five weeks after which the blood glucose kinetics test was repeated. During the whole experiment mice were housed under a controlled 12 hours light–dark cycle and temperature (21°C) regimen. The experiments were approved by the Ethical Committee for Animal Experiments of the University of Groningen.
Materials and Methods
Blood glucose kinetics
After nine hour fast (23:00–8:00), at time point 0, mice received a small amount of 2.0 mg
Metabolite concentrations
Blood glucose concentrations were determined with a hand-held OneTouch Ultra Blood Glucose Meter (LifeScan Benelux, Beerse, Belgium). Plasma insulin concentrations were determined using enzyme-linked immunosorbent assay adapted for measurements in 10 μL plasma (Ultrasensitive Mouse Insulin kit, Mercodia, Uppsala, Sweden). HOMA-IR was calculated by a formula adapted to Matthews et al. 10 For mice, reference values were calculated using average fasting glucose (6.4 mmol/L) and plasma insulin (2.2 mU L–1) concentrations from the control group at the start of the experiment (Table 1, Eqs 9–15).
Formulas for the calculated parameters for the single-pool first order glucose kinetics
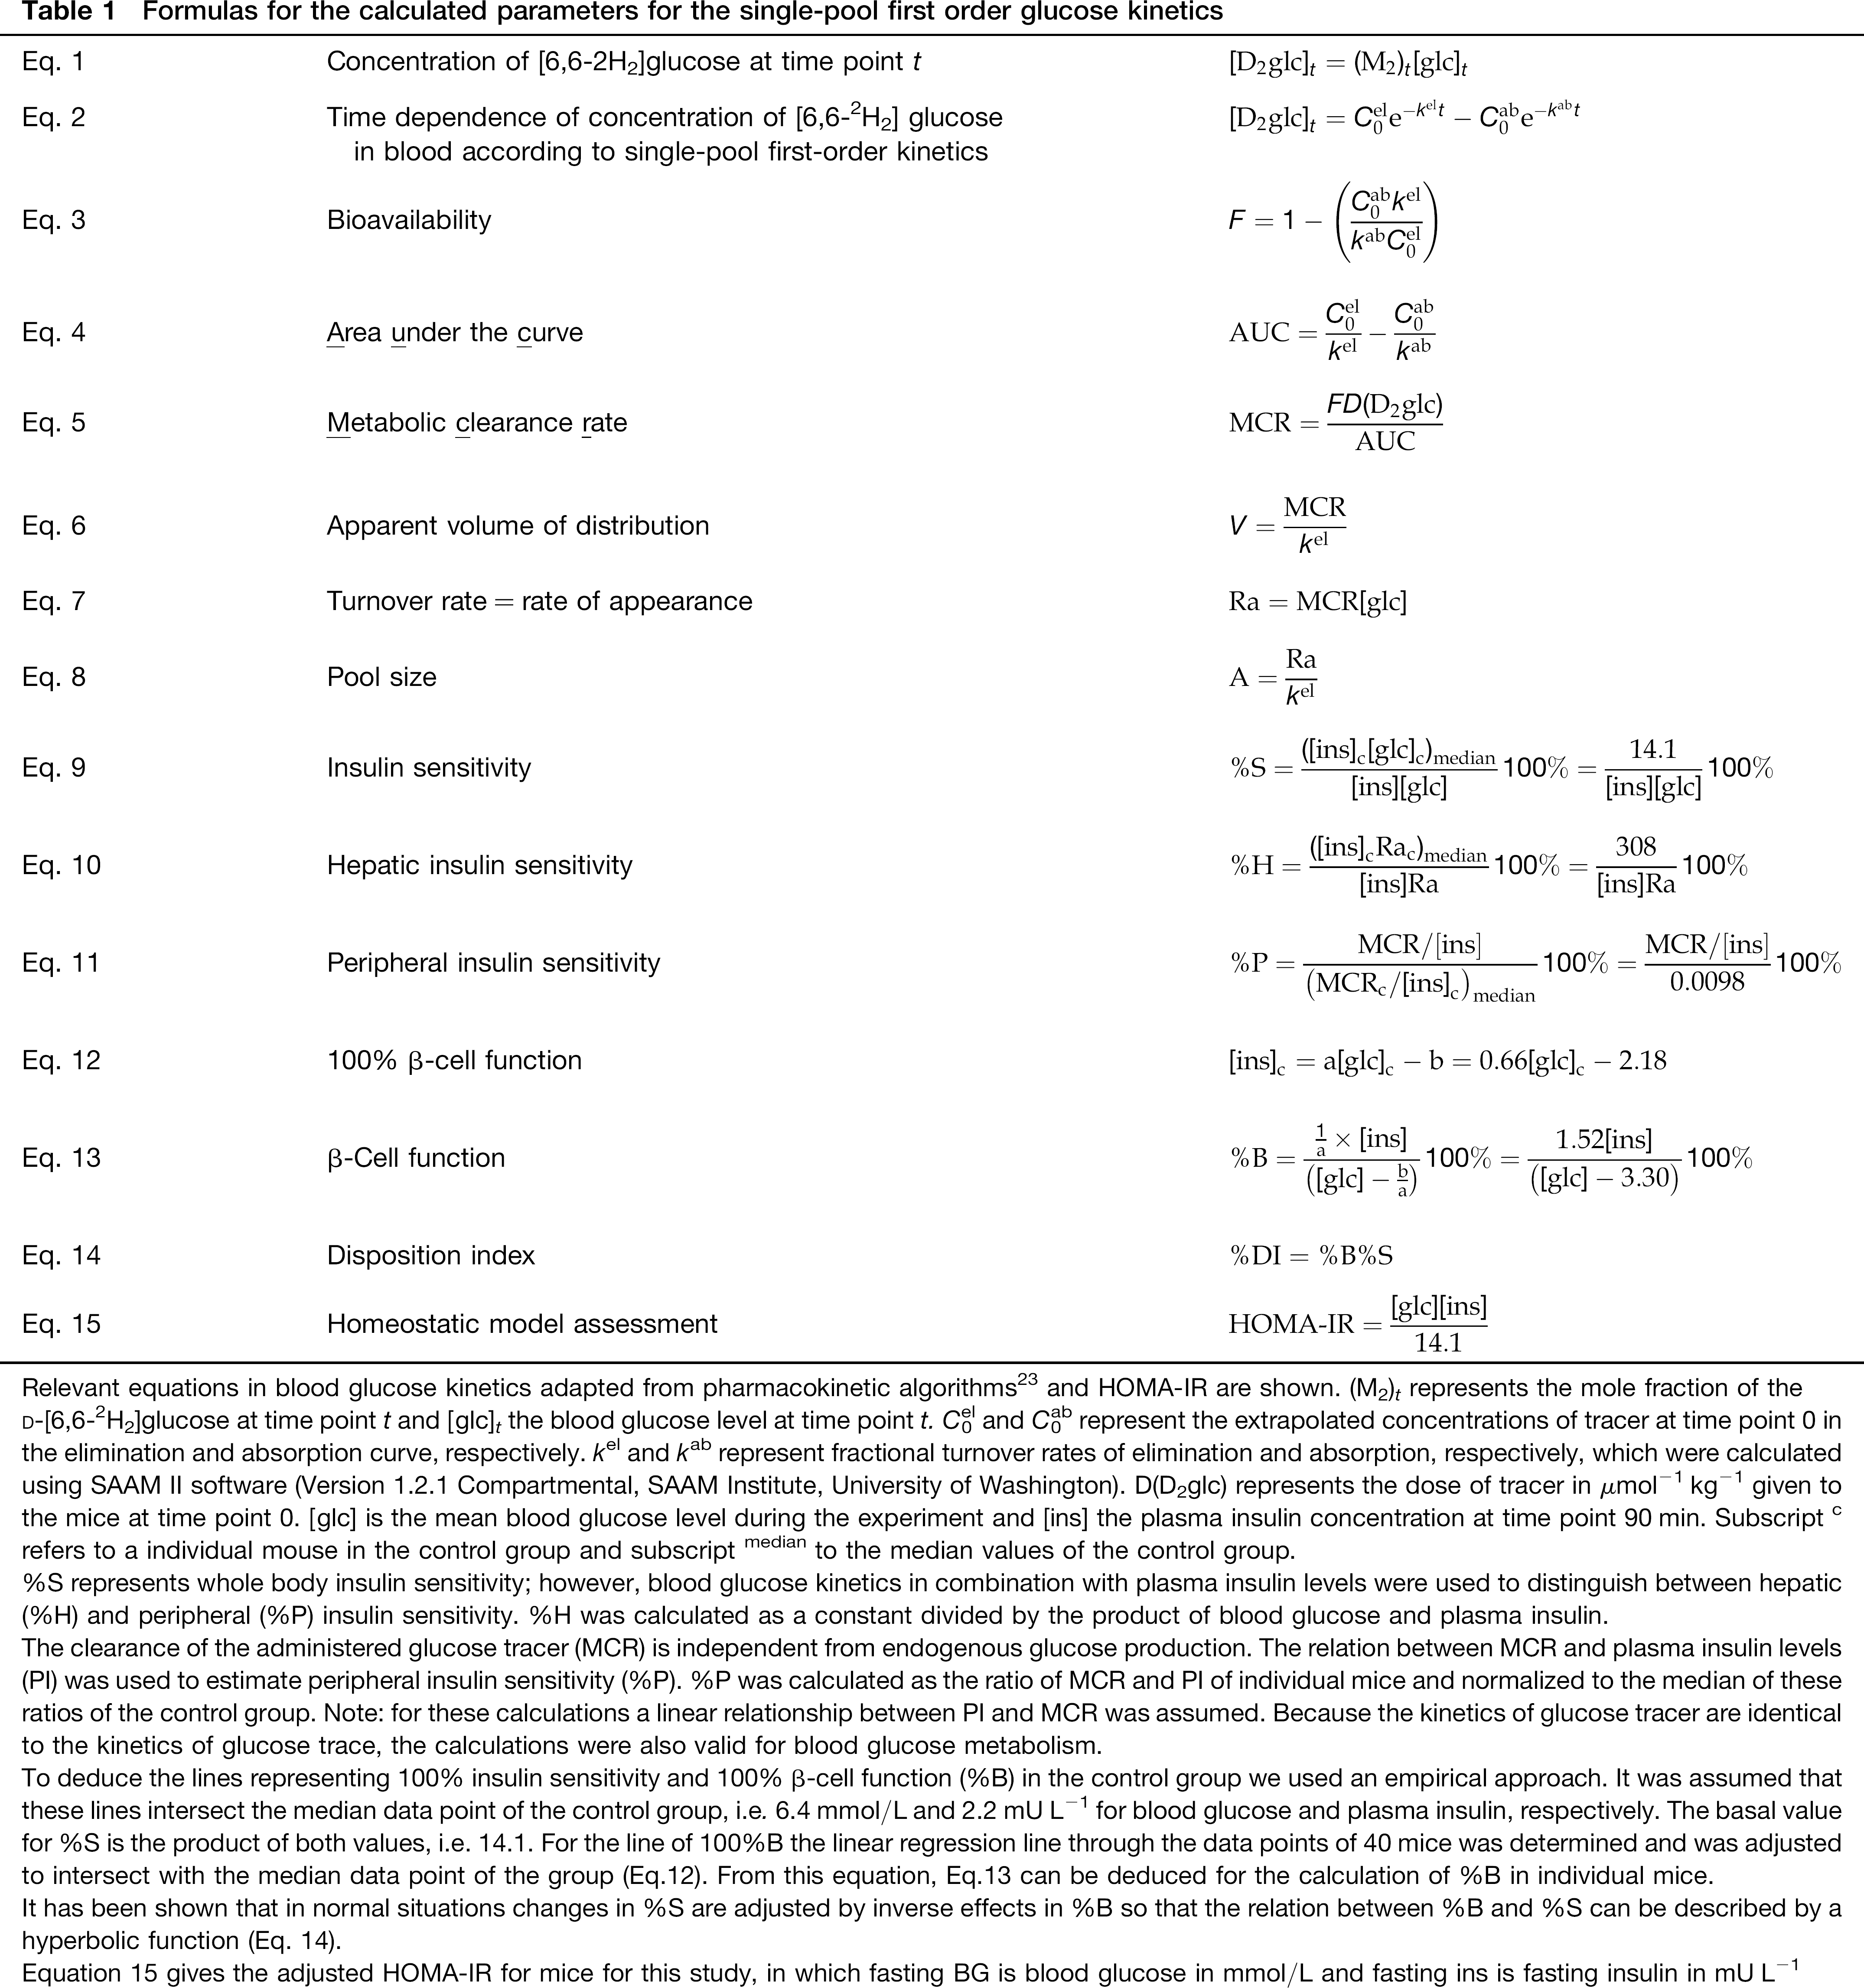
Relevant equations in blood glucose kinetics adapted from pharmacokinetic algorithms
23
and HOMA-IR are shown. (M2)t represents the mole fraction of the
%S represents whole body insulin sensitivity; however, blood glucose kinetics in combination with plasma insulin levels were used to distinguish between hepatic (%H) and peripheral (%P) insulin sensitivity. %H was calculated as a constant divided by the product of blood glucose and plasma insulin.
The clearance of the administered glucose tracer (MCR) is independent from endogenous glucose production. The relation between MCR and plasma insulin levels (PI) was used to estimate peripheral insulin sensitivity (%P). %P was calculated as the ratio of MCR and PI of individual mice and normalized to the median of these ratios of the control group. Note: for these calculations a linear relationship between PI and MCR was assumed. Because the kinetics of glucose tracer are identical to the kinetics of glucose trace, the calculations were also valid for blood glucose metabolism.
To deduce the lines representing 100% insulin sensitivity and 100% β-cell function (%B) in the control group we used an empirical approach. It was assumed that these lines intersect the median data point of the control group, i.e. 6.4 mmol/L and 2.2 mU L–1 for blood glucose and plasma insulin, respectively. The basal value for %S is the product of both values, i.e. 14.1. For the line of 100%B the linear regression line through the data points of 40 mice was determined and was adjusted to intersect with the median data point of the group (Eq.12). From this equation, Eq.13 can be deduced for the calculation of %B in individual mice.
It has been shown that in normal situations changes in %S are adjusted by inverse effects in %B so that the relation between %B and %S can be described by a hyperbolic function (Eq. 14).
Equation 15 gives the adjusted HOMA-IR for mice for this study, in which fasting BG is blood glucose in mmol/L and fasting ins is fasting insulin in mU L–1
Derivatization and GC-MS measurements of glucose
Fractional distributions of
Calculation of blood glucose kinetics
Whole body glucose turnover (Ra) and clearance (MCR) were calculated by kinetic analysis from the wash-out of injected
To estimate the kinetic parameters, a single-compartment model was implemented in SAAM II. The average time course was calculated for each of the studied groups and fitted to the time course in the model. The values of the kinetic parameters obtained were used as Bayesian values in the fitting of the model to the data points for individual mice. Next, averages of the parameter values of the individual mice were calculated for each of the studied groups and compared with the initial parameter values extracted from the average time-course. The estimates of parameters for each individual mouse were accepted when no significant difference remained between both sets of values. Otherwise, the procedure was repeated with adjusted Bayesian values.
Statistics
Deming regression was used for comparisons of different methods. Data were plotted as median values in a Tukey box-plot, showing 2× SD with its outliers. Two group comparisons were done by the Wilcoxon signed rank test or Mann-Whitney U test for related and unrelated groups, respectively. Differences were considered statistically significant when P < 0.05. (Prism 5.00, GraphPad Software, Inc., La Jolla, CA, USA)
Results
To investigate the effect of this experimental protocol on glucose metabolism, a small amount (2.0 mg per mouse) of Glucose and insulin levels during experiment, Blood concentrations of glucose, tracer 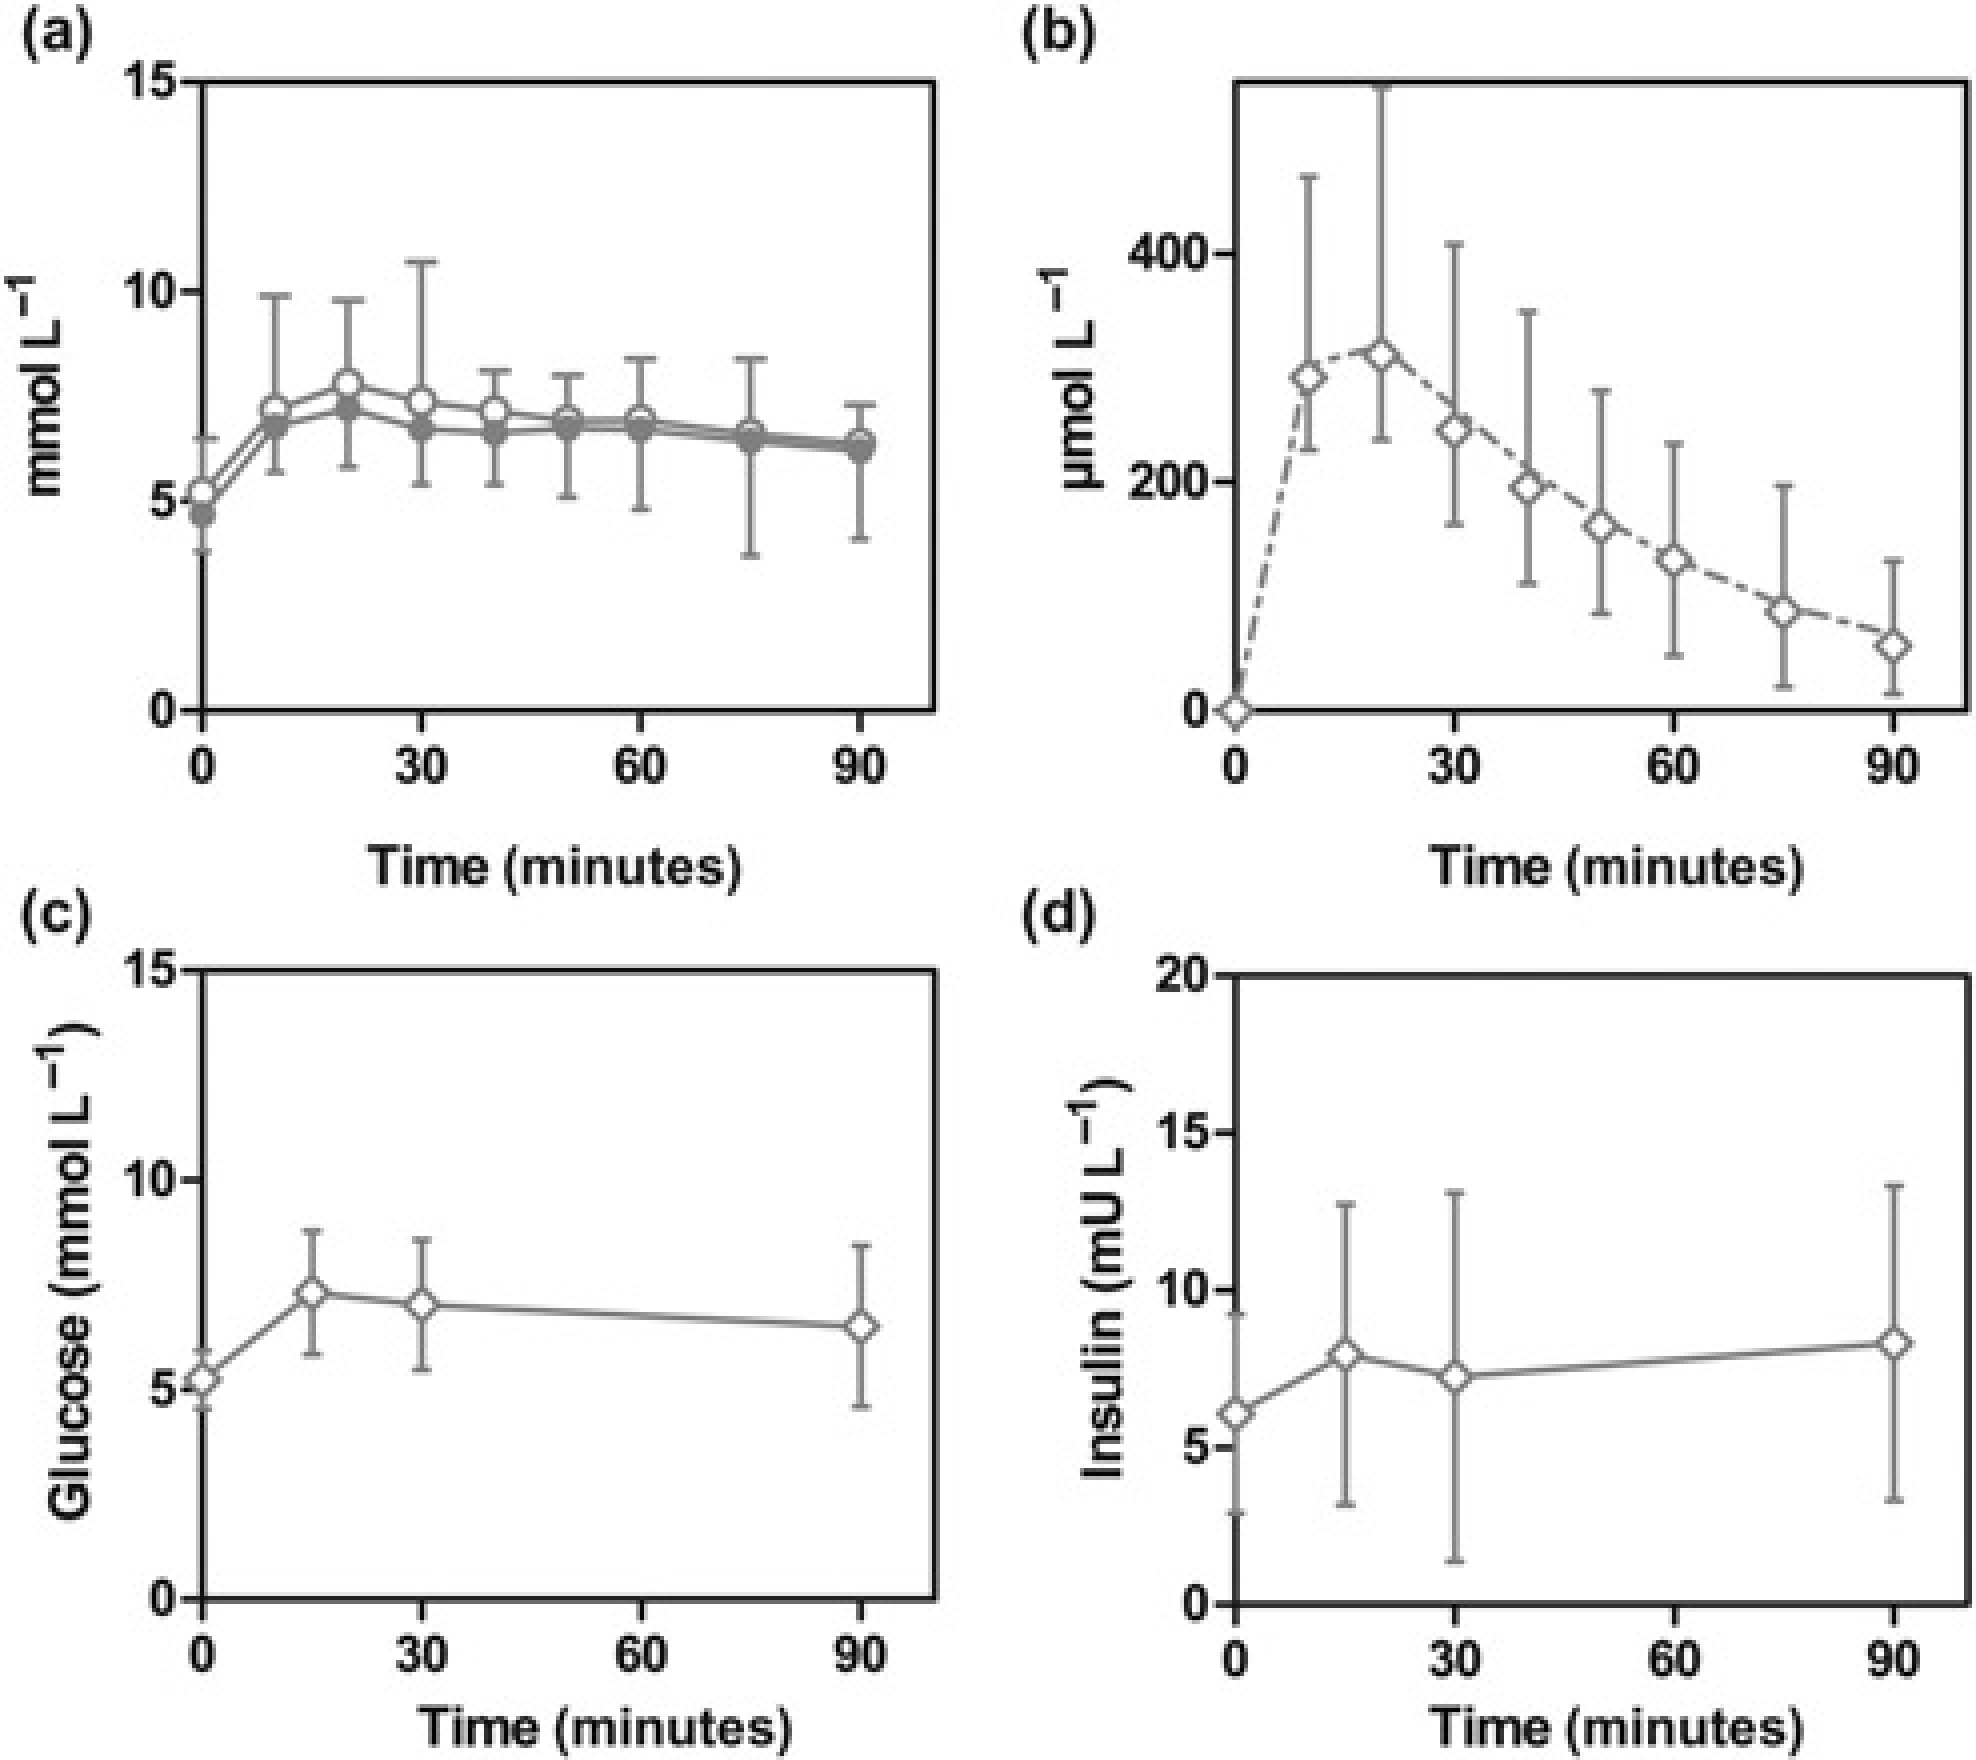
A high-fat diet increases HOMA-IR and reduces insulin sensitivity
The performance of the blood glucose kinetics test was validated in a group of mice fed on either a chow or a high-fat diet for five weeks. Both groups had similar median values of fasting blood glucose concentrations on day 0 of the experiment (Figure 2a). Fasting blood glucose concentrations increased significantly when mice received a high-fat diet for 35 days, i.e. from a median of 6.5–11.9 mmol/L, while it remained almost unchanged in the chow-fed group. Plasma insulin concentrations showed a very similar course (Figure 2b): plasma insulin concentrations only increased in mice fed on a high-fat diet for 35 days, i.e. from 2.3 to 10.3 mU L–1. The product of the median values measured in mice at day 0 of the experiment (i.e. 6.4 mmol/L for glucose and 2.2 mU L–1 for insulin) were used to calculate the basal values of the HOMA-IR and insulin sensitivity (%S), which allowed for adjustment of the HOMA-IR for mice. To deduce equation 12 for β-cell function (%B), data from all 40 mice on day 0 were used (Figure 2g). From this data-set the linear regression line was determined to intersect with the data point representing median insulin and glucose concentrations. Equation 13 deduced from Eq. 12 can be used for adjustment of the %S for mice. High-fat feeding of mice resulted in a significantly increased HOMA-IR (Figure 2c). In addition, the %S and %B were calculated, according to Eqs 9 and 13 from Table 1, respectively. The values of day 0 represents 100% insulin sensitivity and 100% β-cell function. After 35 days %S was slightly but significantly reduced in the chow-fed group (Figure 2d), i.e. from median 97% to 79%. In contrast, the high-fat fed group had a very strong reduction in %S, i.e. from median 101% to 12% (Figure 2d). Where the β-cell function (%B) in the chow-fed remained unchanged it was increased in the high-fat fed group (Figure 2e), i.e. median 91% to 177%, implying compensation for reduced insulin sensitivity by increasing β-cell activity. Subsequently, the relationship was studied between β-cell function and insulin sensitivity in mice (Figure 2h). Similar to humans, in mice the relationship between %B and %S can be described by a hyperbolic function. The disposition index (%DI), a measure for the ability of β-cells to compensate for reduced insulin sensitivity, was calculated according to Eq. 14 (Table 1). It was clear that %DI at the end of the experiment in chow-fed animals was very comparable with that calculated for the start of the experiment (Figure 2f). In contrast, the %DI of high-fat fed mice was greatly reduced at the end of the experiment when compared with the value at the start, i.e. median 104% and 21%, at days 0 and 35, respectively.
Implications of a high-fat diet on HOMA-IR, (a) Blood glucose concentrations. (b) Plasma insulin concentrations. (c) HOMA-IR. (d) Insulin sensitivity. (e) β-cell function. (f) Disposition index. White bars: data from day 0; grey bars: data from day 35. The data are presented as median with ranges in a Tukey box plot with outliers represented as black dots. (g) Relationship between glucose and insulin concentrations, represented by triangle: median data point at day 0, 100% insulin sensitivity (dotted line) and 100% β-cell function (solid line). (h) Relationship between β-cell function (%B) and insulin sensitivity (%S). Open circles: 40 individual mice at day 0; closed circles: 20 mice that continued chow diet for 35 days; closed squares: 20 mice receiving a high-fat diet for 35 days. White bars: data from day 0; grey bars: data from day 35. The data are presented as median with ranges in a Tukey box plot with outliers represented as black dots. *P < 0.05 between time points; #P < 0.05 between groups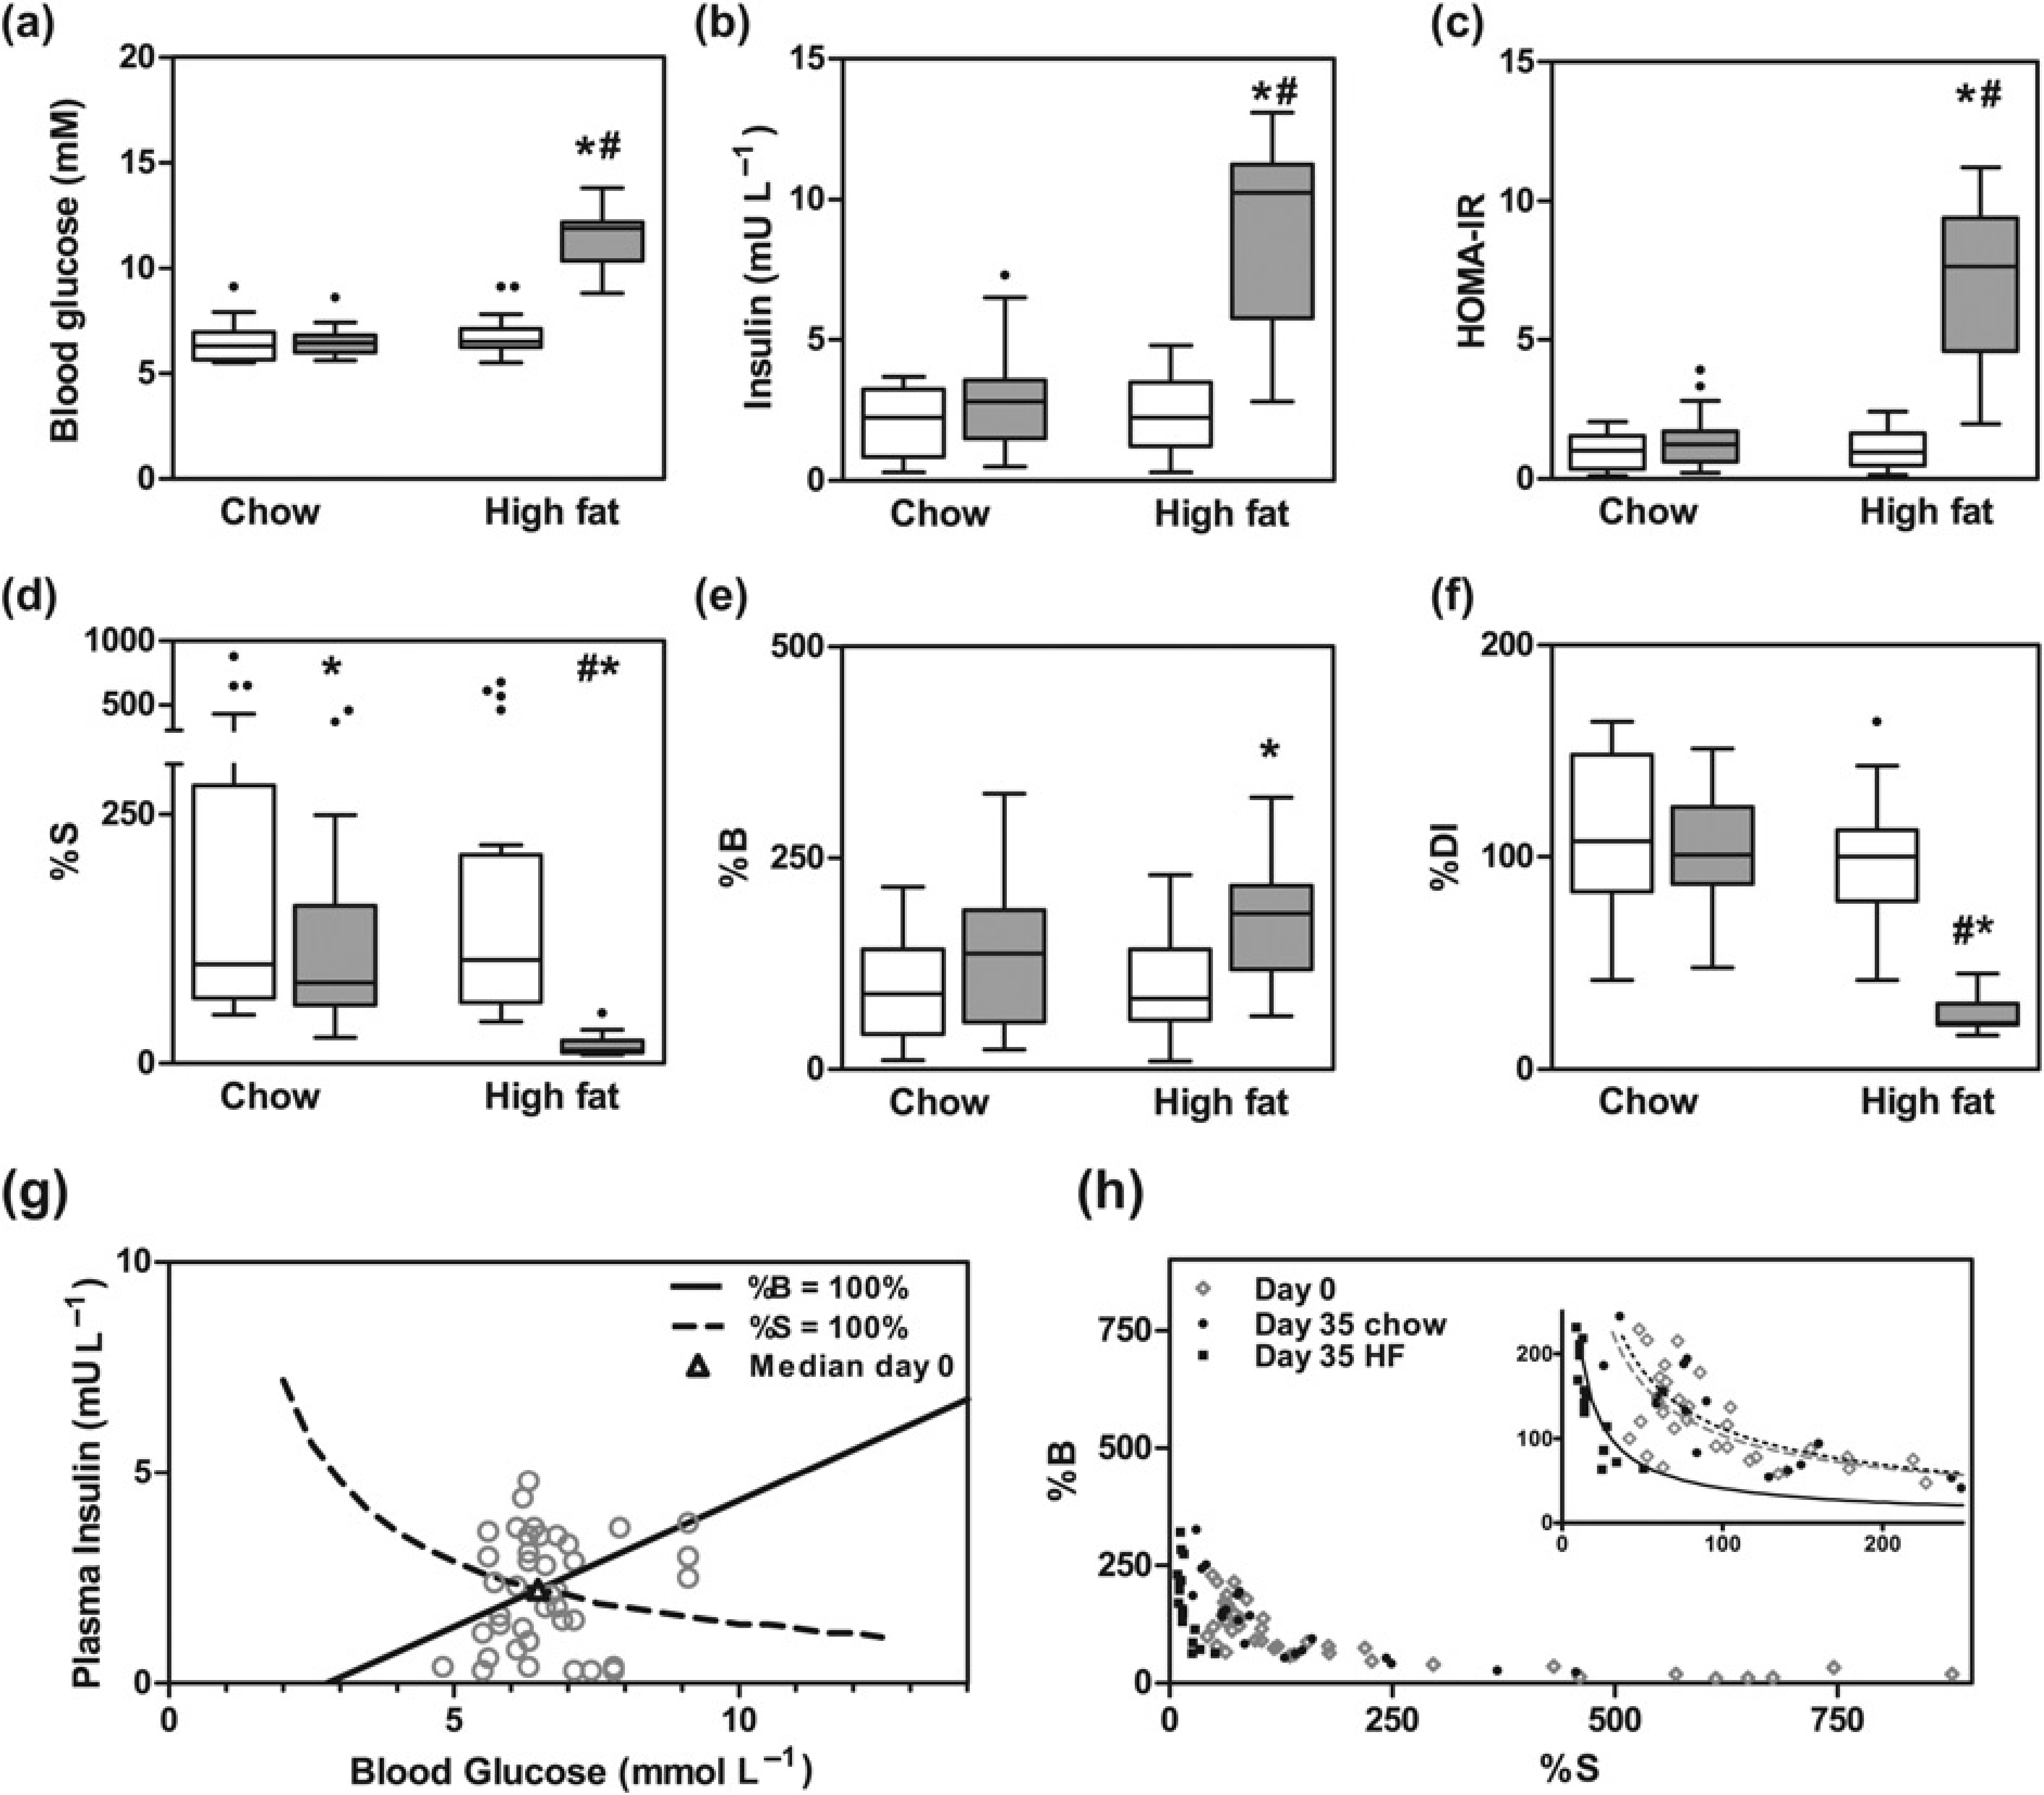
A high-fat diet reduces metabolic clearance rate and apparent volume of distribution of glucose in mice
Glucose kinetics was studied in chow-fed and high-fat fed mice at the start and end of the experiment (Figure 3). Chow-fed mice slightly gained bodyweight over time, from 25.3 ± 1.1 g at the start of the experiment to 28.0± 1.7 g at day 35. Mice fed on a high-fat diet showed a more pronounced increase in bodyweight, i.e. from 25.2 ± 1.1 to 31.0 ± 2.3 g. The increase in bodyweight of the mice over time in combination with an identical amount of administered tracer resulted in a significantly lower dose of tracer per kg bodyweight on day 35 compared with day 0 for both groups (Figure 3a).
Multiple parameters calculated by tracer kinetics, From the tracer kinetics the following parameters were calculated by the equations described in Table 1 from which median and ranges are depicted in a Tukey's box plot, with outliers represented as black dots. (a) The administered dose [D], (b) bioavailability [F], (c) area under the curve [AUC], (d) clearance of the tracer [MCR], (e) elimination rate [kel], (f) apparent volume of distribution [V], (g) turnover rate [Ra] (HGP) and (h) pool size [A] from mice on a chow diet or high-fat diet are shown with white bars representing day 0 and grey bars after 35 days of diet. *P < 0.05 between time points; #P < 0.05 between groups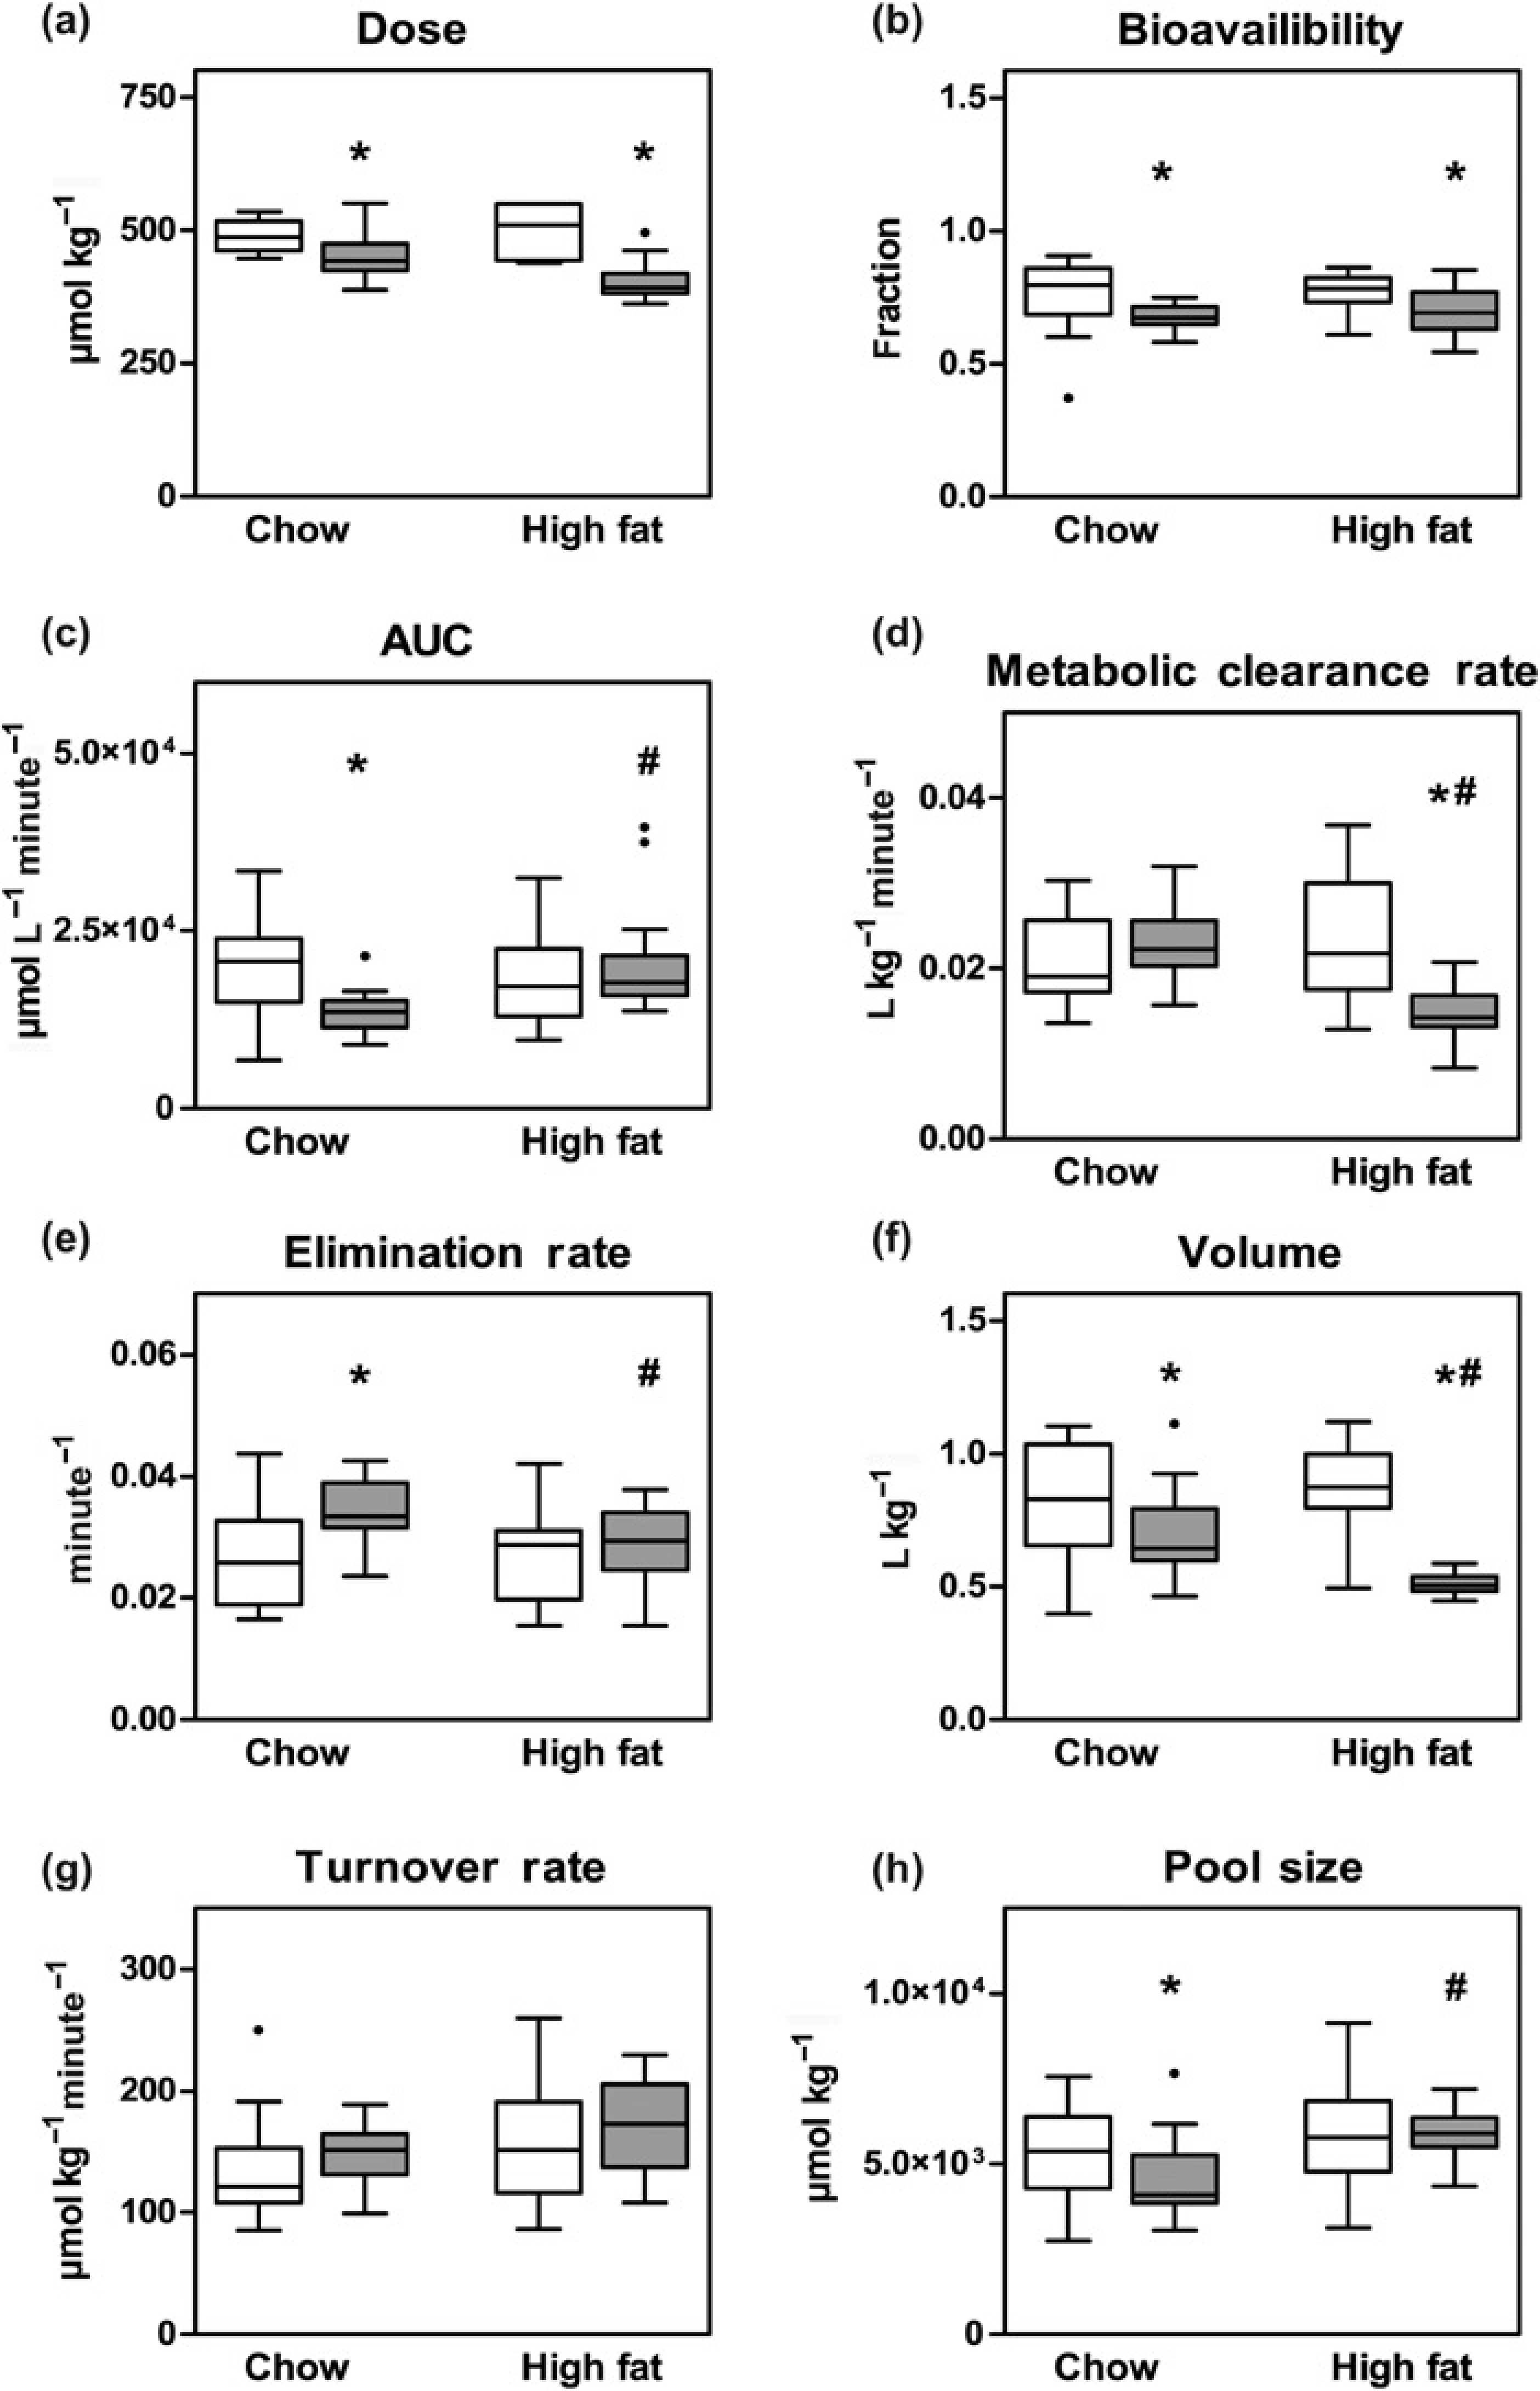
Metabolic clearance of glucose (MCR), i.e. the volume of blood completely cleared from glucose in by peripheral tissue, i.e. muscle, brain and adipose tissue, is an important parameter in blood glucose kinetics. Equation (5) from Table 1 shows that MCR depends on the dose D(D2glc) of
According to Eq. 6 from Table 1, the apparent volume in which glucose is distributed (V) depends on the MCR of glucose and the elimination rate kel (Figure 3e). After 35 days of chow diet median kel was significantly increased from 0.026 to 0.033 min–1, yet, kel remained unchanged in the high-fat fed group over the same period of time. The apparent volume of distribution V (Figure 3f) was slightly decreased after 35 days in the chow-fed group, i.e. from median 0.83 to 0.64 L kg–1. However, in the high-fat fed group, V was more reduced, i.e. from 0.87 to 0.50 L kg–1.
Other relevant parameters in blood glucose kinetics, i.e. rate of appearance which equals the turnover rate (Ra) and pool size (A) were calculated according to Eqs 7, 8 (Table 1), respectively (Figures 3g and h). Although Ra was slightly increased on day 35 in both groups, no significant difference was observed between either group or time point. Since the mice were fasted prior to the study of glucose kinetics, the turnover rate of glucose equals the endogenous glucose production by the liver, which implicated that high-fat diet feeding did not alter hepatic glucose production. The pool size was slightly reduced in chow-fed mice after 35 days, while there were no differences in mice fed a high-fat diet.
HOMA-IR and glucose kinetics
Matsuda et al.
24
and Faerch et al.
25
presented arguments to merge certain kinetic parameter of whole body glucose metabolism with the HOMA-IR such that changes in tissue-specific insulin sensitivity can be evaluated. In their discussion the authors related insulin concentrations to the endogenous glucose production Ra to evaluate hepatic insulin sensitivity (%H, Eq. 10, Table 1). In fasted mice the turnover of glucose (Ra) in the circulation equals the hepatic glucose production. Peripheral insulin sensitivity (%P, Eq. 11, Table 1) is reflected by the relation between MCR and insulin concentration. Since both turnover and MCR can be derived from the data of the wash-out of Implications of a high-fat diet on insulin-related glucose kinetics, (a). Hepatic insulin sensitivity (%H). (b) Peripheral insulin sensitivity (%P). White bars: day 0; grey bars: day 3. The data are presented in a Tukey box plot, with outliers represented as black dots. *P < 0.05 between time points; #P < 0.05 between groups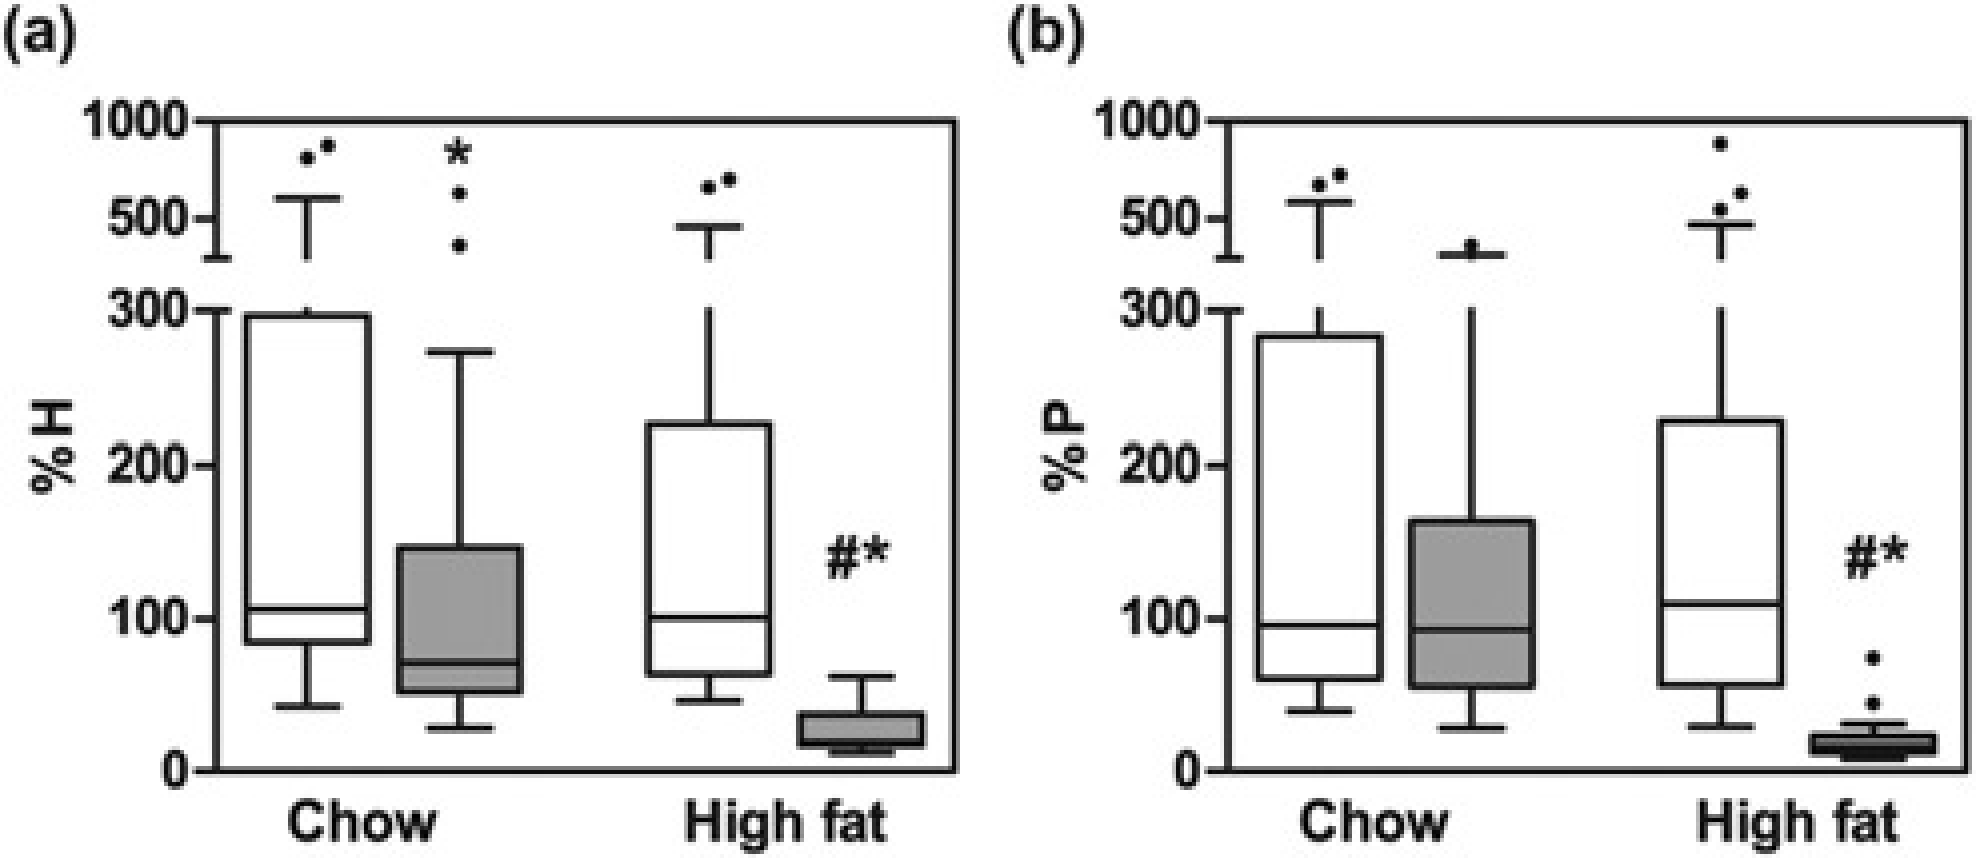
Discussion
In this paper, we present a novel approach to assess interorgan relationships determining insulin and glucose action in small laboratory animals. The approach is a combination of the application of HOMA-IR to assess insulin resistance and analysis of a glucose tracer wash-out by a single-pool, first-order kinetic model to assess whole body glucose metabolism. The merging of both methods makes evaluation of tissue-specific insulin sensitivity possible at prevailing insulin and glucose concentration in a fasted steady-state condition. By collecting bloodspots on filter paper by tail tip bleeding, this approach allows for sequential application in individual mice in order to document time-dependent changes in insulin action and whole body glucose metabolism in small laboratory animals.
The approach starts with an intraperitoneal injection of 2 mg
In total, about 120 μL of blood was drawn per animal during the experiment. This very small volume of blood drawn is an important refinement in mice studies, compared with, for instance, Pacini et al. 17 who collected as much as 525 μL during a comparable experiment. In addition, our novel procedure can be repeated (within limits of time) in the same animal and therefore reduces the number of animals needed to study effects of different dietary protocols and pharmacological treatments. The validity of the single-compartment kinetic model used to calculate glucose kinetics was established by applying a two-compartment model to the data. A very similar fit to the data was obtained, with no significant differences in the residual error (data not shown). This confirmed our hypothesis that the analysis of the wash-out of labelled glucose from the circulation by a single-compartment first-order kinetic model was valid under conditions that insulin and glucose concentrations were not changed by the application of the labelled glucose. Matthews et al. 10 presented a model to access insulin action for humans, but the model parameters they derived are only applicable for humans. In mice a new set of parameters needed to be established. To do so, we assumed that all data measured and calculated at the start of the experiment in young, wild-type, chow fed mice reflects 100% insulin sensitivity and β-cell function. Subsequently, model parameters for insulin sensitivity and β-cell function could be calculated.27,28 To calculate hepatic insulin sensitivity (%H) we used the product of endogenous glucose production and plasma insulin level as presented by Matsuda et al., 24 as discussed by Faerch et al., 25 and for peripheral insulin sensitivity (%P) the ratio of clearance rate and plasma insulin level was used. Note that the values given in this study adapting the HOMA-IR for use in mice is only applicable for mice of this particular mouse strain, in which glucose and insulin concentration are measured using the same methods.
We investigated the performance of our approach in a large group of young C57BL/6J mice at the start and after a period of 5 weeks in which they received either a high-fat diet or continued their habitual chow diet. It is well-known that feeding mice a high-fat diet induces insulin resistance. 29 An important observation was that in young mice on a chow diet (day 0) fasting insulin concentrations vary highly in combination with almost identical blood glucose concentrations, indicating that insulin plays a minor role in regulation of glucose homeostasis under fasting conditions. Thus other hormones, like glucagon might be more important in regulation of glucose homeostasis during fasting. The broad range in fasted insulin concentrations resulted in large ranges in the calculated overall and tissue-specific insulin sensitivities, i.e. %S, %H and %P. High-fat feeding significantly increased both fasting insulin and glucose concentrations, resulting in an increased HOMA-IR, a decreased disposition index (%DI) and a reduction in all three insulin sensitivity indices, i.e. overall insulin sensitivity (%S), hepatic insulin sensitivity (%H) and peripheral insulin sensitivity (%P). In contrast, the animals that continued the chow diet over the same period showed hardly any changes in fasting glucose and insulin levels, resulting in no changes in %S and %P and only a minor reduction in %H.
Using a completely different approach to evaluate insulin sensitivity by hyperinsulinemic–euglycaemic clamp, we have previously shown that feeding mice the same high-fat diet as used in this study resulted in peripheral insulin resistance accompanied by a reduced disposal of glucose by 40%, 30 similar to that seen in this study (see values for MCR in Figure 2d). It should be realized, however, when comparing HIEC and the combined HOMA-glucose kinetic models that during HIEC supraphysiological concentrations of insulin were applied, while for the HOMA-glucose kinetic model the measurements were done under prevailing concentrations of insulin. The Ra remained unchanged over time in both groups. The calculated turnover rate (which during fasting equals hepatic glucose production) and MCR were in the same order of magnitude when calculated by Mass Isotopologue Distribution Analysis as previously published,15,31,32 and thus show the validity of the presented kinetic analysis of the wash-out of stable isotopic labelled glucose after injection of a tracer amount.
The median apparent volume of distribution of 0.67 L kg–1 calculated on day 0 was higher than the extracellular fluid volume (0.22 L kg–1) often used in non-steady-state calculations33,34 implicating that intracellular fluid volume is involved in the distribution of the administered glucose. High-fat feeding reduced this volume to 0.46 L kg–1, most likely the result of a reduction in involvement of intracellular volume. The effect of high-fat feeding on the apparent distribution volume of glucose has not been reported before, although it is known that high-fat feeding reduces GLUT4 concentration and translocation form intracellular stores to the plasma membrane.35–37 Furthermore, high-fat feeding impairs central insulin stimulation of blood flow, 38 adding to the already perturbed glucose disposal in peripheral tissue and therefore in a reduced volume of distribution.
In conclusion, we describe a refined approach to evaluate blood glucose metabolism with a minimum level of inconvenience to the mice, which can be used in longitudinal studies in individual mice. This represents an opportunity for a major reduction in the number of animals necessary for these metabolic studies. It combines known protocols for calculation of insulin sensitivity and blood glucose kinetics under basal situations and can be repeated over time. In our view, the single pool kinetic analysis of intraperitoneally injected
Footnotes
Acknowledgements
This research was performed within the framework of project TI-106 of the Dutch Top Institute Pharma. We thank Gijs de Besten for skillful technical assistance.