
Abstract
Systematic instruction and video modeling are evidence-based practices for teaching academic skills to students with intellectual disabilities; however, its efficacy has not been established for teaching graphing skills in a small-group setting. Three elementary school students with hearing and intellectual disabilities were taught to describe graphs and compare their differences in a math class at a special needs school using systematic instruction and video modeling. The effectiveness was evaluated using a multiple-baseline across participants’ design. The results showed an increase in correct response rates after the intervention, with similar levels of correct response rates in the probe and graphing based on tables phases. A functional relation was demonstrated between systematic instruction and video modeling and graphing behaviors.
Keywords
In Japan, approximately 10% of deaf students with intellectual disabilities are enrolled in special needs schools for the deaf (Zenkoku tokubetsushiengakkochokai [National Association of Principals of Special-Needs Schools Japan], 2019). Japan’s national curriculum has subjects specifically for children with intellectual disabilities (intellectual disability subjects). Deaf students with intellectual disabilities learn these intellectual disability subjects in special needs schools for the deaf (Ministry of Education, Culture, Sports, Science, and Technology [MEXT], 2018). The goals and content of intellectual disability subjects are structured based on the characteristics of intellectual disabilities. The subjects are set up based on stage levels rather than grades. In the intellectual disability subjects for elementary school, there are three levels: Level 1 is for students who need constant prompting in their daily lives, Level 2 is for students who need frequent prompting in their daily lives, and Level 3 is for students who need occasional prompting in their daily lives.
In Level 1, the content of elementary math in the intellectual disability subjects consists of “Basics of Quantity,” “Numbers and Calculation,” “Shapes,” and “Measurement.” The content for Levels 2 and 3 includes “Number and Calculation,” “Shapes,” “Measurement,” and “Use of Data.” In Japan’s current national curriculum, math for students with intellectual disabilities emphasizes thinking and logical expression using concrete objects, diagrams, words, numbers, equations, tables, and graphs to foster the ability to think, judge, and express themselves (MEXT, 2018). Among these, the study of tables and graphs leads to an ability to compare numbers and analyze data trends. The content of “Use of Data” in Level 3 includes representing, comparing, and reading data by replacing them with simple symbols and comparing the data graphically. Therefore, there is a great need in Japan to examine methods of teaching graphing skills to children with intellectual disabilities to conduct effective classes on the use of data.
Systematic instruction is an effective method for teaching academic skills to students with intellectual disabilities (Spooner et al., 2019). Systematic instruction is a method based on behavior analysis and used to teach academic and social skills to students with disabilities. It includes the specification and task analysis of instructional goals, prompting and reinforcement (prompting strategies), progress monitoring based on behavior records, and a review of instructional procedures (Collins, 2012). For instance, Root et al. (2019) successfully taught graph-reading skills to three children with severe cognitive impairment through systematic instruction and the use of an iPad.
Most of the studies that have used systematic instruction to teach academic skills to students with intellectual disabilities were conducted in a one-to-one setting (Browder et al., 2018; Root et al., 2020). The application of systematic instruction in Japanese special needs schools will require a verification of its applicability in small-group settings. In Japanese special needs schools, academic instruction is often provided in small groups of three to six students. In the elementary grades of Japanese special needs schools, the average number of students is 3.7 per class (National Association of Principals of Special-Needs Schools Japan, 2019); one to two teachers are assigned to each class. In small-group settings, teachers have a limited ability to provide individual prompts and reinforcement to students, and additional instructional elements are considered necessary.
One instructional approach that can be easily applied in small-group settings is video modeling. Video modeling is a method in which the target children watch a video recording of themselves performing a target behavior. The children are then prompted to perform the target behavior they saw in the video (Alberto et al., 2005). Video modeling has also been applied to math instruction for students with intellectual disabilities. Burton et al. (2013) used video modeling and a token economy to teach students with intellectual disabilities and autism spectrum disorders a seven-step payment and change calculation. They evaluated its effectiveness using a multiple-baseline across participants design. The results showed that all the students increased their correct response rates after the intervention and maintained their results in follow-up tests.
One advantage of video modeling is that it can be easily applied to small-group settings because the target students can watch the videos with only verbal instructions from their teacher if they can operate the equipment. Other advantages of video modeling include the ability to teach various skills in a time-efficient manner (Mechling, 2005). Charlop-Christy et al. (2000) compared the effects of live and video modeling on social behaviors in five children with intellectual disabilities and autism spectrum disorder. Their results showed that four of the five children acquired the target skills in a shorter time and at a lower cost by using video modeling. In addition, video modeling is more likely to attract the attention of students with attention and concentration difficulties because it is presented on a screen with a defined scope and it is possible to avoid extraneous stimuli when shooting videos (Charlop-Christy et al., 2000). Furthermore, video modeling mainly consists of visual information, and if imitation behavior is established, it may be effective for deaf students with intellectual disabilities.
As described above, video modeling can be applied to children with multiple disabilities in small-group settings using systematic and graphing instructions. However, there are no studies in the literature that have examined the effectiveness of video modeling in teaching graphing skills in a small-group setting to students with both intellectual and hearing disabilities. In this study, three elementary school students with both hearing and intellectual disabilities were taught to describe graphs and compare their differences in a math class at a special needs school using systematic instruction and video modeling. Effectiveness was evaluated based on the students’ graphing skills using a multiple-baseline across participants design.
Method
Participants
Three fourth-grade students participated in this study. All the students were Japanese, enrolled in a special needs elementary school for the deaf, and were proficient in Level 3 intellectual disability subjects. They could read and write hiragana and kanji (Japanese writing scripts) learned in the first grade, chant numbers up to 100, and compare the size of single-digit numbers.
Taro (pseudonym) was 10 years 3 months old at the beginning of this study. He had coloboma, heart disease, atresia of the choanae, retarded growth and mental development, genital anomalies, ear malformations, hearing loss syndrome, and severe intellectual disability. His hearing when wearing his hearing aids was over 90 db in both ears. His social life age on the Social Maturity Scale (3rd ed., Japanese) was 7 years and 1 month. This Japanese assessment calculates the average scores for the sub-items of self-help, locomotion, occupation, communication, socialization, self-direction, and total social life age. Taro used Japanese sign language as a mode of communication, not speech. He was able to perform three-digit written calculations with carry-overs, compare concrete objects side by side, and judge how much is more or less. He sometimes spontaneously asked teachers during breaks to conduct a survey about their hometown but did not compare the results of the survey. He never looked away or left his seat during class and was able to pay attention and respond to the teacher’s explanations and questions. Once he made a mistake or received a reprimand, he would repeat the same mistake.
Jiro (pseudonym) was 9 years and 7 months old at the beginning of this study. He had a paralysis in the left hemisphere of his brain and severe intellectual disability. He had cochlear implants in both ears, and his hearing was 31.3 db in the right ear and 32.5 db in the left ear. His social life age according to the Social Maturity Scale was 5 years and 2 months. He used spoken Japanese as his primary mode of communication with supplementary sign language. He was able to perform two-digit strokes with and without carry-overs. He rarely left his seat during class, but often looked away, and required individual attention and direction from teachers. He had difficulty focusing his attention; for example, if there was a sound that he could hear while a teacher was modeling the task, his attention was diverted to that sound.
Hanako (pseudonym) was 9 years 7 months old at the beginning of this study. She also had hearing and intellectual disabilities. Her hearing when wearing her hearing aids was 41 db in the right ear and 39 db in the left ear. Her social life age on the Social Maturity Scale was 6 years and 1 month. She used sign language as her primary mode of communication, and sometimes used speech. She was able to do two-digit written work with forward and backward carry-overs. She would often look away or leave her seat during class to approach an object of interest, which required individual attention and direction from teachers. She had difficulty focusing her attention; for example, if there was a sound that she could hear while the teacher was modeling a task, her attention seemed to be diverted to that sound.
Setting
The first author taught elementary math in a special needs school about twice a week. Each session was video-recorded. The first author used sign and spoken language in all the sessions. Each class session lasted 50 min, with approximately 15 min of instruction in this study. The students thought of themes and items they would like to ask their families about, and then each family was asked to complete a questionnaire.
Measurement
Student Responses
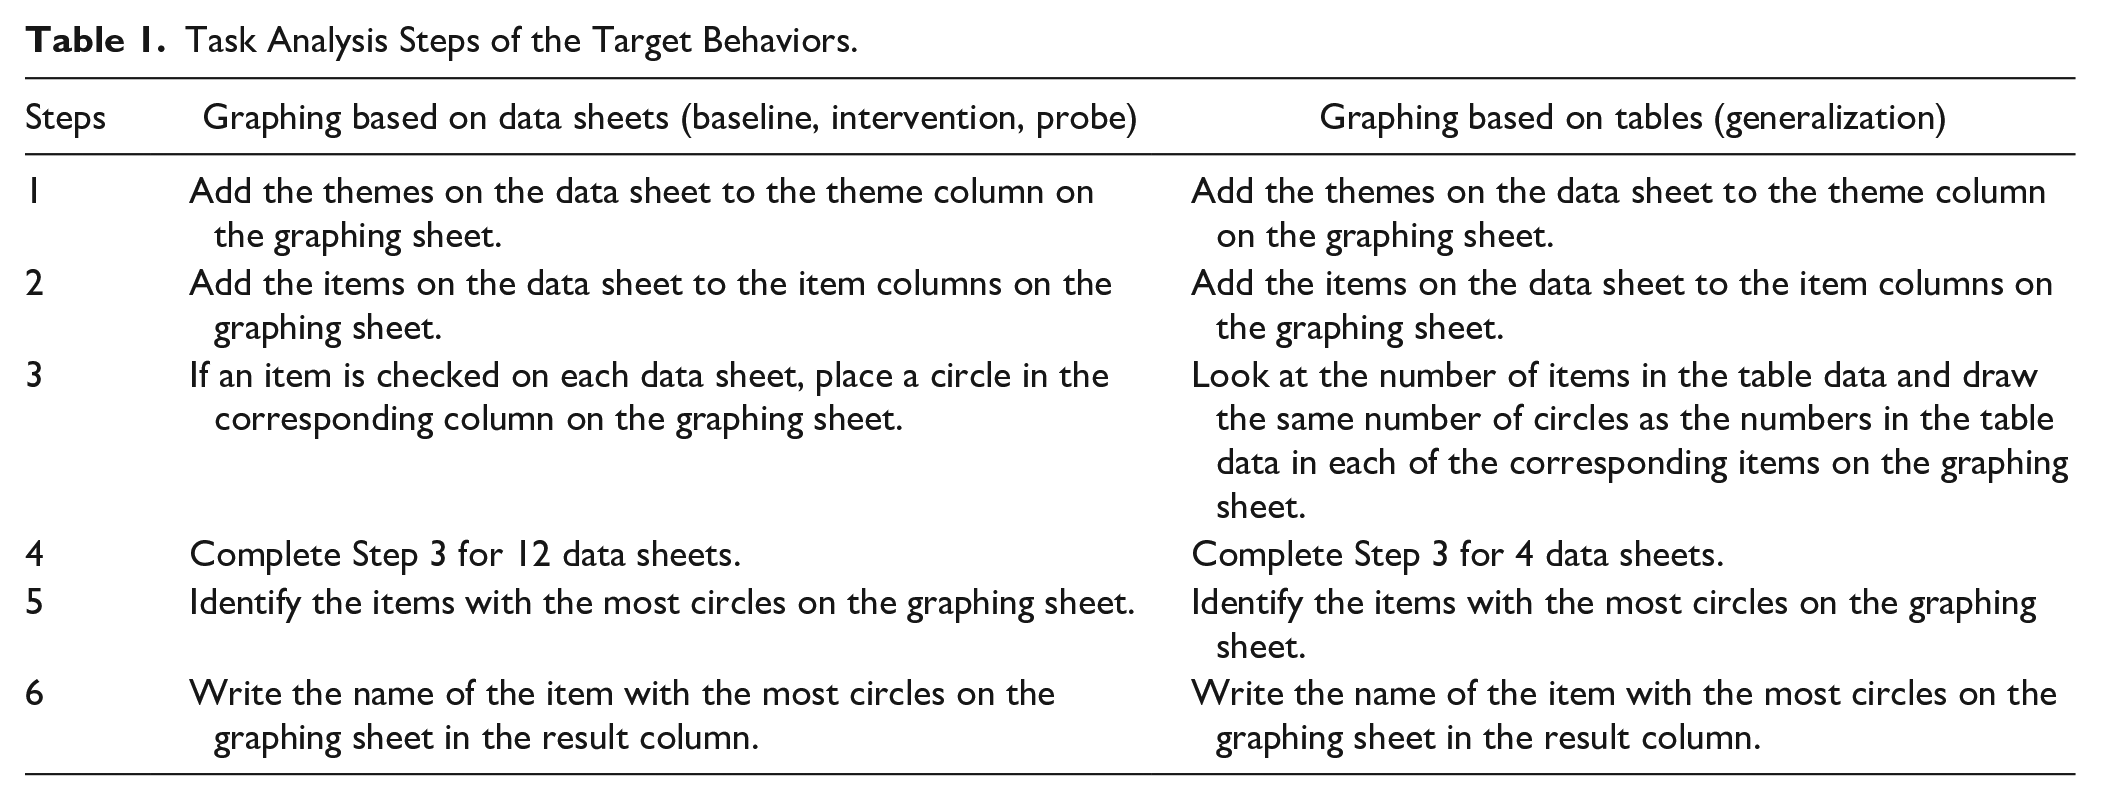
The dependent variable was the percentage of correct responses for the behavior step of the student’s task-analyzed graphing behavior. The first author recorded the student’s responses in all the sessions using a per-trial sheet. Student responses were scored as correct, incorrect, or no response. The number of correct steps was divided by the total number of steps and then multiplied by 100 to compute the percentage of correct responses. Table 1 summarizes the steps of the target behavior analysis.
Task Analysis Steps of the Target Behaviors.
Social Validity
At the end of the study, two teachers who were not involved in the study were asked to watch all the session videos and evaluate the social validity of the target behaviors, procedures, results, and teacher burden in the lesson preparation. Teachers were given a questionnaire with seven evaluation items. Each item on the questionnaire was answered on a 5-point scale (1 = not at all applicable to 5 = very applicable).
Reliability
Inter-observer agreement (IOA) between the two researchers was obtained for 33% of the sessions across all phases. IOA assessments were calculated by dividing the number of agreements by the number of agreements plus disagreements, and then multiplying by 100. The first author served as the study’s main data coder; the secondary coder had a degree in special education and was trained in applied behavior analysis. The mean IOA between the two researchers was 100%.
Design
A multiple-baseline across participants’ design was used to evaluate the effects of systematic instruction and video modeling on students’ graphing skills. The interventions were conducted during the third to the fifth sessions, in the following order: Taro, Jiro, and Hanako. If the percentage of correct responses exceeded 80% for four consecutive sessions after the intervention, the students were presented with the probe condition.
Materials
All the sessions used graphing sheets with columns for describing themes, graphs, items, and conclusions. The name of the item with the highest number of data was written in the column for describing the conclusion on the graphing sheet (see Figure 1). Completing this sheet was the study’s target behavior.
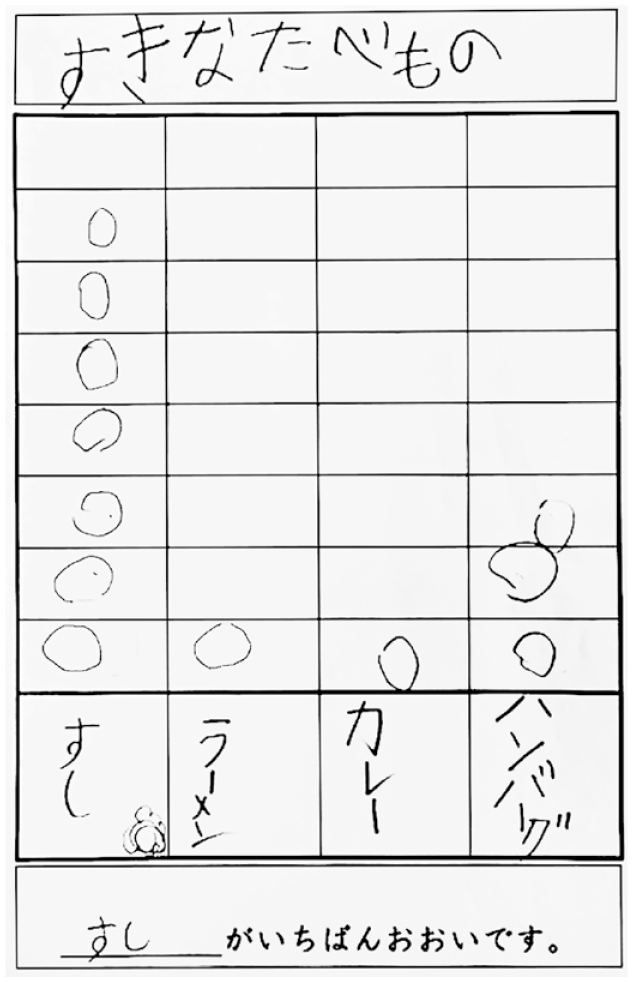
Sample of the graphing sheet (Japanese).
Data sheets were used to draw raised graphs at all the sessions. In the baseline, intervention, and probe sessions, four items were described. In subsequent sessions, table data sheets were used.
The video used for the intervention was approximately 3 min long and viewed on an iPad. Only the hand of the person performing the target skills was shown, and an explanation of each behavior step was presented in audio and simple sign language.
Procedures
Baseline
At the beginning of each session, the first author said to the students, Today, we are going to give you a test. I will not tell you the answers nor will you look at your friends’ answers. Please think for yourself. If you don’t know the answer, you don’t have to write it down.
After that, the first author handed out a graphing sheet and 12 data sheets and posted the graphing sheet on the blackboard. The theme of the graph was about favorite things, with different subjects for each class (e.g., favorite foods in Session 1, favorite places in Session 2).
When instructing the students to perform each step, the first author pointed to a predetermined spot on the graph sheet posted on the blackboard. For instance, in Step 1, the first author pointed to the theme column and said, “Please write your theme. When you have finished writing, give me your graphing sheet.” If a student remained unresponsive for approximately 30 s after receiving the verbal instruction, the student was re-instructed. The graph sheets were collected approximately 2 min after the verbal instructions were given. If the answer was correct, graph sheets were returned to the students. If there was no answer or an incorrect answer, the first author wrote down the correct answer before returning it to the students so that they could proceed to the next step. The above procedures were followed at each step, and the students were praised at the end of each step.
Intervention
Each student was given an iPad and instructed verbally to watch the video. After viewing the video, each student was given graphing and data sheets and instructed verbally to create a graph. In Session 3, while Taro was watching the video, a partition was placed between Jiro, Hanako, and Taro so that Jiro and Hanako’s attention could not be diverted to the video; Jiro and Hanako were given supplementary instruction on a different task. For Session 4, partitions were set up between Taro, Jiro, and Hanako while Taro and Jiro watched the video; Hanako was given supplementary instruction.
The first author made desk-to-desk observations during each student’s graphing task and gave verbal praise when the student answered a step correctly. When Taro gave a wrong answer or showed no response, the first author first gave an indirect verbal instruction (e.g., “What is it?”), and if Taro still could not give a correct answer, the first author instructed the response directly. When Jiro or Hanako gave a wrong answer or showed no response, the first author also instructed the response directly. The students were praised at the end of all the steps as well as during baseline sessions. The theme of the graph was different each time, as was the baseline.
Probe
Before the class, each student thought of themes and items that they wanted to ask their families and conducted a questionnaire with each family. Graphs were created based on the questionnaire data. Prompts were not presented when the students gave an incorrect answer or no response at each step. Otherwise, the procedure was the same as for the baseline.
Graphing Based on Tables
Instead of 12 questionnaires, as in previous sessions, the teacher compiled a single tabular data sheet based on the questionnaires collected by the students and gave the data sheet to the students in class. The students were given their data on a single table data sheet. Otherwise, the procedure was the same as for the probe.
Results
The percentage of correct responses to the target behaviors of the students is shown in Figure 2. Also, the results of the Task Analysis Steps for Target Behavior in Each Student are shown in Figure 3. Taro responded correctly to the step “Transcribe the items on the data sheet into the item column” for two consecutive sessions in the baseline phase. However, he did not respond correctly to most of the other steps, and his correct response rate was below 50% in both sessions. Taro also began to complain as the incorrect responses continued, so the baseline was ended after both sessions. When the intervention was initiated, Taro was able to show a 100% positive response rate for two consecutive sessions. In the fifth session, he gave an incorrect response for double counting in Step 4 but was able to correct himself after receiving verbal instructions. During the probe phase, he had a 100% correct response rate for two consecutive sessions. In Session 5, he had a 100% correct response rate for two consecutive sessions. During the graphing based on tables phase, he had a 100% correct response rate. After the completion of this instruction, he was observed surveying several teachers during recess (“What is your favorite fruit?”) and then drawing a stacked graph of the results.
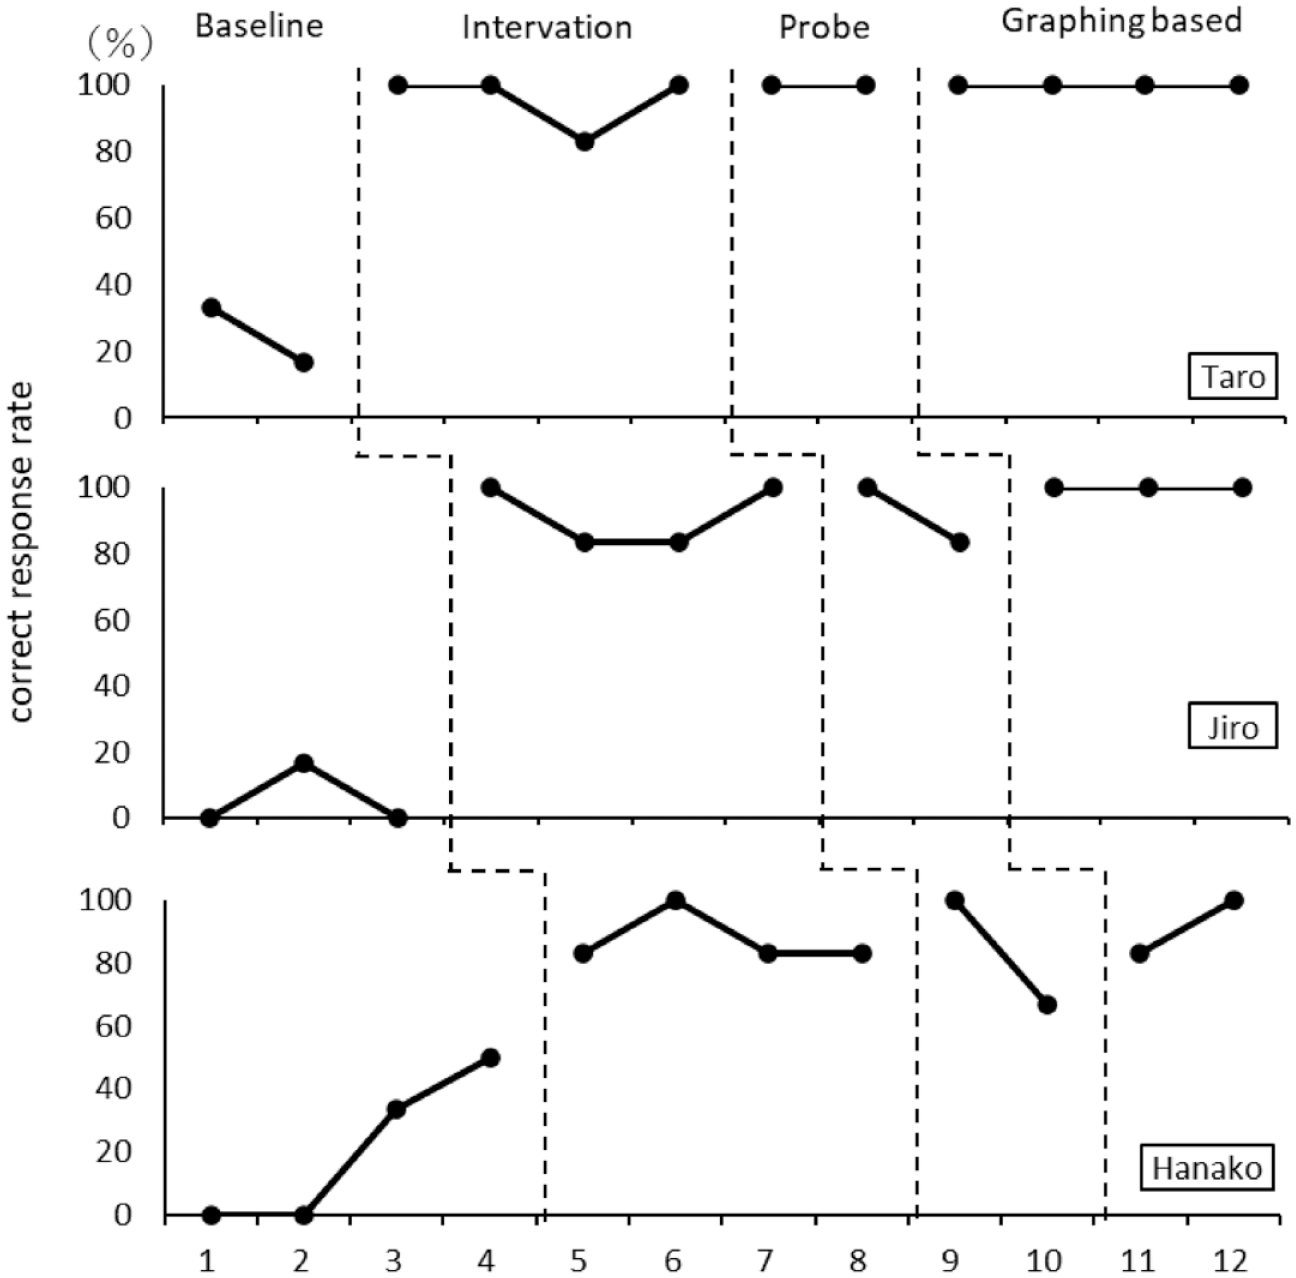
Correct response rates of task analysis on target behaviors across three students for baseline; intervention, probe, and graphing based on tables phase.
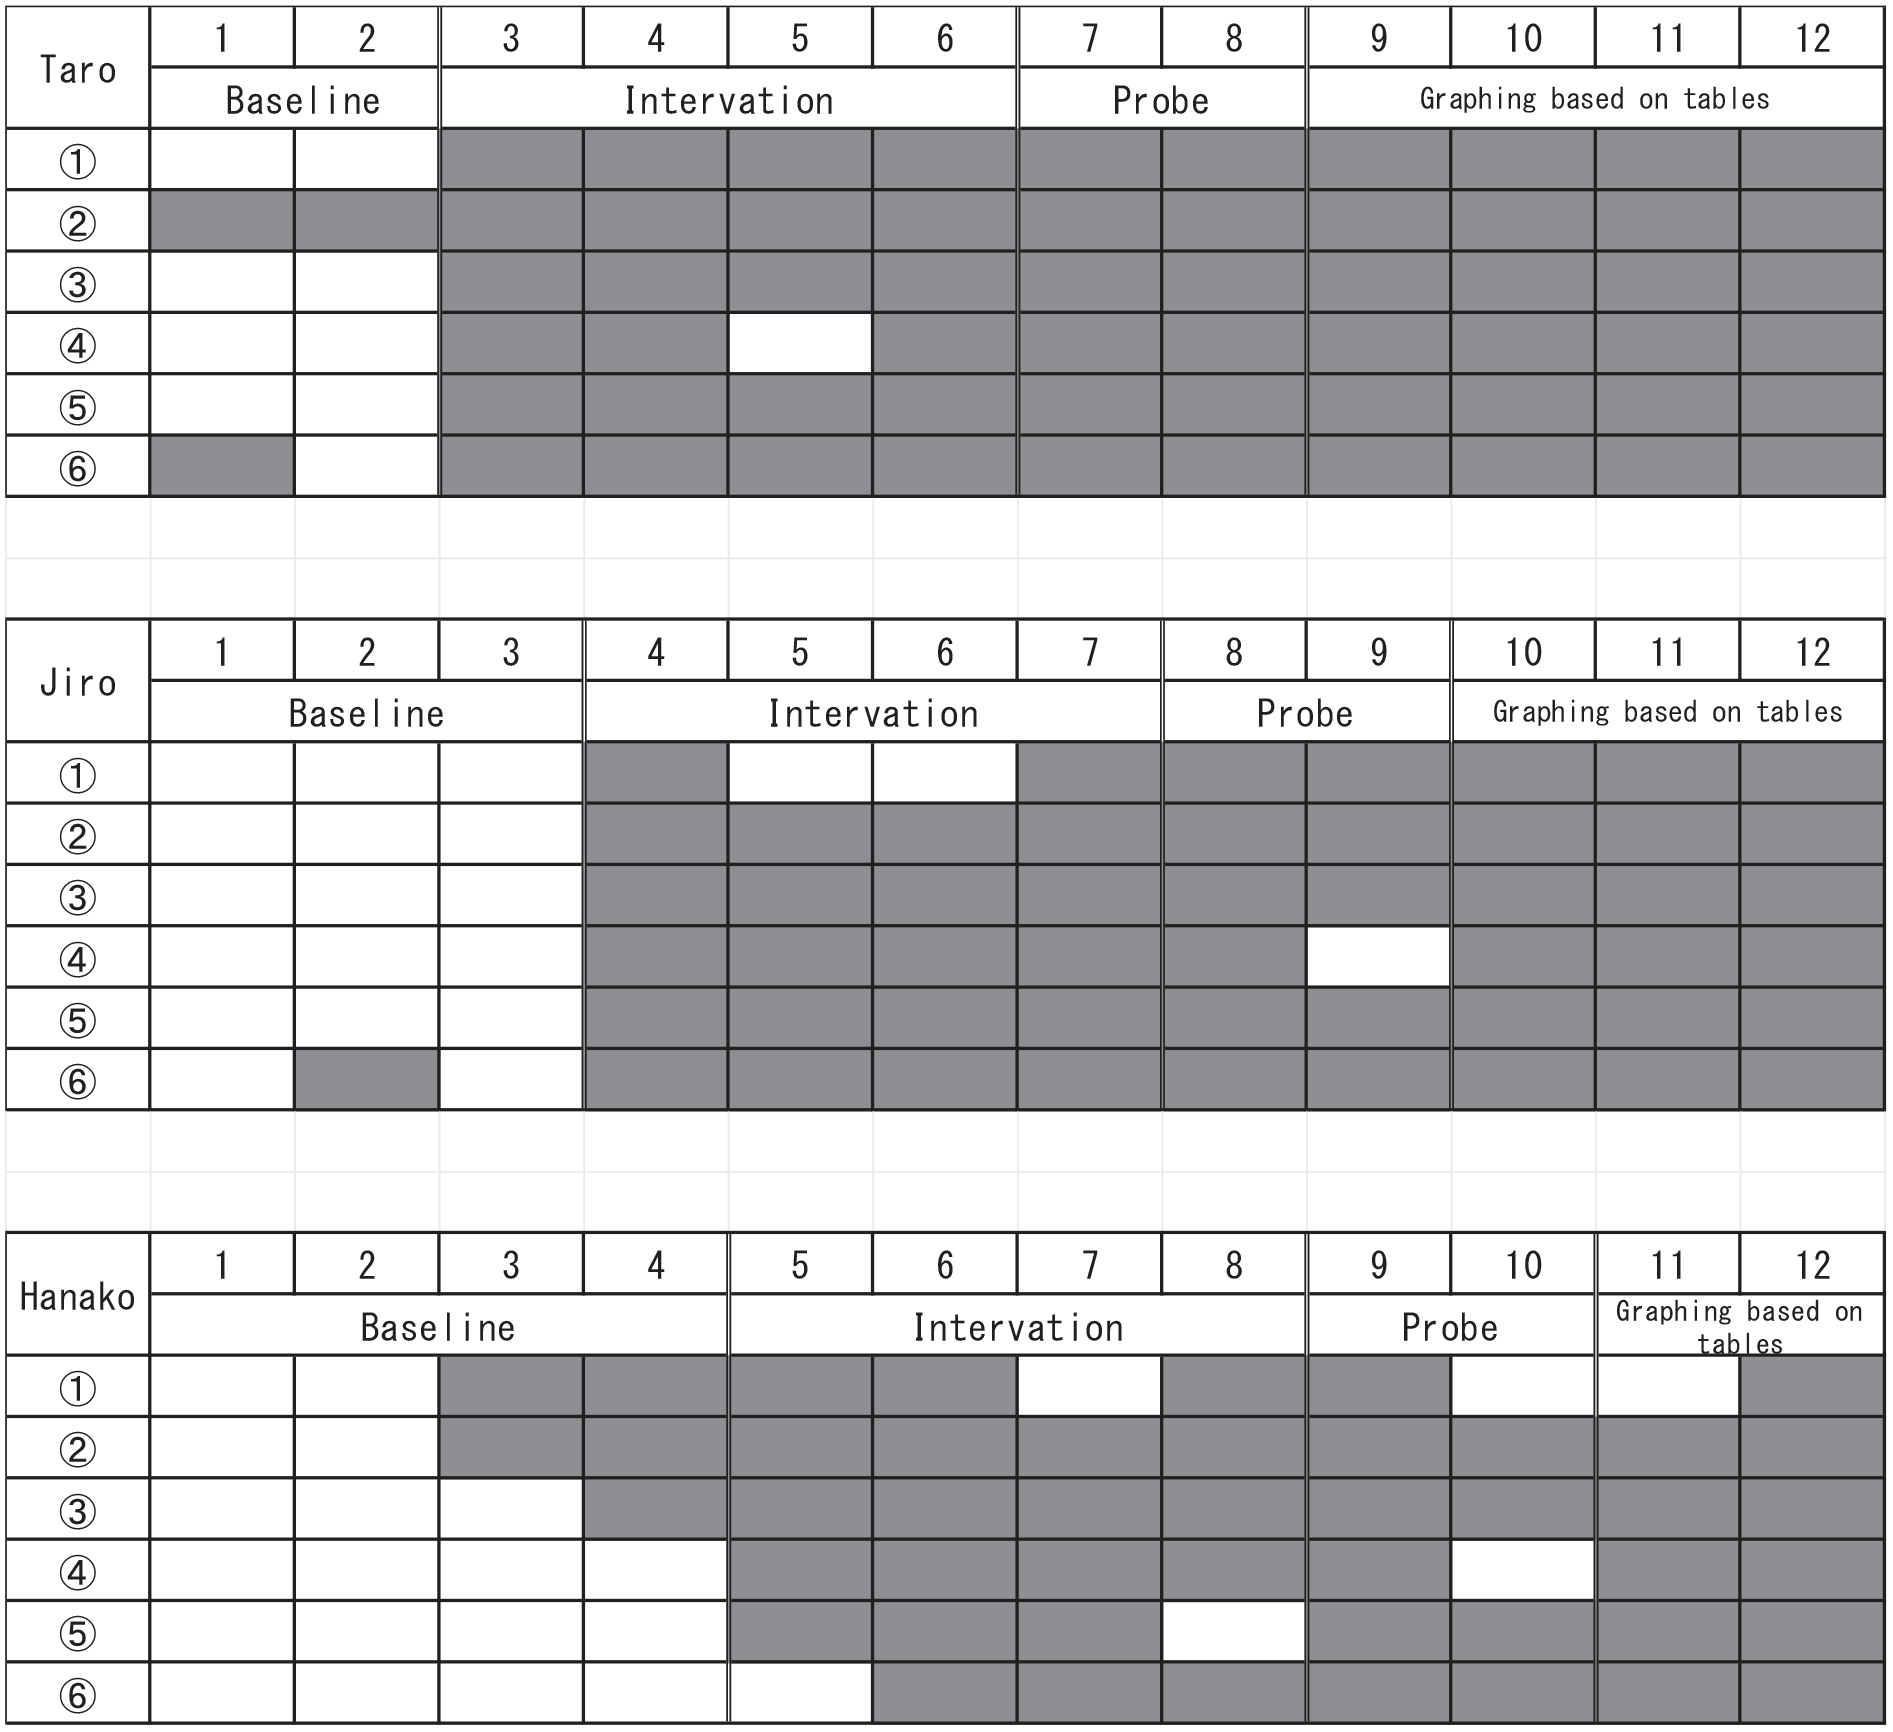
Results of the task analysis steps for target behavior in each student.
During the baseline phase, Jiro responded correctly only to Step 6 in Session 2, either responded incorrectly or did not respond to all the other steps, and required individualized verbal instruction. After the intervention, Jiro responded correctly to all the steps in Sessions 4 and 7. In Sessions 5 and 6, he made a mistake in Step 1 due to a typographical error, but when he was given verbal instructions while pointing out the incorrect part, he corrected it himself. In the probe phase, he had a count omission in Step 4 of Session 9, but otherwise responded spontaneously and correctly. During the graphing based on tables phase, he had a 100% correct response rate.
Hanako’s response rate showed an increasing trend in correct response rates in the baseline condition, with correct responses to Steps 1 and 2 in Session 3, and Steps 1, 2, and 3 in Session 4. However, as the baseline session progressed, Hanako began to exhibit more problematic behaviors, such as not paying attention to verbal instructions and diverting her attention to the hallway and postings. When the intervention phase was initiated, she had a 100% correct response rate in Session 6. In Session 7, she had an incorrect response because of a typo in Step 1. In Session 8, she was rated nonresponsive for one step that was not filled in. In the probe phase, she had a 100% correct response rate in Session 9. In Session 10, she had an incorrect response to Step 1 due to a typo and to Step 4 due to double counting. During graphing based on tables phase, she showed an incorrect response in Step 1 due to a typo, but all other steps showed correct responses.
Social Validity
The results of the social validity assessment showed that both teachers rated the target behaviors, intervention procedures, and results of this study as highly socially valid. On the other hand, both teachers rated the burden on teachers to prepare lessons for this study as “3” based on a five-point evaluation questionnaire.
Discussion
In this study, three students with hearing and intellectual disabilities were taught to describe stacking graphs based on data and compare the degree of comparison in an elementary math class at a special needs school for the deaf. The intervention procedure consisted of video modeling, prompting strategies, and reinforcement. The effectiveness of the intervention was evaluated in terms of changes in each student’s graphing skills. The results indicated that all the children showed an increase in correct response rates after the introduction of the intervention, with similar levels of correct response rates in the probe phase and the graphing based on tables phase. In addition, the results of the social validity evaluation indicated that the intervention procedures were appropriate for students in an elementary math class at a special needs school for the hearing impaired.
This study demonstrates the potential of an intervention package that combines video modeling and prompting strategies for small-group graphing instruction in elementary math courses for children with multiple disabilities. One of the advantages of video modeling is its high cost-effectiveness (Mechling, 2005). The students in this study could operate the equipment and watch videos themselves through verbal instructions in a small-group setting. Jiro and Hanako in particular had difficulty focusing their attention but were able to continue watching video modeling and showed an increase in their correct response rates during the intervention phase.
Studies have noted that video modeling is more likely to capture children’s attention than live modeling because it has a narrower attention span and can be created without extraneous stimuli (Charlop-Christy et al., 2000). In addition, the relatively short duration of the videos (3 min) and their use of both verbal and simple sign language may have helped maintain attentional focus.
As the intervention package in this study consisted of multiple components, such as video modeling, prompting strategies, and reinforcement, it was not possible to examine the effects of individual intervention components on graphing behaviors. However, a previous study showed that video modeling alone did not result in behavioral changes, whereas a combination of prompting strategies and reinforcement did (Kleeberger & Mirenda, 2010). Given the low cost of implementation and receipt in video modeling, prompting strategies, and reinforcement, the application of this study’s intervention package in elementary math classes in a school setting was justified.
All students showed high correct response rates in the graphing-based table phase. This result complements the findings of a study (Borella et al., 2010) that showed that behaviors acquired through video modeling generalized to the novel task. Another factor that contributed to the high correct response rate in the graphing based on tables task phase was the similarity of the instructional stimuli used in the intervention phase and the graphing based on tables task phase (Stokes & Baer, 1977). The materials used in the intervention phase and graphing based on tables task phase were similar except for Steps 3 and 4. It is possible that this commonality facilitated generalization. In addition, in tabular data processing, students were asked to look at a number and fill in the corresponding number of circles; if they understood the correspondence between the numbers, the cost of the behavior was lower than in the intervention phase, where questionnaires were processed one at a time. In the Japanese national curriculum for students with intellectual disabilities, students learn to process questionnaires one at a time and then learn to create graphs from tabular data. The order of tasks in this study was based on the Japanese national curriculum.
Limitations and Implications for Future Research
The limitations of this study include the use of a single-case design with three students, which limits the external validity of the study results. First, future studies could extend the application of this study’s intervention package to additional students and tasks to strengthen its validity. Second, there are problems with the number of baseline data point and trends. Although Taro had only two data points and Hanako’s positive response rates showed an increasing trend in the baseline phase, we decided to introduce an intervention phase because Taro and Hanako began to exhibit problematic behaviors. Therefore, we may not be able to conclude that the intervention procedures were effective for the target behaviors in Taro and Hanako. Some single-case design criteria recommend obtaining at least three points of data at baseline, showing a stable trend, and then conducting an intervention condition (Kratochwill et al., 2013, 2023). On the other hand, several researchers have noted that it is unethical to expose individuals to an extended baseline when behaviors are occurring that are dangerous to participants or others (Harris et al., 2019; Kennedy, 2005). In the future, it will be necessary to test the effectiveness of this intervention procedure on students who exhibit stable task engagement in the baseline condition. Third, maintenance could not be measured because of the annual school schedule. In the future, the effects of this intervention on maintenance should be tested.
Footnotes
Declaration of Conflicting Interests
The author(s) declared no potential conflicts of interest with respect to the research, authorship, and/or publication of this article.
Funding
This work was supported by JSPS KAKENHI Grant No. JP19K14306. The author(s) declared no potential conflicts of interest with respect to the research, authorship, and/or publication of this article.