
Abstract
Objectives
Research on the immigration-crime link has grown substantially yet researchers have not sufficiently considered immigrant heterogeneity, which reflects both the number of immigrant groups in a community and their relative sizes or representation, even as theory has a lot to say regarding the possible impact of such heterogeneity. With few exceptions, scholars have yet to consider how immigrant diversity, including by race/ethnicity, country of origin, or language use, may matter for the immigration-crime association. This is the focus of the current study.
Methods
Building on a handful of studies, we examine the association between measures of immigrant heterogeneity based on different social dimensions and crime rates across 15,000 neighborhoods in roughly 350 U.S. cities, reflecting a wide range of immigrant community contexts.
Results
We find that immigrant diversity matters greatly for neighborhood crime rates, although in unique ways.
Conclusions
We discuss the implications of our findings for theories that emphasize the consequences of heterogeneity specifically, and for the immigration-crime relationship more generally.
Until recently, scholarship on the contemporary immigration-crime link was in relatively short supply. As Morenoff and Astor (2006:36) argued, “criminologists know relatively little about how crime in the United States might be affected by recent waves of immigrants and their descendants.” This is no longer the case given the significant increase of studies on immigration and crime—from individual-level studies of immigrant offending to macro-level studies of the immigration-crime relationship across geographic space. Findings from this scholarship suggest that immigrants are generally less-crime prone than their native-born counterparts (though the children of immigrants born in the U.S. exhibit higher offending rates than their parents as do more assimilated immigrants) and that immigration to an area is not associated with more crime, and is sometimes even associated with decreases in crime (see Kubrin and Ousey 2023 for a review).
Despite noteworthy findings, important areas of inquiry remain. For example, by emphasizing the foreign-born/native-born comparison, researchers downplay the widespread diversity that exists among immigrant groups (but see Caraballo 2024; Gostjev and Nielsen 2017; Kubrin et al. 2018). Researchers also downplay immigrant diversity or heterogeneity, which reflects both the number of immigrant groups in a community and their relative sizes or representation (but see Feldmeyer, Harris and Lai 2016; Graif and Sampson 2009). Yet, as we discuss below, social science theory has much to say about the possible impact of such heterogeneity. Indeed, the role of population heterogeneity in the production of neighborhood crime has a long history in criminology, although perspectives differ about whether heterogeneity is considered a crime enhancing or crime reducing force for community crime rates. These perspectives, in turn, offer competing theoretical arguments about how critical dimensions of immigrant heterogeneity, including by race and ethnicity, by language, and by country of origin, might have varied associations with neighborhood crime rates. The current study begins to address this research lacuna. Building on a handful of studies, we examine the association between measures of immigrant heterogeneity based on different social dimensions and crime rates across 15,000 neighborhoods in roughly 350 U.S. cities, reflecting a wide range of community contexts.
In the remainder of the paper, we first review theoretical frameworks that emphasize the role of diversity in the production of neighborhood crime, identifying potential implications for immigrant heterogeneity specifically. We also consider the theoretical relevance of different dimensions of immigrant heterogeneity and review findings from the handful of studies that consider this. Next, we describe a uniquely created data set that allows us to assess dimensions of immigrant heterogeneity and their associations with neighborhood crime rates, explain our methodological approach, and present findings from our models. We conclude with a discussion of the implications of our findings for theories that emphasize the consequences of heterogeneity specifically, and for the immigration-crime relationship more broadly.
Theoretical Perspectives on Population Heterogeneity
Theoretical perspectives on population heterogeneity and crime rates differ in terms of whether heterogeneity is considered a criminogenic or crime reducing force for communities. We review these perspectives and discuss implications for immigrant heterogeneity and neighborhood crime.
Criminogenic Consequences of Heterogeneity
Social disorganization theory is among the leading perspectives that identify criminogenic consequences of population heterogeneity for neighborhood crime rates. Racial and ethnic heterogeneity, according to the theory, is especially problematic because it undermines ties between neighbors, limiting their ability to agree on a common set of values or “solve commonly experienced problems” (Kornhauser 1978; Bursik 1988)—ultimately reducing neighborhood informal social control (Kornhauser 1978; Smith and Jarjoura 1988; Taylor and Covington 1993; Warner and Rountree 1997). This occurs because in communities comprised of diverse racial and ethnic groups, interaction between members will be lower than in racially homogeneous neighborhoods due to cultural differences, language incompatibility, and because residents typically prefer members of their own race and ethnicity to members of different races and ethnicities (Gans 1968; Blau and Schwartz 1984:14). In essence, social disorganization theory argues that racial and ethnic heterogeneity increases crime rates by limiting the capacity of residents to communicate effectively with one another, form ties, achieve common values, and unite to solve shared problems such as crime.
Consistent with these arguments, studies document heterogeneity's negative relationship with neighborhood levels of cohesion and informal social control and its positive relationship with crime (Kubrin 2000; Putnam 2007; Warner and Rountree 1997), including in non-U.S. contexts (see, e.g., Glas, Engbersen and Snel 2018). 2 Some comparative studies of ethnic heterogeneity and homicide rates report similar findings, although the unit of analysis examined in this body of research is countries (not neighborhoods) (see, for example, Altheimer 2007; de Soysa and Noel 2020).
Another neighborhood perspective linking heterogeneity and crime centers on intergroup conflicts fueled by normative differences within diverse neighborhoods (Graif and Sampson 2009:243). Diverse neighborhoods can be culturally complex, reflecting a plurality of value systems, norms, and experiences, which limit effective social control structures (Herzog 2009:427). Sellin's (1938) culture conflict perspective emphasizes the disagreement or conflict that can result when individuals from racially and ethnically diverse backgrounds residing in the same community adhere to different normative systems. This conflict may affect the crime rate directly, causing it to rise, or it may negatively impact informal social control, which would then influence crime.
How might these arguments relate to immigrant diversity? First, in response to demographic shifts at the time, early social disorganization theorists emphasized the criminogenic consequences not only of racial and ethnic heterogeneity but of immigration and immigrant diversity. With significant numbers of (mostly European) immigrants flocking to U.S. cities, urban communities were rapidly transformed into centers of diversity, the result of which was not always positive (LaFree and Bersani 2014:459). Early theorists suggested that increased immigration can lead to higher crime rates primarily in ethnically-heterogeneous communities where the “crime-reducing effects of immigrant residential concentration are eroded…” (Gostjev 2017:398). In contrast, the cultural isolation of more ethnically-homogenous immigrant communities, they suggested, is likely to have a protective effect, reducing crime in those neighborhoods.
Beyond this, immigration is part of the “heterogeneity problem” because greater racial and ethnic diversity is driven, in large part, by increasing immigration. According to Putnam (2007) who examined immigration-driven racial and ethnic diversity and social capital in U.S. communities, while immigration and diversity have important societal benefits in the long run, in the short run they reduce social solidarity and social capital as “residents of all races tend to ‘hunker down’” and “trust (even of one's own race) is lower, altruism and community cooperation rarer, friends fewer” (pg. 137). Consistent with this, research on the link between Latino immigrant concentration (as a measure of ethnic heterogeneity) and perceptions of collective efficacy in Los Angeles and Chicago finds that increases in Latino immigrant concentration at low levels diminish perceptions of collective efficacy, consistent with the social disorganization thesis that neighborhood-level ethnic heterogeneity attenuates cohesion and shared expectations for pro-social action (Browning et al. 2016:798).
Finally, an inherent by-product of immigration is that migrants bring with them sets of rules and norms unique to their homeland that may be different from, and in opposition to, the dominant values in the host society as well as the values of other immigrants (LaFree and Bersani 2014:459). This discussion suggests that various dimensions of immigrant heterogeneity may be associated with increased neighborhood crime rates.
Heterogeneity's Crime Reducing Consequences
Competing social science theory emphasizes the benefits associated with population heterogeneity for neighborhood crime rates. Contrary to the belief that hostility and conflict are natural and inevitable outcomes of intergroup contact, Allport's (1954) “intergroup contact hypothesis” underscores the benefits that arise from contact among members of diverse groups, especially those from different racial and ethnic backgrounds. According to Allport (1954), bringing together diverse individuals is especially likely to reduce intergroup prejudice when four features of contact are present: 1) equal status between the groups, 2) common goals, 3) intergroup cooperation, and 4) the support of authorities, law or custom. In short, heterogeneity reduces conflict among groups, weakens out-group stereotypes, and fosters intergroup tolerance and solidarity (Feldmeyer et al. 2016:272), conditions less likely to generate conflict and crime.
Since Allport's formulation, the contact hypothesis has received empirical validation, even as researchers identify additional prerequisite features for successful contact, including the opportunity for personal acquaintance between members, especially among those who do not meet stereotypic expectations, as well as the development of intergroup friendships (Dovidio et al. 2017:607–608). A meta-analysis of over 500 studies provides particularly strong support for the theory, showing that intergroup contact significantly improves outgroup attitudes (Pettigrew and Tropp 2006). Even if not a panacea, an optimistic view of intergroup contact emphasizes its promise in reducing prejudice and intergroup friction, and its ability to increase individuals’ belonging and social integration, with implications for community crime rates (Paolini et al. 2018:12). In this view, social connections are heightened between groups. Even a small number of social connections may break down stereotypes, increase cohesion in a neighborhood, enhance informal social control, and reduce crime.
Graif and Sampson (2009:245–246) identify additional (potential) benefits of heterogeneity related to the workforce and entrepreneurship in communities. They suggest that cultural diversity may be beneficial “if it increases the variety and complementarity of goods, skills, abilities, and services…spurring innovation and creativity…cultural diffusion, and hybridization…in turn promoting conditions that prevent intergroup conflict and violent crime.” Along these lines, the converse of immigrant heterogeneity, immigrant homogeneity, may lead to more crime in communities by increasing segregation and isolating communities from mainstream institutions and values (Sampson and Wilson 1995). Such neighborhoods do not represent “communities of choice” but rather “ghettos of last resort” for residents (Glaser, Parker and Li 2003:526). As immigrants navigate these disadvantaged communities, they may embrace the tough, aggressive stances common when negotiating the streets (Anderson 1999; Tonry 1997:21–22).
Consistent with these arguments, studies document heterogeneity's buffering impact on neighborhood crime, at least to some extent. One study, for example, finds that modest levels of general social distance (a measure of heterogeneity) in micro-neighborhoods are associated with reduced levels of perceived crime and disorder compared to locations with no heterogeneity (Hipp 2010). Another study detects a nonlinear relationship between racial and ethnic heterogeneity and crime in neighborhoods, which changes from a positive to a negative relationship at the highest heterogeneity levels (Kim and Wo 2022). A third study demonstrates the benefits of persistent racial heterogeneity, as neighborhoods that maintained high diversity levels over a 30-year period exhibited better socioeconomic outcomes over the time period, on average, compared to matched tracts that did not maintain such high diversity levels (Hipp and Kim 2023). Finally, some comparative studies of ethnic heterogeneity and homicide rates report similar findings (see, as one example, Messner 1989:604), although, again, the unit of analysis examined in this body of research is countries (not neighborhoods).
In conjunction with these arguments, more contemporary perspectives, such as the immigration revitalization thesis, suggest implications for immigrant diversity (Feldmeyer et al. 2016:272; Gostjev 2017:402). The immigration revitalization thesis recognizes benefits that operate in immigrant neighborhoods including information sharing, network formation, symbolic representations of shared identities, and labor market opportunities (Chiswick and Miller 2005). This occurs because immigrant and ethnic neighborhoods can revitalize social, cultural and economic institutions, enhancing well-being and minimizing risk of criminal involvement (Graif and Sampson 2009). In some cases, these communities are characterized by greater levels of immigrant diversity compared to their ethnic enclave counterparts. Consistent with this, in a study of immigrant concentration, ethnic heterogeneity, and crime rates across neighborhoods in 91 U.S. cities, Gostjev (2017) finds that various forms of ethnic heterogeneity moderate the immigration-crime relationship. Contradicting claims of classical theories, Gostjev (2017) finds the protective effects of immigrant concentration are stronger in more ethnically-diverse neighborhoods and become weaker, or disappear entirely, in more ethnically homogeneous communities.
In sum, theory offers contrasting explanations regarding heterogeneity's effect on neighborhood crime rates, with implications for immigrant diversity. What types of immigrant diversity matter most?
Dimensions of Immigrant Heterogeneity
Although many social dimensions create heterogeneity among immigrants, we identify three as most consequential for neighborhood crime rates in light of the discussion above: immigrant racial and ethnic heterogeneity (race and ethnicity are key markers of differentiation in American society), immigrant language heterogeneity (language is central to social interaction among residents, and this dimension is the most commonly examined in the literature), and immigrant country of origin heterogeneity (strongly associated with cultural differences). We discuss each below.
First is immigrant racial and ethnic heterogeneity, the broadest dimension. While the concept of racial and ethnic composition refers to the racial and ethnic makeup of a population based on the size of specific groups, the concept of diversity or heterogeneity refers to the representation and relative size of different racial and ethnic groups within a population. Immigrant racial and ethnic heterogeneity is maximized when all racial and ethnic immigrant groups are represented in a neighborhood and comprise equal shares of the population. As the dimension most closely linked to theories of neighborhood heterogeneity generally, immigrant racial and ethnic heterogeneity is likely salient because it is a dimension that is both socially meaningful and easily observable (Gostjev 2017:403; Kubrin, Hipp and Kim 2018:5; LaFree and Bersani 2014:259). Although we expect this dimension to constitute an important source of differentiation among immigrants, it remains unclear whether such heterogeneity is associated with increases, or decreases, in community crime rates given competing theoretical arguments discussed above.
Second is immigrant language heterogeneity. Language is central to culture, social interaction, and social life (Feldmeyer et al. 2016:268) and may mend ethnic divides, or create new ones (Gostjev 2017:403). This is no less true among immigrants or in immigrant neighborhoods (Gostjev and Nielsen 2017). Language diversity, in particular, is critical because it “may capture more nuanced variations in the cultures of reference, norms, traditions, beliefs, and values that differentially affect behavior and interaction patterns associated with violence” (Graif and Sampson 2009:245). Language heterogeneity may benefit the community, including by lowering crime rates, if it increases the variety and complementarity of goods, skills, abilities and services spurring innovation and creativity, and if it increases levels of intercultural tolerance (Graif and Sampson 2009:245–246). In contrast, when residents speak different languages, they may find it challenging to communicate, organize, and achieve common goals like crime control (Feldmeyer et al. 2016:271). Indeed, decades ago Ruth Kornhauser (1978) argued, “Heterogeneity impedes communication and thus obstructs the quest to solve common problems and reach common goals” (pg. 78). The importance of language for creating difference among residents, including immigrants, may explain why the few studies of immigrant heterogeneity we are aware of focus exclusively on this dimension (see discussion below).
Third is immigrant country of origin heterogeneity, reflected in the diversity of regions of the world from which immigrants originate. Immigrants originating from a similar region of the world are more likely to share cultural history, cues and language, which can lead to greater cohesion and neighborhood social control, and less crime (Kubrin, Hipp and Kim 2018:8). Individuals from the same country are also more likely to offer assistance to their compatriots, have similar modes of incorporation, and occupy similar structural positions in American society (Gostjev 2017:404). Heterogeneity in immigrant country of origin may not provide such benefits and may even undermine social control efforts in communities, resulting in higher crime rates.
Yet country of origin diversity is arguably less observable compared to racial and ethnic diversity, or even language diversity. A consequence is that this dimension may not foster such an apparent sense of “difference.” As a result, social interactions between immigrants from different countries may be more likely to occur, which could bring about a greater sense of acceptance of members from other groups, based on the insights of Allport (1954). Differences between residents from varying cultures might actually be complementary if they provide unique sets of skills useful for the community. Similar to Graif and Sampson's (2009) arguments about language diversity, cultural diversity based on country of origin may be (even more) likely to enhance the variety and complementarity of goods, skills, abilities and services, generating innovation and creativity as well as increasing levels of intercultural tolerance (Graif and Sampson 2009:245–246). Cultural differences as reflected in restaurants featuring the cuisines of various cultures may be particularly desirable to some residents and foster neighborhood cohesion. This dimension of diversity, compared to the other two, may therefore generate beneficial consequences for neighborhoods.
What does research on immigrant heterogeneity and neighborhood crime add to this discussion?
Immigrant Heterogeneity and Neighborhood Crime: Limited Research
Despite a large and growing body of scholarship on the immigration-crime link, only a handful of studies consider immigrant heterogeneity specifically and of those that do, the focus is exclusively on language heterogeneity. Among the first researchers to emphasize immigrant diversity and its connection to crime are Graif and Sampson (2009), who examine spatial heterogeneity in the effects of immigration and diversity on homicide rates in Chicago neighborhoods. Describing post-1965 changes in the composition of immigrant waves to the U.S., Graif and Sampson (2009) recognize that while “a wider range of immigrant and ethnic groups is coloring neighborhoods across the country” (pg. 242), the implications for neighborhood crime are little understood.
Graif and Sampson (2009) maintain that to fully understand the effects of immigration on crime, researchers must consider the separate roles of immigrant concentration on the one hand and language diversity on the other. In their study, they measure language diversity as the language that residents speak at home, calculated as the Herfindahl Index based on 25 language groups that can be classified identically in both the 1990 and 2000 censuses. 3 Whereas the highest score occurs when all subgroups are equally represented, a limitation is that the lowest score conflates neighborhoods that have no foreign-language-speaking households and those where most households speak the same foreign language (pg. 249).
Consistent with the literature, Graif and Sampson (2009) find that the percentage foreign-born in 2000 does not significantly predict homicide rates in 2002–06 (pg. 251). More central to the present study, they also find that language diversity and change in language diversity significantly predict decreases in homicide rates over time, suggesting the need for “a reformulation of the traditional ‘negative’ interpretation of heterogeneity in connection to crime from the social disorganization tradition” as well as a “need to move beyond racial aspects of heterogeneity and toward a consideration of some of the more recent arguments about the benefits of cultural heterogeneity” (pg. 258).
Also recognizing there has been far less attention to questions about the effects of language use on levels of violence, Feldmeyer, Harris and Lai (2016) assess linguistic heterogeneity in their study of how patterns of language use, language heterogeneity, and Spanish language concentration are related to violent crime rates in 2,900 U.S. census places (cities). Feldmeyer and colleagues (2016) created two linguistic context measures: Spanish-language concentration and language heterogeneity. The former is measured as the percentage of the census place population that speaks Spanish only while the latter is measured using a heterogeneity index that captures five language categories from the Census (English only; Spanish; Indo-European; Asian and Pacific Island languages; Other language).
In contrast to Graif and Sampson (2009) but consistent with social disorganization theory, Feldmeyer et al. (2016) find that linguistic diversity is linked to higher census place homicide levels, net of controls (pg. 281). They also find that the positive relationship between language heterogeneity and violence is stronger in places with greater structural disadvantage (pg. 282). At the same time, they find that Spanish-language concentration is linked to lower levels of violence (pg. 281) and that Spanish-language concentration has stronger protective effects in places with greater disadvantage (pg. 282). Feldmeyer et al. (2016) conclude, “Language diversity appears to foster exactly the types of criminogenic environments described by Shaw and McKay (1942) and characterized in Putnam's (2007) work on population heterogeneity. Mirroring the nearly century-old findings of the Chicago School, population and language heterogeneity seem to remain closely linked to place- level violence, purportedly by erecting barriers for erecting community well-being and fostering anomic and disorganized environments that have lower levels of trust, cohesion, collective efficacy, and cooperation among residents” (pg. 285). 4 These findings reflect city-level processes, raising questions about implications for neighborhood crime rates. Besides a difference in geographic scale, there are also questions about the accuracy of city-level results when failing to simultaneously account for neighborhood-level processes (Hipp and Williams 2021).
Current Study
In this study, we examine how various dimensions of immigrant heterogeneity—racial and ethnic heterogeneity, language heterogeneity, and heterogeneity based on country of origin—are associated with neighborhood violent and property crime rates. We test for nonlinear relationships, as we identify at least two possible mechanisms through which there may be a nonlinear immigrant heterogeneity-neighborhood crime relationship. The first is a social network perspective, and argues for the importance of weak ties. In this view, a homogeneous neighborhood will foster strong internal ties but will limit the time and availability for weak ties, which have the ability to bridge into other neighborhoods (Bellair 1997). These weak ties potentially bring resources to the neighborhood. Thus, in this view, at low levels, heterogeneity allows for a mix of strong and weak ties, which is more beneficial for perceptions of crime and disorder (Hipp 2010). With ever increasing heterogeneity levels, however, these benefits stop accruing and other heterogeneity-related negative forces come into play. The quadratic term for heterogeneity would capture this. This first mechanism is most relevant for our immigrant racial/ethnic heterogeneity and language heterogeneity measures, as there are only a few categories constituting these measures.
The second possible mechanism may be relevant for our country of origin heterogeneity measure given it contains numerous categories. The argument is this: for a heterogeneity measure composed of few categories (say, five), it may be relatively common to observe neighborhoods dominated by a single group, which are, therefore, highly homogeneous. However, for our country of origin measure, there are 133 different countries, which means it is quite rare to observe neighborhoods dominated by any single group, or that are homogeneous. From the immigrant enclave literature, one might presume there are many neighborhoods dominated by a single immigrant group, but this is not the case in our multi-city dataset. Therefore, on the one hand, we would expect a positive relationship between immigrant country of origin heterogeneity and crime at very low heterogeneity levels, given these represent neighborhoods transitioning from one dominant group to other groups. On the other hand, at higher heterogeneity levels, we would expect a negative relationship between immigrant country of origin heterogeneity and crime. Why? In these cases, where neighborhoods do not have one single dominant group, increasing country of origin heterogeneity arguably provides more positive mechanisms such as complementary sets of goods, skills, abilities and services, and intercultural tolerance, as discussed earlier. This implies a nonlinear negative relationship with a negative quadratic term, and perhaps also a negative cubic term to capture crime decreases at very high levels of heterogeneity (Kim and Wo 2022). Given these theoretical expectations and prior evidence of nonlinear effects (Gostjev and Nielsen 2017; Hipp 2010; Kim and Wo 2022; Kubrin, Luo and Hipp 2025), we test for nonlinear relationships of our immigrant heterogeneity measures in the analyses.
Our study contributes to the literature by assessing competing theoretical arguments, adjudicating contrasting findings in two studies on language diversity, examining other dimensions of immigrant heterogeneity that have yet to be examined in the literature, and leveraging a novel dataset with information on crime in over 15,000 neighborhoods across a diverse range of hundreds of U.S. cities with substantial variation in levels of immigrant concentration and heterogeneity.
Data and Methods
Data
We use a newly created data source, the National Incident Crime Study (NICS), to examine neighborhoods from a wide range of U.S. cities (small, medium-sized, and large cities with at least 10,000 population) (Kubrin, Luo and Hipp 2025). The NICS includes crime data collected either directly from law enforcement agencies or from publicly available websites. Crime data for years 2009–2011 were cleaned and geocoded to latitude–longitude point locations using ArcGIS 10.6 and assigned the appropriate census tract, our unit of analysis. 5 , 6 Neighborhoods constitute our unit of analysis because the theories discussed throughout operate at lower levels of aggregation as they emphasize concepts like social cohesion and informal social control. Measuring these concepts at larger units (e.g., cities) fails to capture the appropriate neighborhood contexts where immigrant groups live, potentially failing to detect effects that are otherwise present (Hipp 2007). For example, in a segregated city it may appear that there is considerable immigrant heterogeneity at the city level even though the neighborhoods are homogeneous for immigrants.
To ensure validity, we compared city-total estimates from the collected data to totals reported by police agencies to the Uniform Crime Reports (UCR). We only included crime types that were within 30 percent of UCR crime totals; the computed crime totals were very close to those of the UCR in most cities. We also included city fixed-effects in the models to further account for any city differences in crime reporting. To minimize annual fluctuations, we averaged crime events over the three-year period. The geocoding match rate was over 90 percent in each city. Our analytic sample includes 15,097 tracts (with a population of at least 500) across 346 cities (with a population of at least 10,000).
Although NICS data are not a random sample, checks show that the neighborhoods in the data are quite representative of those in the U.S. in 2010. When comparing NICS tracts in cities with at least 10,000 population to the population of tracts in cities with at least 10,000 population in 2010, most standard socio-demographic measures are quite similar between the two. The percent white is somewhat lower in NICS tracts (41 percent vs. 54 percent), whereas the percent Black and percent Latino are moderately higher (about 3–6 percentage points) in NICS tracts. Figure A1 in the Appendix presents comparisons for several socio-demographic measures, highlighting how representative NICS tracts are. The NICS data, and information on how they were collected, are described in detail in the appendix of Kubrin, Luo and Hipp (2025).
We measure key neighborhood characteristics using additional datasets. We use 2010 U.S. Census data and the American Community Survey (ACS) 5-year estimates for 2008–2012 to capture demographic and socio-economic information about neighborhoods in our sample. We capture business information with Reference USA Historical business data from Infogroup (Infogroup 2015), which provides annual business data located to the address level. We aggregate these data to census tracts.
Dependent Variables
Our dependent variables are measures of violent (homicide, robbery, aggravated assault) and property (burglary, motor vehicle theft, larceny) crime counts in the tract. We calculated the number of crime incidents in each tract for each year in 2009, 2010, and 2011, and then computed the three-year average for both crime types.
Independent Variables
Our focal independent variables capture the degree of heterogeneity among immigrants in neighborhoods along three dimensions. Each is constructed as a Herfindahl index (Gibbs and Martin 1962:670) of the various categories. The Herfindahl measure takes the following form:
The first measure captures immigrant heterogeneity based on country of origin. This measure, based on 133 different countries of origin of immigrants reported by the Census, is computed as the proportion of total immigrants that emigrated from each country. Each of these proportions are included in the equation 1 calculation. The second heterogeneity measure, found in prior research (Feldmeyer, Harris and Lai 2016; Graif and Sampson 2009), uses information on language spoken in the home. This language heterogeneity measure computes the proportion of residents in the tract that: 1) speak only English at home; 2) speak Spanish at home; 3) speak an Asian language at home; 4) speak an Indo-European language at home; 5) speak another language at home. 7 This measure uses total population of the tract in the denominator rather than foreign-born population, as the other measures do, because this is how the Census reports the data. Our approach is consistent with the literature (Feldmeyer, Harris and Lai 2016; Graif and Sampson 2009). This measure is also calculated using equation 1. The third heterogeneity measure captures immigrant racial and ethnic heterogeneity, computed as the proportion of immigrants in the tract who are: 1) white; 2) Black; 3) Asian; 4) Latino/a; 5) other race. 8 To test possible nonlinear relationships with crime, we also computed quadratic, cubic, and quartic forms of each measure.
Control Variables
We included additional measures commonly accounted for in neighborhood studies of crime. We created immigrant concentration (percent immigrants), computed as the percentage of the tract population that is foreign born; we also computed quadratic, cubic, and quartic forms of this measure to capture potential nonlinearity. We constructed a measure of concentrated disadvantage, which combines the following variables in a principal component analysis: average household income; average home value; percent with at least a bachelor's degree; median income; percent at or below 125 percent of the poverty level; percent single parent households and percent unemployed. Factor loadings range from 0.71 to 0.91 with an eigenvalue of 4.61 (only one factor was detected). We measured residential stability as a standardized factor score from a principal component analysis of three variables: average length of residence, percent of households that moved into their residence within the last year (loads negatively), and percent homeowners. Again, a single factor was detected, and the factor loadings range from 0.8 to 0.84 with an eigenvalue of 1.96.
To account for racial and ethnic mixing above and beyond immigrantracial and ethnic heterogeneity, we created a measure of racial and ethnic heterogeneity as a Herfindahl Index of five racial and ethnic groups (Asian, Black, Latino/a, White, and other race). We also account for specific racial and ethnic groups by constructing measures of percent Asian, percent Black, percent Latino/a, and percent other race (with percent white as the reference category). Vacant units can provide crime opportunities, so we computed the percent vacant units in each tract. Given evidence of the age-crime curve, we include a measure of percent population aged 16–29. We account for crime opportunity effects by including logged population and population density measures. Finally, we account for opportunities provided by local businesses with three measures. Using Reference USA data, we created a measure of the number of employees of consumer-facing businesses (log transformed) (North American Industry Classification System codes 44–45, 72). While consumer-facing businesses provide jobs to local residents, they also attract a large clientele, potentially increasing crime opportunities. In contrast, non-consumer businesses also provide jobs for local residents but typically do not attract customers, thereby providing fewer crime opportunities (Hipp and Luo 2022; Sampson and Wilson 1995). Finally, we constructed measures of the number of employees of blue-collar businesses and those of white-collar businesses (not consumer-facing), log transformed. Blue collar jobs include factories and shipping centers, whereas white collar jobs include those in real estate, business management, etc. These two job types imply different built environments, which may impact crime opportunities.
We display summary statistics of variables used in the analyses in Table 1. Across our sample of tracts, the average immigrant concentration (percent immigrants) is 23 percent with a standard deviation of 17 percent. Among our three immigrant heterogeneity measures, the one based on country of origin has the highest value with an average of .68 and a standard deviation of .25. The immigrant racial and ethnic heterogeneity measure has an average of .53, while the language heterogeneity measure average is lower at .36. We display the histograms of immigrant concentration and the immigrant heterogeneity measures in Figure 1.
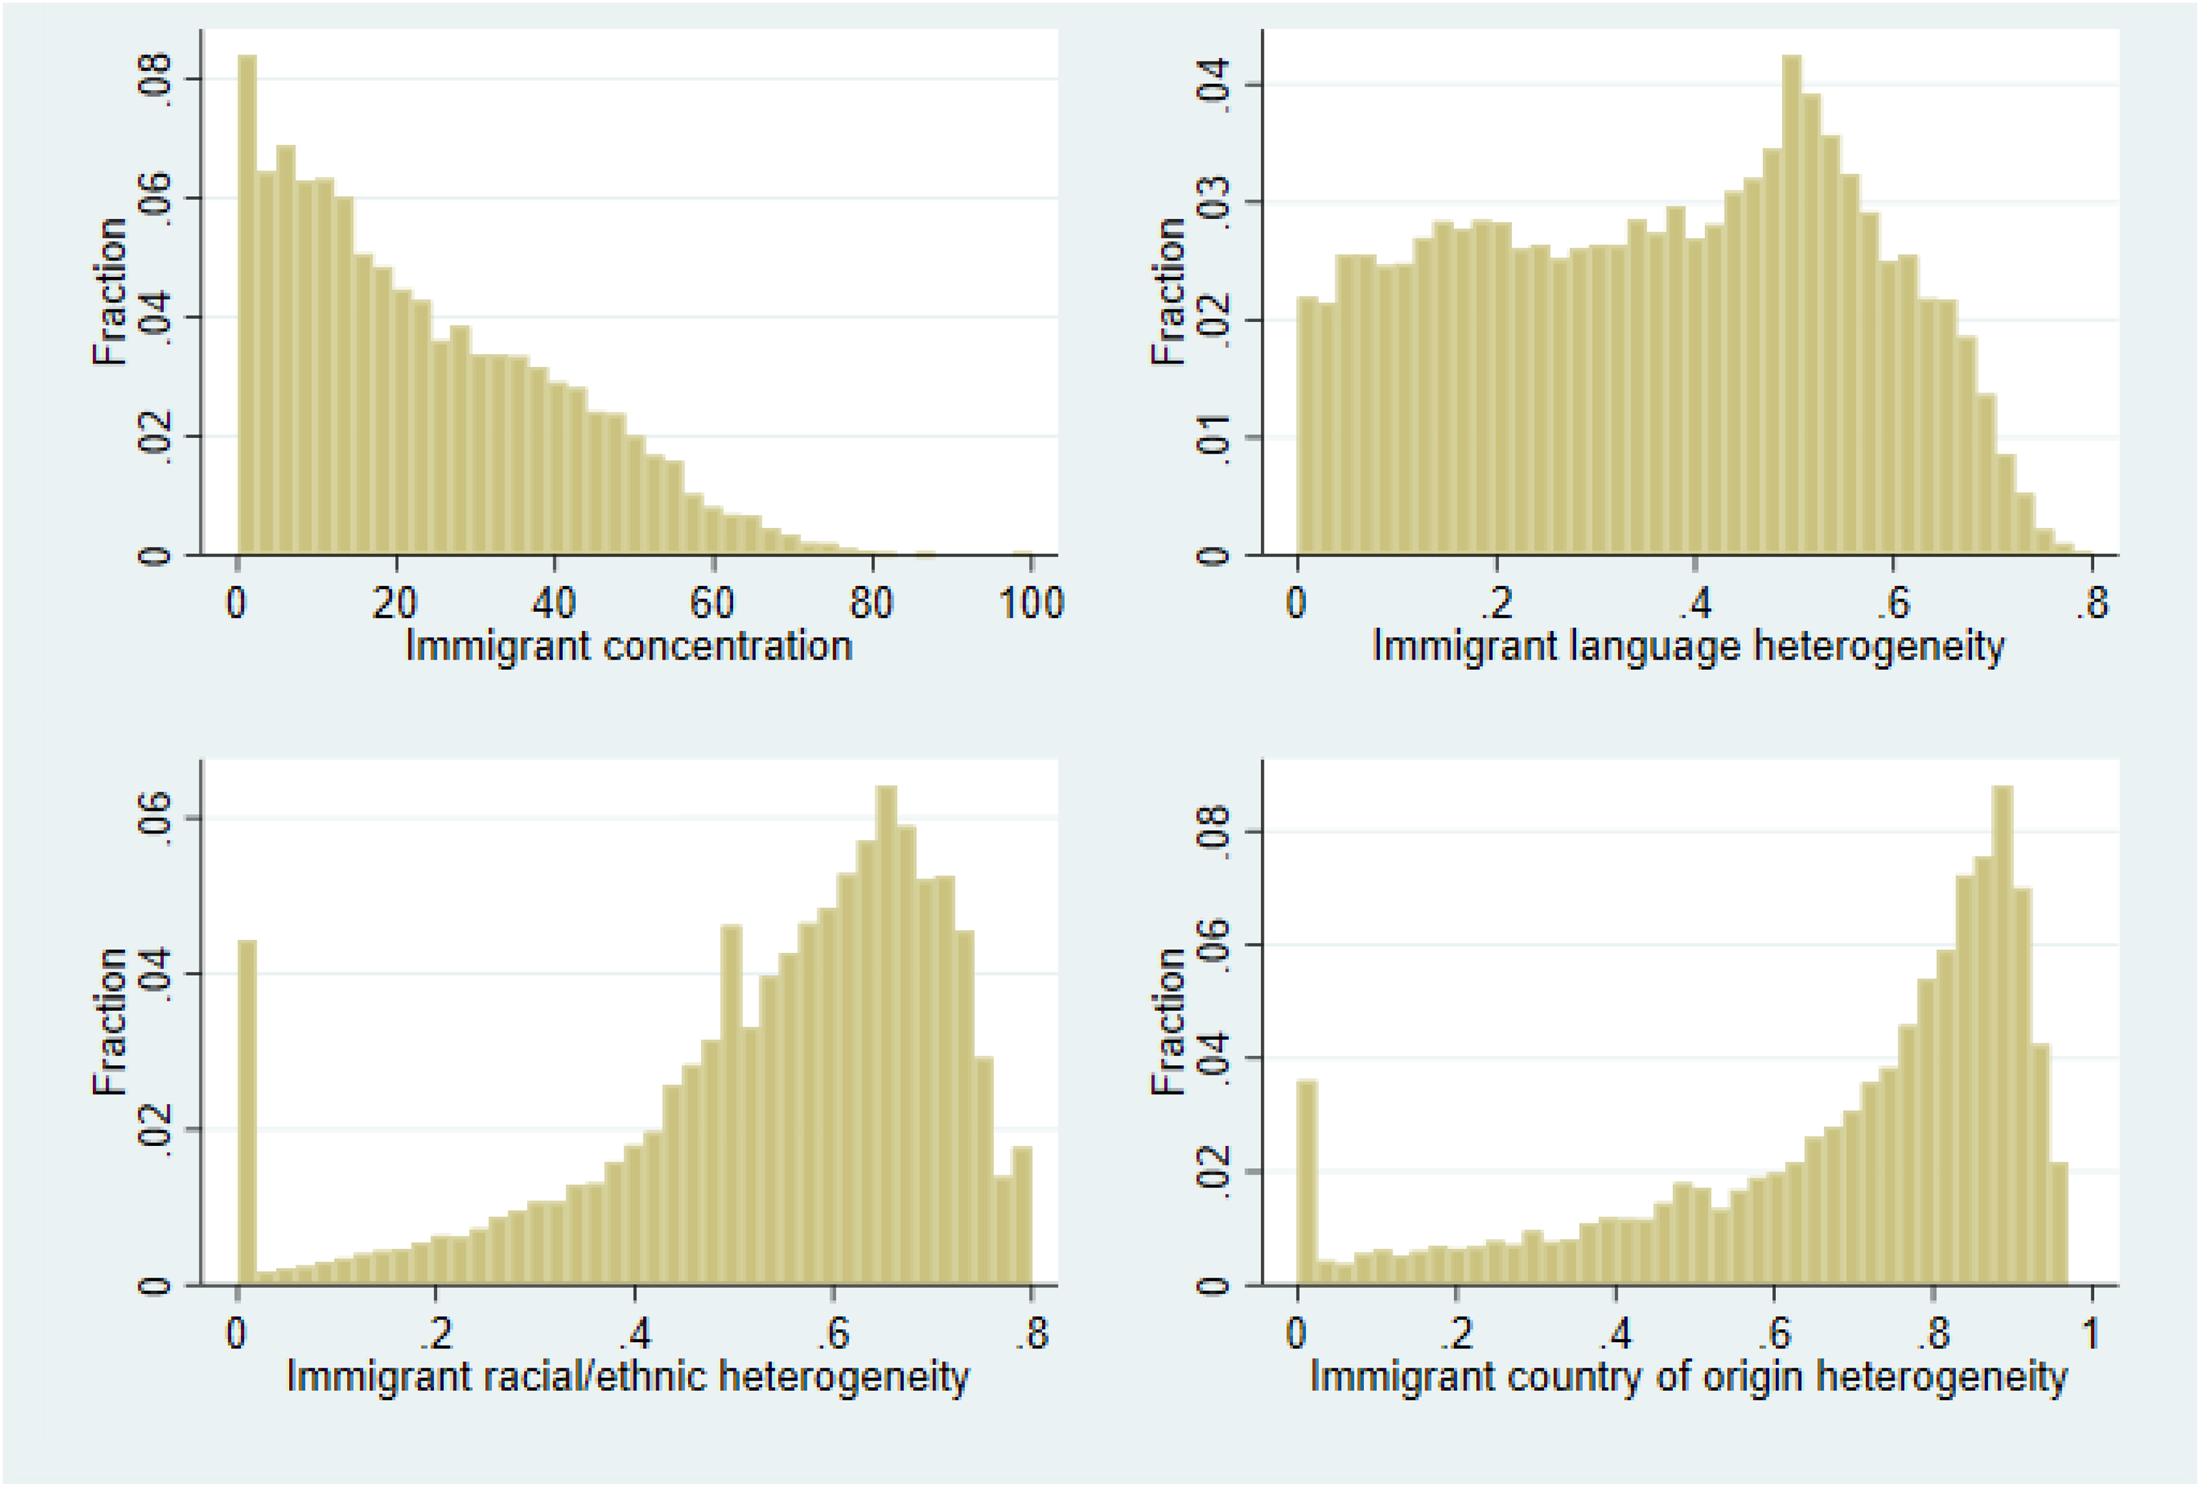
Histograms of immigrant heterogeneity.
Summary Statistics of Variables Used in Analyses.
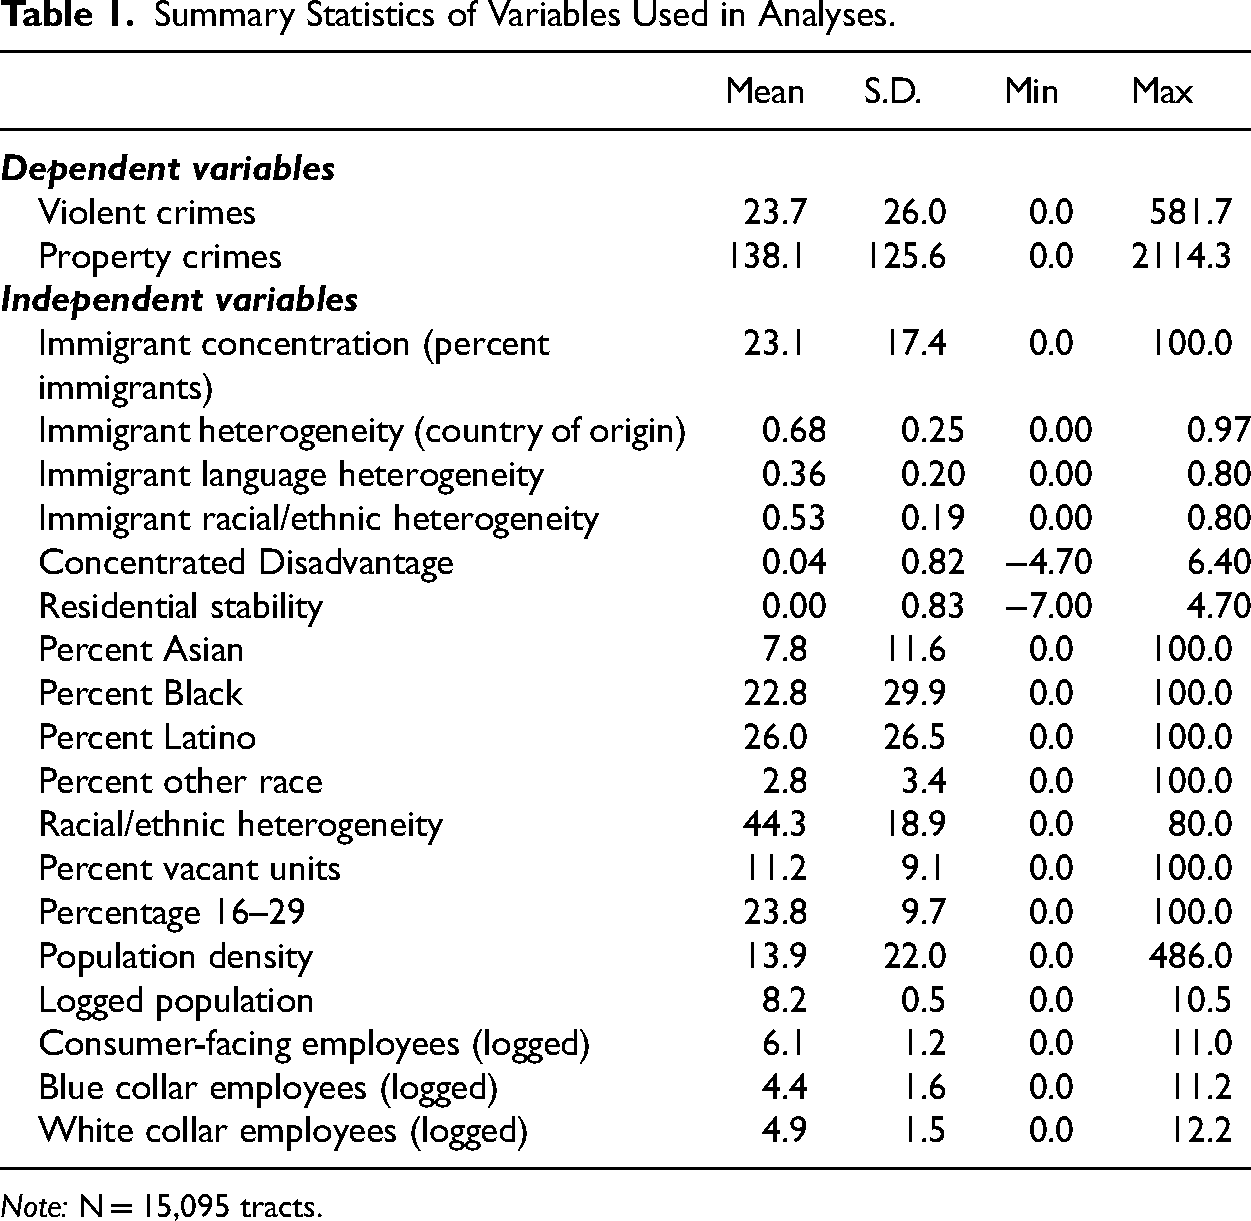
Note: N = 15,095 tracts.
The immigrant country of origin heterogeneity measure has relatively high average values across neighborhoods, perhaps higher than what one might presume given the extensive literature on immigrant enclaves, which are presumed to be relatively homogeneous based on immigrant country of origin. These high values are seen in the histogram for this measure in Figure 1. What does the distribution of immigrant groups look like in neighborhoods with high values on this measure? We assess this by examining neighborhoods that have at least 20 percent immigrants (n = 7,387) and a value of at least .88 on the immigrant country of origin heterogeneity measure (n = 1,535) (see Figure 2). Among these 1,535 tracts, the largest immigrant group in a neighborhood contains 5.9 percent of total immigrants, on average (the left-most point on the line in Figure 2). The second largest immigrant group in a neighborhood contains 4.1 percent of total immigrants, on average. The third largest group has 3.1 percent on average, and the 5th largest contains over 2 percent of immigrants. Even the 10th largest immigrant group contains 1 percent of total immigrants, on average, and in many neighborhoods, there are 20 different immigrant country of origin groups that have a reasonable presence. Thus, there tends to be a significant number of immigrant groups in neighborhoods with high values on this measure.
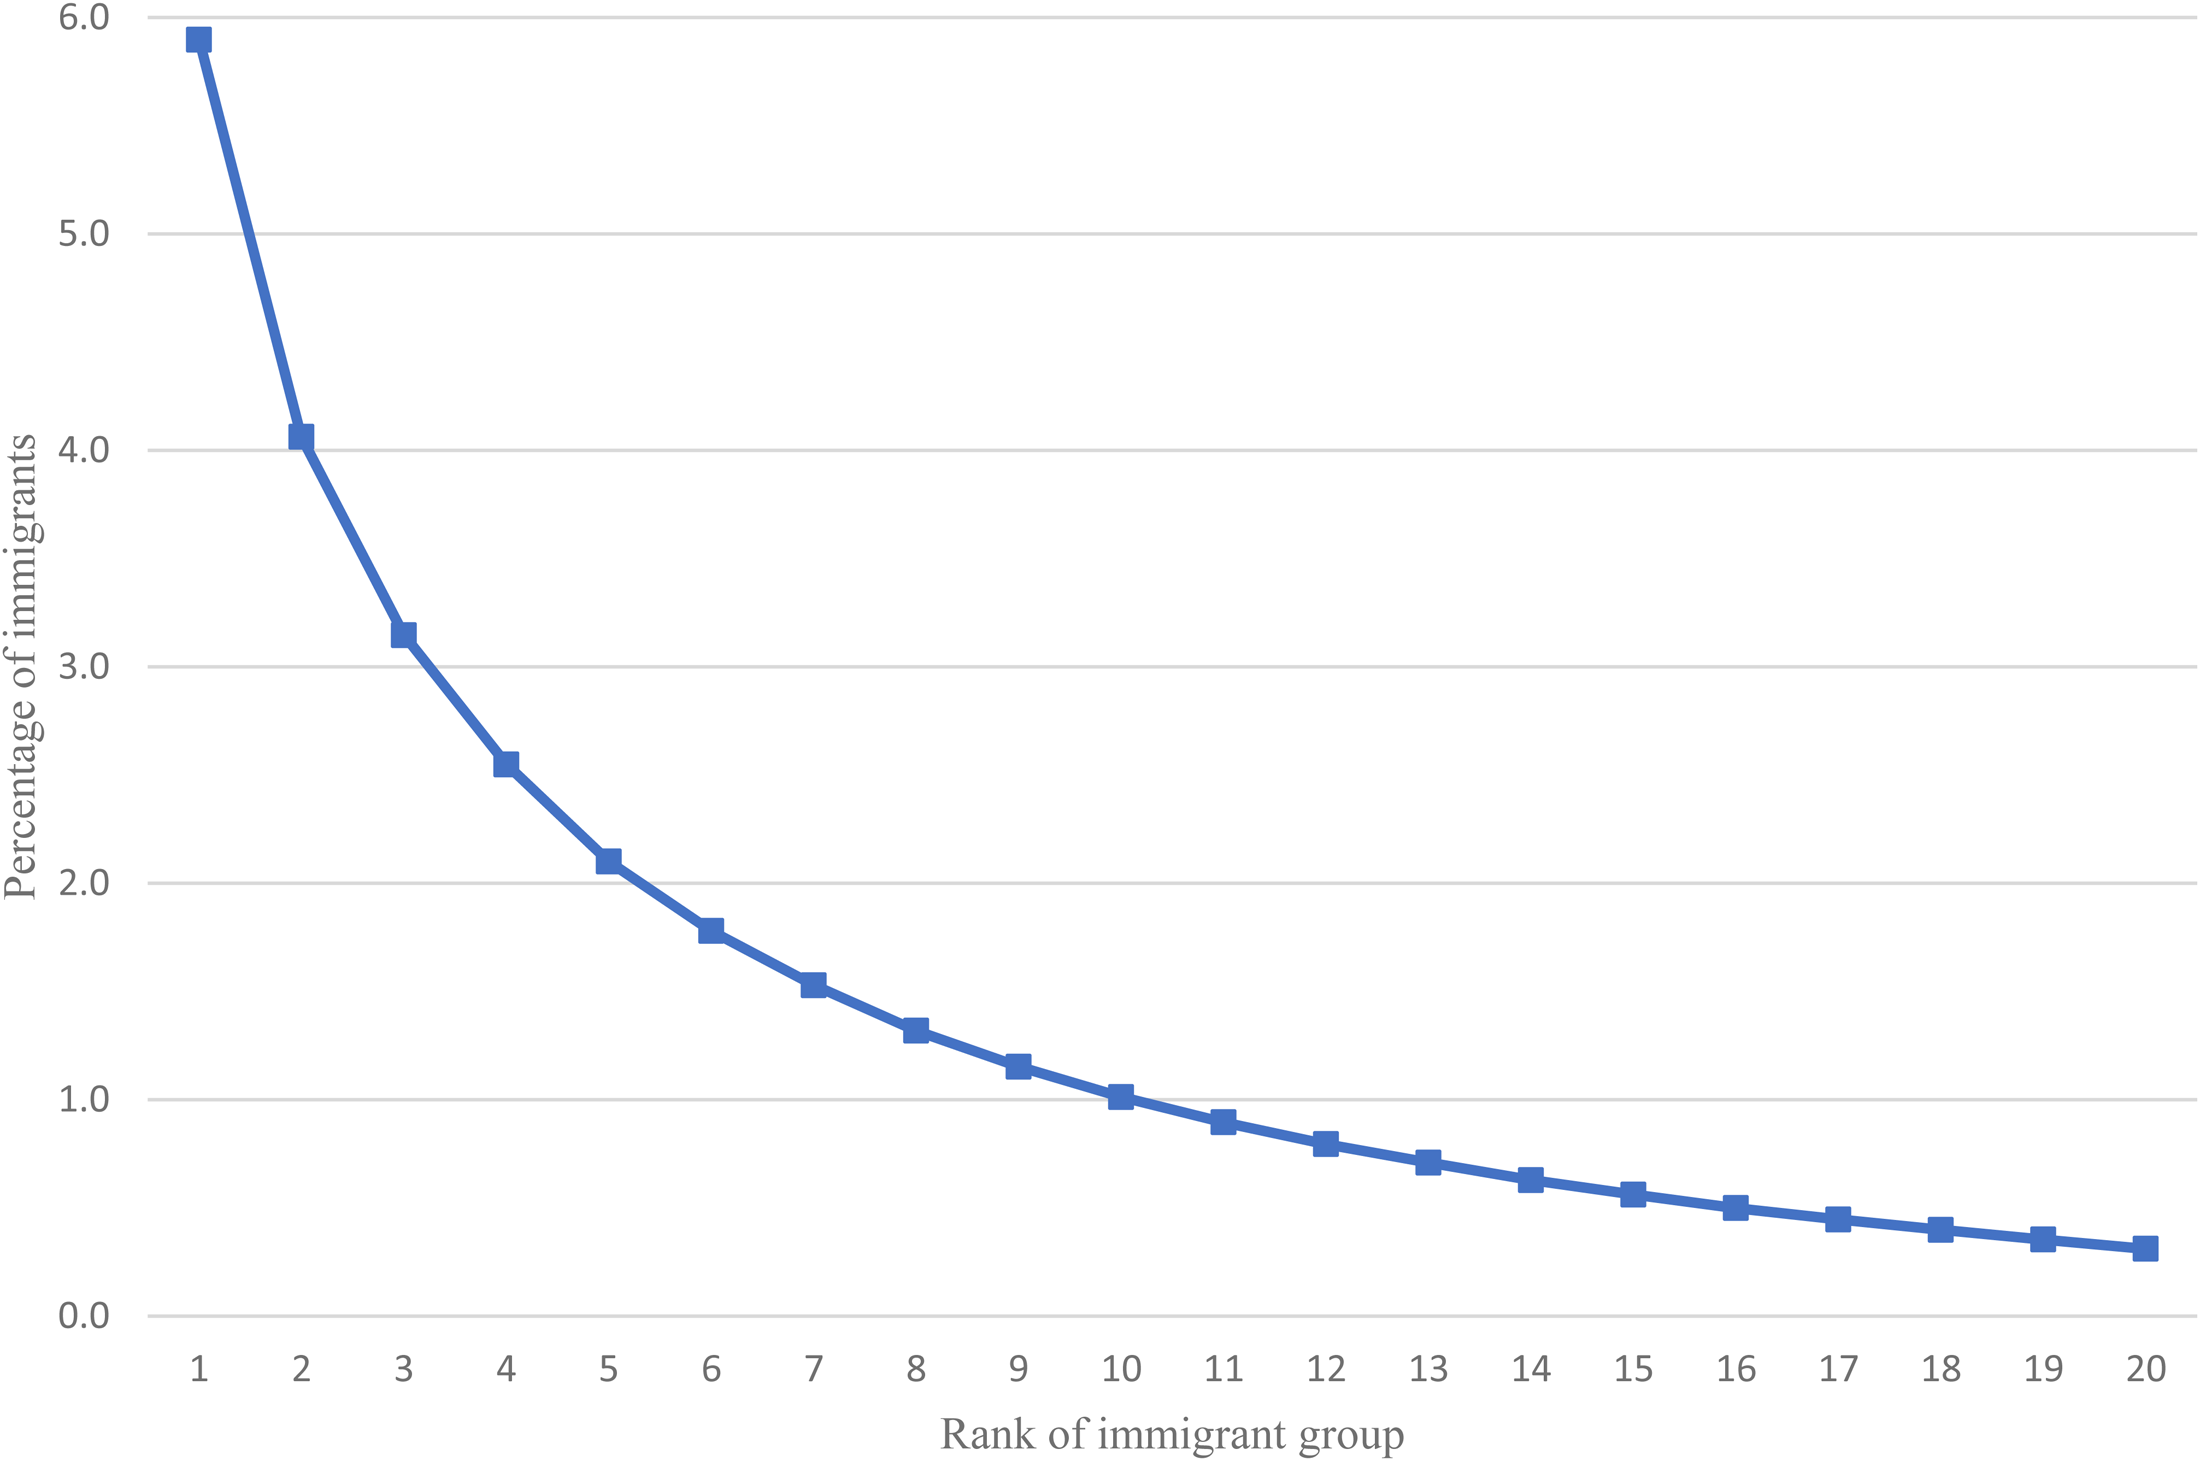
Average percentage of immigrants in top 20 country of origin groups, ranked. Tracts with immigrant heterogeneity greater than .88 and at least 20 percent immigrants.
Modeling Strategy
Given the outcome variable of crime counts, we estimated fixed effects (for cities) negative binomial regression models for tracts in our sample. The models are estimated using the following form:
We first estimate models for violent and property crime that include measures of immigrant concentration (and polynomials) but do not include any immigrant heterogeneity measures. Subsequent models introduce each heterogeneity measure one at a time to assess their individual impact. Our final model includes all immigrant heterogeneity measures simultaneously for relative comparison. In all models we tested for nonlinear effects of the immigrant concentration and immigrant heterogeneity measures. We tested models for each measure that model the variable as: 1) linear; 2) quadratic; 3) cubic; 4) quartic. Given the inherent complexity of modeling various dimensions of heterogeneity simultaneously, we opted for a strict test to determine nonlinearity. We chose models with higher order polynomials only when the improvement in the Bayesian Information Criterion (BIC) value was at least 6, providing “strong” evidence of model fit improvement (Raftery 1995).
Results
We begin by discussing the correlations among immigrant concentration and our three immigrant heterogeneity measures with violent and property crime, as shown in Table 2. The immigrant concentration measure has negative correlations with violent crime (-.08) and property crime (-.17). The immigrant heterogeneity measures have even stronger negative correlations with violent crime than does immigrant concentration, but weaker correlations with property crime. Immigrant heterogeneity based on country of origin has negative correlations with violent crime (-.28) and property crime (-.08). Immigrant language heterogeneity has negative correlations with violent crime (-.14) and property crime (-.09). Immigrant racial/ethnic heterogeneity has a negative correlation with violent crime (-.17).
Correlations among Measures in Models.
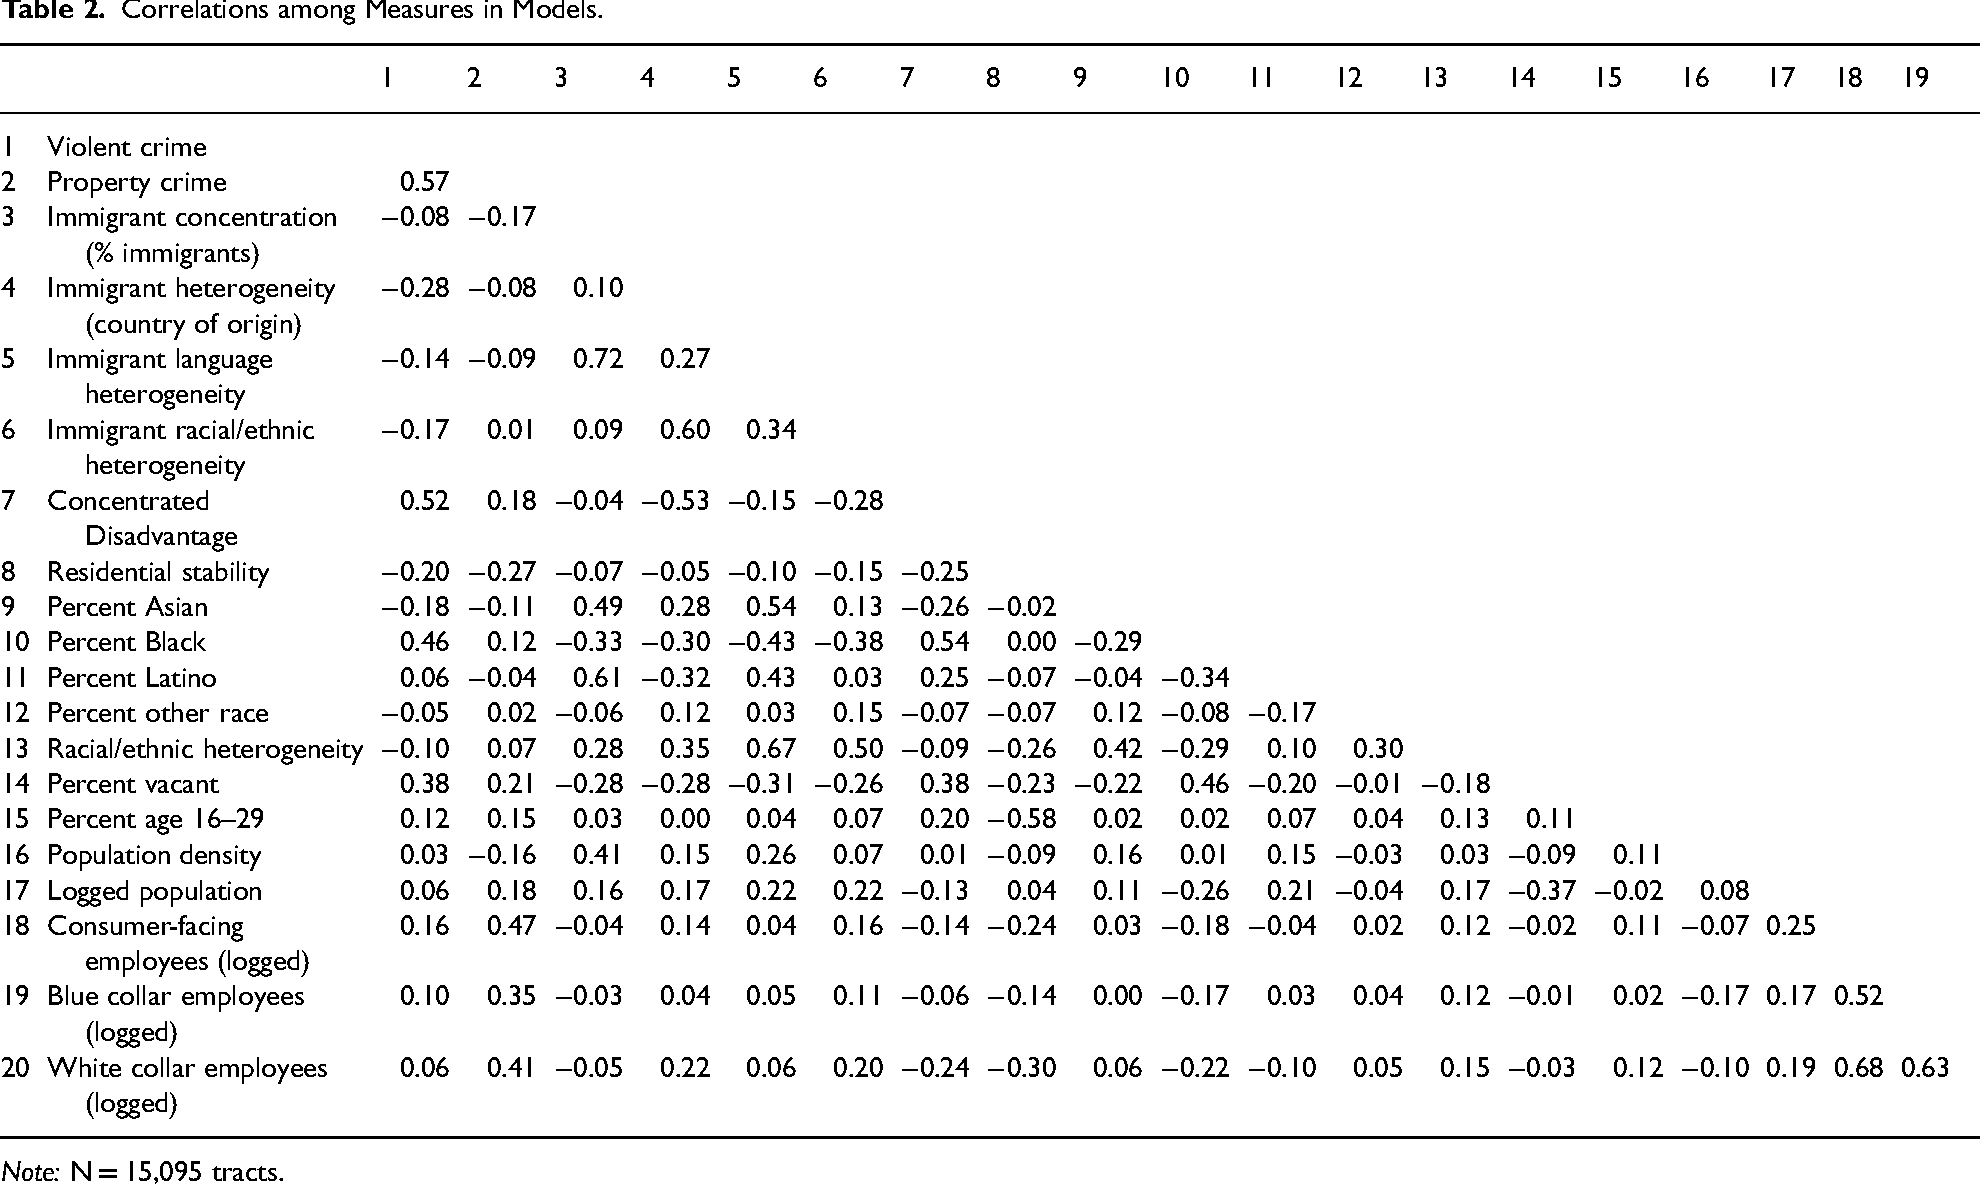
Note: N = 15,095 tracts.
Among our immigrant heterogeneity measures, only the language heterogeneity measure is highly correlated with immigrant concentration (.72). Immigrant heterogeneity based on country of origin and immigrant racial and ethnic heterogeneity have small relationships, .10 and .09 respectively, with neighborhood immigrant concentration. There is a notable correlation between immigrant heterogeneity based on country of origin and that based on racial and ethnic heterogeneity (.60), although correlations among the other heterogeneity measures are modest (between .27 and .34). We also note that racial and ethnic heterogeneity among all neighborhood residents has a substantial correlation with immigrant language heterogeneity (.67) but more modest correlations with immigrant racial and ethnic heterogeneity (.50) and immigrant heterogeneity based on country of origin (.35). Interestingly, our three immigrant heterogeneity measures are negatively correlated with concentrated disadvantage, and this correlation is quite substantial for immigrant heterogeneity based on country of origin (-.53). The immigrant heterogeneity measures are also negatively correlated with percent vacant units. Given these correlations, it is critical to control for neighborhood socio-economic measures in our statistical analyses.
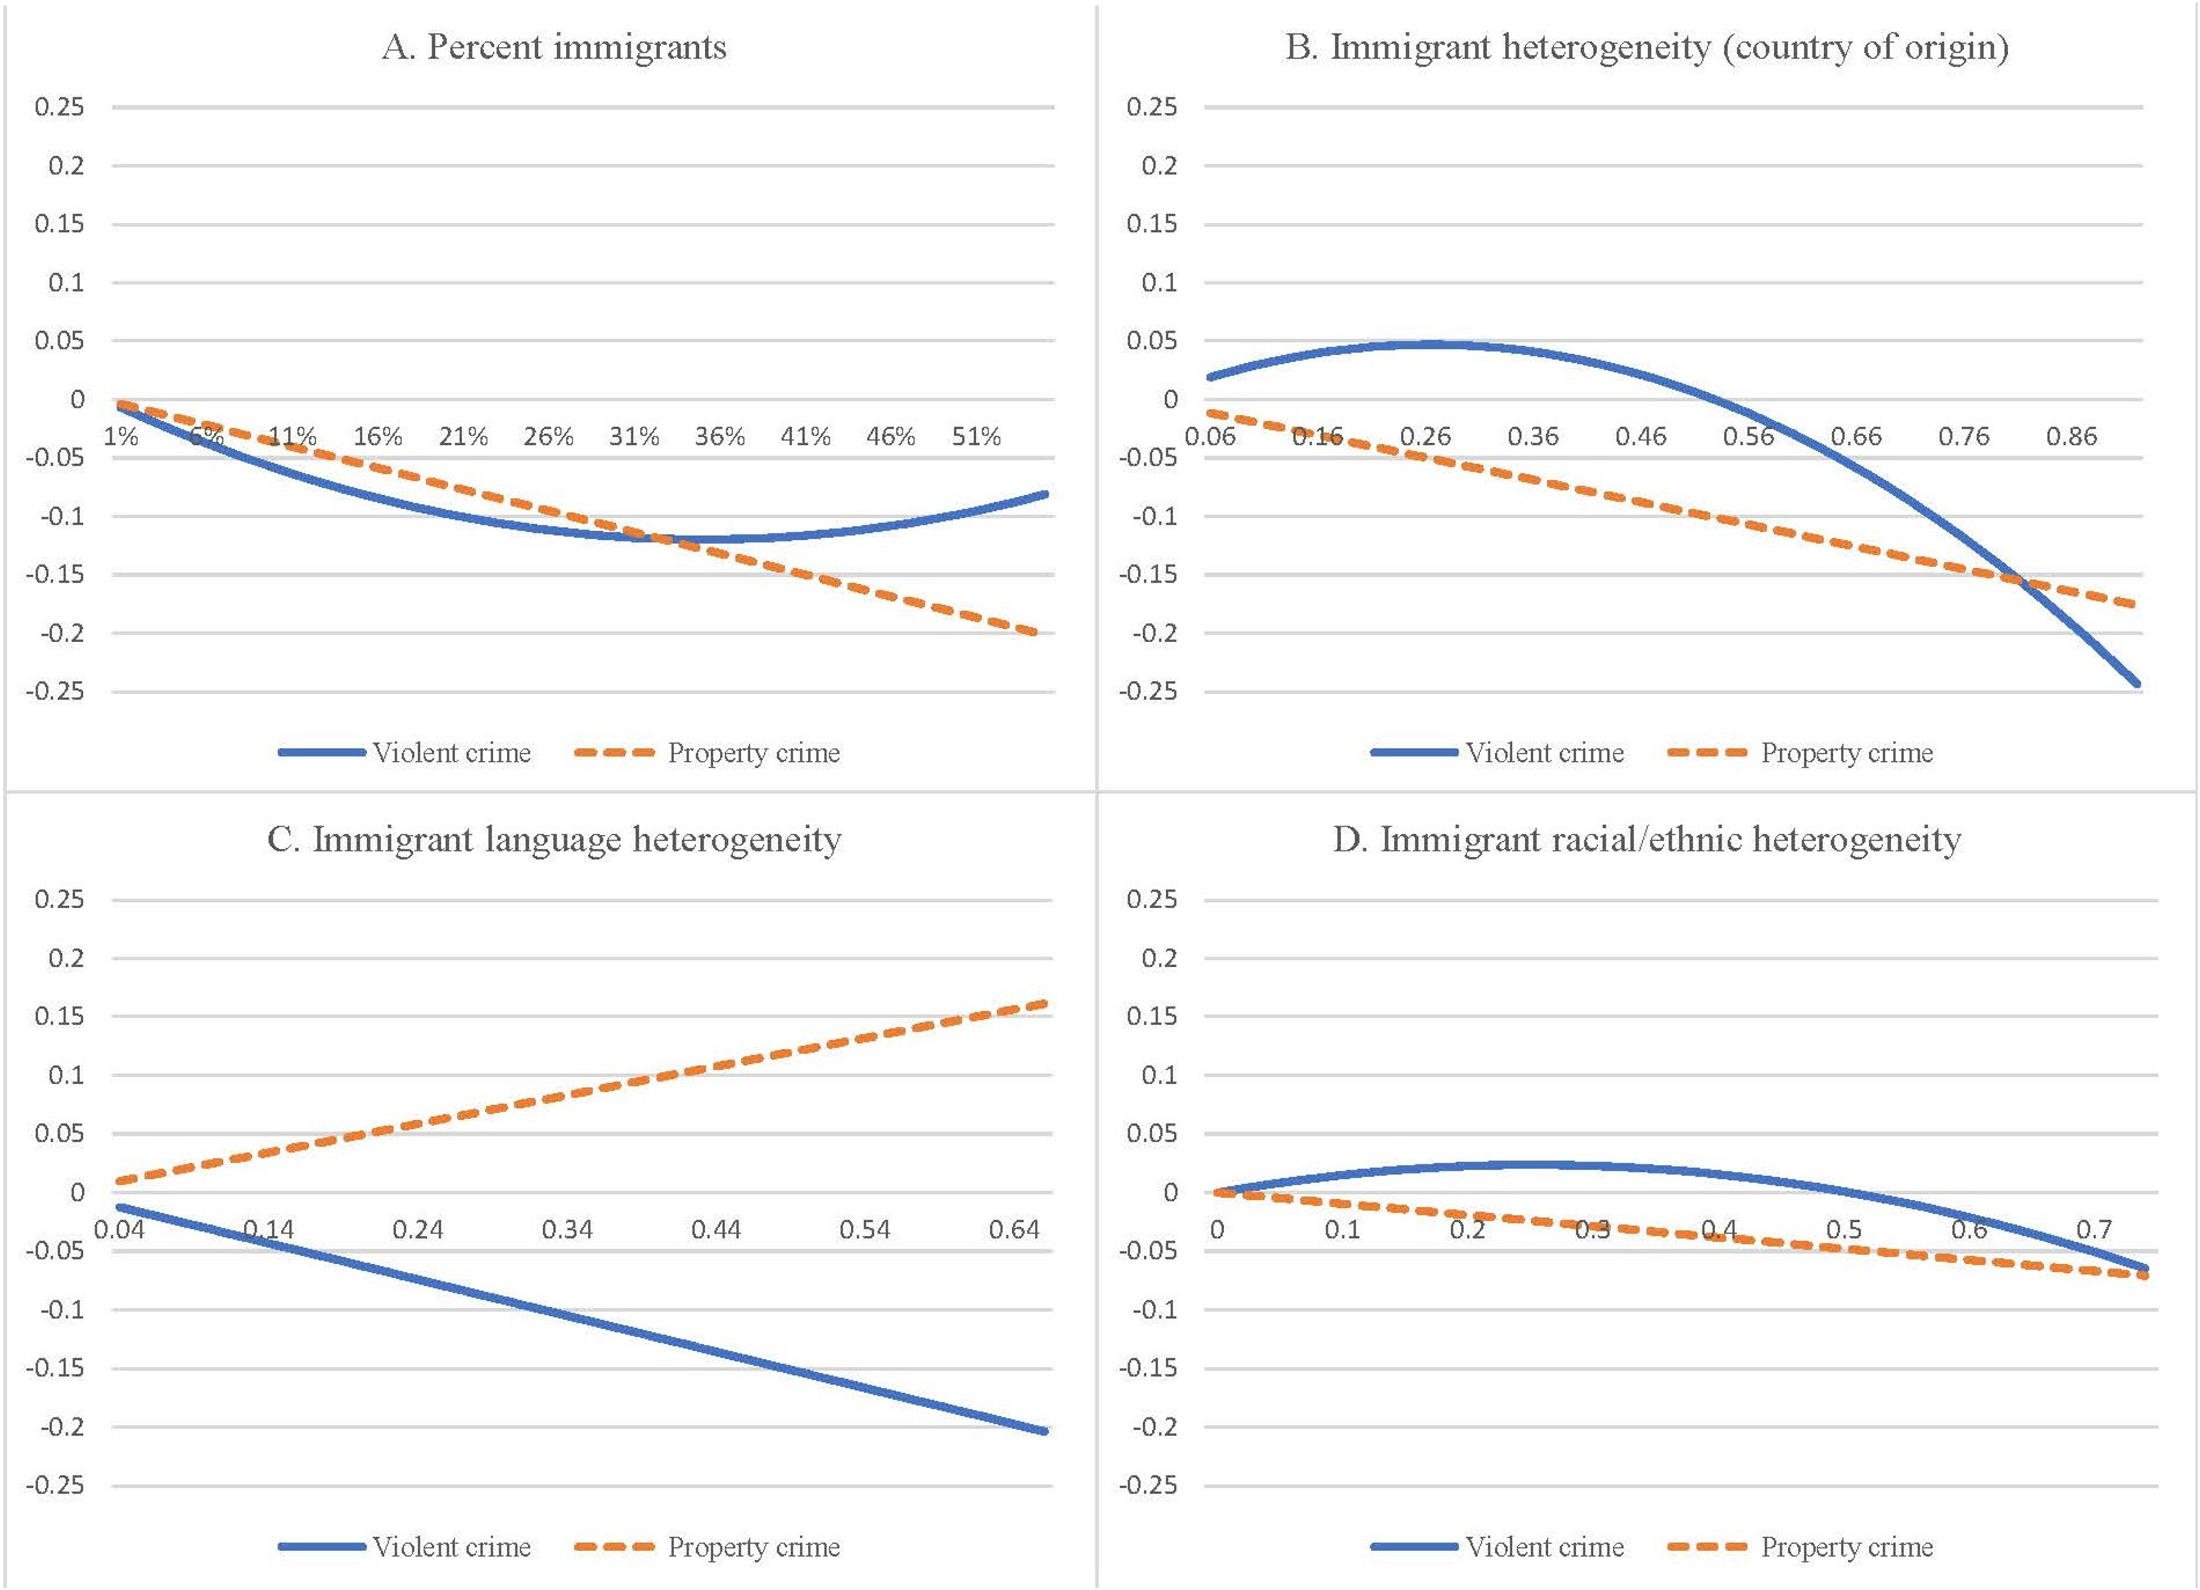
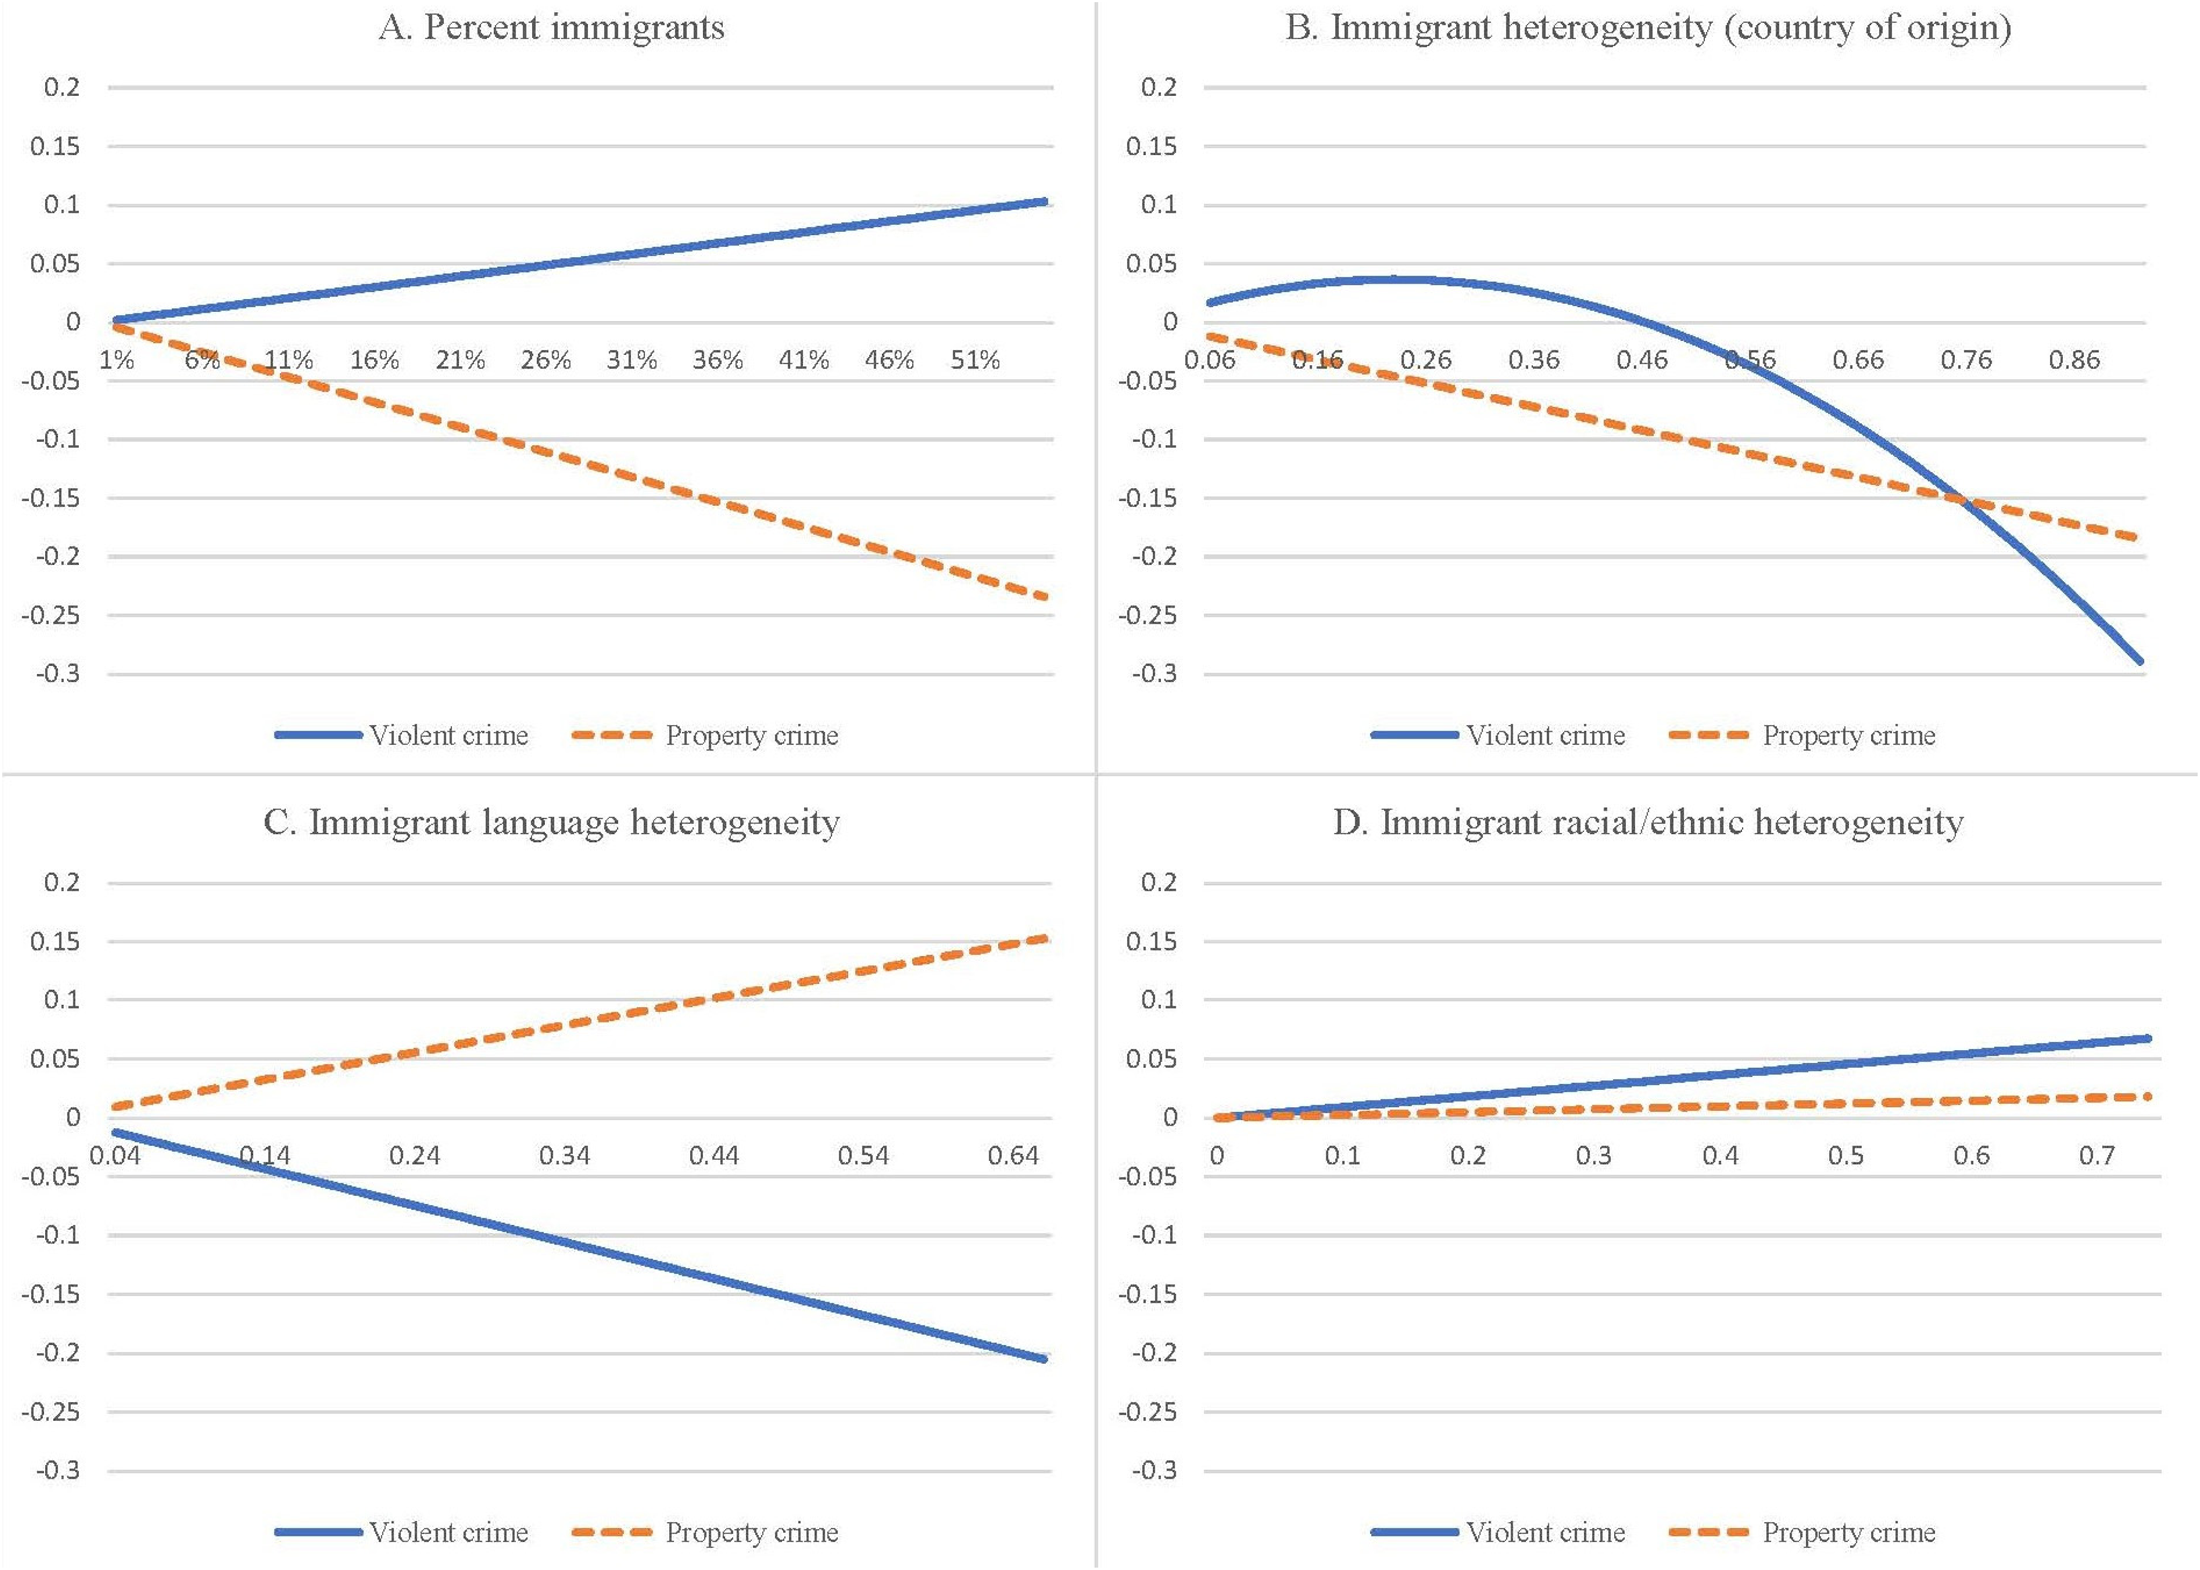
We turn to the negative binomial regression models. We first show the model with the immigrant concentration measure but none of the immigrant heterogeneity measures. The coefficients for the relationship between immigrant concentration and violent crime are shown in model 1 of Table 3 while the coefficients from the property crime model are shown in model 1 of Table 4. We graph the results for these two models and present them in Figure 3A. Each plot in Figure 3 shows the results for a variable across the 5th to 95th percentile. The range of the y-axis is held constant across graphs of this figure to allow direct comparisons of the magnitude of these marginal effects. The solid line in Figure 3A shows that as immigrant concentration increases, the violent crime rate decreases with a slowing effect that only begins to turn upwards above roughly 35 percent immigrants in the neighborhood. The dashed line shows a negative relationship between immigrant concentration and property crime. These findings are consistent with literature (Kubrin, Luo and Hipp 2025; see also Kubrin and Ousey 2023).
Nonlinear effects from models including each heterogeneity measure separately.
Negative Binomial Regression Models Predicting Violent Crime in Census Tracts, one Immigrant Heterogeneity Measure per Model.
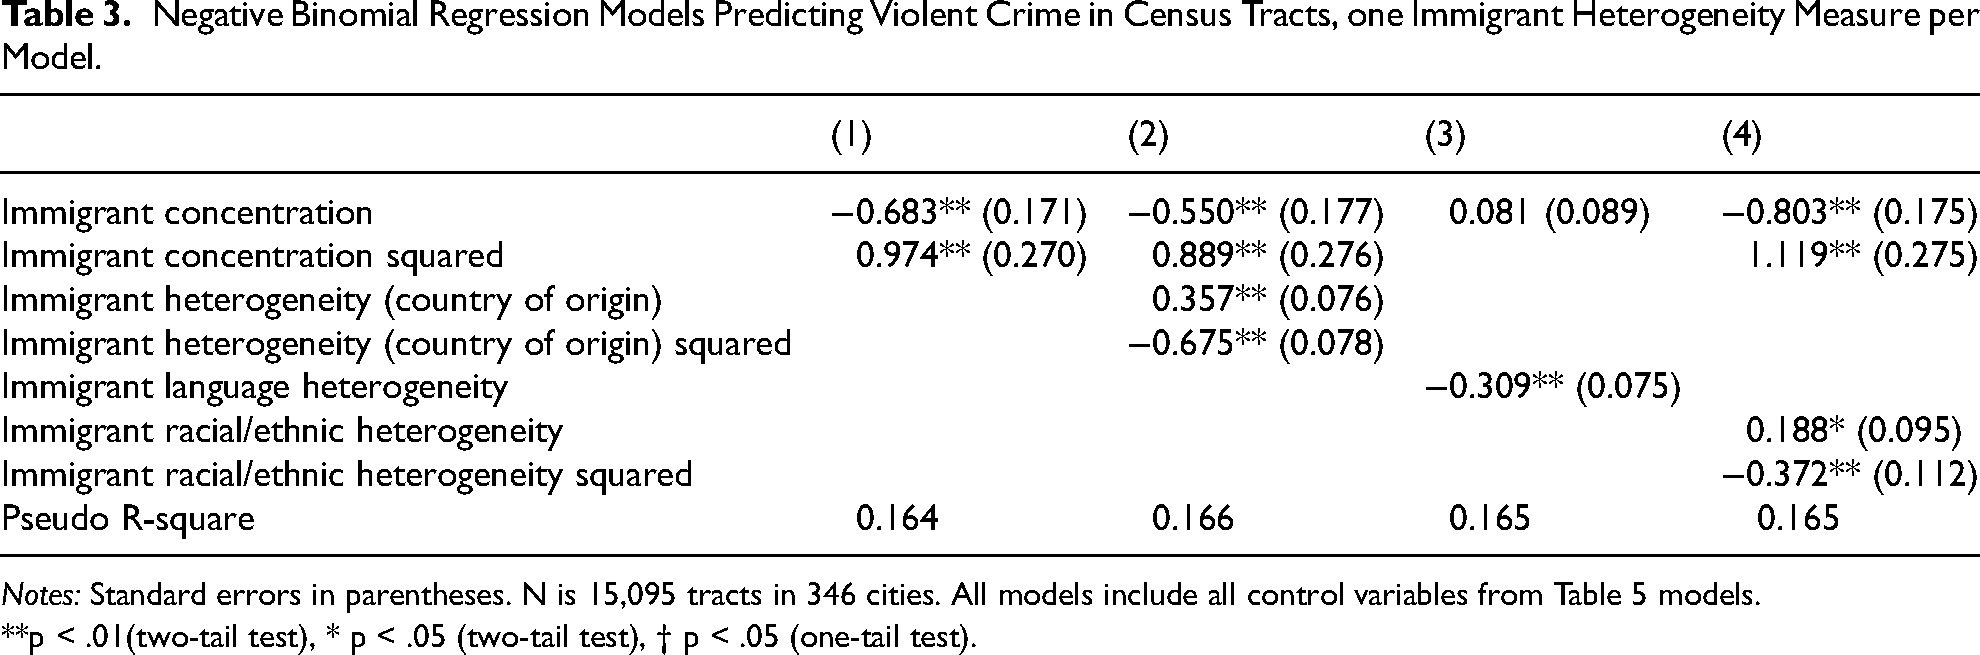
Notes: Standard errors in parentheses. N is 15,095 tracts in 346 cities. All models include all control variables from Table 5 models.
**p < .01(two-tail test), * p < .05 (two-tail test), † p < .05 (one-tail test).
Negative Binomial Regression Models Predicting Property Crime in Census Tracts, one Immigrant Heterogeneity Measure per Model.
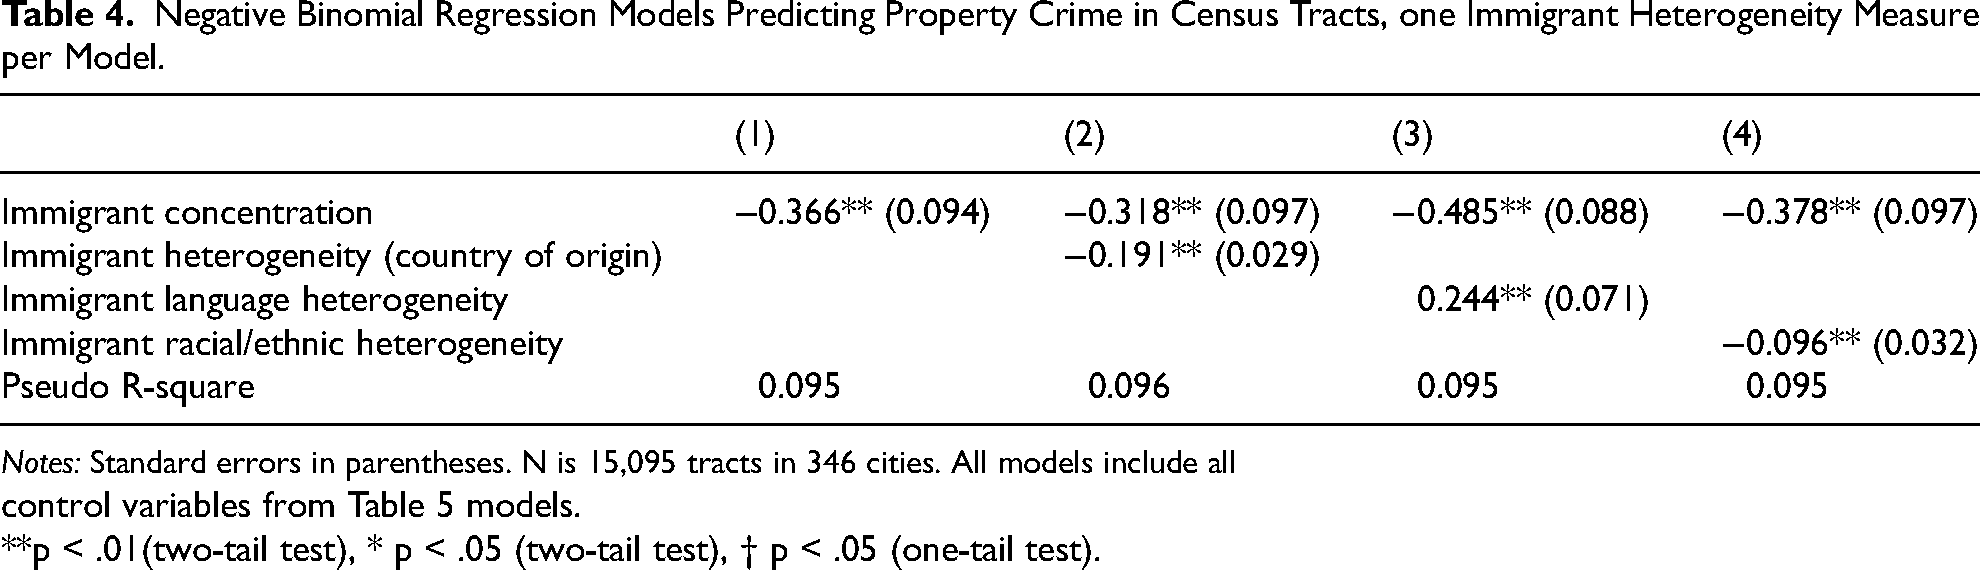
Notes: Standard errors in parentheses. N is 15,095 tracts in 346 cities. All models include all control variables from Table 5 models.
**p < .01(two-tail test), * p < .05 (two-tail test), † p < .05 (one-tail test).
In model 2 of Table 3 for violent crime and Table 4 for property crime, we observe negative relationships between immigrant heterogeneity based on country of origin and violent and property crime. Plotting these relationships in Figure 3B shows that the negative relationship for violent crime (solid line) is especially pronounced at higher levels of heterogeneity. For violent crime, whereas increasing immigrant country of origin heterogeneity from low levels shows a modest increase in violence (the left side of this figure), a 0.2 increase in this measure from .65 to .85 (about one standard deviation) is associated with a 12 percent decline in violence, on average. 10 We find a negative linear relationship for property crime (dashed line), as a 0.2 increase in this measure is associated with a 4 percent decline in property crime, on average. Given that we control for the level of neighborhood disadvantage, this effect is above and beyond the more economically-advantaged nature of these neighborhoods.
Results are mixed for immigrant language heterogeneity as revealed in model 3 of Tables 3 and 4, and Figure 3C. For violent crime, there is a linear negative relationship with language heterogeneity, as a 0.2 increase in this measure is associated with a 6 percent decline in violence, on average. In contrast, there is a positive relationship between language heterogeneity and property crime, as a 0.2 increase in this measure is associated with a 5 percent increase in property crime, on average. Consistent with Graif and Sampson (2009), we thus find evidence that immigrant language heterogeneity is protective for violent (but not property) crime in neighborhoods.
We focus on immigrant racial and ethnic heterogeneity in model 4 of Tables 3 and 4. Figure 3D shows this measure has very modest relationships with violent and property crime. There is a slight inverted-U relationship between immigrant racial and ethnic heterogeneity and violent crime, and a very modest negative linear relationship with property crime. Given we plotted this on the same y-axis range as the other measures, we see just how modest these effects are: a 0.2 increase in this measure from .4 to .6 is associated with just 2 to 3 percent less violent or property crime.
We next present models that simultaneously include all three immigrant heterogeneity measures. The coefficients for these models are presented in Table 5 and plotted in Figure 4. One notable finding is there is no longer a nonlinear relationship for immigrant concentration in the violent crime model. Note that in the models in Table 3 it was the introduction of the immigrant language heterogeneity measure that eliminated the nonlinear relationship. In the full models in Table 5, there is no longer a negative relationship between immigrant concentration and violent crime, and it is even somewhat positive, suggesting that these heterogeneity measures may mediate this relationship. There is a linear negative relationship with property crime, which we plot in Figure 4A: a 20-percentage point increase in immigrant concentration is associated with 8 percent less property crime, on average.
Nonlinear effects from full models
Full Negative Binomial Regression Models Predicting Crime in Census Tracts.
Notes: Standard errors in parentheses. N is 15,095 tracts in 346 cities.
**p < .01(two-tail test), * p < .05 (two-tail test), † p < .05 (one-tail test).
In Figure 4B, we see strong negative relationships between immigrant heterogeneity based on country of origin and violent and property crime. The shapes of these relationships are similar in this model accounting for other types of immigrant heterogeneity as they were in the earlier models that did not include these measures. We again see that this measure is negatively related to crime, and that the relationship for violent crime is particularly strong at very high levels of heterogeneity, as a 0.2 increase in this measure at high levels is associated with 12 percent less violence, on average. The relationship with property crime is unchanged when simultaneously accounting for the other types of heterogeneity, as a 0.2 increase is associated with 4 percent less property crime, on average.
Figure 4C also shows that the pattern for immigrant language heterogeneity remains similar when accounting for other immigrant heterogeneity measures. There is a relatively strong negative relationship between immigrant language heterogeneity and violent crime, as a 0.2 increase in this measure is associated with 6 percent less violent crime, on average. In contrast, this measure has a positive relationship with property crime, as a 0.2 increase in this measure is associated with 5 percent more property crime, on average.
Finally, immigrant racial and ethnic heterogeneity has a weaker relationship with crime compared to the other heterogeneity measures (Figure 4D). For property crime, the relationship is not statistically significant when accounting for the other immigrant heterogeneity measures. There is a modest positive relationship for violent crime, as a 0.2-point increase in this measure is associated with 2 percent more violent crime, on average.
The control variables show the expected pattern of results. Notably, while our immigrant heterogeneity measures largely exhibit negative relationships with crime, the measure for overall neighborhood racial/ethnic heterogeneity is positively associated with both violent and property crime, consistent with research discussed earlier. Also consistent with the literature, neighborhoods with greater concentrated disadvantage have higher levels of violent crime whereas those with greater residential stability have lower crime levels (Land, McCall and Cohen 1990). Finally, we find various opportunity effects: the presence of more vacant units is associated with higher crime rates as is the presence of more consumer-facing businesses. Blue- and white-collar businesses are also associated with higher crime levels, although the size of the effects is much smaller than for consumer-facing businesses.
Ancillary Models
We tested ancillary models to assess the robustness of our results. First, a concern may be that the country of origin measure is biased towards high heterogeneity values given the large number of countries included. We assessed this by creating a measure of immigrant heterogeneity using region of the world based on the 18 world regions defined in the U.S. Census. 11 This measure has a mean value of .56 over the sample tracts (similar to the immigrant racial/ethnic heterogeneity measure). Although this mean is slightly less than the country of origin measure (.68), the two measures are very highly correlated at .89. When we substituted this measure for immigrant heterogeneity based on country of origin in the Table 5 models, we find that immigrant regions of the world heterogeneity exhibits a linear negative relationship with both violent and property crime. A 0.2 increase in this measure is associated with 7 percent less violent and 3 percent less property crime. The model fit is essentially the same as in Table 5, suggesting no evidence of bias in the results. We conceptually prefer our measure based on country of origin as it distinguishes between, say, Koreans, Chinese, and Japanese immigrants, all of whom come from the same region of the world but who have cultural as well as language differences.
Given that Feldmeyer and colleagues (2016) included a measure of the percent Spanish language speakers in their city-level analyses, we tested this here. Adding this measure to the Table 5 models shows no evidence of a negative relationship with crime as found by Feldmeyer et al. (2016), perhaps due to differences in the units of analysis employed. There is a nonsignificant relationship with property crime and a strong positive relationship with violent crime. The substantive results of the other variables remained unchanged. We also tested whether a measure of linguistic isolation (the percentage not speaking English, or not speaking it well) might impact the findings for language heterogeneity, and whether the negative relationship between immigrant heterogeneity based on country of origin and crime is due to the presence of college towns (including a measure of the percentage of college residents). In all models, the results for our immigrant heterogeneity measures remained effectively unchanged (see online supplemental materials).
There are reasons why our immigrant heterogeneity measures might operate differently depending on the level of concentrated disadvantage in the neighborhood. We tested this by estimating additional models that included interaction variables between the concentrated disadvantage measure and our three immigrant heterogeneity measures. In general, the results were quite modest. In the violent crime models, the interaction for the immigrant language heterogeneity measure was not significant, which contrasts with results from a study using cities as the units of analysis (Feldmeyer et al. 2016). For immigrant heterogeneity based on country of origin or racial/ethnic heterogeneity, the significant interactions only demonstrated a modest accentuated downward bend at the highest levels of immigrant heterogeneity in high disadvantage tracts, but no such pattern for low disadvantage tracts. For property crime, the only significant interaction was for language heterogeneity and this measure exhibited a strong positive relationship with property crime in low disadvantage tracts (but a weak positive relationship in high disadvantage tracts) (see online supplemental materials).
A final concern is that including measures of the neighborhood racial and ethnic composition is biasing our measures of immigrant heterogeneity. We assessed this by estimating ancillary models in which we excluded the measures of percent Black, percent Latino/a, percent Asian, and percent other race. For violent crime, the substantive results for our immigrant heterogeneity variables were virtually the same. For property crime, the only difference was that the language heterogeneity variable was no longer positive, but now was statistically nonsignificant. In short, there were few differences in results.
Discussion
This study sought both to expand and refine the immigration-crime research base by examining a critical yet understudied dimension—immigrant heterogeneity. Motivated by competing theoretical arguments about heterogeneity's impact and building on a handful of studies with conflicting findings, we leveraged a unique national neighborhood-level dataset to assess how immigrant diversity by race and ethnicity, country of origin, and language use, matter for the immigration-crime association. The findings suggest that immigrant diversity matters greatly.
We generally find consistent results for our immigrant heterogeneity measures for a large sample of neighborhoods across more than 340 cities. There is evidence that immigrant heterogeneity based on country of origin has a strong nonlinear relationship with violent crime, and a negative relationship with property crime. Although immigrant racial and ethnic heterogeneity is a weaker predictor, language diversity is important and associated with higher levels of property, but lower levels of violent, crime. These findings are from models that include a robust set of controls, including neighborhood socio-economic and demographic characteristics, and especially neighborhood disadvantage and overall population racial and ethnic heterogeneity. Hence, immigrant diversity—not just immigrant concentration—is a critical determinant of neighborhood crime rates. At the same time, we find that different dimensions of immigrant heterogeneity matter in different ways.
Focusing on immigrant language heterogeneity, our findings add to the small and conflicting research base on this dimension of diversity. We find property crime is notably higher as language heterogeneity increases, consistent with Feldmeyer et al. (2016) who studied language heterogeneity in cities. At the same time, we find a negative relationship between language heterogeneity and violent crime; the implication is that language heterogeneity is protective for violent crime, consistent with Graif and Sampson (2009) who find that language heterogeneity is protective for homicide in Chicago neighborhoods. Perhaps language barriers in communication make it challenging for residents to solve community problems, particularly property crime, even as other dimensions of immigrant heterogeneity help reduce neighborhood crime rates. It may also be that social ties and networks are stunted in neighborhoods where residents speak different languages simply because they require, at a minimum, the ability to communicate. Lacking data to create measures that reflect these arguments, we can only speculate. Nonetheless, that language heterogeneity is beneficial for violent crime, particularly in our large and heterogeneous sample, is a provocative finding worthy of further research.
Turning to immigrant racial and ethnic heterogeneity, our findings are notable. Although a long line of studies shows a robust positive relationship between neighborhood racial and ethnic heterogeneity and crime, this is the least consequential diversity dimension we studied. Even when we estimated ancillary models excluding the overall racial and ethnic heterogeneity measure, there is only a modest positive relationship between immigrant racial heterogeneity and violent crime and no relationship for property crime. Thus, it appears that racial and ethnic differences among immigrant groups have little import for understanding neighborhood crime levels beyond racial and ethnic heterogeneity more generally. Other dimensions of immigrant diversity, including language diversity and, particularly, country of origin diversity, generate more significant social differences.
Finally, diversity in immigrant country of origin appears consequential for neighborhoods, as we documented strong negative effects for both violent and property crime in all models. Why is this form of immigrant heterogeneity associated with lower crime rates, even after controlling for other dimensions of immigrant heterogeneity as well as for neighborhood racial and ethnic heterogeneity more generally? As these neighborhoods include immigrant groups from diverse countries all over the world, perhaps they are uniquely vibrant spaces that attract residents from both within and outside the neighborhood because they offer a wide-variety of highly attractive amenities including restaurants, grocery stores, shopping centers, and religious and cultural organizations. 12 In this way, they may be multi-cultural hubs that draw in residents—immigrants and non-immigrants alike—all of whom share in, and enjoy, what the vibrant neighborhood has to offer. This could be particularly consequential for crime in neighborhoods that experienced significant population loss and decline post-deindustrialization, when residents moved in large numbers to the suburbs, leaving many urban neighborhoods in decline. Indeed, immigration is often credited with the “new social transformation of the American City” (Sampson 2017). It is not difficult to understand how this may especially be the case in neighborhoods characterized by substantial diversity in immigrant country of origin. Lacking data to create measures that reflect these arguments, yet again we can only speculate.
As with all research, findings should be interpreted within the context of study limitations. Chief among them is the absence of data that would enable us to directly measure the mechanisms by which dimensions of immigrant diversity matter for neighborhood crime rates. Beyond theoretical mechanisms discussed earlier, additional concepts, including culture and neighborhood vitality, likely help explain why certain dimensions of immigrant diversity matter for certain crime types—even as they are notoriously difficult to measure. This task awaits future research.
A second limitation is that we lacked information on other potentially important forms of immigrant heterogeneity, including religious diversity. Unfortunately, there is not readily available data on this (and other dimensions) for our large sample of neighborhoods. Although this may be a less important social dimension in modern U.S. society (Putnam 2000), it warrants attention moving forward, as do other types of immigrant diversity including occupational heterogeneity, family composition heterogeneity, and heterogeneity in how recently the immigrants arrived in the U.S.
A final limitation is that while our data span cities of different sizes, socio-economic and demographic contexts, and immigrant histories allowing us to capture a wide-range of neighborhoods, our approach here downplays the role that broader city context may play. The immigrant diversity-crime relationship no doubt varies by city context, with characteristics such as immigrant population size or level of immigrant diversity likely salient. Given analyses that consider this are beyond the scope of the study, we do not account for potential city effects here, even as our models estimate city fixed effects to remove all possible unchanging city effects. This task, too, awaits future research.
Limitations aside, this study offers a deeper understanding of how immigration and crime are related in the U.S. by unpacking immigration in order to capture the rich diversity that exists. As “contemporary immigration has touched many aspects of social life in the United States” (Feldmeyer et al. 2016:268), immigrant heterogeneity, including by race/ethnicity, country of origin, and language use, increasingly characterizes immigrant neighborhoods. Our study reveals the consequences of these dynamics for crime rates. A particularly important finding is that neighborhoods with a mix of immigrants from different countries have the lowest crime levels. This is at odds with the viewpoint that homogeneous ethnic enclaves are solely, or particularly, beneficial. The implication is that cities may wish to consider policies and practices that can enhance the creation and development of such diverse neighborhoods, although how this might be accomplished will need to be a focus of future research. It is possible that there is “something” about these communities which makes them more tolerant and accepting of diversity, which then allows diversity to flourish. One possible “something” is that community organizations help foster understanding and acceptance across diverse groups, thus occupying an important role in such communities. Or it may be that certain settings enhance informal interactions to foster this acceptance. Although we cannot identify the key ingredient here, our results imply that doing so moving forward will be useful for policymakers who seek to create such high diversity neighborhoods with lower crime levels.
Supplemental Material
sj-xlsx-1-jrc-10.1177_00224278251345148 - Supplemental material for Immigration and Crime: The Role of Immigrant Heterogeneity
Supplemental material, sj-xlsx-1-jrc-10.1177_00224278251345148 for Immigration and Crime: The Role of Immigrant Heterogeneity by Charis E. Kubrin and John R. Hipp in Journal of Research in Crime and Delinquency
Supplemental Material
sj-docx-2-jrc-10.1177_00224278251345148 - Supplemental material for Immigration and Crime: The Role of Immigrant Heterogeneity
Supplemental material, sj-docx-2-jrc-10.1177_00224278251345148 for Immigration and Crime: The Role of Immigrant Heterogeneity by Charis E. Kubrin and John R. Hipp in Journal of Research in Crime and Delinquency
Footnotes
Funding
The authors disclosed receipt of the following financial support for the research, authorship, and/or publication of this article: This work was supported by the National Institute of Justice, (grant number 2019-R2-CX-0056).
Notes
Supplemental Material
Supplemental material for this article is available online.
Author biographies
Appendix
References
Supplementary Material
Please find the following supplemental material available below.
For Open Access articles published under a Creative Commons License, all supplemental material carries the same license as the article it is associated with.
For non-Open Access articles published, all supplemental material carries a non-exclusive license, and permission requests for re-use of supplemental material or any part of supplemental material shall be sent directly to the copyright owner as specified in the copyright notice associated with the article.