
Abstract
Objectives: Inspired by ecological theories of crime, the aim of this study was to make use of a natural experiment to see if a U.K. soccer stadium generates or attracts crime in the area that surrounds it. Method: Data for theft and violent crime around Wembley stadium are analyzed to see if the rate (per-unit time and ambient population) of crime differ for days on which the stadium is used and those it is not. In addition, differences in the spatial and temporal distribution of crime are examined for these two types of days. Results: Analyses indicate that on days when the stadium is used, the rate of crime per-unit time is elevated, but that the rate per ambient population at risk is not. The spatial and temporal pattern of crime also clearly differs for the two types of days. For example, the level of crime is elevated in the surrounding area when the stadium is used relative to when it is not. Conclusions. The case study suggests that the facility studied contributes to levels of crime in the area that surrounds it. The research provides further support for ecological theories of crime and their utility in informing criminological understanding and policy-related questions.
Keywords
Introduction
Soccer has been associated with crime and disorder since the Middle Ages (Elias and Dunning 1971). There have been diverse attempts at explanation and prevention, which go back just as far. There has, though, been little empirical research to determine whether explanations are adequate or whether preventive measures have been effective (De Vreese 2000; Lösel and Bliesener 2003). The problems persist (Frosdick and Marsh 2005) and anecdotal evidence (Home Office 2004–2009) suggests that crime and disorder associated with the games extend outside the stadiums. In this article, we adopt an ecological approach to explanation and present empirical analyses regarding patterns of crime for the largest stadium in Wembley, United Kingdom.
Ecological approaches to crime focus on patterns in space and time. They locate their genesis in attributes of the social and physical environment in which offending takes place rather than the psychology of offenders (Brantingham and Brantingham 1984; Clarke and Cornish 1985). Moreover, the immediate environment is itself seen to be nested in a wider setting, giving rise to the immediate situation. Two related theories suggest the main constituents of the social and physical environment for soccer-related crime and disorder. According to the first, “routine activity theory,” crimes occur when a “likely offender” encounters a “suitable target” in the absence of a “capable guardian,” an “intimate handler,” or “place manager” who might otherwise restrain the offender (Eck 1994; Felson 1986; Felson and Cohen 1980). Crime patterns across space and time are deemed a function of the supply, distribution, and movement of these five types of actor.
The second, “crime pattern theory,” explains offense patterns in terms of the awareness and activity dynamics of those committing crimes (Brantingham and Brantingham 1993a). Offenders, like everyone else, are familiar with some places but not others. They tend to commit crime in places they know to provide potential targets but where they are unlikely to be recognized by others who might intervene or report them to the police. This means, for most perpetrators, places near to home, work, or other routine activity nodes. Likely targets in these places are those perceived to yield utility (Cornish and Clarke 1986) in the form of goods successfully stolen or some other nonmaterial satisfaction.
“Hot spots” (and times) of crime, such as those associated with soccer matches—and other events that large numbers of people attend in one place—may be explained in these terms. Crime pattern theory emphasizes the importance of places or facilities (see also Eck et al. 2007) that act as “attractors” or “generators” of crime (Brantingham and Brantingham 1995). Both forms of hotspot are rich in suitable targets. The conceptual distinction is between those that draw intending offenders to them because of known suitable targets (crime attractors) and those that are frequented by a population which includes offenders, who take advantage of serendipitous opportunities encountered (crime generators; e.g., Brantingham and Brantingham 1993b). Locations such as railway stations and high schools are considered crime generators (e.g., Roncek and Lobosco 1983), while both check-cashing and liquor stores function as crime attractors (e.g., Gorman, Speer, and Gruenwald, 2001; Rengert, Ratcliffe, and Chakravorty 2005). However, while these have been accepted as such, empirical research that supports their classification in this way is not unequivocal. One reason for this is that it is difficult to estimate the influence of particular facilities on crime patterns, as the facilities of interest are always present in the environment, which precludes the use of experimental methods to examine their impacts. Moreover, the reason that there may be more crime in the environment surrounding a particular facility may have more to do with the characteristics of that environment than the facility itself. This issue of causality is particularly acute given that facilities are not randomly located. Rather, retailers or other business owners tend to open facilities at strategic locations that are likely (for example) to maximize the potential for trade (Hillier and Hanson 1984). The problem is that the conditions (such as high footfall) that make a location attractive to businesses (or other facilities) may also be those that are conducive to crime. This type of confound is difficult to rule out without using (quasi) experimental methods, and these have hitherto rarely been used in this kind of research (but for analyses of the introduction of new transport facilities, see Billings et al., 2011; Ligget et al., 2003).
It is conjectured here that soccer matches (and other stadiums events) comprise a distinct place-and time- specific crime attractor/generator. Unlike other types of entertainment facilities, the activity that takes place within soccer stadiums, and hence the effect they have on the ecology of the surrounding area, is episodic occurring on only a fraction of days at specific times. We suggest that this creates conditions that approximate a natural experiment, which facilitates the estimation of levels of crime and disorder on days when the stadium is closed to act as a counterfactual against which to compare patterns on days when it is used.
The remainder of the article will use Wembley Soccer Stadium (United Kingdom) as a case study to explore the usefulness of the ecological theories discussed in explaining patterns of crime and disorder associated with soccer matches and other events. Wembley hosts not only soccer matches but a range of other event types, including concerts and other sporting events. These are attended by different populations, which result in different conditions, and hence different expectations for potential crime problems. Accordingly, two major categories of crime event were analyzed: violent and theft and handling offenses (‘handling’ in England and Wales refers to the receipt of stolen goods). The distinction between violent crime and theft and handling offenses was made because each has its own motivations and precipitators. For example, a precipitator of theft may be opportunity due to lack of supervision (Engstad 1975; Mustaine and Tewksbury 1998) while precipitators of violence in this context may include provocation from opposing fans’ chants (e.g., Rotten et al. 1978; Russell 2004).
Our approach is important for two reasons: (1) It is the only empirical study we know of that has examined patterns of crime around a soccer stadium; and (2) although crime pattern theory was formulated decades ago, empirical research concerning the attractor/generator hypothesis is limited or has been subject to methodological difficulties (see above). Moreover, in previous research, in the absence of suitable denominators, scholars have tended to examine the change in the frequency of crime around facilities but not in the associated rates, and when rates have been considered these are typically calculated using the residential household population provided in national censuses (see Andresen and Jenion 2010).
In the current study, we use measures of the ambient population in combination with attendance figures from soccer matches and other events to estimate meaningful denominators thereby allowing us to examine both changes in the frequency and rate of crime on days when the stadium is used and those when it is not. This allows a more nuanced examination of patterns than is possible with simple counts of crimes. To elaborate, in terms of hotspot typologies, Clarke and Eck (2003) define an area or facility as a crime generator if it has a high count of crime but a low rate per population at risk. In contrast, crime attractors are defined as those areas or facilities that experience a high volume and rate of crime (per population at risk). In the current study, our interest is for a facility that has only episodic use. Thus, we define such a facility as a crime generator if, relative to the days on which it is not used, (on days which it is) it has an elevated count of crime but the rate of crime per ambient population at risk remains unchanged (or is lower). In contrast, we define such facilities as crime attractors if, relative to days on which they are not used, on the days that they are, both the count and rate of crime are elevated. Following from this rationale, the first two hypotheses articulated below refer to the dominant mechanism liable to lead to elevated crime levels, while the third represents the possibility that both mechanisms operate simultaneously:
The mostly crime attractor hypothesis. Events at stadiums attract large numbers of likely offenders who wish to take advantage of the opportunities furnished, either in terms of the suitable targets for property crime (large numbers of preoccupied people, unfamiliar with their surroundings and with attractive goods about their persons) or in terms of suitable targets for violent crime (notably fans of opposing teams). According to this hypothesis, we would expect an increase in crime to be associated with soccer matches and events and this to exceed the (proportional) increase in the ambient population.
The mostly crime generator hypothesis. Events attract large numbers of people some of whom are likely offenders for violent or property crime, some of whom are suitable targets for violent or property crime and some of whom are capable guardians of the otherwise suitable targets for crime. When the likely offender meets the suitable target in the absence of a capable guardian, offenses are likely to take place. According to this hypothesis, an increase in crime will be associated with soccer matches and events but that increase will be less than or proportional to the increase in the ambient population.
The simultaneous crime generator/crime attractor hypothesis. Many events and places that act as crime generators may also act as crime attractors: What furnishes ample opportunities for the offender who happens to be at a location may also attract offenders aware of the available opportunities. Thus, soccer matches and events may simultaneously act as both crime attractors and generators. This would be demonstrated (for example) by an increase that exceeds the proportional change in ambient population for one crime type along with increases that are less than or equal to the increase in ambient population for others.
As discussed, the analyses reported here are for the new Wembley Stadium. Located in North London (United Kingdom), the stadium opened in 2007 and seats 90,000 spectators. It is owned by the Football Association (the governing body for English soccer) and hosts major national and international games as well as a range of other types of event. In the sections that follow, we discuss the data used, our analytic strategy and results, and conclude by discussing the implications of the results for criminological understanding and public policy.
Data and Method
We use three distinct data sets, as follows:
Timing of matches and other events—The Wembley Stadium website was used to compile a set of dates, times, and attendance figures (http://www.wembleystadium.com) for each soccer match and non-soccer event that took place at the stadium between March 2007 and November 2009. Over the period for which data were analyzed, there were 42 days when soccer games were played, and 36 when events other than soccer matches were held at the stadium. For the events there were a total of 21 concerts, seven rugby matches, three American football games, three charity events, one automobile race, and one track and field event. The website also provided specific information about how spectators could commute to the stadium via public transport which provided us with a detailed study area (see Figure 1).
Crime data—The Metropolitan Police Service (MPS) provided three years (2007 to 2009) of crime data geocoded to a spatial resolution of 1 m. The MPS data related to incidents in the three municipal areas within which the stadium and four subway stations serving it are located (see Figure 1). The total area amounts to 6.76 km2, with the boundary being up to 3.15 km from the stadium. The geocoded crime data for all three municipal areas are used to examine whether differences exist in the overall counts of offenses, the spatial and temporal distribution of offenses and as the numerator for the calculation of day-specific crime rates to help classify the stadium in terms of the hotspot typologies discussed above. The data analyzed were for days when soccer games were played, days when other events were held at the stadium, and days when neither occurred.
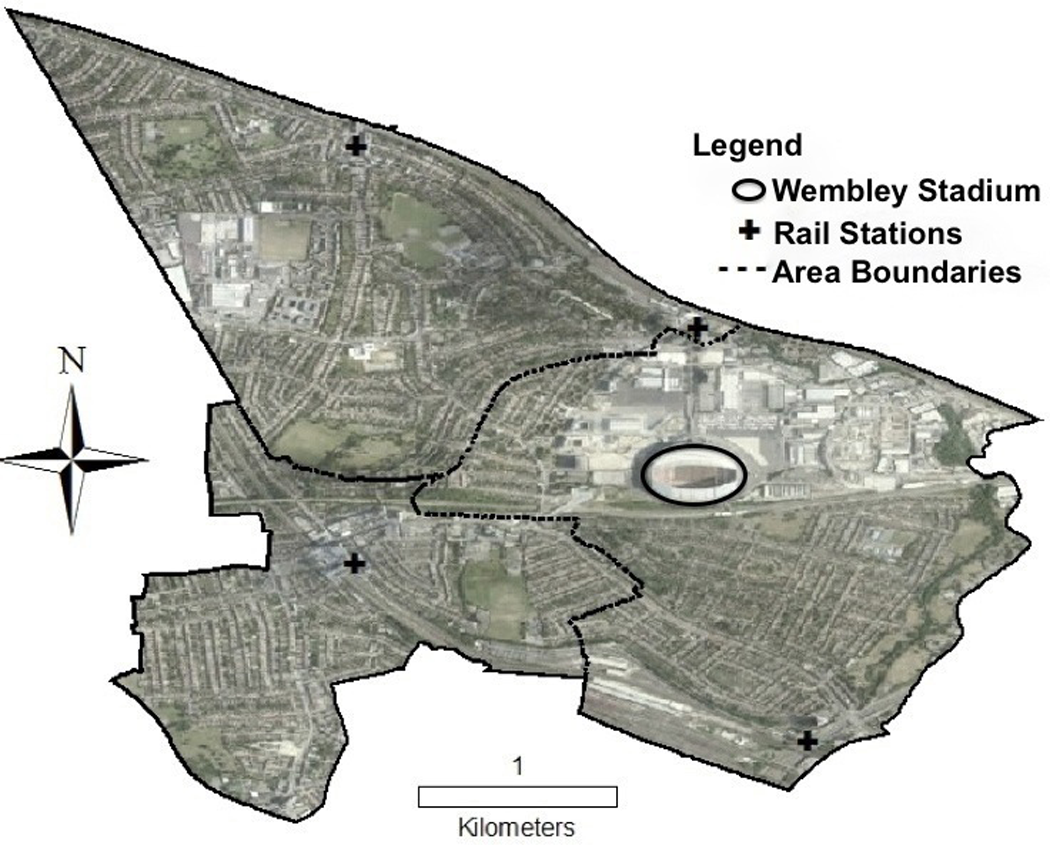
Map of the three wards (municipal areas) that make up the study area and the location of the rail stations that service Wembley National Stadium.
The data analyzed are for violent crime and theft and handling offences—two of the nine (burglary, criminal damage, drug offences, fraud and forgery, other notifiable offences, robbery, sexual offences, theft and handling, and violence against the person) categories of offenses that police forces in England and Wales are required to record by the Home Office. The violent offenses analyzed exclude sexual offenses, robbery and homicide, and hence quite specifically relate to violence against the person. The offence theft involves the taking of property from a person without the threat of, or actual violence. The offense of handling criminalizes any dishonest dealing with property acquired through theft and is roughly equivalent to the possession of stolen property in the United States or the possession of property obtained by crime in Canada.
Estimates of the ambient population—U.K. census data provide an estimate of the number of people who live in an area, but this may be quite different to the on-street population. We therefore calculated the typical ambient population for the entire study area using LandScanTM data. Generated by the Oak Ridge National Laboratory using Geographic Information from a range of sources including remote sensing data, these provide an estimate of the ambient population of an area (averaged over 24 hours) at a spatial resolution of approximately 1 km2. Using a Geographical Information System, we identified each of the 1 km2 grid cells located wholly or partly within the boundary of the three municipal areas (Figure 2). Employing this method, an estimated ambient population of 40,048 was used as the denominator for calculating crime rates on comparison days.
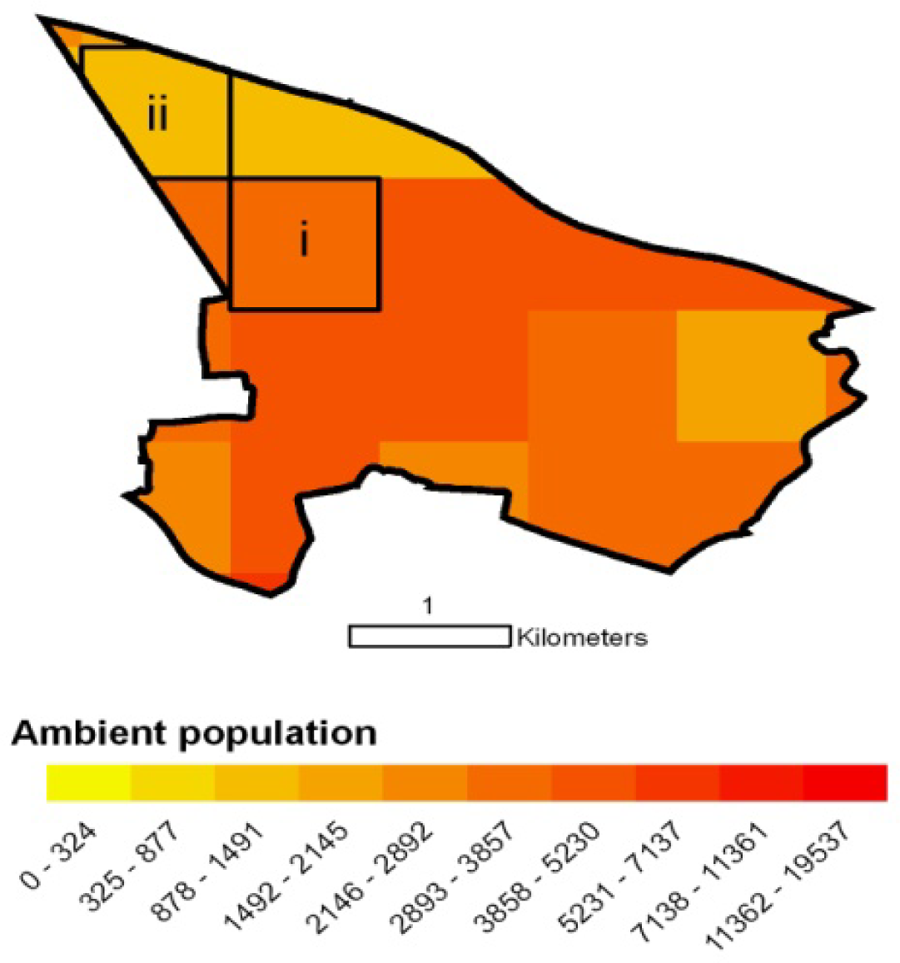
Map of estimates of the ambient population. (i) Comprises an example of a 1 km2 cell completely encapsulated by the boundary. For such cells, the total estimated population in that cell was added to the area-level count of the ambient population. (ii) Comprises an example of a cell that is only partially within the area boundary. For such cells, we allocate A/C (where, A is the area of the cell that is within the boundary and C is the constant 1 km2) of the estimated population for that cell to the area-level estimate. Note that this assumes that the population is uniformly distributed across each cell. This may be an unreasonable assumption, but in the absence of an alternative this was the approach used.
For match and event days, we also obtained figures of the numbers of tickets sold. For match days, the average number of tickets sold was 69,090 (SD = 23,059), while for event days it was 71,871 (SD = 17,776). LandScan data do not include counts for intermittent populations such as users of a stadium and therefore for match and event days, we sum the number of tickets sold for that event and the LandScan counts to provide a general estimate of the population at risk for each day. The rate of crime was then estimated by simply dividing the offense count for that day by the revised estimate of the ambient population for match and event days.
Analytic Strategy
To estimate the effect that soccer matches or events might have on spatiotemporal patterns of crime, a set of comparable days on which neither matches nor other events occurred were identified. To do this, for each match or event day, we identified the same day of the week seven days before or after that event. If no match or event had occurred on either date, and if neither day had already been selected as a comparison day for another match or event, the earlier date was selected as the comparator to leave sufficient comparison days for matches and events that occurred at a later date. However, if both dates were unavailable due to a match or event taking place on them, or because they had been previously selected as a comparator, then the search for a comparator day was extended to a fourteen day interval. If still no suitable comparator was identified, the search was expanded to twenty-one days and then to twenty-eight days. Using this approach, comparator days were identified for all soccer matches and events. This approximates a natural experiment. It was not possible, of course, to randomly assign match and non-match, event and non-event days. Instead, natural variation in the dates of their occurrence was used, making best-available comparisons for each pair. The downside of this, of course, is that some unknown systematic bias may have been introduced. The upside is that there can have been no adaptation by key agents to the understanding that an experiment was being conducted. Because there may have been some unknown bias, further predictions for the distinct expected signatures of event and soccer matches were also examined. These related to the times within the day when crime events were recorded and where they took place.
To examine differences in the spatial distribution of crime for match and non-match days, we computed the distance of each crime from the stadium so that we could see if the spatial pattern varied for match and event days, and their comparators. In conducting the analysis, we were interested in differences in the actual distributions rather than the central tendency of them. For this reason, a comparison of the mean distance that events occurred from the stadium for the four types of day would not be particularly informative. A number of statistical tests could be used to examine differences in the distributions. As the data are for offense counts, a χ2 test could be used, with the categories of the contingency table representing different spatial intervals (e.g., 0–200 m, 201–400 m, etc.) from the stadium. However, a disadvantage of it is that we would have had to categorize offenses as occurring within particular predefined—and essentially arbitrary—spatial bandwidths of the stadium. Changing the exact bandwidths used could affect the sensitivity of the test and may even lead to very different conclusions.
For this reason, we used the Kolmogorov–Smirnov (Lilliefors 1967) or KS test, which is not subject to the problem discussed above. The approach to analysis is to first construct an empirical cumulative distribution function (ECDF) for a particular variable (X) for each sample (i) of interest. In our case, X is a vector that contains the distances that the crimes considered occurred from the stadium. For each possible value of X, the relative frequency (or fraction, f(x)) with which a value equal to or less than x is observed is computed. The values of f(x) for any sample will thus range from some minimum value to 1. To examine the distributions, the f(x) values are plotted against the rank-ordered values of X for sample i. As illustrated in the left panel of Figure 3, two ECDFs are compared by computing the maximum absolute difference (D max) between the f(x) values for every possible value of X. Large absolute differences suggest that the two samples may be drawn from different populations. The null hypothesis is tested by comparing the observed D max with a distribution of expected values generated by assuming that the two samples are drawn from the same population. The latter can be found in statistical tables or derived more directly using a permutation test. We use the latter, because this minimizes the distributional assumptions required (Massey 1951).
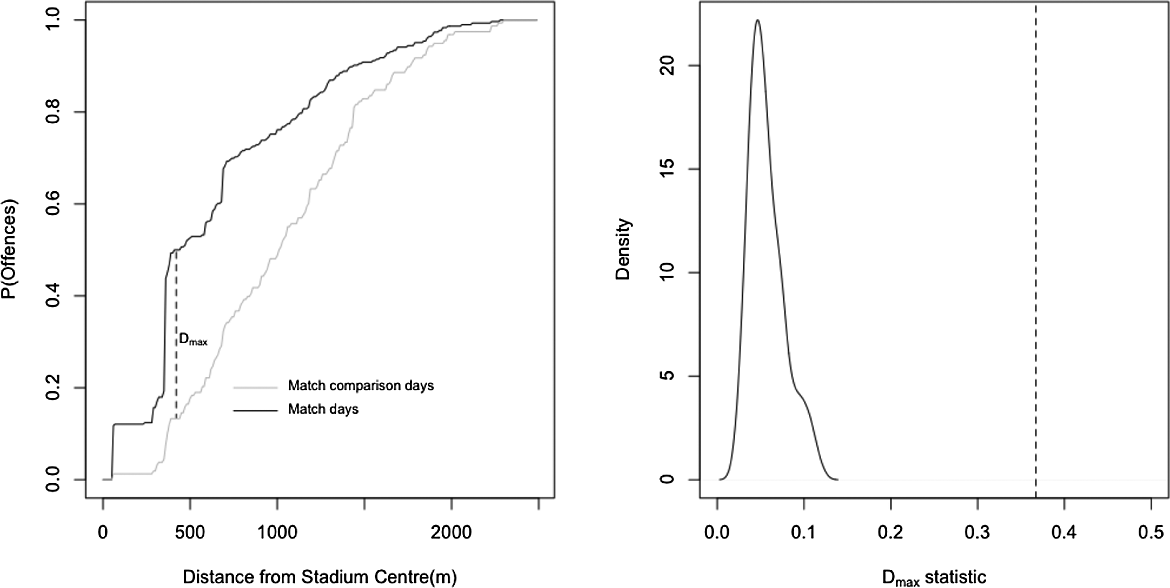
An example of how the D max test statistic is calculated (left panel), the distribution for the expected distribution (right panel) computed using the permutation approach described in the text, and the observed value (dotted vertical line).
The principle for generating the expected distribution for D max is as follows. All of the distances at which offenses occurred from the stadium are stored in a single vector. Two samples are then drawn from this vector using a uniform, a random number generator (without replacement). The size of the samples is the same as for the observed sample sizes. These represent the distributions for the match and non-match days, generated assuming the null hypothesis that the distribution of crimes does not differ for the two different types of day. An ECDF is then generated for each of the two randomly selected samples and the D max value calculated. A Monte Carlo (MC) simulation is used to generate 999 pairs of samples from all those possible and a sampling distribution for the expected values of D max generated. The statistical significance of the observed value of D max can be estimated using the formula described by North, Curtis, and Sham (2002):

where, r is the number of D max values for the permuted data that are at least as large as the observed D max value, and n is the number of permutations used (in this case 999). To illustrate the approach, the left panel of Figure 3 shows two ECDFs and the associated value of D max. The right panel of Figure 3 shows the distribution of the expected values of D max generated using 999 iterations of the MC simulation and assuming that the null hypothesis is correct. In this case, the observed value of D max of .36 was so extreme that a value at least this large was never generated by the MC simulation. For such a case, the probability of observing a value at least this large—assuming the null hypothesis—would be .001.
Results
Counts and Rates of Offenses
Table 1 shows the overall count of crimes for each of the four types of day, the mean count for each type of day, and the mean rate of crime per ambient population. On average, more theft and handling offenses were recorded for event than match days. For violent offenses, the pattern was reversed. Nonparametric permutation tests confirmed that, on average (see Appendix), more crimes of both types occurred on match days (both p’s < .001) than on relevant comparison days. For event days, relative to the comparison days, significantly more theft and handling offenses occurred (p < .002), but the number of violent offenses did not differ significantly (p = .066).
Mean Counts and Rates of Recorded Offenses per 10,000 Persons on Days When Soccer Matches, Events or Neither Occurred.
Note: Mean (
* p ≤.01, ** p ≤.001.
For match days, non-parametric permutation tests suggest that the rate of theft and handling offenses (Table 1) was significantly lower than on the relevant comparison days (p < .001), whereas for violent offenses, the rates did not differ significantly (p > .14). For event days, the rates were significantly lower on event days than the relevant comparison days for both types of crime (ps < .001).
The Temporal Distribution of Offenses
Soccer matches and other events tend to occur at particular times of the day, and so (if the null hypothesis is incorrect) compared to days on which the stadium is unused, the likelihood of crime occurrence should differ systematically over the course of the day for match and event days. To examine this, for each of the four types of day we aggregated the data and calculated the number of offenses that occurred within each hour h (or earlier) for each type of offense and generated an ECDF for each. Hypothesis testing was then conducted in the same way as described for spatial patterns.
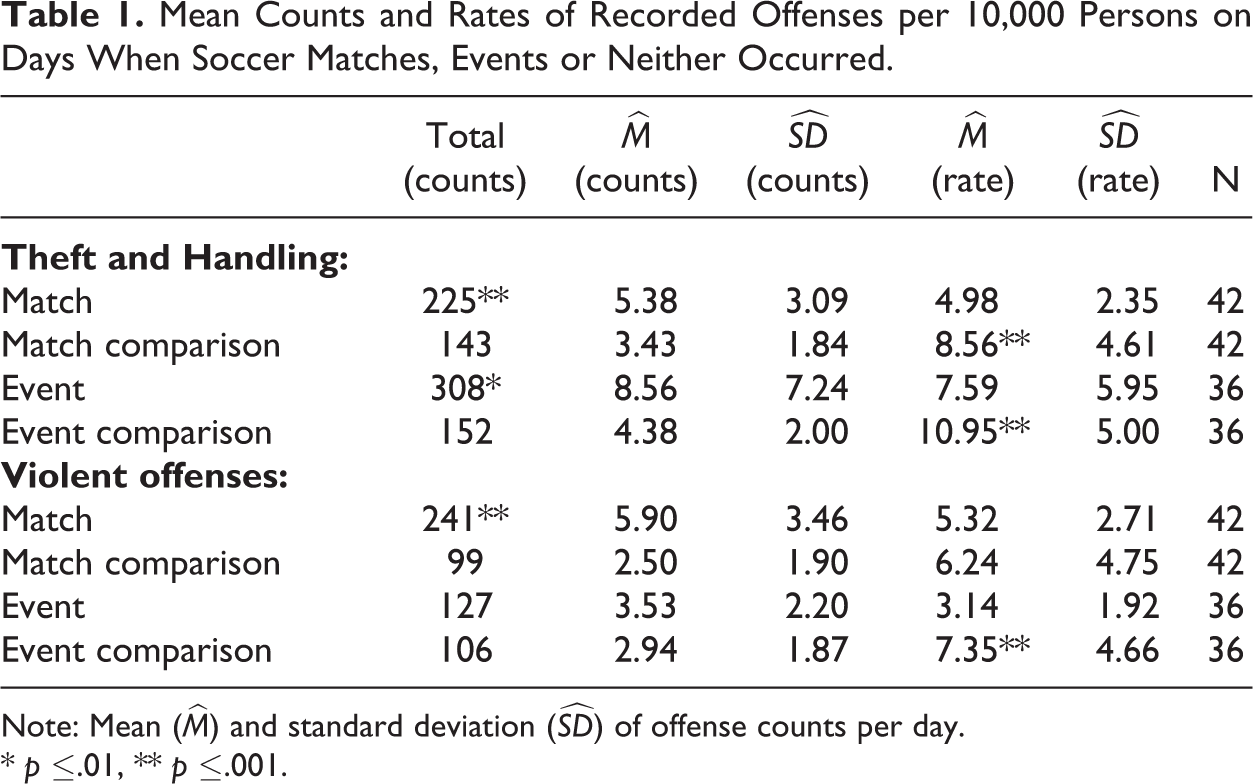
The top two panels of Figure 4 show the ECDF respectively for theft and handling and for violent offenses across the day for match versus non-match and event versus non-event days. It can be seen that on the match and relevant comparison days, the temporal distributions did not differ significantly for theft and handling offenses (Kolmogorov–Smirnov D = .095, p = .214). However, theft and handling offenses tended to happen later in the day on event days than their relevant comparators (Kolmogorov–Smirnov D = .313, p < .001).
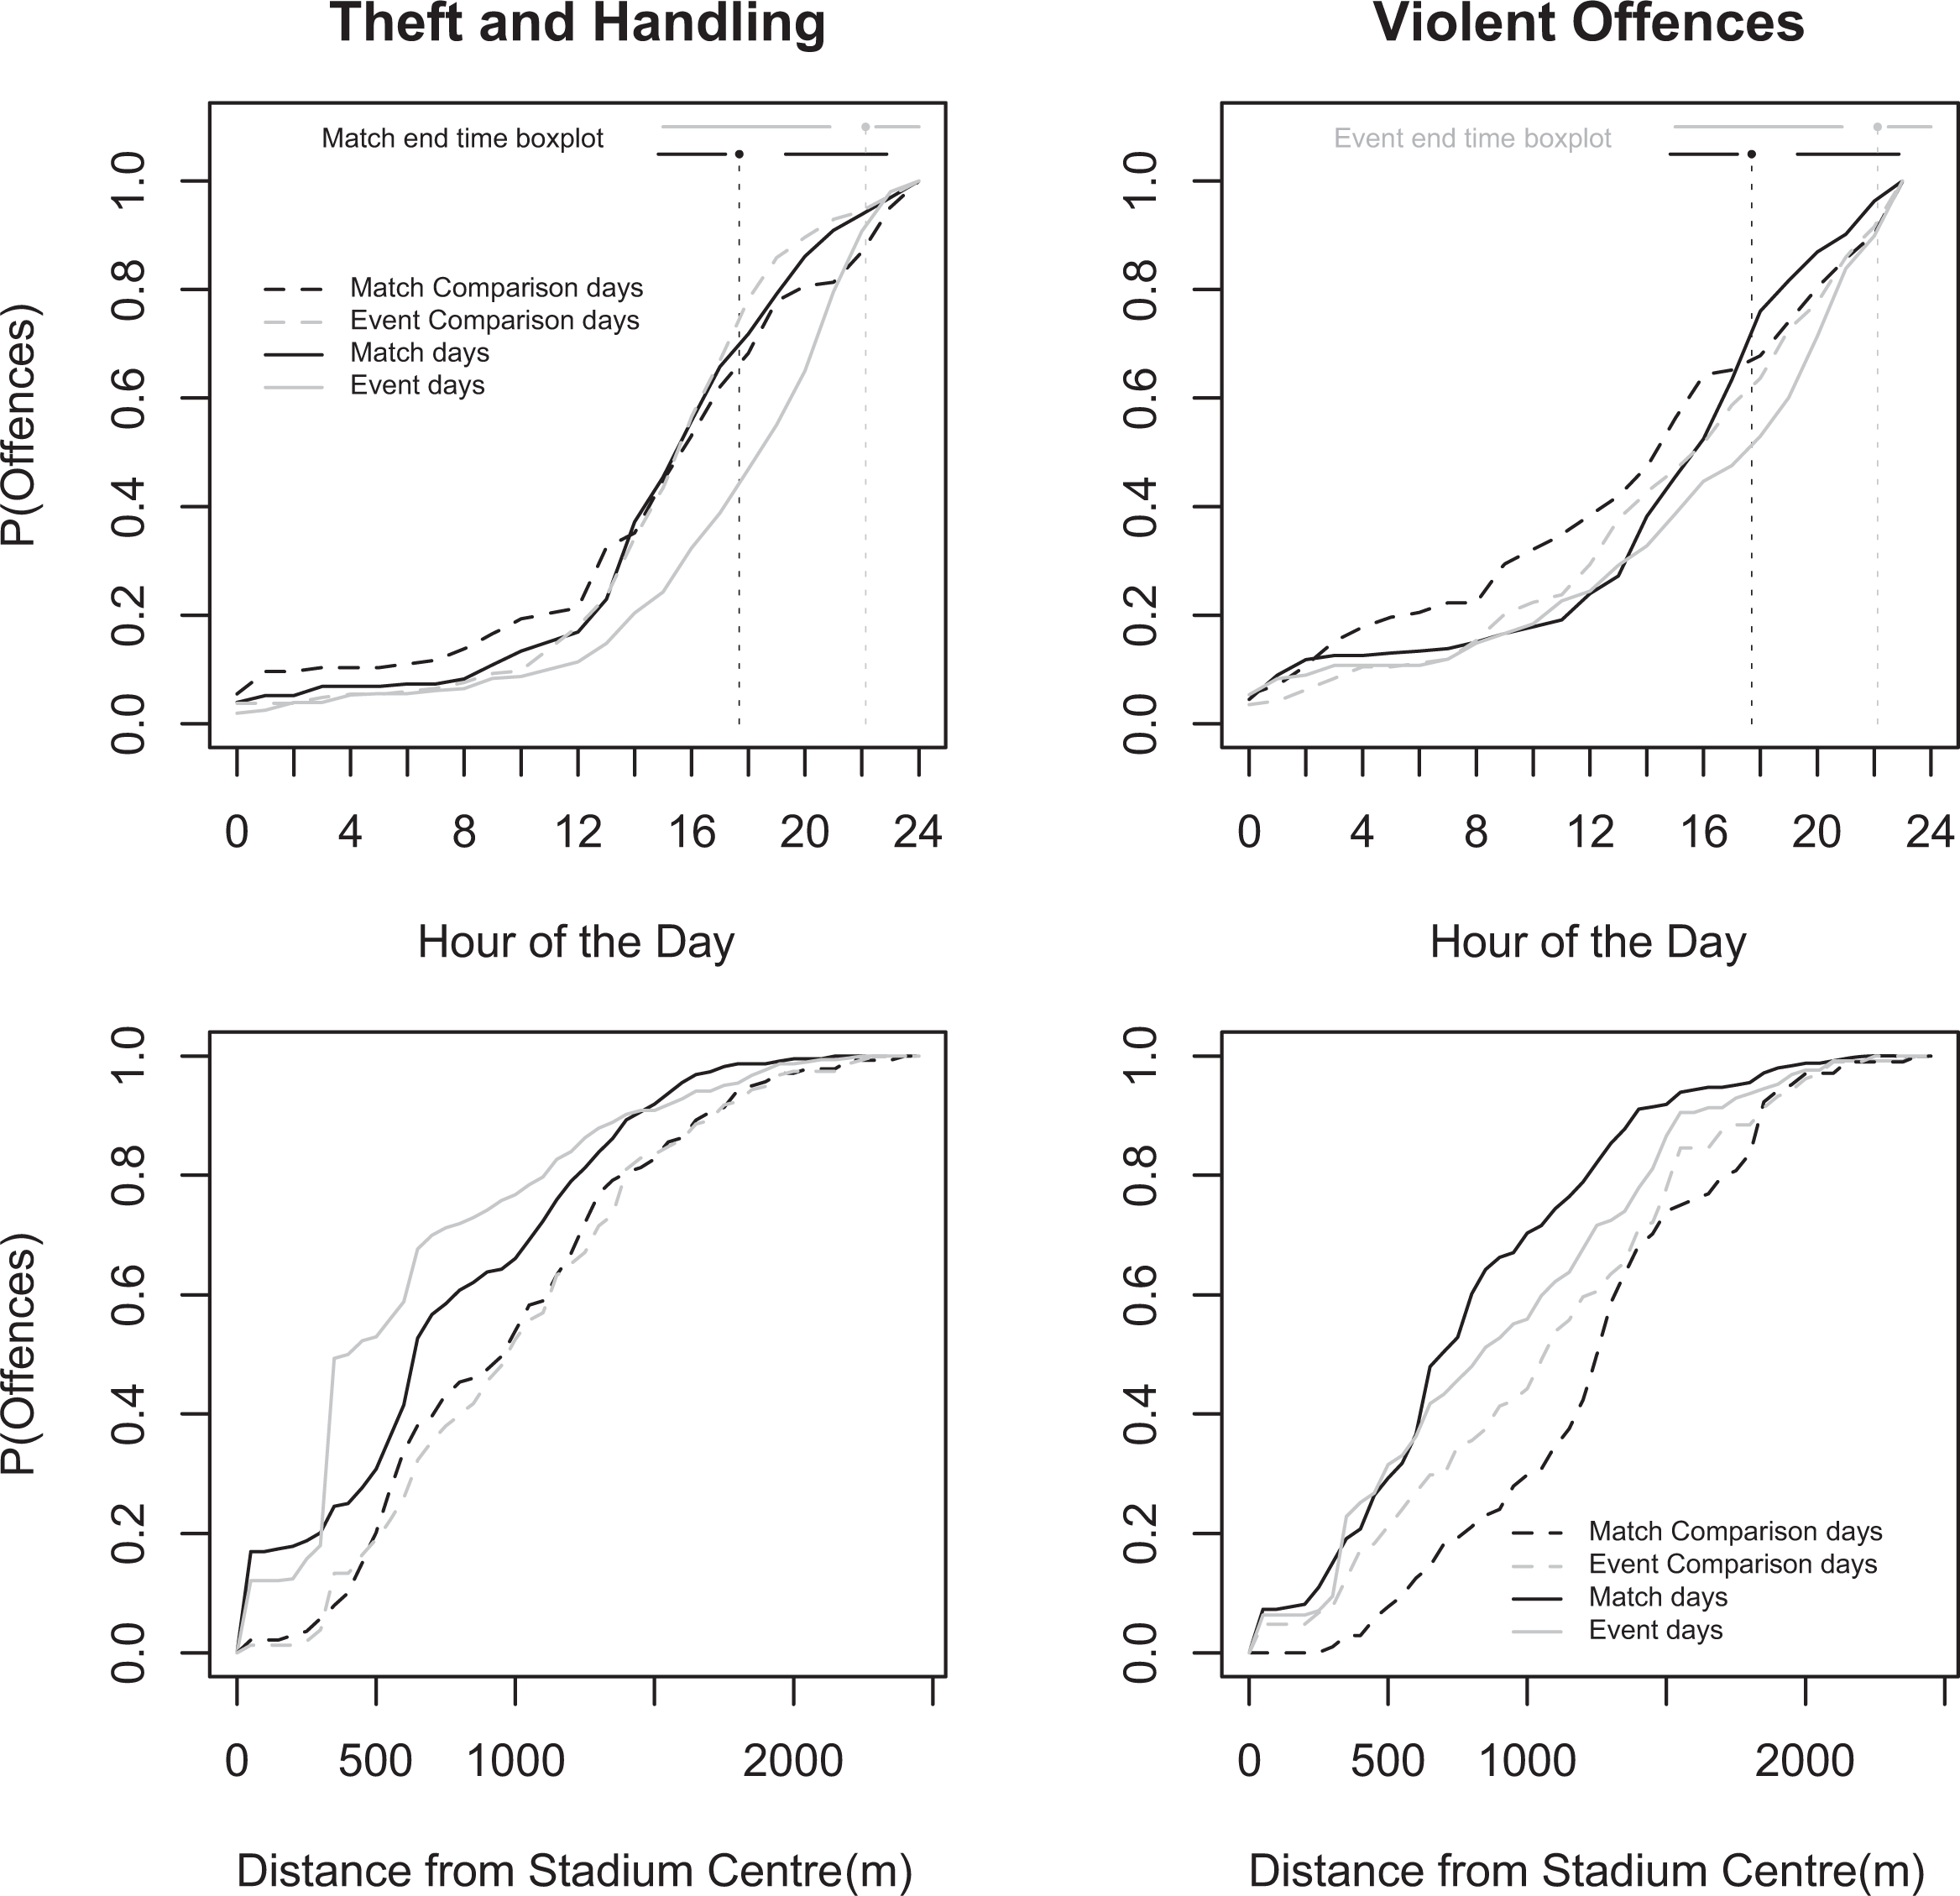
The empirical cumulative distribution function (ECDF) for the two categories of crime (and boxplots for the end times of matches and events).
The boxplots embedded in the top two panels of Figure 4 summarize the distribution of end times for soccer matches and events. It is clear that events tended to (start and) end later than matches. In the case of theft and handling offenses, it is evident that on the comparison days, less than 20 percent of offenses occurred after 6 pm, whereas on the event days more than 50 percent did. Thus, it would appear that on event days, the timing of offenses coincided with the start and end times of events.
For violent offenses, permutation tests suggested that there was no significant difference (Kolmogorov–Smirnov D = .126, p = .101) between the distributions for the event and relevant comparison days. For match days, however, the distribution differed significantly from the pattern for comparison days (Kolmogorov–Smirnov D = .157, p < .025). In this case, incidents of violence occurred with a greater probability around the typical match end time (or shortly before) than they did on the comparison days.
The Spatial Distribution of Offenses
If the observed patterns were associated with activities at the stadium, a difference in the spatial distribution of crimes would also be expected. In particular, relative to days on which the stadium is unused, increases would be expected closer to it on days that events of any kind occur. To examine the spatial distribution of offenses, the distance between each crime—that occurred on one of the four types of day of interest—and the center of the stadium was computed. The bottom two panels of Figure 4 show the ECDFs for the two categories of crime. Relative to the comparison days, a higher proportion of theft and handling offenses occurred near to the stadium on match (Kolmogorov–Smirnov D = .171, p < .025) and event days (Kolmogorov–Smirnov D = .367, p < .01). In line with expectation, the effect was more pronounced for the latter with almost 60 percent of crimes occurring within 500 m of the stadium (compared with approximately 20 percent on the relevant comparison days). Relative to the appropriate comparison days, a higher proportion (approximately 4 times as large for crimes that occurred within 500 m) of violent crimes occurred near the stadium on match days (Kolmogorov–Smirnov test D = .422, p < .01), but for event days the distributions did not differ significantly (Kolmogorov–Smirnov test D = .137, p = .151).
Discussion
The research reported here tests a series of hypotheses relating to levels and rates of crime, as well as the spatial and temporal distributions of offenses around Wembley Stadium. The hypotheses were drawn from ecological criminology, making use in particular of the crime attractor and crime generator typology. The novelty of the work relates to: (1) the attempt to bring empirical evidence to understanding the nature of a problem that goes back to the Middle Ages; (2) the measurement of levels of crime attraction and generation, which are often referred to in the literature but seldom quantified; (3) the use of LandScan data to help estimate street level ambient populations as a more realistic basis for measuring rates of street-level offenses; (4) the exploitation of conditions approximating a natural experiment in theory testing; and (5) the conduct of criminological research that has direct use value.
In general, the results suggest that levels of crime are elevated on those days that the stadium is used. Moreover, differences in the spatial and temporal distribution of crime on days when the stadium is used and those when it is not are consistent with the idea that the observed increases in the overall level of crime are associated with the use of the stadium. However, while the probability of crime per unit time appears to be elevated, the rate of crime per population at risk does not. In fact, if anything, the rate of crime per population at risk tended to be lower on days when the stadium was used than when it was not. Consequently, we suggest that the increases in crime observed around the stadium are most likely due to the facility episodically generating rather than attracting crime. That is, stadiums, whether they are used for soccer matches or any other type of event, are places to which large numbers of people gravitate for reasons unrelated to criminal motivation, a proportion of whom are liable to take advantage of criminal opportunities they happen to come across. Moreover, just as some of those who visit comprise likely offenders, others will furnish suitable targets, or act as intimate handlers or capable guardians. That we find an elevated number of crime events but a lower rate in relation to the potential victim population would suggest that the increased supply of intimate handlers and capable guardians, together with place management within the stadium, does more to contain the potential offenses produced by the influx of visitors to the area than the increased supply of likely offenders and suitable targets does to attract them. “Place management” in Wembley Stadium is provided primarily by stewards (private-contract security staff) who work within the stadium to handle turnstiles, assign seating, separate opposing sets of fans, and provide stage or field security. It is also provided by other staff members such as food and drink vendors who may intervene directly or call for security when violence is about to, or has already occurred (Madensen and Eck 2008).
Considering the role of informal guardianship, it is possible that we observe a lower rate of crime when the stadium is used because with increased population density comes increased natural surveillance (Jacobs 1961; see also, Johnson and Bowers 2010) and mutual guardianship. In the current study, it was not possible to tease apart the relative contributions of place managers and informal guardianship on crime, but future research may seek to do so using observational or other methods. For instance, to examine the role of informal guardianship, such research might seek to determine whether there is a negative association between ambient population density and crime rates at such facilities.
It is important to note that in the analyses of crime rates presented here, we use data that are aggregated over the course of the day. The reason for this is that the estimates of the ambient population used—particularly that proportion based on the LandScan data—relate to a typical 24-hour period rather than for specific hours of the day. However, it is evident from the analysis of the timing of offenses that the risk per unit time varies over the course of the day, being highest around the time that events take place at the stadium. Thus, in absence of the analysis of how crime rates vary over the course of the day it may be unwise to rule out the crime attractor hypothesis on the basis of the available data.
Similarly, we aggregate the data spatially, conducting our analyses for the three administrative areas that surround Wembley stadium. In the event that the stadium influences the risk of crime at those locations that are nearest to it, by including in our analysis data for crimes that occurred farther away, our estimates of the impact of the stadium on crime may be diluted. This too would have implications for the crime generator/attractor hypothesis.
We do not explore variation in crime rates at a more micro level here for two reasons. The first is a practical issue and concerns our estimate of the ambient population. That is, the LandScan data are not currently available at a spatial scale finer than 1 km × 1 km and so the analysis of crime rates at a lower level of resolution would be problematic. The second is a theoretical (more important) issue. Unlike smaller facilities such as a bar whose influence on crime might be expected to be rather localized (see Groff 2011; Ratcliffe 2011, 2012), Wembley stadium is a large facility that attracts a substantial number of people, all of whom—given the locations of transport nodes—to reach the venue, have to move through the wider area that surrounds the stadium. Consequently, we consider it reasonable to assume that any influence the stadium has on crime should extend to the wider environment within which it is located, and hence that patterns should be examined at this scale. Notwithstanding this, further research that examines patterns at a more micro level, and seeks to explore whether the risk of crime is particularly affected in some environs more than others would be a fruitful avenue for future research.
In any event, what the analyses demonstrate is that the probability of offenses taking place per unit of time around the stadium is higher on match or event days. The analyses of the spatial distribution of offenses also suggest that the increase extends for some distance beyond the perimeter of the stadium. For example, Figure 4 suggests that in the case of violent offenses, relative to non-match days, on days when matches are played, there are proportionally more offenses up to about 1.5 km from the stadium (i.e., on match but not comparator days, a very small fraction of incidents of violence occur between 1.5 and 3 km of the stadium). Given the change in the ecology of the wider area within which the stadium is located, and the location of the transit stations with respect to the stadium (see Figure 1), this is perhaps not surprising and supports our decision to examine the variation in crime rates across the wider area.
With respect to the spatial analyses, it is important to comment upon the likely accuracy of the geocoordinates associated with the offenses. For crimes where an offense takes place at a very specific location, such as a burglary, geocoding tends to be highly accurate as the victim will be able to report the exact location of the crime, and databases of building locations are typically very good (Ratcliffe 2001). For crimes that occur at on street locations, geocoding may be less accurate. This is often simply because the victim is unable to provide an exact location. Given the types of crimes considered, geocoding accuracy may be a potential issue here. However, geocoding accuracy is largely a function of the geography concerned. That is, it is a function of the extent to which it is possible for victims to identify and differentiate between different locations, and for police recording systems to be able to index crimes to these. For comparative studies for which different areas are considered, geocoding accuracy may affect the reliability of inferences made, as the factors that influence geocoding accuracy may vary across different areas. However, in the current study, we suggest that this issue is minimized as the geography is the same for the comparisons made; the only thing that differs systematically is whether the stadium is used or not.
The findings of this study are important from a policy perspective as in the United Kingdom, at least, the police assess the probability of disorder for each professional soccer game and deploy resources accordingly. The soccer clubs are required by law to make a financial contribution to the costs of such policing, but typically only for resources deployed within a range of 100 m of the stadium boundary and for a period of 3 hours before and after the game. Levels of payment have been contested in newspapers (League reject call over police costs 2008), on television (Cockin 2008) and in the court of law (High Court of Justice, Greater Manchester Police v Wigan Athletic 2007); yet, little evidence has hitherto been available regarding the level and distribution of crime and disorder associated with soccer matches to inform such negotiations. The approach taken here provides one way of estimating the distance over which events that take place at stadiums might impact upon crime levels, and when they might do so. And, consequently, the methods described provide an approach to assembling an evidence base that could be used to determine the financial contribution that professional soccer clubs should make to the costs of policing games of soccer. The present results suggest that the criminogenic effect of the stadium extends considerably beyond a buffer zone of 100 m. A limitation of the study, of course, is that it makes use of data for only one stadium. Consequently, future research might examine crime patterns for a sample of stadiums, and may explore the extent to which these vary given the characteristics of the wider environment within which stadiums are located. Such research might also compare patterns for stadiums that are soccer-centric with those that are event-centric.
In conclusion, in this study we have examined the extent to which an example of one type of major facility influences patterns of crime in the area that surrounds it. We suggest that there is no doubt that it does affect levels of crime, even though this is an unintended consequence of the facility. Given that the timing of the elevation in crime risk (per unit time) is associated with a large change in the ambient population of the area, our findings provide further support for ecological theories of crime and their utility in exploring and explaining patterns of crime.
Footnotes
Appendix
Declaration of Conflicting Interests
The authors declared no potential conflicts of interest with respect to the research, authorship, and/or publication of this article.
Funding
The authors disclosed receipt of the following financial support for the research, authorship, and/or publication of this article: This study was funded by the Government Office for London (“Analyses of late weekend kick-offs at premier football matches and its possible link to increased levels of alcohol-related ASB and disorder”, GOL/04-09/10).