
Abstract
We examine whether harvest-time transitory shifts in employment and income lead to changes in political violence and social unrest in rice-producing croplands of Southeast Asia. Using monthly data from 2010 to 2023 on over 86,000 incidents covering 376 one-degree cells across eight Southeast Asian countries, we estimate a general increase in political violence and a decrease in social unrest in croplands with rice production during the harvest season relative to the rest of the crop year. In a finding that is least sensitive to alternative model specifications and data subsetting, we estimate a 9% increase in violence against civilians in locations with considerable rice production compared to other parts of the region during the harvest season, relative to the rest of the year. We show that the harvest-time changes in conflict are most evident in rural cells with rainfed agriculture. Using location-specific annual variation in growing season rainfall, we then show that the harvest-time increase in violence against civilians occurs in presumably good harvest years, whereas increase in battles between actors of political violence follows growing seasons with scarce rainfall. The harvest-time decrease in social unrest, protests in particular, occurs after presumably bad harvest years. These findings contribute to research on the agroclimatic and economic roots of conflict and offer insights to policymakers by suggesting the spatiotemporal concentration of conflict as well as diverging effects by forms of conflict at harvest time in the rice-producing regions of Southeast Asia.
Introduction
In low- and middle-income countries, a small change in people’s income may trigger behavioral responses, some of which may be unlawful as well as violent. While it is common for such incidents to occur in cities, where most people and the state administration reside (Hendrix and Haggard, 2015; Smith, 2014), social conflict is not just an urban phenomenon. Rural areas, which typically encompass territories with limited state capacity, also experience conflict due to changes in income and employment. Mounting empirical evidence points to a connection between agriculture and conflict (Koren, 2018; Linke and Ruether, 2021; McGuirk and Burke, 2020; Vestby, 2019; Wischnath and Buhaug, 2014), wherein agricultural output is considered a mechanism connecting climate shocks with conflict (Buhaug et al., 2015; Buhaug and Von Uexkull, 2021; Burke et al., 2009; Crost et al., 2018; Dell et al., 2014; Hsiang et al., 2013; Koubi, 2019; Von Uexkull et al., 2016; Vesco et al., 2021).
Does conflict intensify at harvest in locations with crop agriculture? The answer to this question is not trivial because of the complex set of motives governing this relationship through multiple channels. There is a burgeoning literature linking agricultural income with political violence and social unrest (e.g. Hendrix and Salehyan, 2012; Koren and Bagozzi, 2017; Koren and Schon, 2023; Linke and Ruether, 2021), often concluding that conflict can lead to food insecurity, and that agricultural shocks are associated with changes in the frequency and intensity of conflict.
To address the research question, we examine over 86,000 incidents across eight Southeast Asian countries during the 2010–2023 period. In our most robust finding, which is least sensitive to alternative model specifications and data subsetting, we estimate a 0.036 increase in incidents of violence against civilians. This accounts to a 9% increase in conflict relative to its baseline levels, in locations with considerable rice production compared to other parts of the region, during the harvest season relative to the rest of the year. By focusing on the specific time of the year in locations with a relative surplus of agricultural spoils, and by separately analyzing incidents involving organized armed groups engaged in political violence and unorganized groups engaged in social unrest, we present suggestive evidence that the harvest season presents rapacious groups with an opportunity to seize or destroy agricultural output. In support of this evidence, we also show that the effect primarily stems from rural areas with rainfed agriculture.
This study contributes to our understanding of the relationship between agriculture, climate, and conflict in several respects. First, the literature on the agricultural roots of conflict is equivocal (Berman et al., 2011; Crost and Felter, 2020; Grasse, 2022; Koren, 2019; Koren and Bagozzi, 2017; McGuirk and Burke, 2020), in part because agriculture and conflict can be linked through different mechanisms, thus resulting in different outcomes. We develop a theory of harvest-time conflict that looks at the pathways by which the harvest can lead to changes in conflict intensity: groups may be acting out of resentment at inequality with others, out of rapacity at the opportunity to destroy or appropriate agricultural surplus, or because of the transitory changes in the opportunity cost of conflict during harvest times. We enrich literature by presenting evidence for the potentially diverging effects that agricultural employment and income can have on different forms of conflict.
Second, we bring a focus on Southeast Asia, a relatively understudied region (Adams et al., 2018), to the literature on the climatic roots of conflict (Burke et al., 2009; Crost et al., 2018; Dell et al., 2014; Hsiang et al., 2013), and add important nuance to the relationship between the timing of climate shocks and conflict. We present empirical support for the effect of growing season rainfall on conflict through its effect on the harvest of the dominant staple in the region. Growing season rainfall can have varying harvest-time effects on different forms of conflict that are likely governed by different mechanisms, including those not necessarily mediated through agriculture.
Third, we contribute to the emerging literature on the seasonality of conflict (Guardado and Pennings, 2024; Harari and La Ferrara, 2018; McGuirk and Nunn, 2024; Ubilava et al., 2023). Much of the literature focuses on the effects of food access and affordability, finding that changing food prices and more food insecurity can lead to social unrest and armed conflict (Bellemare, 2015; Chen et al., 2018; Koren and Bagozzi, 2016). We focus, instead, on the connection between agricultural harvest and conflict. Using harvest season as the period of intermittent employment and income, we estimate an increase in conflict by organized groups and a reduction in conflict by less organized actors, and thus provide new empirical evidence for existing theories of conflict.
Southeast Asia as a case
We choose Southeast Asia, rather than all of Asia for example, as a suitable region for the analysis for several reasons. First, politically, it is a coherent region for comparison purposes, inasmuch as all Southeast Asian countries (bar Timor-Leste) are members of the Association of Southeast Asian Nations (ASEAN), and as such are dedicated to peaceful resolution of conflicts with each other, mutual development, and closer political, economic, and social cooperation.
Second, Southeast Asia mostly consists of low- and middle-income countries, with a significant portion of their population living at or below the national poverty line (Viana et al., 2022; World Bank, 2022a, 2022b). The region also has large between- and within-country variations in governance and institutional capacity levels, as the Philippines, Myanmar, and Indonesia in particular struggle to control their geographic peripheries.
Third, agriculture is an important sector for employment and income across much of the region (World Bank, 2022c). The region’s countries also have broadly similar climate, farming practices, and agricultural production patterns (as compared with Asian regions at more northern latitudes). While subsistence farming is prevalent in Southeast Asia, several countries in the region are also net food exporters (which differs from many African countries). Thailand, Vietnam, Myanmar, and Cambodia are among the top ten rice-exporting countries globally (Food and Agriculture Organisation of the United Nations (FAO), 2024), meaning that violence associated with rice-producing areas is relevant to income generation for both farmers and the state.
Finally, while there are low levels of interstate conflict in Southeast Asia compared to South Asia or the Middle East, civil conflict and social unrest have been defining features of the region’s politics (Caruso et al., 2016; Crost and Felter, 2020; Crost et al., 2020; Gatti et al., 2021). For example, the Philippines and Myanmar have experienced multiple insurgencies – ideology-based or ethnicity-based – for nearly their entire period of independence. The protests and conflicts sparked by the Myanmar military’s coup in 2021 have evolved into a full-scale civil war, while the Philippines has periodically experienced high levels of civil conflict. Thailand struggled with communist insurgency from the 1960s until the early 1980s, as well as spillover from Myanmar’s insurgencies, while the Thai government continues to fight a low-level ethnic insurgency in southern Thailand. Since Indonesian President Suharto’s fall in 1998, Indonesia has dealt with widespread protests, riots, civil conflict, and Islamist terrorism as well as ethnic insurgencies in Aceh and West Papua.
A theory of harvest-time conflict
Accepting there are many ways to look at the link between agriculture and conflict, we focus our theory on the relationship ignited from harvest-time changes in income. We take as our starting point Collier and Hoeffler’s (2004) theory of conflict as stemming from greed or grievance – the approach has been used amply to look at agriculture-related conflict (Hendrix and Haggard, 2015; McGuirk and Burke, 2020; De Winne and Peersman, 2021).
The first driver of conflict, greed, suggests that perpetrators are more likely to engage in conflict when there is more at stake (e.g. McGuirk and Burke, 2020). The second driver, grievance, suggests that people protest the deterioration of their well-being relative to others or their own past (e.g. Hendrix and Haggard, 2015; De Winne and Peersman, 2021).
Our theory, which links harvest times and changes in levels of violence, accepts that both greed and grievance can be part of the dynamics of seasonal violence. We disaggregate motives for violence during harvest time (and accompanying changes in availability and affordability of food) by the type of actors and their relationship to the food supply and income from food production. In other words, the response of conflict actors to the harvest (and the concomitant agricultural surplus) is conditioned by the type of actor and the conflict in which they engage.
Sorting the channels that motivate conflict is a challenging task, as the observed data reflect the fruits of those motivations rather than the motivations themselves. Differentiating these channels thus requires careful consideration of who might engage in what form of conflict as a result of the motivation derived from the channel; who or what might be the target of conflict or violence; and how the conflict might manifest itself, in the present case, in response to agriculture-related employment and income. We summarize our theoretical expectations in Table 1.
Actors and harvest-time conflict: Theoretical expectations.
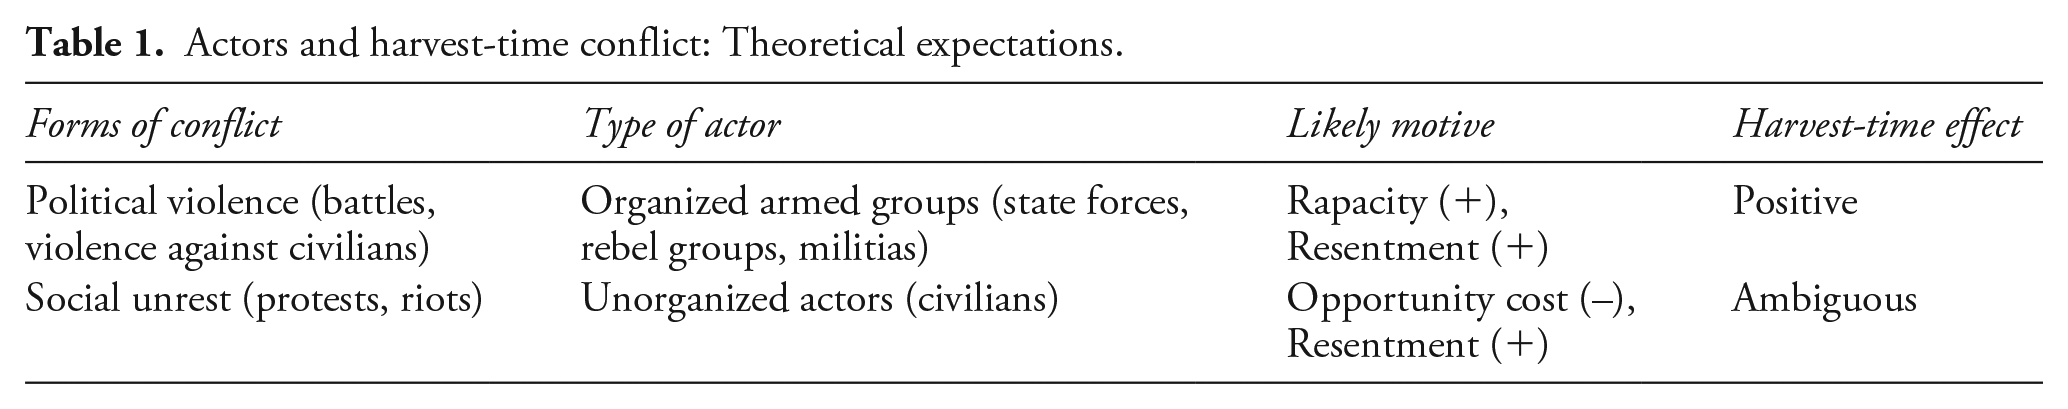
On the one hand, harvest may fuel conflict by presenting opportunities for perpetrators to extort agricultural surplus or incur damage to their opponents – the rapacity channel, as well as by temporarily altering the relative income distribution among groups of people involved in agricultural and non-agricultural activities – the resentment channel. On the other hand, harvest may reduce conflict as potential conflict actors are busy harvesting, or the benefits from harvesting outweigh the costs incurred by forgoing this activity in favor of involvement in conflict – the opportunity cost channel.
A way to disentangle these channels is by focusing on the forms of conflict instigated by different types of actors. Organized actors – state forces, rebel groups, and militias – engage in battles with each other or in violence against civilians. Unorganized actors, including civilians, involve themselves in protests staged against the government; they may also engage in riots. The logic of conflict, the relevance of agricultural income, and the pattern of seasonality are likely to be different depending on the type of actor (and thus the form of conflict). The literature has found that different types of violence may have diverging outcomes in situations where conflict causes food insecurity, or vice versa. George and Adelaja (2022), for example, show that influxes of internally displaced persons due to armed conflict tend to decrease food consumption in host communities, while influxes due to communal violence tend to increase food consumption.
Specifically, because organized armed groups are carrying out planned, armed violence against adversaries, they are likely to engage in the violence both because they have grievances, and to extract resources for their fight. While they may have multiple motives (or channels through which motive can lead to a change in violence), in all cases the motives lead to an increase in violence during harvest times. On the other hand, because unorganized actors – notably civilians – are not otherwise engaged in active conflict, they do not need to forcibly extract surplus from the harvest, either to enrich themselves or to disadvantages their enemies. Indeed, civilians who are agricultural producers themselves may have incentives to decrease unrest – protests and riots – during harvest.
We can summarize the foregoing discussion in two key arguments.
Argument 1: Organized actors – armed groups engaged in a larger conflict – are likely to increase political violence during harvest time.
In armed conflicts – both in interstate wars and civil wars – the combatant factions have incentives to create food insecurity while gaining material advantage over adversaries. This may include destruction of cropland, displacement of populations, and control of food, and denial of food or income to the adversaries or supporters of adversaries (Kemmerling et al., 2022). Indeed, timing attacks with harvests has been a time-tested tactic in warfare (Davis, 2002; Kreike, 2022).
Violence against civilians can be linked to the harvest-time income, and this relationship is expected to be positive. During the harvest season, an all but guaranteed increase in agricultural output makes farmers a lucrative target for perpetrators, which can amplify violence in croplands relative to non-agricultural areas (Koren, 2018; Mitra and Ray, 2014; McGuirk and Burke, 2020). This relationship, which aligns with the theory of greed manifested through the rapacity channel (Ubilava et al., 2023), can be further reinforced by the resentment channel, for example, if harvest-time change in relative income between farmers and non-farmers leads to communal violence.
By the same logic, organized armed actors may increase their activities during the harvest season to maximize the damage they do in the larger conflict for several reasons. First, they may want to expropriate farmers’ income realized during the harvest season. Second, organized armed actors may want to harm farmers who do not support the insurgency or state, or who are on the sidelines, to minimize threats to themselves or to intimidate the farmers into joining them (Raleigh, 2012; Raleigh and Choi, 2017). Third, rebels may strategically time their attacks to maximize the negative effect on the state, considering that the state is likely to derive revenue during the harvest season. This revenue is directly related to the state’s ability to attack rebels (Fearon and Laitin, 2003).
In Southeast Asia, many attacks on civilians revolve around the theft of rice or the destruction of rice fields or rice storage facilities. In December 2013, for instance, the Myanmar military attacked civilian rice paddies in Kachin State during the harvest season. 1 In November 2021, in a clash between the Myanmar military and various People’s Defense Forces (the armed groups linked with the anti-junta civilian government in internal exile), the military burned harvested rice fields in a village they suspected was loyal to the anti-state groups. 2
Argument 2: Unorganized actors – civilians not otherwise engaged in conflict – may increase or decrease social unrest during harvest time.
As with political violence by organized armed groups, unorganized actors may also see resentment related to the harvest. Generally, the literature has seen the inverse relationship between food availability and affordability and protests: higher food prices, the usual indicator for food scarcity, lead to decreases in well-being in populations, either relative to the past or to other groups, which results in resentment, often against the government if it is not perceived as addressing the problem. This resentment in turn leads to protests and riots (Kemmerling et al., 2022).
In rural areas, the mechanism that links food availability with conflict is nuanced. During harvest (that is, during times of plenty), while the grievances of farmers may decrease because of the realization of income, an increase in their income relative to others (rural non-farmers or urban dwellers) may lead to resentment between different groups (e.g. Panza and Swee, 2023), and an increase in social unrest between groups or against the government.
However, agricultural harvest can also increase the opportunity cost of protests and riots, which can occur through several pathways. First, those who are directly involved in agriculture may decrease their protest activities during harvest because they are busy harvesting. This relates to a second pathway in which the opportunity cost of protesting increases at harvest time. The infusion of income makes protesting less attractive, perhaps because there are fewer grievances against the government when would-be protesters are realizing income. While decreases in food access can enable mobilization around several other, often unrelated grievances (Heslin, 2021), an increase in food access (during the harvest) may remove a means of mobilizing around pre-existing grievances, thus decreasing protests. A third possible pathway is the income from protesting becoming less competitive. In Indonesia, for instance, paid protesting is a longstanding means for political parties and civil society groups to pressure the government or to ‘send a message’. Protesters, who typically are provided with a packed lunch (‘nasi bungkus’ in Indonesian, hence the term ‘nasi bungkus brigade’) and a cash payment, often have only a tenuous interest in the cause of the protest (Andrews, 2017). Thus, protest campaigns may find fewer supporters during the harvest season.
The net differential effect of harvest season on social unrest by unorganized groups, as seen by the negative effect of opportunity costs and the positive effect of resentment, can be ambiguous. In Thailand, for instance, farmers staged a spate of protests in 2014 in relation to a rice purchasing scheme in which the Thai government was supposed to have paid subsidies for rice production, but the payments were either delayed or absent (Mohanty, 2012). These protests did not happen during the rice harvest season (which is December in Thailand), but several months later, presumably when farmers’ grievances increased, and the opportunity cost of protesting decreased. Of interest here is that Thai farmers’ grievances were against both government (for not paying subsidies) and anti-government groups (for supposedly blocking the government from paying subsidies). 3
Data
For social conflict, we use the Armed Conflict Location & Event Data (ACLED) compiled by Raleigh et al. (2010). For rice cropland cover and irrigation, we use data from the International Food Policy Research Institute (IFPRI) (2019), and for harvest calendars, we use data from Sacks et al. (2010). For precipitation, we use the CPC Global Unified Gauge-Based Analysis of Daily Precipitation data provided by the National Oceanic and Atmospheric Administration’s Physical Sciences Laboratory, and for city population, we use the World Cities Database. 4
Social conflict
The ACLED Project (Raleigh et al., 2010) presents spatially and temporally granular data on conflict incidents split into six categories: battles between organized armed groups, explosions/remote violence, strategic developments, violence against civilians by organized armed groups, and protests and riots representing forms of public disorder. In our analysis, we combine battles and explosions/remote violence into a single form of conflict and exclude strategic developments, as they are not comparable across countries or over time (Raleigh et al., 2010).
The distinction between organized actors and the violence they commit and unorganized actors who engage in protests and riots comes from how ACLED categorizes actors and incidents. Both battles and violence against civilians, in ACLED’s formulation, require perpetrators to be organized into armed groups. Battles are ‘a violent interaction between two organized armed groups at a particular time and location’ (ACLED, 2023: 11), while violence against civilians comprises ‘violent events where an organized armed group inflicts violence upon unarmed non-combatants [. . .] The perpetrators of such acts include state forces and their affiliates, rebels, militias, and external/other forces’ (ACLED, 2023: 17).
In contrast, protests and riots are committed by unorganized actors, typically civilians. By definition, ‘[p]rotesters are peaceful demonstrators’ (ACLED, 2023: 29), and protesters are inherently civilians, inasmuch as ‘civilians are unarmed and cannot engage in political violence’ (ACLED, 2023: 17). For their part, while riots may be instigated by organized groups, violence is categorized as a riot if it is committed by unorganized individuals. They are ‘loosely assembled groups of individuals or mobs without inherent organization, engage in violence while participating in demonstrations or engage in violence that is spontaneous [. . .] While the activity of rioters, by definition, falls outside the remit of an organized armed group, rioters may sometimes be armed and/or organized in a spontaneous or atomic manner’ (ACLED, 2023: 28).
The dataset covers all major countries in Southeast Asia with an agricultural sector over a relatively short period of time, from 2010 onward for most countries (Cambodia, Laos, Myanmar, Thailand, and Vietnam), except for Indonesia (from 2015 onward), the Philippines (from 2016 onward), and Malaysia (from 2018 onward). We exclude Brunei, Singapore, and Timor-Leste because they are small and/or not agricultural countries, and because of the very short time series coverage for these countries (from 2020 onward).
Our study covers more than 86,000 unique incidents. This excludes incidents for which exact locations are unknown, and they are thus arbitrarily attributed to the nearest known site, typically a provincial capital (such locations are recorded with geo-precision code 3 in the database). In Figure 1 we present a map of incidents across three distinct conflict categories aggregated at the level of one-degree cells. The map also features a selected set of large cities in the region.
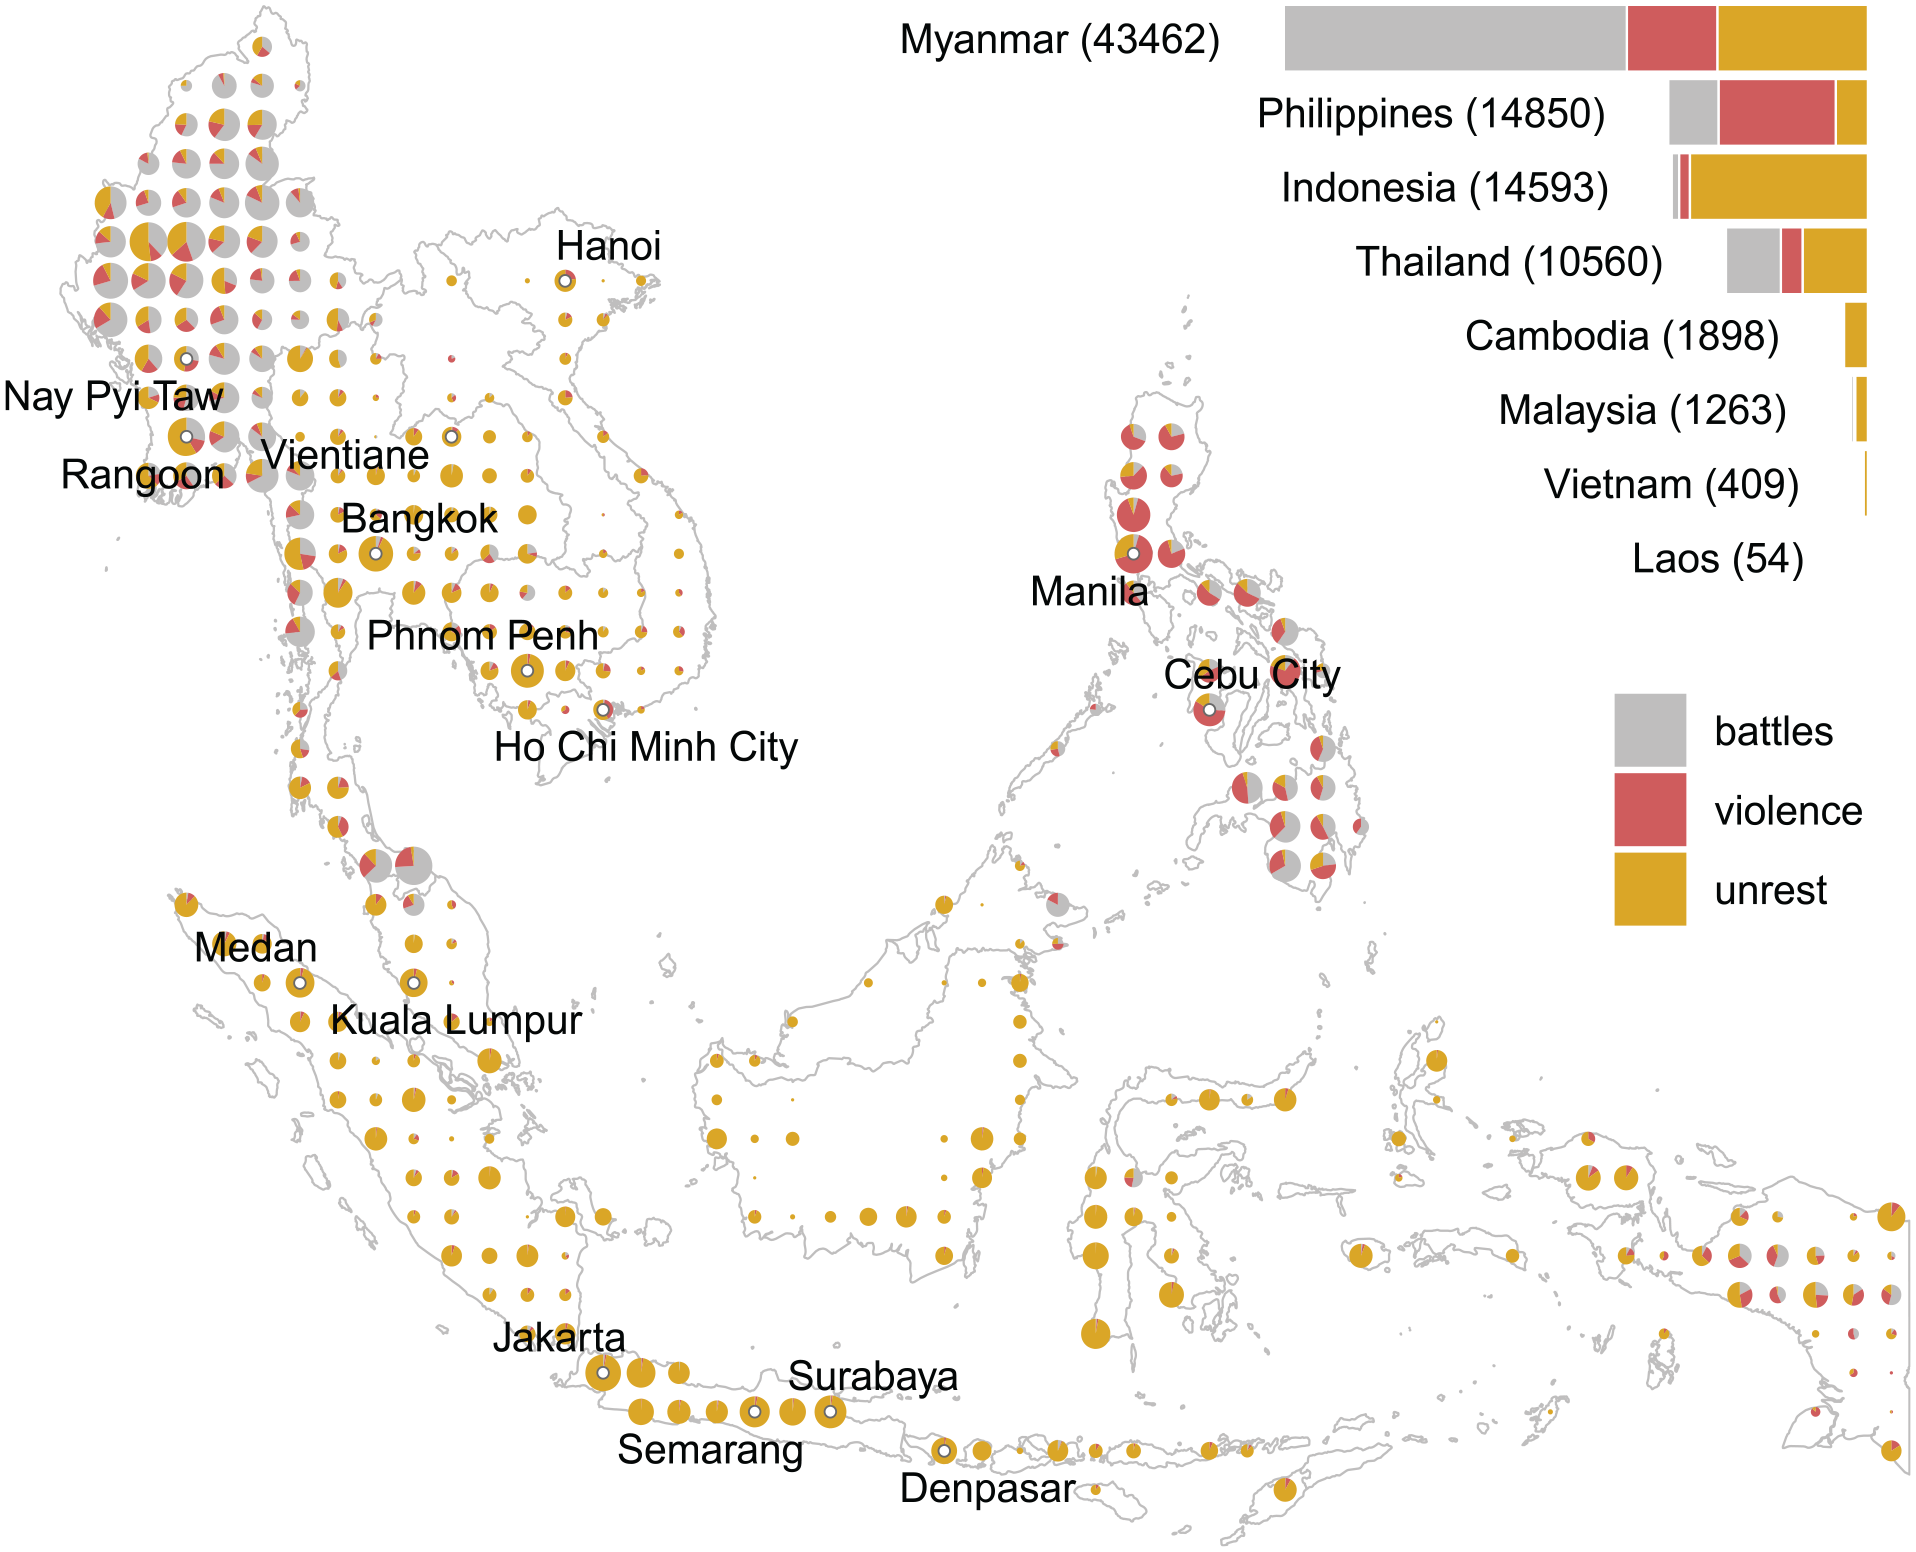
Geographic distribution of social conflict (2010–2023).
Conflict occurs across much of Southeast Asia. Within the region, some countries are more prone to conflict than others. There is notable spatial dependence in the prevalence of different forms of conflict, and while generally observed in cities, where most people reside, conflict is not necessarily or exclusively a city phenomenon. The proportions of forms of conflict also vary by country: Myanmar and Thailand have high levels of battles and unrest, while the Philippines has high levels of violence, and Indonesia has high levels of unrest.
In Figure 2 we present the time series of the four forms of conflict considered. The series show no apparent trends across all forms of conflict during 2010s, but there is a notable increase in almost all forms of conflict, except riots, from 2021 onward – a change largely driven by the Myanmar Civil War. Despite general co-movement, there are periods when a rise in one form of conflict is not accompanied by other forms of conflict, suggesting that the root causes and mechanisms of different forms of conflict vary.
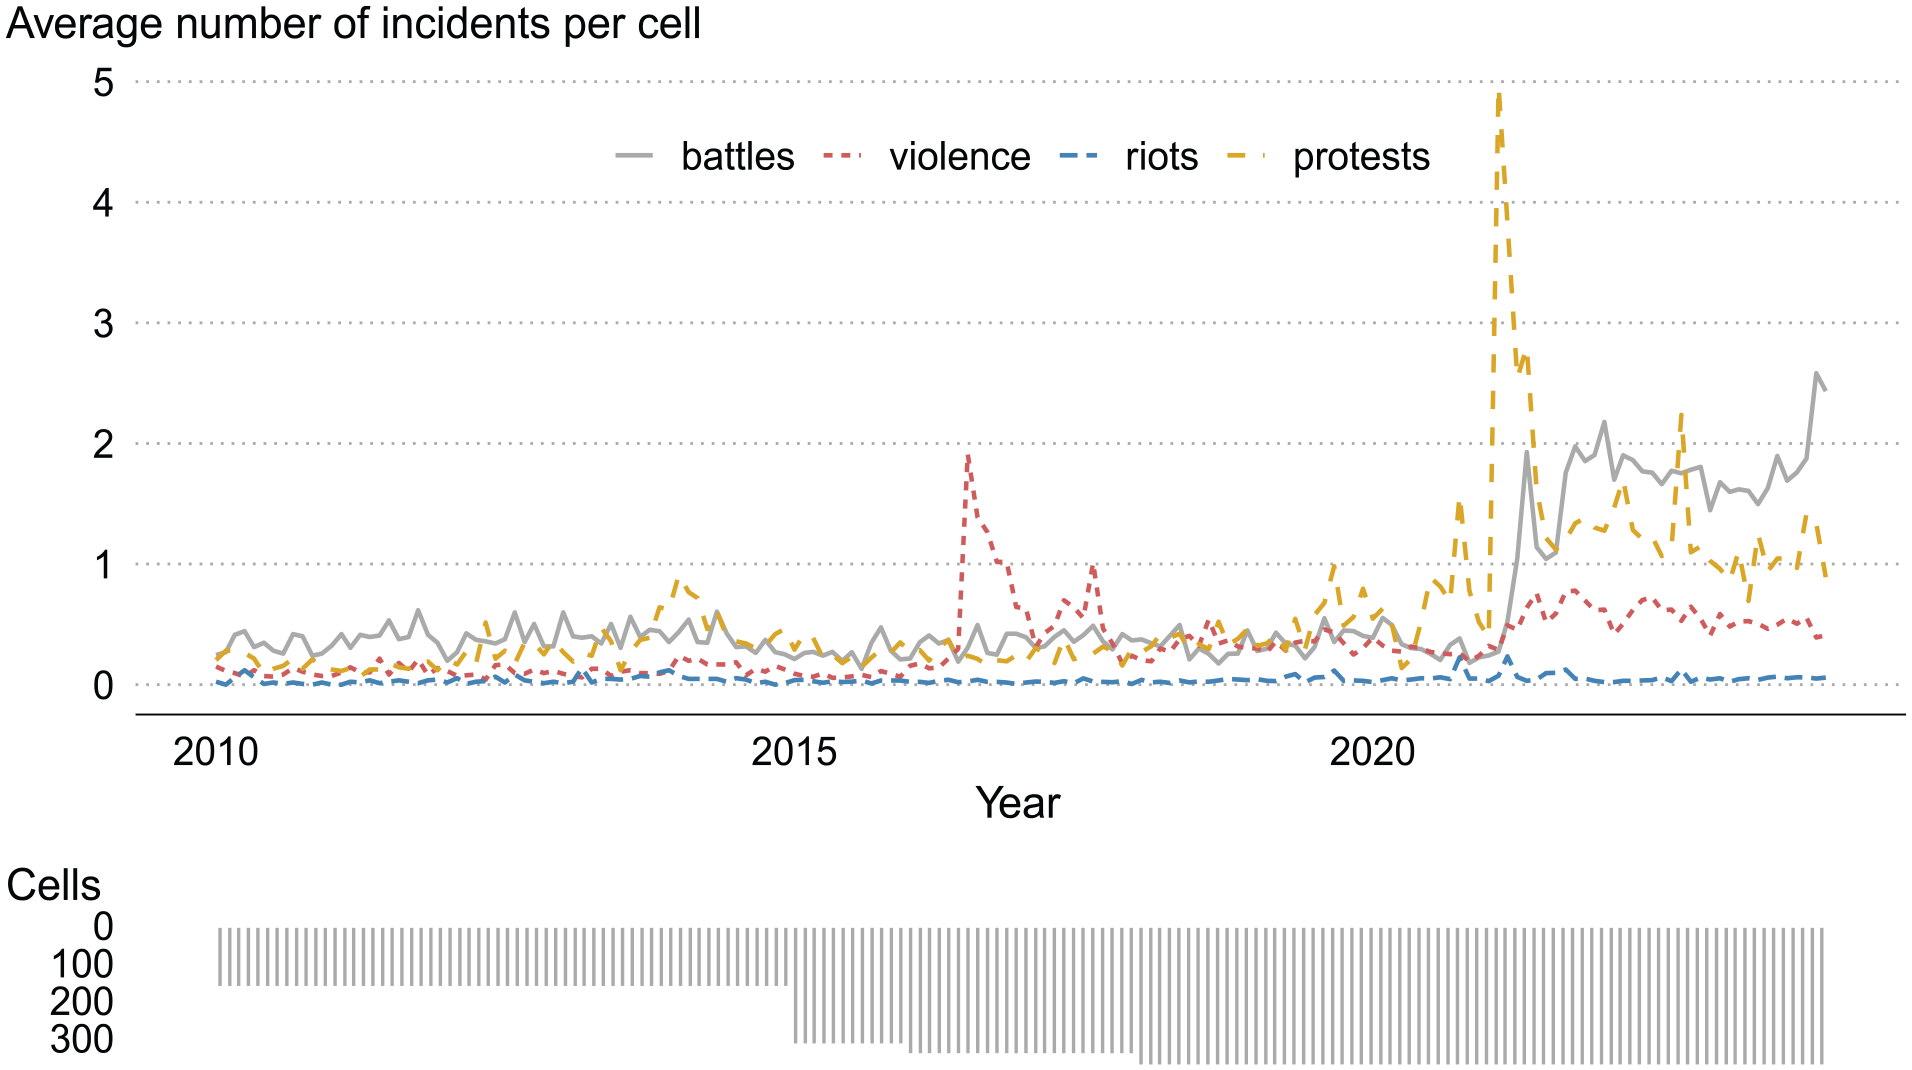
Dynamics of social conflict by event type.
Rice harvest season
We focus on rice, which is by far the most dominant cereal – both in terms of production and consumption – across Southeast Asia. The harvest can span several months. We define the period from the month when the harvest starts to the month when the harvest ends as the harvest season. We define the midpoint of the harvest season as the harvest month. In instances where a crop is grown over two seasons, we use the main season to identify the harvest season and the crop year. We keep the area of the cropland and the harvest season fixed over the study period. We do so due to data limitations, but also to mitigate the issue of reverse causality from conflict to harvest.
Figure 3 presents the geographic prevalence of rice production and the harvest months at the level of one-degree cells. The map makes it apparent that there is some variation in the timing of the main harvest season, with March being the dominant month. There is also considerable within-country variation in cropland area, but hardly any within-country variation in the harvest month.
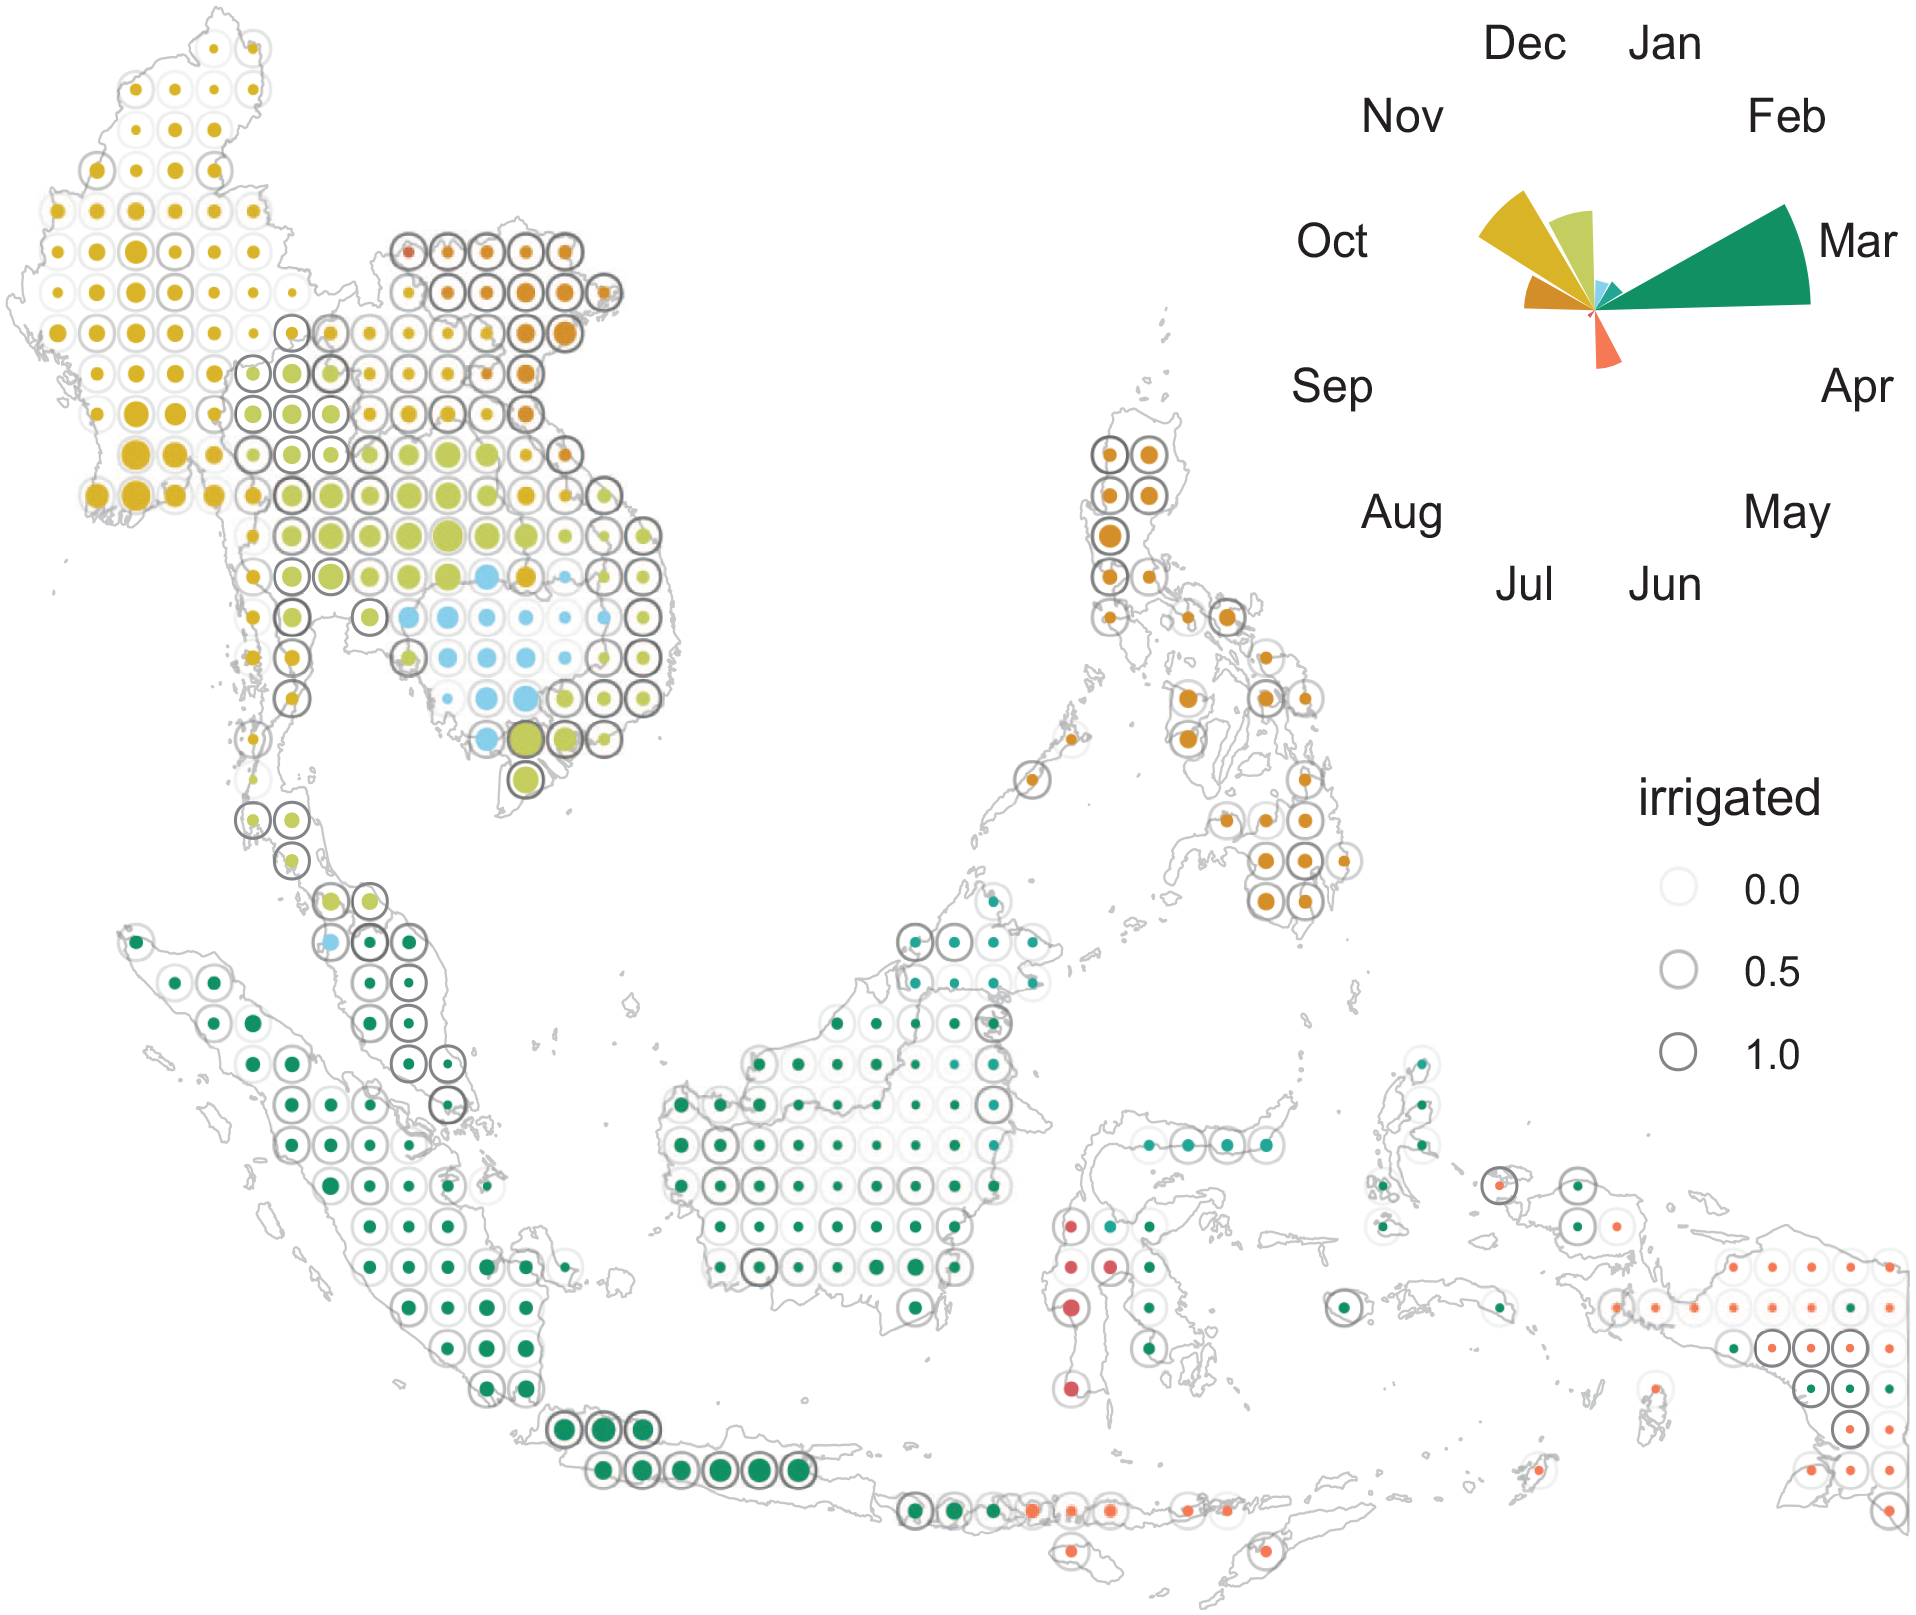
Geographic distribution of rice harvest months.
Auxiliary data
We use rainfall, one of the key inputs in rice production, to test the mechanism related to the year-to-year change in rice production and thus its abundance at harvest time, in the crop-producing cells. In the analysis we apply monthly average growing season precipitation, which we obtain by dividing the aggregate observed precipitation in one-degree grid cells – the spatial unit of measurement in this study – by the number of months in the crop growing season, i.e. the months from the start of the planting to the start of the harvest season. Online Appendix Figure B1 presents a histogram of the monthly average growing season precipitation across the cells and years used in the analysis.
We use information on irrigation to differentiate regions with relatively more developed infrastructure from regions with minimal infrastructure for rice production. Empty circles on Figure 3 show the cells with irrigated land, high-opacity circles indicating the cells with high proportion of irrigated land. Online Appendix Figure B2 presents a histogram of the proportion of irrigated rice across all considered locations. Cells with larger cropland areas tend to be irrigated, although the irrigation prevalence also appears to be a country-specific phenomenon.
The state – both the nature of the regime and state capacity – may serve as an intermediating factor between agriculture and conflict, although most research looks at food insecurity and conflict, rather than seasonal peculiarities of agricultural income. Democracies tend to see more social unrest during periods of high food prices than autocracies (Hendrix and Haggard, 2015). Food insecurity is more likely to lead to conflict in politically vulnerable states (Jones et al., 2017). To get some measure of state presence in an area, we use the information on population size to categorize cells into urban and rural, with the assumption that urban areas may have more state presence than rural areas. We consider a cell to be urban if it contains the capital city or a large city (with a population size of at least one million), or if the population size within the cell, which may include multiple cities, is at least two-and-a-half millions. Empty circles on Figure 1 indicate these cells.
Descriptive statistics
In Table 2, we summarize some of the data’s key features. Battles combined with explosions/remote violence, labeled as ‘Battles’, violence against civilians, labelled as ‘Violence’, and protests represent the three most prevalent forms of conflict. The least prevalent event type is riots – a violent version of protests that shares elements of other armed forms of social conflict. The average size of the land used for rice production is approximately 78,000 hectares, which is approximately 6.5% of the cell (measured near the equator).
Descriptive statistics.
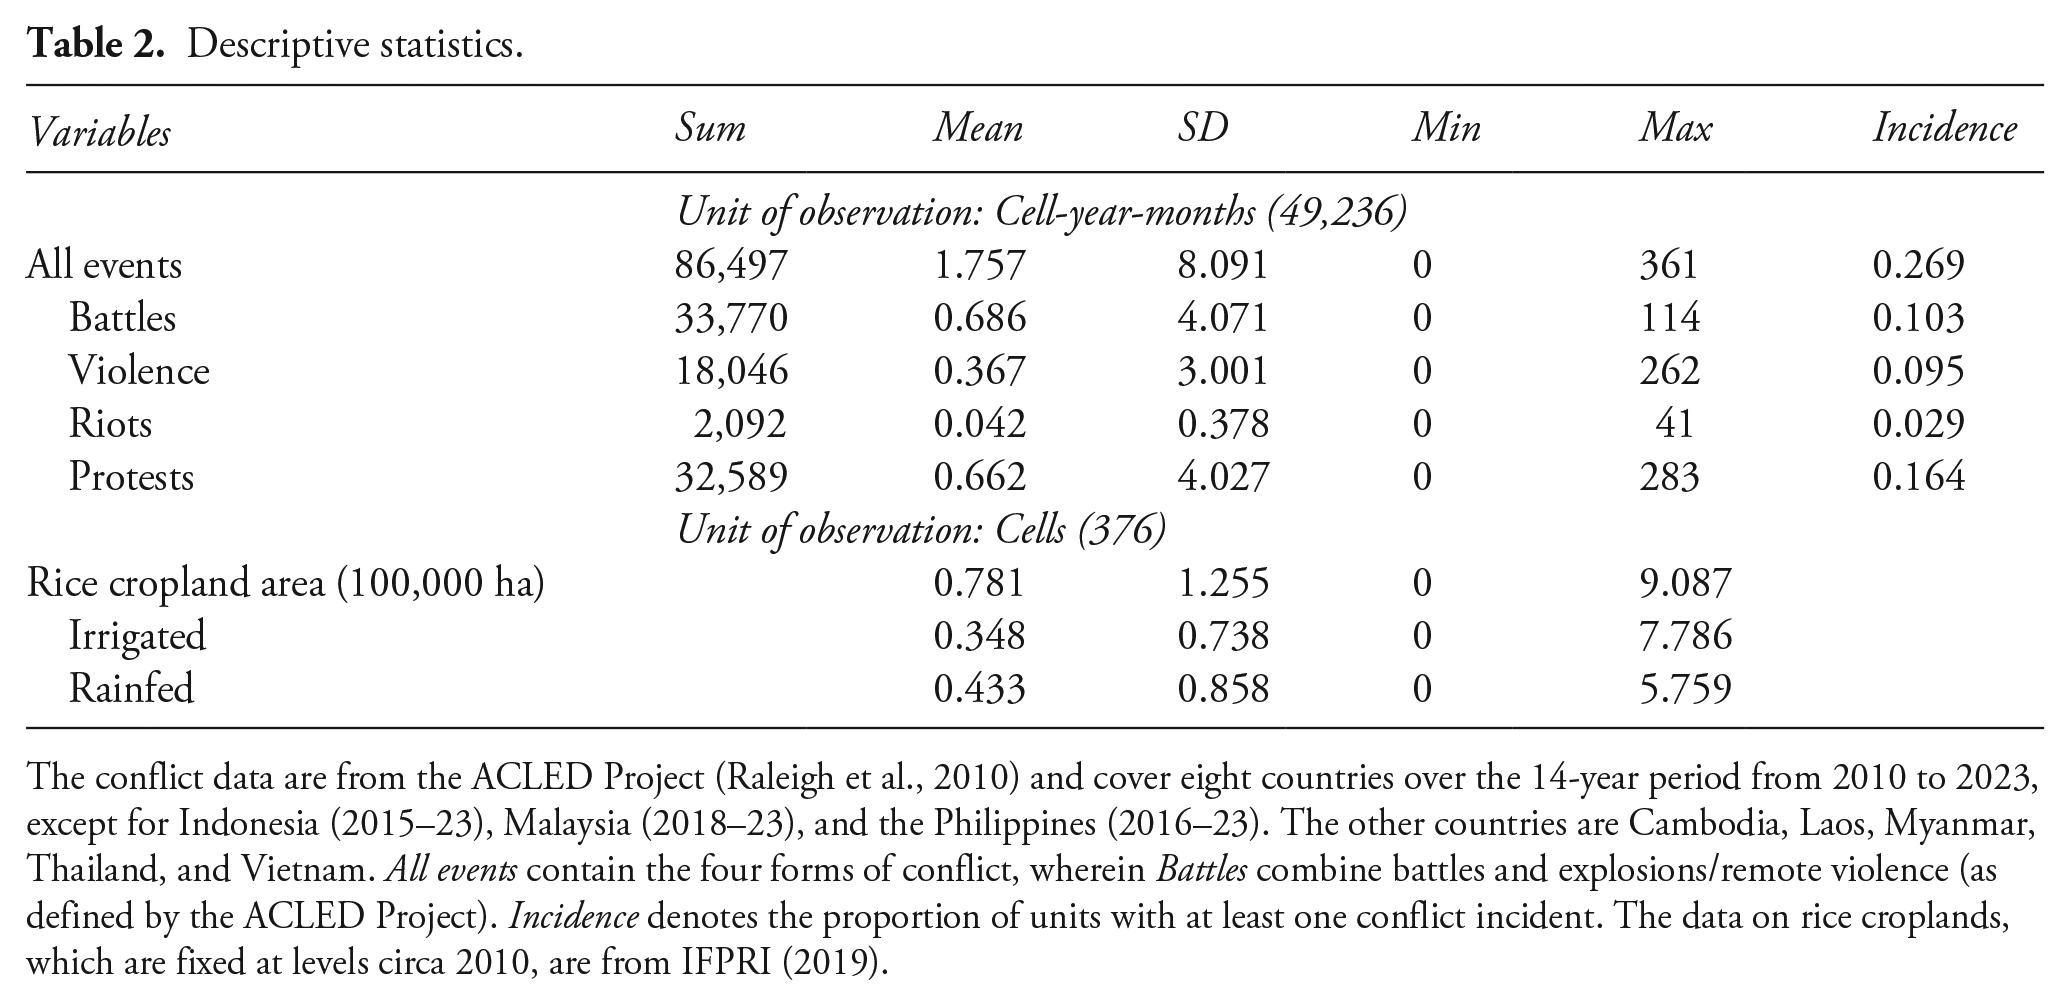
The conflict data are from the ACLED Project (Raleigh et al., 2010) and cover eight countries over the 14-year period from 2010 to 2023, except for Indonesia (2015–23), Malaysia (2018–23), and the Philippines (2016–23). The other countries are Cambodia, Laos, Myanmar, Thailand, and Vietnam. All events contain the four forms of conflict, wherein Battles combine battles and explosions/remote violence (as defined by the ACLED Project). Incidence denotes the proportion of units with at least one conflict incident. The data on rice croplands, which are fixed at levels circa 2010, are from IFPRI (2019).
Estimation, identification, and interpretation
We denote location, a one-degree grid cell, with subscript i, country with subscript c, year with subscript t, and month with subscript m. Henceforth, we refer to the year-month as the period of observation. Thus, the units of analysis are observations across 376 unique grid cells and, in most cases, over 168 periods from January 2010 to December 2023. The level of spatial aggregation – one-degree cells that measure approximately 110 × 110 km near the equator – is coarse enough to ensure that there are enough units with at least one conflict incident, as well as sufficiently granular to not sabotage within-country variation in conflict incidents. We use grid cells instead of administrative units, such as provinces, to ensure that the units of observations cover approximately the same geographic area, especially across the countries.
Our main econometric specification is given in a fixed effects setting as follows:
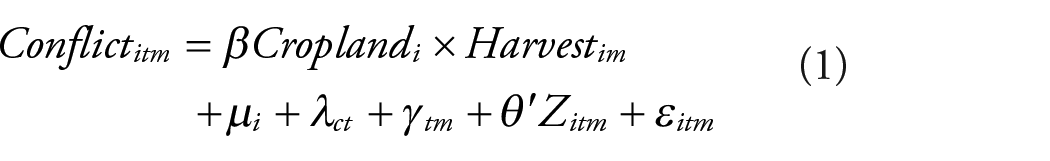
where the outcome variable,
The identifying assumption in Equation (1) is that the treatment variable is exogenous to conflict. This assumption may seem tenuous because conflict may affect production through factors such as abandoned plots, missed or mistimed harvests, and planting seasons. As a result, lower agricultural output may be a consequence of the change in conflict rather than its cause. However, in our study, we do not apply production data that would vary yearly and instead use cropland area and harvest months, which are location-specific and fixed over time. Such an approach, admittedly driven by data limitations, mitigates the endogeneity issue due to reverse causality.
We control for a set of variables in the regression to address, at least to an extent, the remaining endogeneity issues. We include cell fixed effects to capture any time-invariant or slowly-evolving determinants of conflict (e.g. distance to roads, cities, or state borders), country-year fixed effects to control for any country-specific trends in the data (e.g. large-scale political turmoil in election years), and year-month fixed effects to capture common time-varying events observed in the region (e.g. global financial crises, large-scale climatic shocks). These fixed effects also help us isolate any trends or seasonality in the quality of data collection/reporting. By including the cell fixed effects, we control for any spatial heterogeneity in the conflict reporting. By including country-year and year-month fixed effects, we control for any temporal changes (within country at annual frequency, and across the region at monthly frequency) in the conflict reporting. We also include contemporaneous rainfall, which varies over time and across space, in the regression. This allows us to account for the direct impact of weather on conflict; for example, if excessive rainfall reduces the mobility of troops or makes protests and demonstrations somewhat untenable. Finally, in the robustness checks, we vary the fixed effects to obtain a better sense of potential threats to our identification strategy.
The estimated coefficient,
Results and discussion
Table 3 presents the baseline results of this study using all available data. During the harvest season, we estimate an increase in forms of political violence and a decrease in forms of social unrest. All coefficients, except that for riots, are statistically significantly different from zero at the 5% level. Focusing on the statistically significant effects, relative to the baseline conflict and evaluated at an average cropland, which is measured at approximately 9,000 ha within a cell, the estimated coefficients translate to a 6.7% increase in battles, a 9.1% increase in violence against civilians, and a 9.2% decrease in protests during the harvest season.
Harvest-time conflict in the croplands of Southeast Asia.
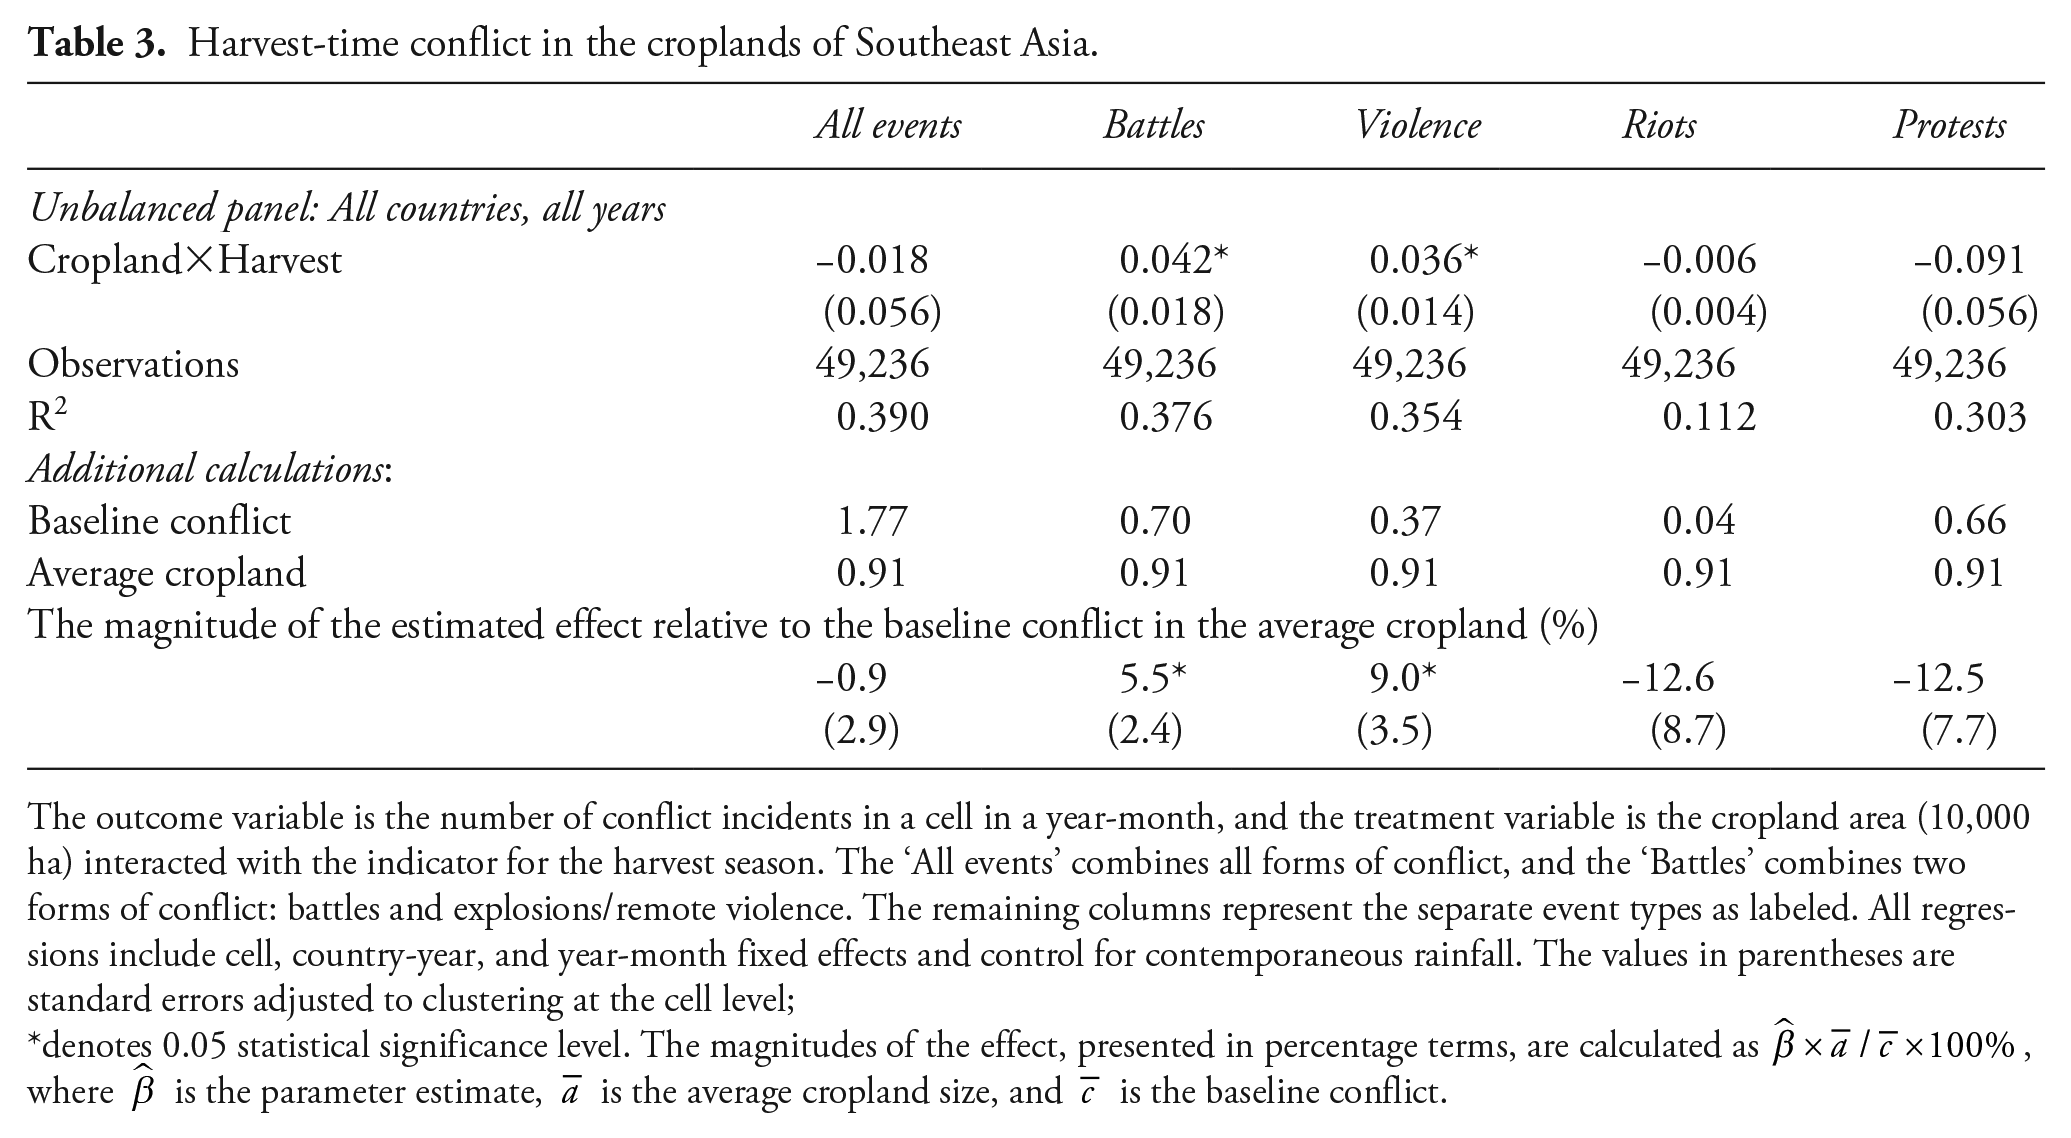
The outcome variable is the number of conflict incidents in a cell in a year-month, and the treatment variable is the cropland area (10,000 ha) interacted with the indicator for the harvest season. The ‘All events’ combines all forms of conflict, and the ‘Battles’ combines two forms of conflict: battles and explosions/remote violence. The remaining columns represent the separate event types as labeled. All regressions include cell, country-year, and year-month fixed effects and control for contemporaneous rainfall. The values in parentheses are standard errors adjusted to clustering at the cell level;
denotes 0.05 statistical significance level. The magnitudes of the effect, presented in percentage terms, are calculated as
The harvest-time increase in political violence supports rapacity as the dominant channel driving agrarian conflict in times of a relative food abundance. The harvest-time decrease in social unrest is consistent with the opportunity cost channel.
Robustness to data subsetting and alternative specifications
Before investigating possible mechanisms, we check that the results are not sensitive to data subsetting or varying model specifications.
First, we re-estimate the baseline model using balanced panels that either cover all eight countries but only include the years 2018 to 2023 (short balanced panel) or cover all 14 years but exclude Indonesia, Malaysia, and the Philippines (long balanced panel). Online Appendix Tables A1 and A2 present the regression results. When we apply the short balanced panel, the estimated coefficients for each of the four forms of conflict are largely comparable to those of the main results. Indeed, all coefficients are statistically significant at the 5% level in this instance. When we apply the long balanced panel, most of the estimated coefficients, with the exception of that for violence against civilians, become statistically indistinguishable from zero.
Second, we re-estimate the baseline model by omitting one country at a time and one year at a time. Online Appendix Figures B3 and B4 present the estimated effects, which are largely robust to omitting subsets of data from the analysis, with two notable exceptions. The harvest-time effect on violence against civilians, while similar in magnitude, becomes statistically indistinguishable from zero when we omit Myanmar from the data. This same effect attenuates to zero when we omit 2016 or 2021 from the data. In all instances, we are discarding a considerable proportion of incidents, specifically of this form of conflict. So, the observed sensitivity is not surprising. This discrepancy, moreover, may also be attributed, at least to an extent, to escalation of conflict in Myanmar, specifically the civil war that followed the coup d’état in early 2021, as well as to behavioral and policy responses to the COVID-19 pandemic (e.g. Bloem and Salemi, 2021). In any case, these sensitivity checks also indicate that the effect we find is primarily driven by harvest season violence in places and times with high amounts of overall conflict.
Third, we re-estimate the parameters using a set of alternative model specifications to ensure that our main results are not driven by our choice of fixed effects or that the inference is not affected by our choice of error clustering. We summarize these results in the specification chart presented in the Online Appendix Figure B5. The point estimates are not sensitive to different combinations of fixed effects. The evidently most robust estimate of the statistically significant increase in violence against civilians during the harvest season stands in most instances, except when we cluster the standard errors at the country level.
Fourth, we re-estimate the parameters using half-degree grid cells, which measure approximately 55 × 55 km, to ensure that the results are not sensitive to our choice of the level of spatial aggregation (which is one-degree cells). Online Appendix Table A3 presents these regression results, which accord with the main results of this study.
Finally, we perform a falsification test to verify that the estimated effects are not coincidental. Specifically, we shuffle and randomly reassign the observed harvest seasons to different locations and re-estimate the baseline regression, repeating this process 100 times. On average, we should expect no significant effect. Online Appendix Figure B6 confirms this. While a few statistically significant estimates appear – likely due to chance – we observe no substantial impact when we assign the ‘wrong’ harvest seasons to the croplands.
Treatment heterogeneity
To the extent that the assumed treatment homogeneity may be camouflaging otherwise heterogeneous effects, we examine harvest-time forms of conflict across subgroups of locations sorted by some cell-specific characteristics.
Rainfed vs irrigated cells
First, we interact the treatment variable with the proportion of irrigated land in the cell (see Figure 3 and Online Appendix Figure B2). Figure 4 presents the estimated effects relative to the baseline conflict in the average cropland across the range of rainfed and irrigated croplands (Online Appendix Table A4 presents the underlying regression results).
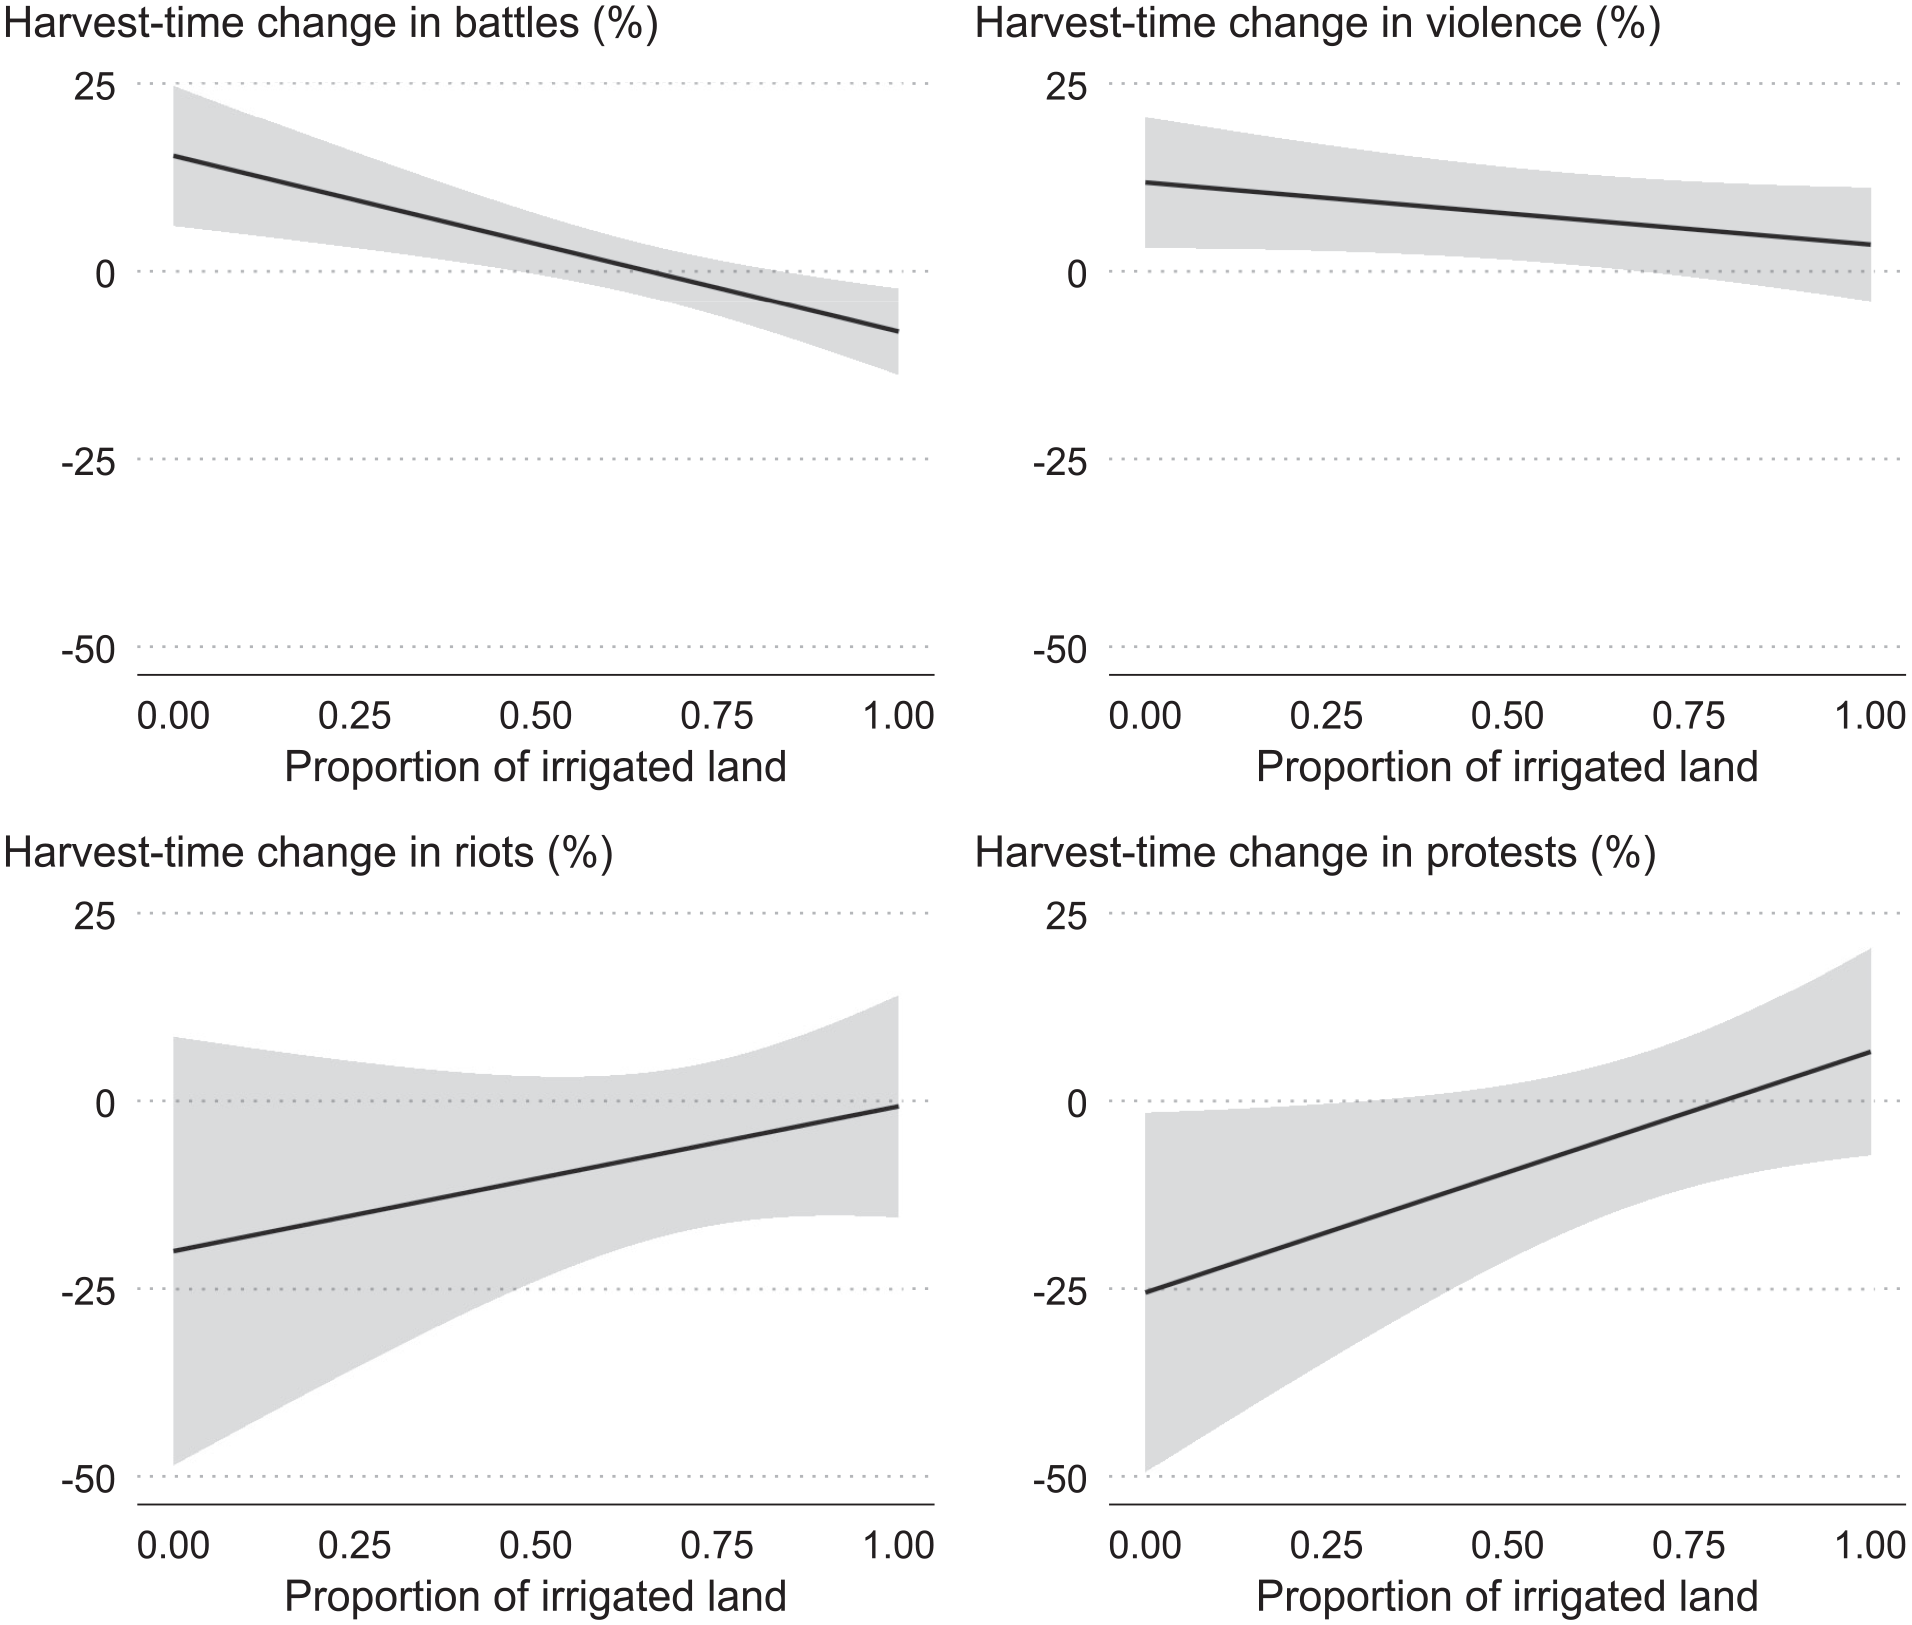
Harvest-time conflict in rainfed versus irrigated cells.
The main takeaway is that harvest-time changes in conflict occur primarily in rainfed croplands. In general, irrigated rice is of a higher yield and is often commercially produced, as opposed to rainfed rice, which is of a lower yield and is typically produced at subsistence levels. Therefore, different types of farmers are likely to be involved in these two production practices. That is, irrigation likely serves as a catch-all variable for more developed/commercial areas with relatively more stable institutions, which makes them less prone to conflict on average.
Rural vs urban cells
Next, we interact the treatment variable with rural and urban indicators. Because social conflict is most prevalent in places with high population densities, we check whether there is a qualitatively meaningful discrepancy in the seasonal conflict between urban and rural locations. We define a cell as urban if it contains the capital city or a city with a population size of at least one million or if the cell’s population size exceeds two-and-half millions. There are 47 such cells, and more incidents of conflict occur in these cells than in other cells. Recall that the majority of these urban cells tend to have sizable croplands (Figure 3). Figure 5 presents the estimated effects from these regressions (Online Appendix Table A5 shows the parameter estimates).
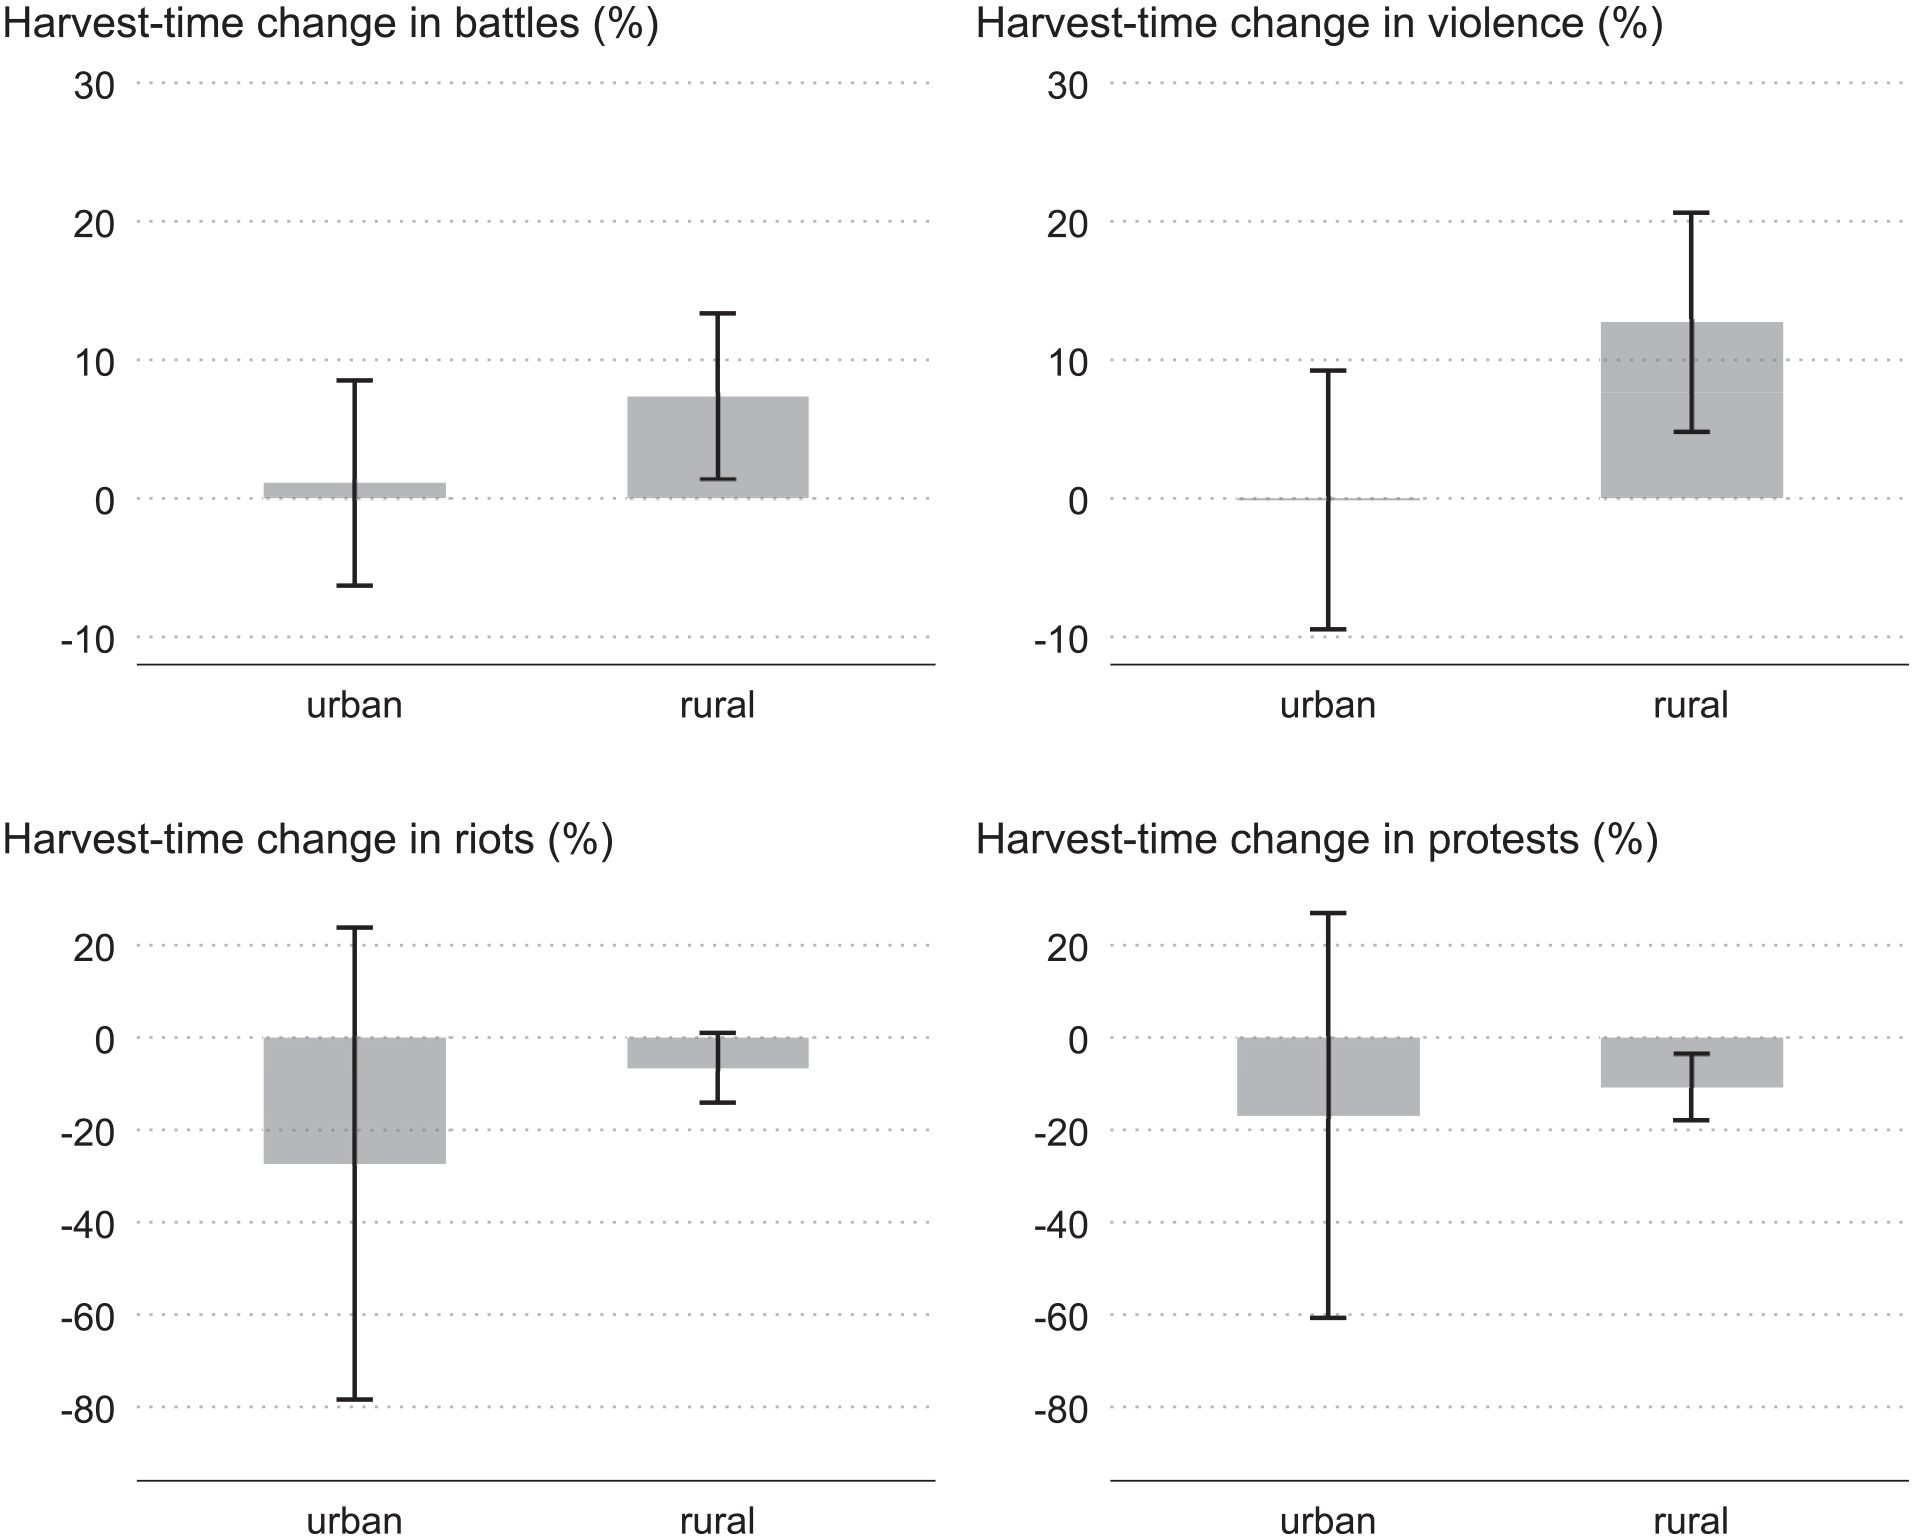
Harvest-time conflict in rural versus urban cells.
The results suggest that any harvest-time change in conflict, particularly an increase in violence against civilians and a decrease in protests, occurs only in rural areas. This finding supports the theory that civil conflict and armed violence are generally more common in peripheries, where either state policing is largely absent or where insurgents are typically present (e.g. Buhaug and Rød, 2006).
Testing the mechanisms
The foregoing results bring context to motives that likely factor in the harvest-time conflict, namely rapacity in the case of political violence and opportunity cost in the case of social unrest. In what follows, we present additional regression results that will help us examine the mechanisms that manifest in these observed effects.
Growing season rainfall
First, we leverage the annual variation in the rainfall over the crop growing season to identify the effect of harvest on conflict. Both scarce or excessive rainfall can plausibly reduce crop yields due to drought or flooding (Chen and Wang, 2023; Fu et al., 2023; Hendrix and Salehyan, 2012; Rosenzweig et al., 2002; Wang et al., 2022). We compare the harvest-time changes in conflict across growing seasons ranging from scarce or excessive monthly levels of rainfall. We do so by interacting the treatment variable with linear and quadratic terms of the monthly average growing season rainfall (measured in 100 mm). Figure 6 presents the differential effects of growing season rainfall on the forms of conflict at harvest (Online Appendix Table A6 shows the underlying regression results).
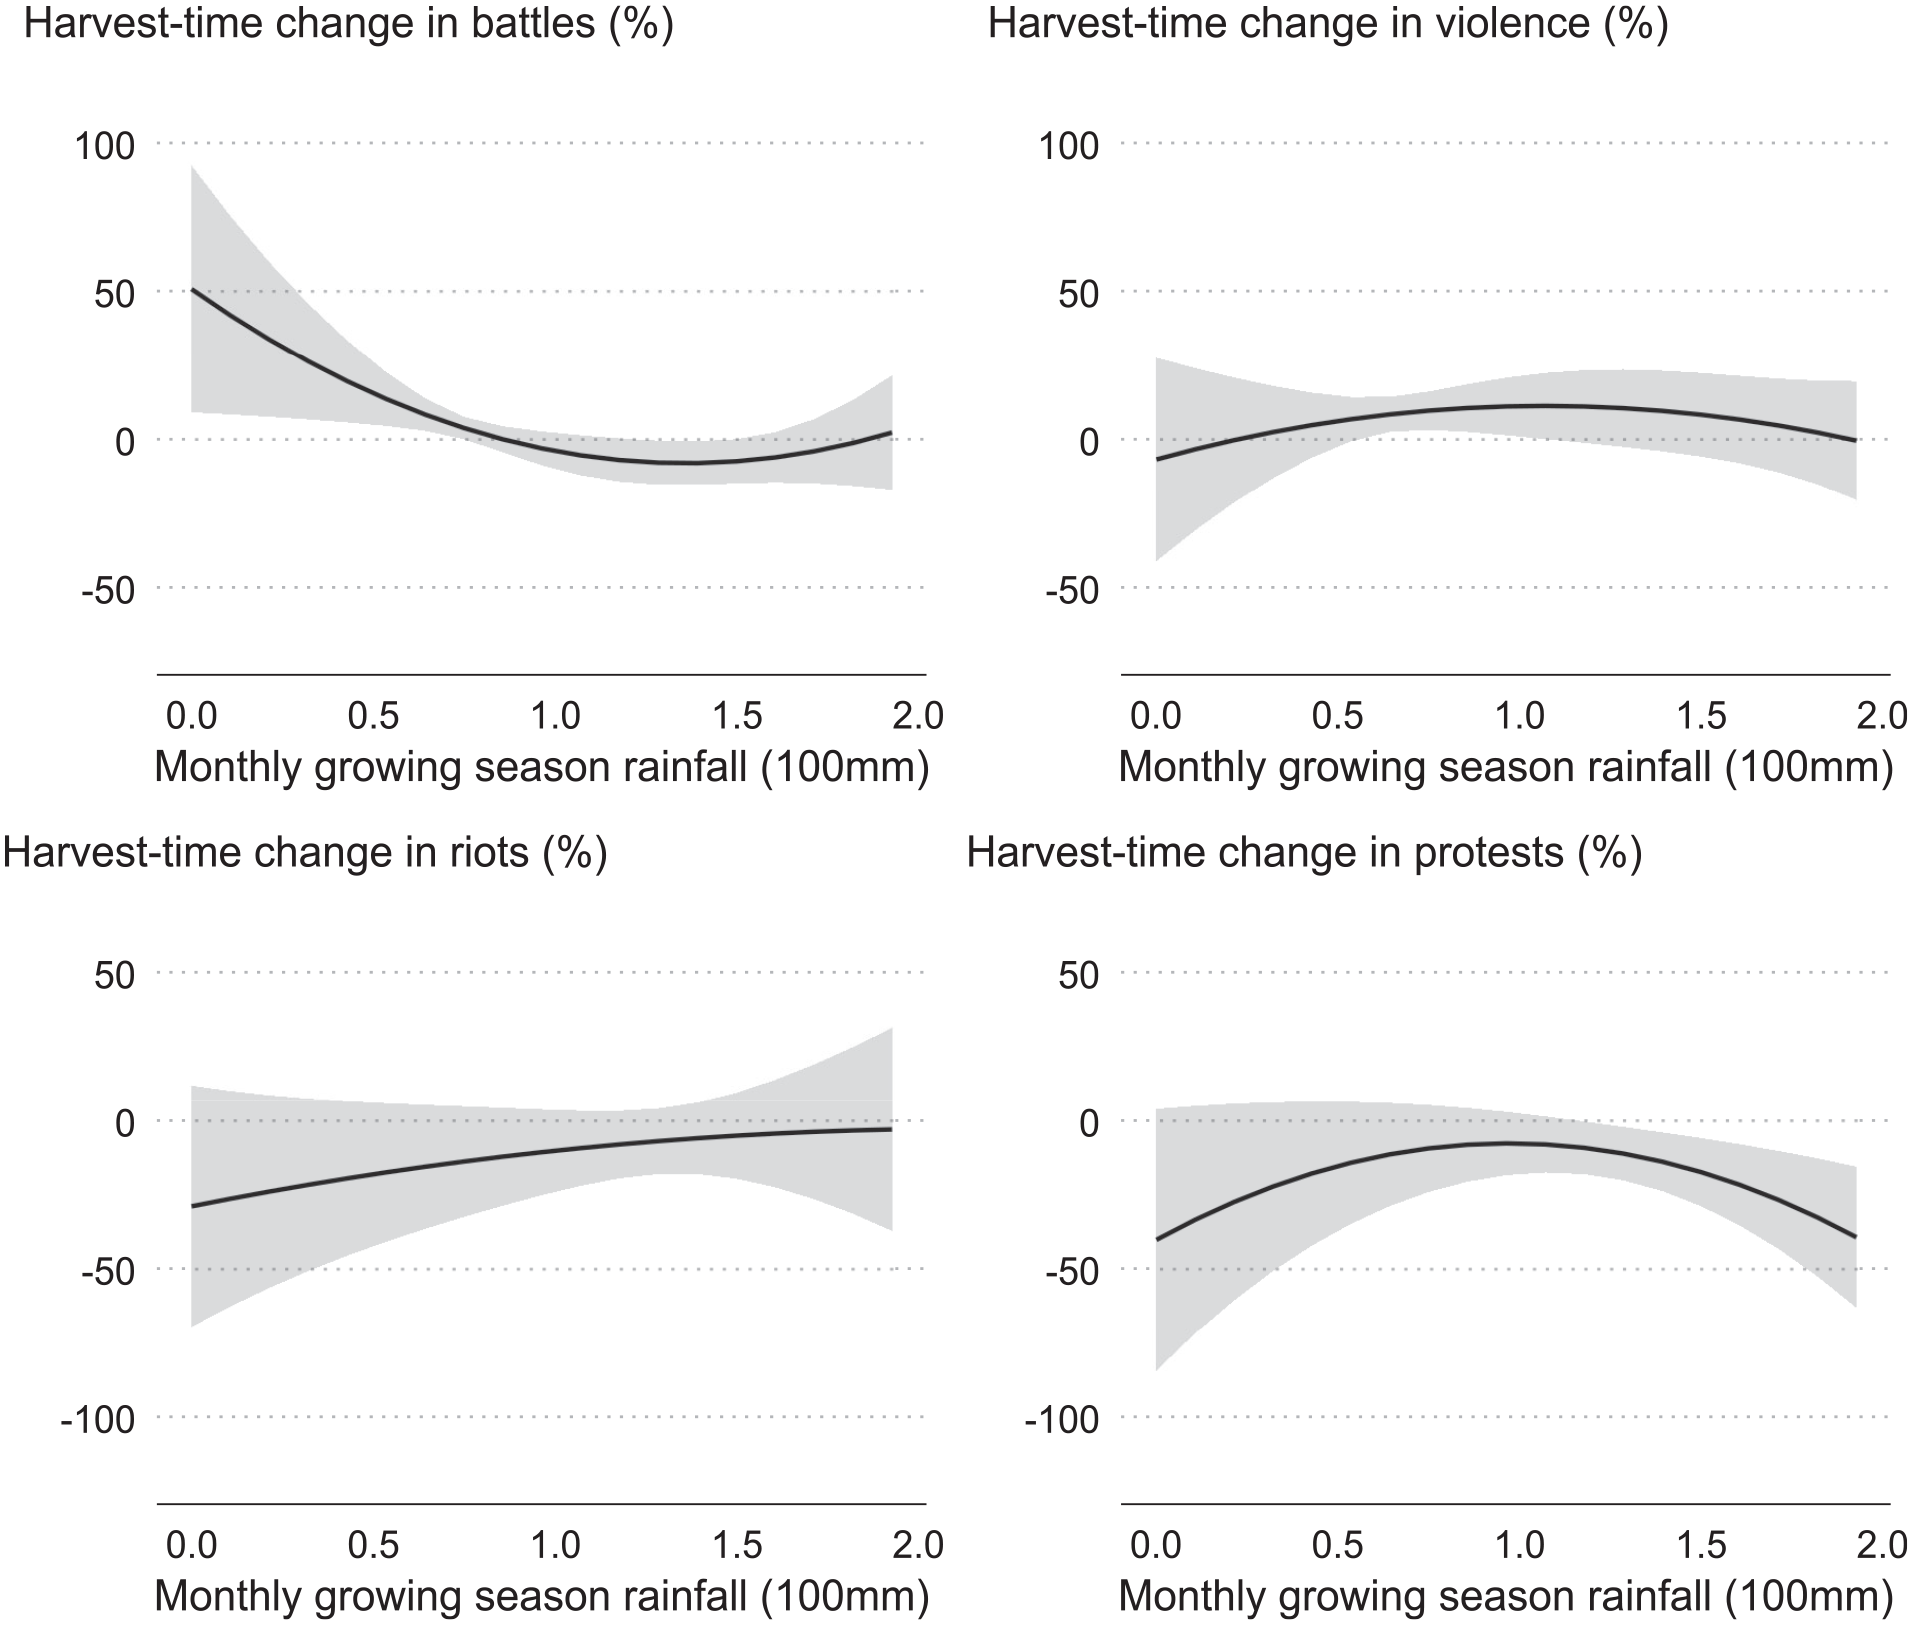
Growing season rainfall and the harvest-time conflict.
Several patterns emerge. First, we observe a harvest-time increase in violence against civilians after a growing season with average (presumably close to optimal) levels of monthly growing season rainfall, which accords with our proposed linking of the harvest-time effect to the rapacity and resentment channels. Second, we observe a harvest-time increase in battles after a growing season with scarce rainfall. This contradicts the idea that rapacity or resentment are the driving forces of this form of conflict but accords with the existing literature that links adverse weather conditions, drought in particular, with increase risks of conflict in rural or agrarian societies (e.g. Von Uexkull et al., 2016). An alternative mechanism might be at play here. Because dry conditions enable troops to engage in a military combat, the mechanism that links growing season weather with harvest-time battles is likely a manifestation of a direct effect rather than that mediated via agriculture.
In the case of social unrest, and specifically in the case of protests, in good crop years, all three pathways (of employment, income, and alternative income) of the opportunity cost channel point in the same direction, but there is an offsetting effect from the resentment channel. In bad crop years, two of the three pathways of the opportunity cost channel likely reverse: while farmers will harvest the crop regardless of its quality, lower yields will reduce the opportunity costs of protesting associated with income from farming or income from protesting. But the offsetting effect from the resentment channel will also vanish due to a smaller harvest-time change in within-cell income inequality between farmers and non-farmers.
It is generally difficult, and in the present setting impossible, to disentangle these effects. But we can argue which channels dominate the effect by observing the combined effects in good and bad crop years. The inverted U-shaped relationship between growing season rainfall and harvest-time social unrest, protests in particular, seems to suggest that the employment-related opportunity cost channel and the resentment channel are the two likely drivers of the harvest-time changes in social unrest: in good years, the effect stemming from the resentment channel nearly fully offsets the opportunity cost effect. This offsetting does not happen in years with relatively poor harvest.
Growing season conflict
Next, we investigate whether the harvest-time change in conflict is a byproduct of lingering military activity in the area. A conflict that coincides with the crop growing season may have direct and indirect effects on harvest-time conflict. The direct effect, which entails some form of path dependence, is likely to be positive. The indirect effect, manifested through the agricultural channel, is more likely to be negative, as conflict will likely deter farmers from their usual activities, and thus, lower agricultural output (Olsen et al., 2021). 5 This, in turn, may mute the rapacity and resentment channels associated with the harvest-related political violence.
We obtain a cell-specific indicator variable of conflict that takes a value of 1 if at least one incident of any form of conflict occurred during the crop growing season in the cell. We then interact this indicator variable with the treatment variable to estimate harvest-time changes in the forms of conflict in the wake of the peaceful vs. conflict-prone crop growing season. Figure 7 presents the effects of growing season rainfall on the forms of conflict at harvest (Online Appendix Table A7 shows the underlying regression results). In addition to the general positive effect on all forms of postharvest conflict (see Online Appendix Table A7), conflict incidence during the crop-growing season has a positive differential effect on harvest-time change in political violence and a negative differential effect on harvest-time changes in social unrest. Among these effects, only that associated with violence against civilians is statistically significantly different from zero.
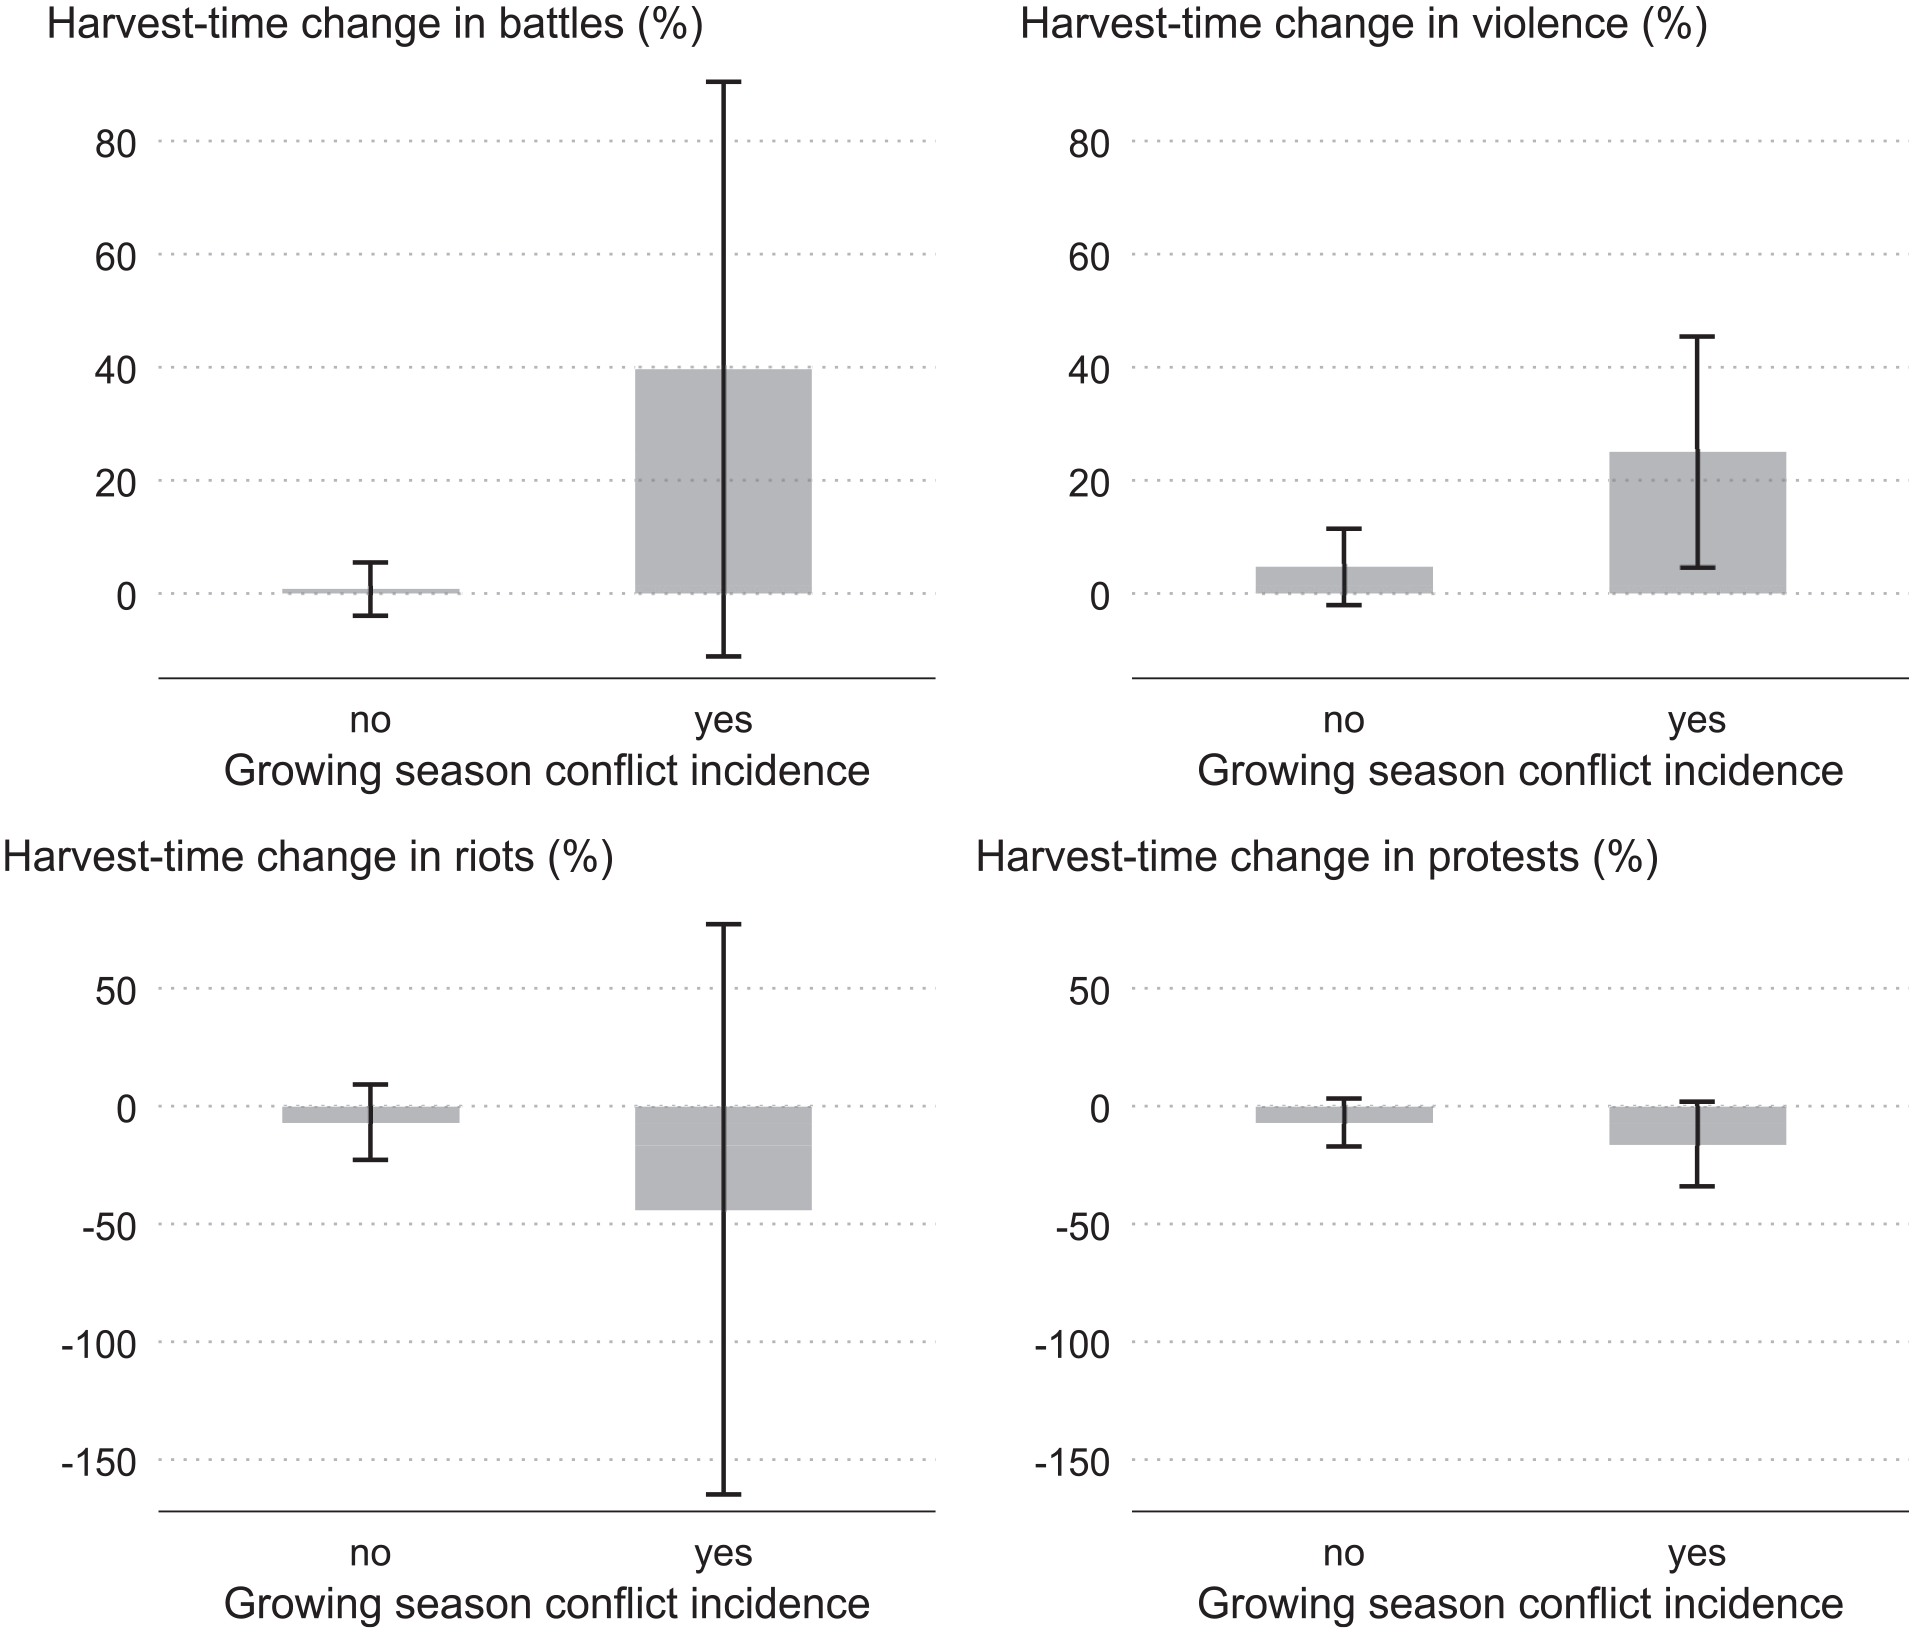
Growing season conflict and the harvest-time conflict.
Harvest-related changes in political violence and social unrest can be seen as a by-product of broader political conflict. For political violence, this aligns with the ‘living off the land’ theory, which posits that during wartime, any cooperation between fighters and farmers collapses, leading to increased violence (Koren and Bagozzi, 2017). For social unrest, the effect of growing season conflict mimics the effect of the growing season adverse weather: the harvest-time reduction in protests and riots is more pronounced when, for whatever reason, agricultural production is subpar.
Conclusion
How crucial is the harvest season in explaining the agricultural roots of social conflict? We explored this question by analyzing 14 years of monthly social conflict data covering 376 cells with one-degree resolution across eight countries in Southeast Asia – a region where rice agriculture plays a central role in rural employment and income. To better understand the pathways between harvest and conflict, we adopted a disaggregated approach. Different forms of conflict are typically carried out by different groups of people for different reasons: political violence (armed clashes between conflict actors and violence against civilians) usually involves the state, allied militias, or anti-state rebel groups, while social unrest (protests and riots) tends to be carried out by unorganized actors, often against the state or other groups.
So, instead of resolving the debate over the motives and mechanisms of resource-related conflict, we proposed that different forms of conflict (usually instigated by different types of conflict actors) are linked to seasonal changes in agricultural output through different pathways. Changes in political violence, especially that targeted against civilians, can be better understood through the rapacity channel wherein organized armed groups target civilians when and where it matters the most. Changes in social unrest can be best explained by the opportunity cost channel wherein farmers are less inclined to be involved in protests and demonstrations when they are busy harvesting or have just observed harvest-related positive income. We also suppose the presence of the resentment channel that has the potential to reinforce the rapacity channel (a short-term increase in income inequality may trigger communal conflict) but mitigate the opportunity cost channel (non-farmers in predominantly agrarian regions may be provoked by the positive changes in income observed by farmers).
We estimated a 9% increase in violence against civilians and up to a 6% increase in battles during harvest months compared to the rest of the year. These effects are statistically significant and, for the most part, robust to a range of sensitivity tests. Notable exceptions are when we omit Myanmar or the years 2016 or 2021 from the data. But in so doing, we discard a large number of conflict incidents, suggesting that the observed effect is primarily driven by conflict-prone locations and periods. We also estimated a sizeable decrease in protests and riots, but these effects are statistically indistinguishable from zero. Finally, all these estimated effects are amplified or more precisely estimated in rural cells, as well as in cells with rainfed agriculture.
In examining the mechanisms, we find that the increase in political violence, specifically violence against civilians, manifests after relatively good crop years, while a decrease in protests is evident after relatively bad crop years. This is a reassuring finding, particularly vis-à-vis our proposed effects governing different forms of conflict. An increase in political violence after a reasonably good harvest echoes the literature on food abundance and conflict (McGuirk and Burke, 2020; Koren, 2018). A decrease in protests only after a poor harvest is due to the opportunity cost channel not being offset by the resentment channel, as there is little change in harvest-related within-cell income inequality (between farmers and non-farmers) in those years.
This study offers insights into conflict resolution and development policies. First, both theoretically and empirically we make a case for one size does not fit all argument in conflict resolution: the harvest season is associated with opposite outcomes for different groups and different types of conflict. Organizations concerned about conflict writ large need to tailor their programs to the region, the type of conflict anticipated, and the groups involved in conflict. Recognizing that changes in political violence and social unrest in rural Southeast Asia are associated with rice harvest months can greatly assist in enhancing planning efforts by local governments and international agencies focused on rural development programs.
While much of the literature and indeed much development work are focused on the effects of food insecurity, our findings suggest that relative food abundance can be associated with an increase in political violence, and that food insecurity should not be the sole focus of conflict resolution, humanitarian, and development efforts. To the extent that this violence is driven by rapacious attacks on civilians – particularly farmers in crop-producing areas – those looking to protect civilians from violence can target their efforts more effectively.
The regularity of this finding – essentially that an increase in political violence may occur every year around the same time – can guide the timing and focus of development aid and external assistance to minimize conflict between groups. Good crop-producing years should be seen as times of special importance, given the increased chances of conflict. An expectation of seasonal conflict would lead to more robust preparations by stakeholders, both in terms of addressing the larger conflicts that can produce political violence, and in protecting farmers and agricultural surplus.
Supplemental Material
sj-pdf-1-jpr-10.1177_00223433241305990 – Supplemental material for Agricultural roots of social conflict in Southeast Asia
Supplemental material, sj-pdf-1-jpr-10.1177_00223433241305990 for Agricultural roots of social conflict in Southeast Asia by Justin V Hastings and David Ubilava in Journal of Peace Research
Footnotes
Replication data
The dataset, codebook, and do-files for the empirical analysis in this article, along with the Online Appendix, are available at ![]() . All analyses were conducted using R.
. All analyses were conducted using R.
Funding
The authors acknowledge the financial support of the Australian Research Council (DP240101563) and the Sydney Southeast Asia Centre.
Notes
JUSTIN V HASTINGS, b. 1979, PhD in Political Science (University of California, Berkeley, 2008); Professor of International Relations and Comparative Politics, University of Sydney (2011–present); current main interest: technology and Indo-Pacific security; most recent book: A Most Enterprising Country: North Korea in the Global Economy (Cornell University Press, 2016).
DAVID UBILAVA, b. 1981, PhD in Agricultural Economics (Purdue University, 2010); Associate Professor of Economics, University of Sydney (2012–present); current main interest: agricultural markets and seasonal conflict.
References
Supplementary Material
Please find the following supplemental material available below.
For Open Access articles published under a Creative Commons License, all supplemental material carries the same license as the article it is associated with.
For non-Open Access articles published, all supplemental material carries a non-exclusive license, and permission requests for re-use of supplemental material or any part of supplemental material shall be sent directly to the copyright owner as specified in the copyright notice associated with the article.