
Abstract
Armed conflict actors frequently target civilian populations. Thus, an improved understanding of such behaviour could pave the way to reducing it. We use the Civilian Targeting Index (CTI) and a broad array of geo-referenced data to investigate the spatio-temporal and economic dynamics of civilian targeting by conflict actors in Africa. Two main insights are generated. First, the civilian targeting behaviour of African non-state conflict actors is strongly influenced by the behaviour of other proximate actors. In particular, non-state actors tend to increase their civilian targeting after nearby non-state actors have done so. Possible mechanisms to explain such spatial spillovers include emulation and retaliation. Second, a negative relationship between economic activity and civilian targeting exists and applies to both state and non-state actors. In addition, CTIs of non-state actors tend to increase with population density, the geographical spread of their conflict activity and conflict duration. State actors have higher average CTIs than non-state actors do, but the gap between the two actor types tends to close during long-duration conflicts.
Introduction
Violence against civilians has been a deplorable element of numerous conflicts over the years and across all world regions. The most recent examples include conflicts in Syria, Yemen, Afghanistan, Thailand, Mali, Sudan and the Democratic Republic of Congo, to name just a few. In 2018 alone, intentional attacks on civilians took place in 30 countries and killed 4,515 people (Pettersson, Högbladh & Öberg, 2019). Nonetheless, the mechanisms leading to attacks on civilians and their spread are still not fully understood. Improved data and developments in econometrics have given way to a wave of studies that investigate factors that drive actors 1 to target civilians rather than battle with their armed counterparts (e.g. Joshi & Quinn, 2017; Raleigh & Choi, 2017; McDoom, 2012; Verpoorten, 2012). However, spatio-temporal diffusion of violence against civilians has yet to be explored.
We contribute to the micro studies on violence against civilians and the literature on spatial determinants of armed violence by asking whether civilian targeting spreads across space and time. In addition, we test the hypothesis that conflict actors’ civilian targeting proclivity tends to be a decreasing function of the economic resources available to these actors. Anderton (2014) suggests that a well-resourced army will be able to directly challenge the armed forces of its enemies while largely avoiding committing atrocities that could compromise its domestic and international attractiveness, hence its local support, funding and supply of soldiers. However, at low resource levels direct challenges to opponents may be counterproductive, leaving attacks on unarmed civilians as one of the few affordable and available tactics. Lack of resources may also lead to low troop morale and a lack of tools for enforcing discipline (Humphreys & Weinstein, 2006), resulting in violent attacks on civilians. Additionally, we consider a range of possible correlates of civilian targeting such as conflict duration, population density and the presence of minorities (e.g. McDoom, 2014a; Raleigh, 2012; Verpoorten, 2012), treating them mostly as controls rather than objects of primary interests. We go beyond the small-N setup, which is prevalent in the existing literature, and analyse a large sample of conflict actors over time. To the best of our knowledge, this is the first study that explores diffusion of civilian targeting by following each actor’s activity areas over time. This allows us to show results that uncover patterns that are common across actors and can be generalized to a variety of conflicts.
We focus on post-Cold War Africa where violence against civilians accounts for 35% of all politically violent events (Raleigh, 2012), corresponding to nearly 5,400 incidents of one-sided violence between 1992 and 2010 (Sundberg, Lindgren & Padskocimaite, 2010). We distinguish between state and non-state actors who have been shown to exhibit divergent behaviour towards civilians (Eck & Hultman, 2007), possibly due to varying challenges in identifying enemy targets (Joshi & Quinn, 2017) or sources and ways in which they are able to draw resources to support their warring activities. We observe that increased civilian targeting spreads from one non-state actor to other proximate non-state actors, a result that is consistent with a ‘demonstration’ or ‘emulation’ mechanism proposed by Lake & Rothchild (1998). However, we do not find such effects for state actors. This divergence for the two types of actors may be partly due to the smaller sample of state actors compared to non-state ones. Or, perhaps, non-state actors react to their immediate surroundings to a greater extent than state actors do. We also observe large and statistically significant effects linking greater economic activity with less civilian targeting. This shows that actors of either type tend to rely relatively less on one-sided violence when they can access a rich economic base.
The structure of this article is as follows. The next section reviews recent literature on the spatial spread of conflict and civilian targeting. The following three sections explain the hypotheses, data and modelling strategy, respectively. We then present our results followed by three descriptive examples illustrating how civilian targeting spreads across armed groups, space and country borders. Finally, a short discussion provides some speculations on policies that might reduce civilian conflict casualties and directions for future work on the subject.
Theoretical background and related literature
Conflict and geography
Analysis of the role of geographical factors in determining war-fighting strategies is probably as old as war itself and goes back at least to the classic book of Sun Tzu from the sixth century BCE (Sun Tzu, nd/1981). Recent research has investigated the spread of war through time and space, sometimes borrowing ideas originally applied to the spread of diseases (e.g. Alcock, 1972). Richardson (1960a,b), in his pioneering quantitative work, found that wars spread out rather randomly across space. However, these early findings were overturned after the arrival of more and higher-quality data plus more sophisticated methods. Thus, Most & Starr (1980) found a ‘border effect’ whereby a country’s war participation probability is increasing in the war activities of bordering countries. Similar results have been obtained for different time periods (e.g. Starr & Most, 1983) and for the spread of cooperative, in addition to conflictive, behaviour (e.g. Kirby & Ward, 1987). The statistical robustness of these sorts of findings has been enhanced considerably by the development of spatial econometrics (Anselin, 1988), specifically by the articles of Anselin & O’Loughlin (1990, 1992) and O’Loughlin & Anselin (1991). These works abandoned the traditional assumption of independence between warring groups, accounting for both spatial dependence and spatial heterogeneity. Gleditsch (2002), Ward & Gleditsch (2002) and Buhaug & Gleditsch (2008) developed spatial modelling techniques further within the armed conflict context and consistently found spatial dependence in the existence of armed conflict between proximate nations. Further research has investigated the correlates of spatial diffusion of armed conflict, including ethnic ties, intergroup dynamics, natural resources, neighbouring peacekeepers, mountains and land area (e.g. Buhaug & Gates, 2002; Braithwaite, 2006; Lake & Rothchild, 1998).
This spatial diffusion literature has greatly advanced our understanding of armed conflict, yet it has drifted away from the centuries-long interest of war scholars in the spatial determinants of the strategies of armed actors. Specifically, the modern focus has been at the macro level of conflict onset/incidence, leaving micro-spatial dimensions of armed conflict largely unexplored. Nevertheless, some works within this stream do dig beneath the country level to uncover cross-border diffusion of conflict through ethnic groups. In particular, Buhaug & Gleditsch (2008) find that contagion effects appear mainly in separatist struggle and suggest that transnational ethnic ties could serve as a channel for war diffusion. This echoes Lake & Rothchild (1998) who ascribed the spread of ethnic conflict to a ‘demonstration effect’ whereby warring actors learn from neighbouring actors. This presents a close link to our work as we disaggregate down to the behaviour of armed conflict actors and ask whether civilian targeting by one actor leads to civilian targeting by other nearby actors.
Civilian targeting in conflict
There already exists an interesting literature on civilian targeting in conflict 2 which could be broadly categorized into three strands dealing with: (i) characteristics of victims, (ii) social dynamics and behaviour of perpetrators, and (iii) organizational structures of perpetrator groups and their access to resources. Within the first strand, Joshi & Quinn (2017) investigated the determinants of which groups of civilians were targeted by rebels and governments in the civil war in Nepal and showed that victims of one-sided violence shared key demographic characteristics with combatants killed in battle. Thus, a strong continuity in the characteristics of inhabitants across space could drive the spatial spread of civilian targeting. For example, if a group is targeted because of some of its traits and individuals with the same or similar traits inhabit neighbouring areas, then the perpetrator may wish to target those individuals as well.
In the second strand, social dynamics and their impact on intergroup violence in Rwanda were extensively studied in the works of McDoom, who showed that mobilization of social groups to target other civilians follows a two-stage process. First, the emotions of distrust and fear lead to polarization of attitudes and perceptions of the target group as ‘others’ or legitimate targets. Second, the presence of material and structural opportunities turns these emotions into violence (McDoom, 2012). But even when these conditions are present, questions still remain about which individual group members participate in killings and which do not. McDoom (2013) showed that social influence within a person’s micro-spatial environment is a significant factor in determining the likelihood of participation in violence. The evidence that participants in killings are likely to come from the same neighbourhoods suggests that targeting of civilians can spread over time and across space. This diffusion can be at its worst where population density is high, leading to powerful social network effects (McDoom, 2014a), vigorous competition for land, jobs, and other resources among groups and individuals (Verpoorten, 2012) and high accessibility of civilians for targeting (Raleigh, 2012). These negative effects of social influences are less likely to materialize in cohesive communities with high levels of trust and cooperation. Such communities are better prepared to resist external attempts to raise divisions (McDoom, 2014b) and thus the spread of genocidal ideas is more likely to be thwarted at the first stage of the mobilization process. The organizational and resource environments have also been shown to matter for the allocation of lethal force by armed actors. Kalyvas (2006) focused much of his work on explaining how actors choose between indiscriminate violence and selective violence. The application of selective violence is a relatively resource-intensive activity because accurately identifying true enemies requires maintaining some degree of territorial control within which to conduct expensive intelligence activities. In contrast, indiscriminate violence can be a resource-cheap way to kill some enemies but at the cost of repelling people into the ranks of rival actors, as often happened under Nazi occupation (Kalyvas, 2006). 3 Kalyvas & Kocher (2009) found that during the Vietnam War rebels did indeed tend to use selective violence more in areas where they had good, but not complete, control. There is a potential link between the control-based theory of Kalyvas (also echoed in Raleigh & Choi, 2017) and the economic theory of Anderton (2014) and Ferrero (2013) that proposes civilian targeting to be an ‘inferior input’ into a war technology, implying that under certain conditions civilian targeting will be a decreasing function of the resources available to an actor. This is reflected in the findings of Wood (2010), who showed that weak actors kill more civilians than their more capable counterparts as they are unable to deliver sufficient benefits to civilian populations that could ensure their loyalty. Wood (2014) somewhat reconciles the control-based and inferior input theories by showing that severe battlefield losses and resulting resource demands lead to an increase in attacks on civilians but this relationship is conditioned on the degree of territory control and sources of actor’s financing.
Some of the above studies are similar to our work in that they contain a spatial or spatio-temporal dimension (e.g. Joshi & Quinn, 2017; Schutte, 2017; McDoom, 2013), but most of them consider only one or two countries or conflicts in their analysis (Wood, 2014, 2010; Eck & Hultman, 2007, are notable exceptions). In contrast, our work is a large-N study of conflict actors that explores diffusion of civilian targeting across actors and over time, linking directly to Hicks et al. (2011) and Lee (2015), who characterize each actor with a ‘Civilian Targeting Index’ (CTI) measuring the percentage of deaths attributable to that actor that are classified as intentional killing of civilians. Hicks et al. (2011) find that the CTI is, on average, a decreasing function of total deaths attributable to an actor. Lee (2015) shows that CTIs of non-state groups tend to increase over time. There could be economic factors in the spirit of Anderton (2014) that influence these relationships. For example, holding a rebel actor in the field for a long period of time may deplete its resources, driving it toward increased civilian targeting as a cheap alternative to battling with a government. However, Hicks et al. (2011) and Lee (2015) did not explore such possibilities.
The hypotheses
The literature discussed above provides several possible theories explaining the spread of civilian targeting across space and over time as well as some evidence to support such a notion (e.g. Joshi & Quinn, 2017; McDoom, 2013). Nonetheless, those are low-N studies that tend to focus on one or two conflict episodes, whereas we aim to examine whether the diffusion of civilian targeting can be generalized to a larger sample of actors across conflicts and years. This leads to our first hypothesis: Hypothesis 1. The civilian targeting spillover hypothesis: Civilian targeting, as measured by the CTI, follows a diffusion process whereby civilian targeting by one actor spreads with a time lag to nearby actors.
It is plausible that behaviour of warring actors is influenced by behaviour of other nearby armed groups, as suggested by Raleigh & Choi (2017). The first law of geography suggests that such influences should decay with distance (Tobler, 1970). However, responding to the tactics of other actors is likely to require some time to observe their behaviour and its consequences, so we expect that there will be a time delay in the spatial diffusion of civilian targeting.
Our second hypothesis focuses on economics and resources available to actors and is motivated by the ‘inferior input’ theory of Anderton (2014). Hypothesis 2. The resource-scarce actor civilian targeting hypothesis: An actor’s civilian targeting, as measured by the CTI, tends to decrease as the resources available to the actor increase.
We expect that actors’ reliance on violence against civilians decreases as their resource endowment rises. A well resourced army will be able to acquire better armaments, recruit and train more troops, and, consequently, directly challenge the armed forces of its enemies. Avoiding atrocities against civilians could also be motivated by the actor wanting to avoid far-reaching domestic or international repercussions that could adversely affect the actor’s attractiveness to either domestic or international support bases and diminish its political position. At low resource levels, a weak actor may be unable to mount a direct challenge against its opponent’s army as this would likely end in a crushing destruction, leaving attacks on unarmed civilians as one of the few affordable and available conflict tactics. Moreover, a lack of resources may lead to low troop morale and inability to enforce discipline (Humphreys & Weinstein, 2006), potentially resulting in violent attacks on civilians.
We distinguish between state and non-state actors as they are likely to have different motivations to kill civilians. Joshi & Quinn (2017) argued that in civil war, governments and rebels face two distinct information problems when identifying opponents’ targets, resulting in adoption of differing tactics in their treatment of civilian populations. Linking to our second hypothesis, we argue that tactics employed by the two types of actors are likely to be influenced by the way they draw resources. Governments typically have a tax base on which they can rely, at least to some extent, and which often spreads beyond the geographic areas affected by localized conflicts. Similarly, they should find it easier to draw troops from parts of the country that are not in conflict. They may also find it easier to attract help and support from their international partners (other states or intergovernmental organizations), but the same partners may impose heavy penalties for violence against civilians by imposing sanctions or cutting foreign aid flows. In contrast, the resources of non-state actors are likely to be less diversified. They might rely on voluntary donations and memberships of their supporters and possibly proceeds from some clandestine business operations, but if these prove to be insufficient then they may have to resort to looting or forceful extraction of resources from the territories and populations under their control. Not being a part of the international economic and political system, they have fewer opportunities to receive support from abroad than their state counterparts. This, however, means that they could be less susceptible to international pressures and consequently show less restraint in treatment of civilians. Overall, we expect one-sided violence by non-state actors to be sensitive to changes in the local economic conditions in the territory they control, whereas a government’s behaviour towards civilians is expected to depend on the economic performance of the entire national economy.
Finally, we maintain a secondary focus on a range of possible correlates of civilian targeting that received some attention in earlier studies, such as conflict duration, population density and the presence of minorities (e.g. Lee, 2015; McDoom, 2014a; Raleigh, 2012; Verpoorten, 2012), considering them mostly as controls rather than as objects of primary interests.
Data
Our dependent variable is the Civilian Targeting Index (CTI) which measures civilian deaths from one-sided violence inflicted by an actor in a given year as a percentage of total deaths associated with this actor during the same time period (Hicks et al., 2011). CTIs take values between 0, when an actor is not recorded as targeting civilians at all, and 100 when an actor’s lethal behaviour is entirely dedicated to civilian killing. We calculate CTI values for warring actors operating in Africa between 1992 and 2010 using the data on one-sided violence and battle-deaths from the Uppsala Conflict Data Program Geo-referenced Event Dataset (UCDP GED; Sundberg, Lindgren & Padskocimaite, 2010), 4 which lists 283 conflict actors in Africa between 1992 and 2010. Of these, 189 actors (67%) have CTI = 0, 29 actors (10%) have CTI = 100, and the rest have CTIs strictly between 0 and 100. An advantage of the CTI is that, by focusing on the intensity of civilian targeting within each actor’s tactical mix, rather than the absolute number of war-deaths, it ensures that our results are readily applicable to conflict actors of all sizes.
We then use the UCDP GED Polygon Dataset (Croicu & Sundberg, 2012) to construct polygons representing geographical areas of each actor’s conflict activities within each year. A UCDP GED polygon is ‘the smallest possible convex geographical area that encompasses the locations of all UCDP GED events in each covered UCDP dyad within a specified time period’ (Croicu & Sundberg, 2012). Figure 1 provides an illustrative example of how UCDP GED polygons are constructed. The dark points represent single battles or one-sided violence attacks; a convex hull is then drawn to encompass all events belonging to a given dyad in a given year.
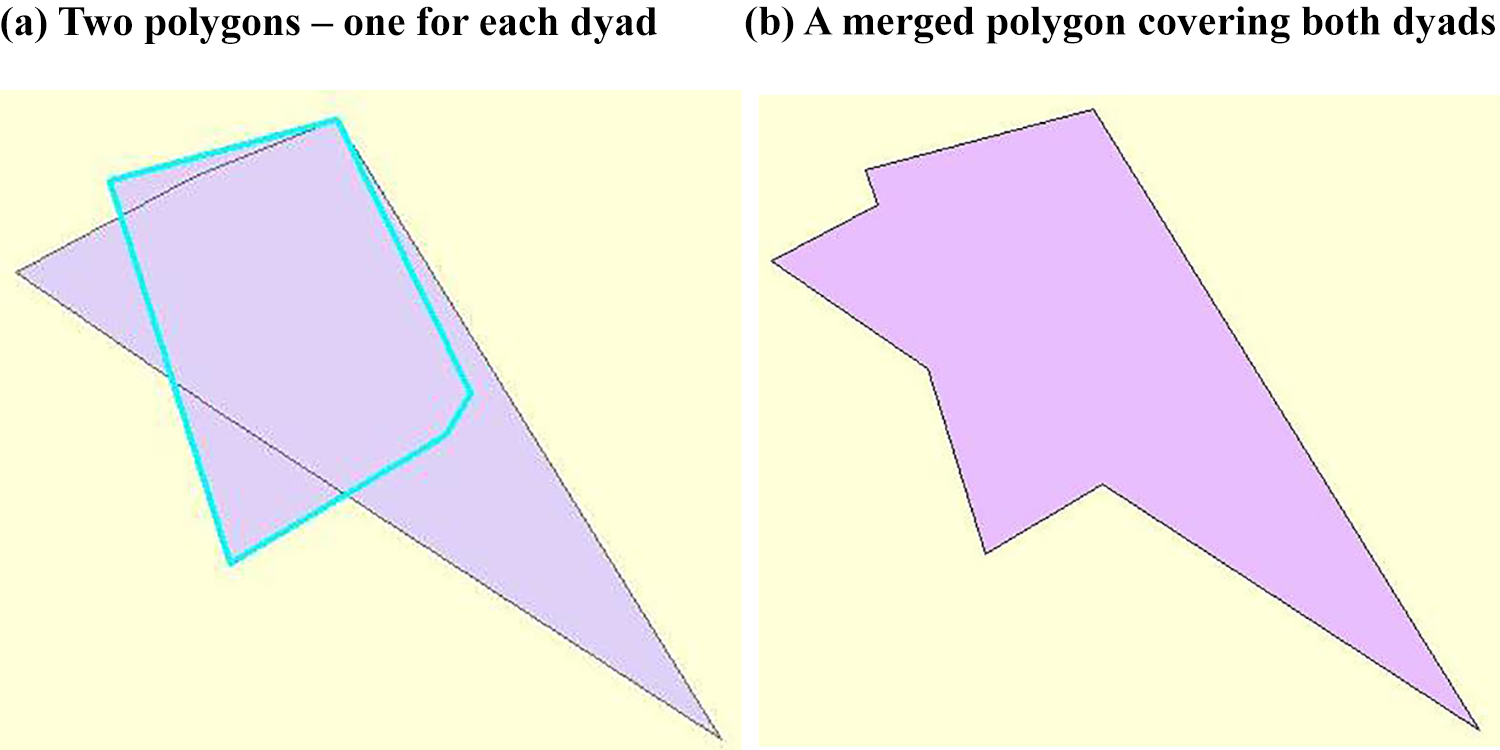
For actors involved in more than a single dyad in a given year we construct polygons that represent all the conflict activity of these actors within this year. Figure 2 shows how we construct an activity polygon for the government of Liberia which, in 2001, was involved in two dyads. We drop split dyads (4.16% of the dataset) to avoid excessively large polygons covering large geographic areas where no activity occurred.
We create 814 polygons in total which represent 34 state and 253 non-state actors over the period from 1992 to 2010, dropping actors that did not cause any deaths in a given year. We then calculate the distances between polygon centroids and build this information into the spatio-temporal weighting matrix that we use in our regressions.
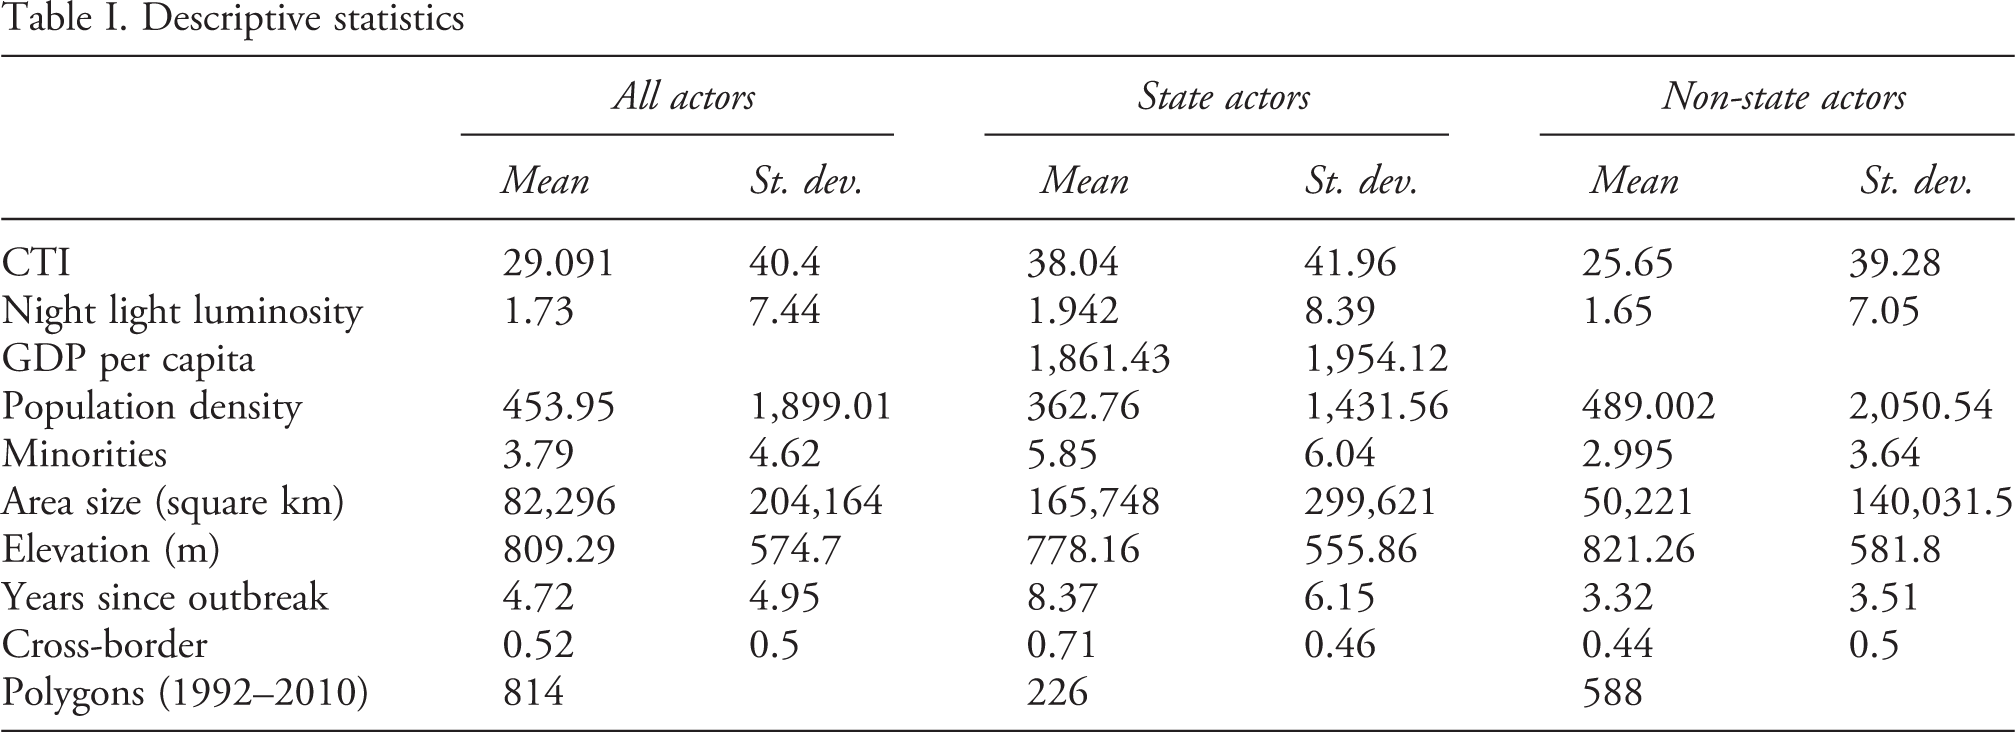
We then compute a range of polygon-specific exogenous variables which are summarized in Table I. The data on population per square kilometre come from the Global Human Settlement Layer (GHSL) project (EC-JRC, 2015) from which we obtain snapshot pictures of spatial distribution of human populations in Africa in the years 1990, 2000 and 2015. We then estimate the population size in each of the remaining years, t, by picking the nearest year before and the nearest year after year t for which the data are available, and assuming a constant population growth rate between those years. Having population estimates for each year, we compute a mean Population density by dividing population size within each polygon by its area size.
5
The US Geological Survey’s Center for Earth Resources Observation and Science (1996) Composition of two UCDP GED polygons The area of operation for the government of Liberia in 2001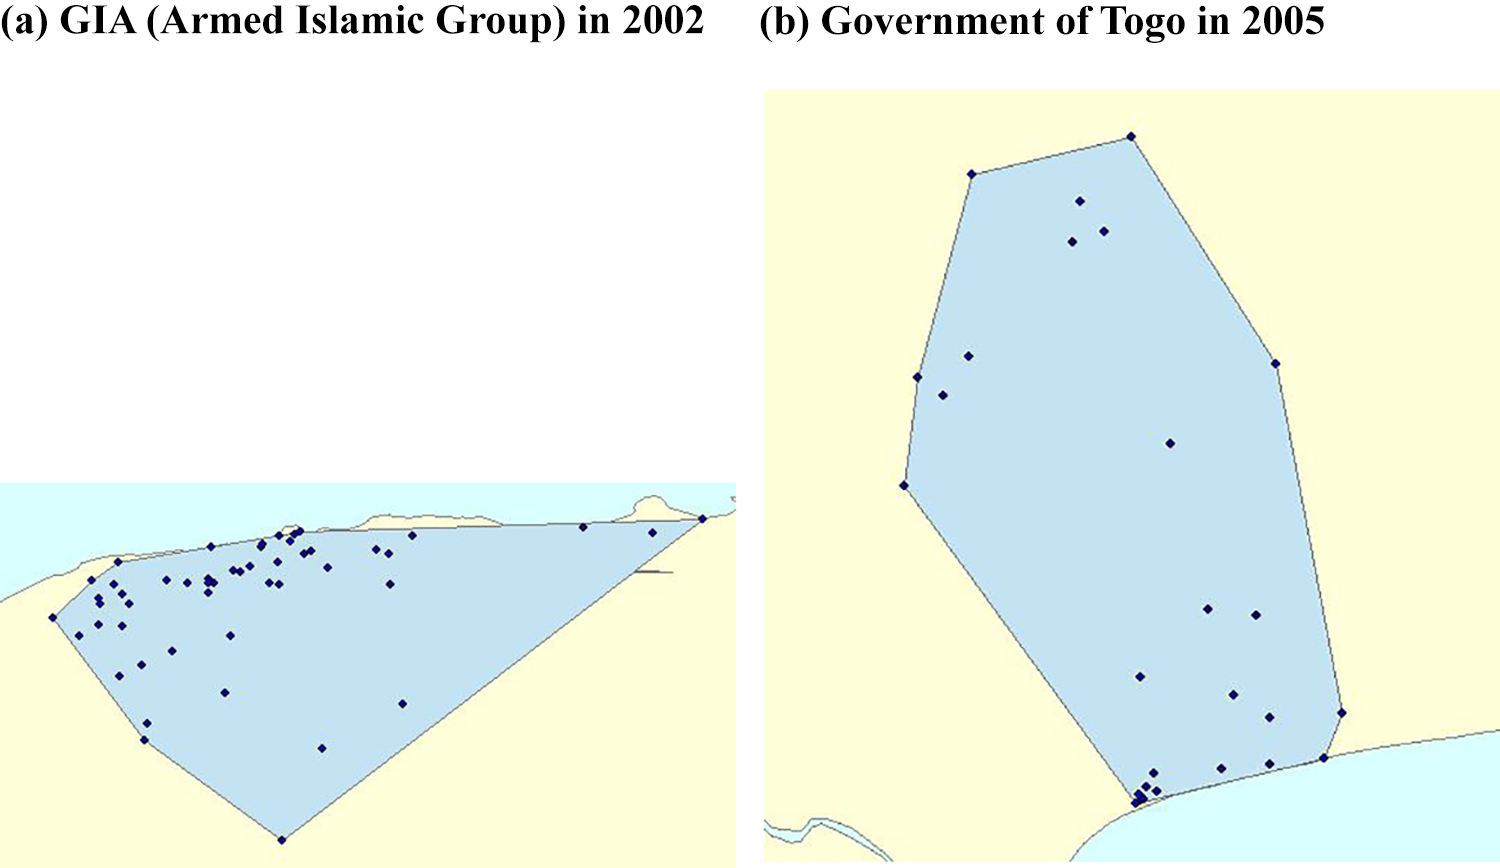
Descriptive statistics
The remaining variables described in Table I serve mainly as controls, yet it is still worthwhile to speculate briefly on their expected signs. Working from the idea that civilian targeting is mainly the province of relatively poor conflict actors, we would predict a negative relationship between Area size and CTI – greater resources are needed to control large territories than are needed to control small territories. The costs of gathering intelligence on enemies are likely to be higher in densely populated areas than in sparsely populated ones (Kalyvas, 2006), suggesting that CTIs will increase with population density. Rebels might be costly to find at high elevations, leading to a positive association between Elevation and CTIs of state actors. Ethnic diversity is a correlate of civil war prevalence (Elbadawi & Sambanis, 2002) and ethnic ties play a role in the spread of armed conflict (Buhaug & Gleditsch, 2008), so the minorities variable may be linked with CTIs, possibly via some of the channels described in Joshi & Quinn (2017) and McDoom (2014b, 2012). Governments often struggle to project their power into border zones (Buhaug & Rød, 2006) across which rebels can flee to escape government forces. Thus, we might expect CTIs for state actors to be positively correlated with the border variable, Cross-border.
Empirical strategy
We hypothesize that actors’ behaviours will depend on those of nearby actors, probably after some time lag (Raleigh & Choi, 2017). Therefore, we employ a spatio-temporal model that includes temporally lagged neighbouring observations through a spatial lag operator and takes actor-year as the unit of analysis. More specifically, we create a regressor from past CTI values of neighbouring actors that are weighted to account for potential distance decay effects. This variable captures processes of actors feeding off one another while reducing endogeneity issues in the estimation (Beck, Gleditsch & Beardsley, 2006). Note that the inclusion of this spatio-temporal lag still does not rule out the possibility Conflict polygons in East Africa: 1999–2002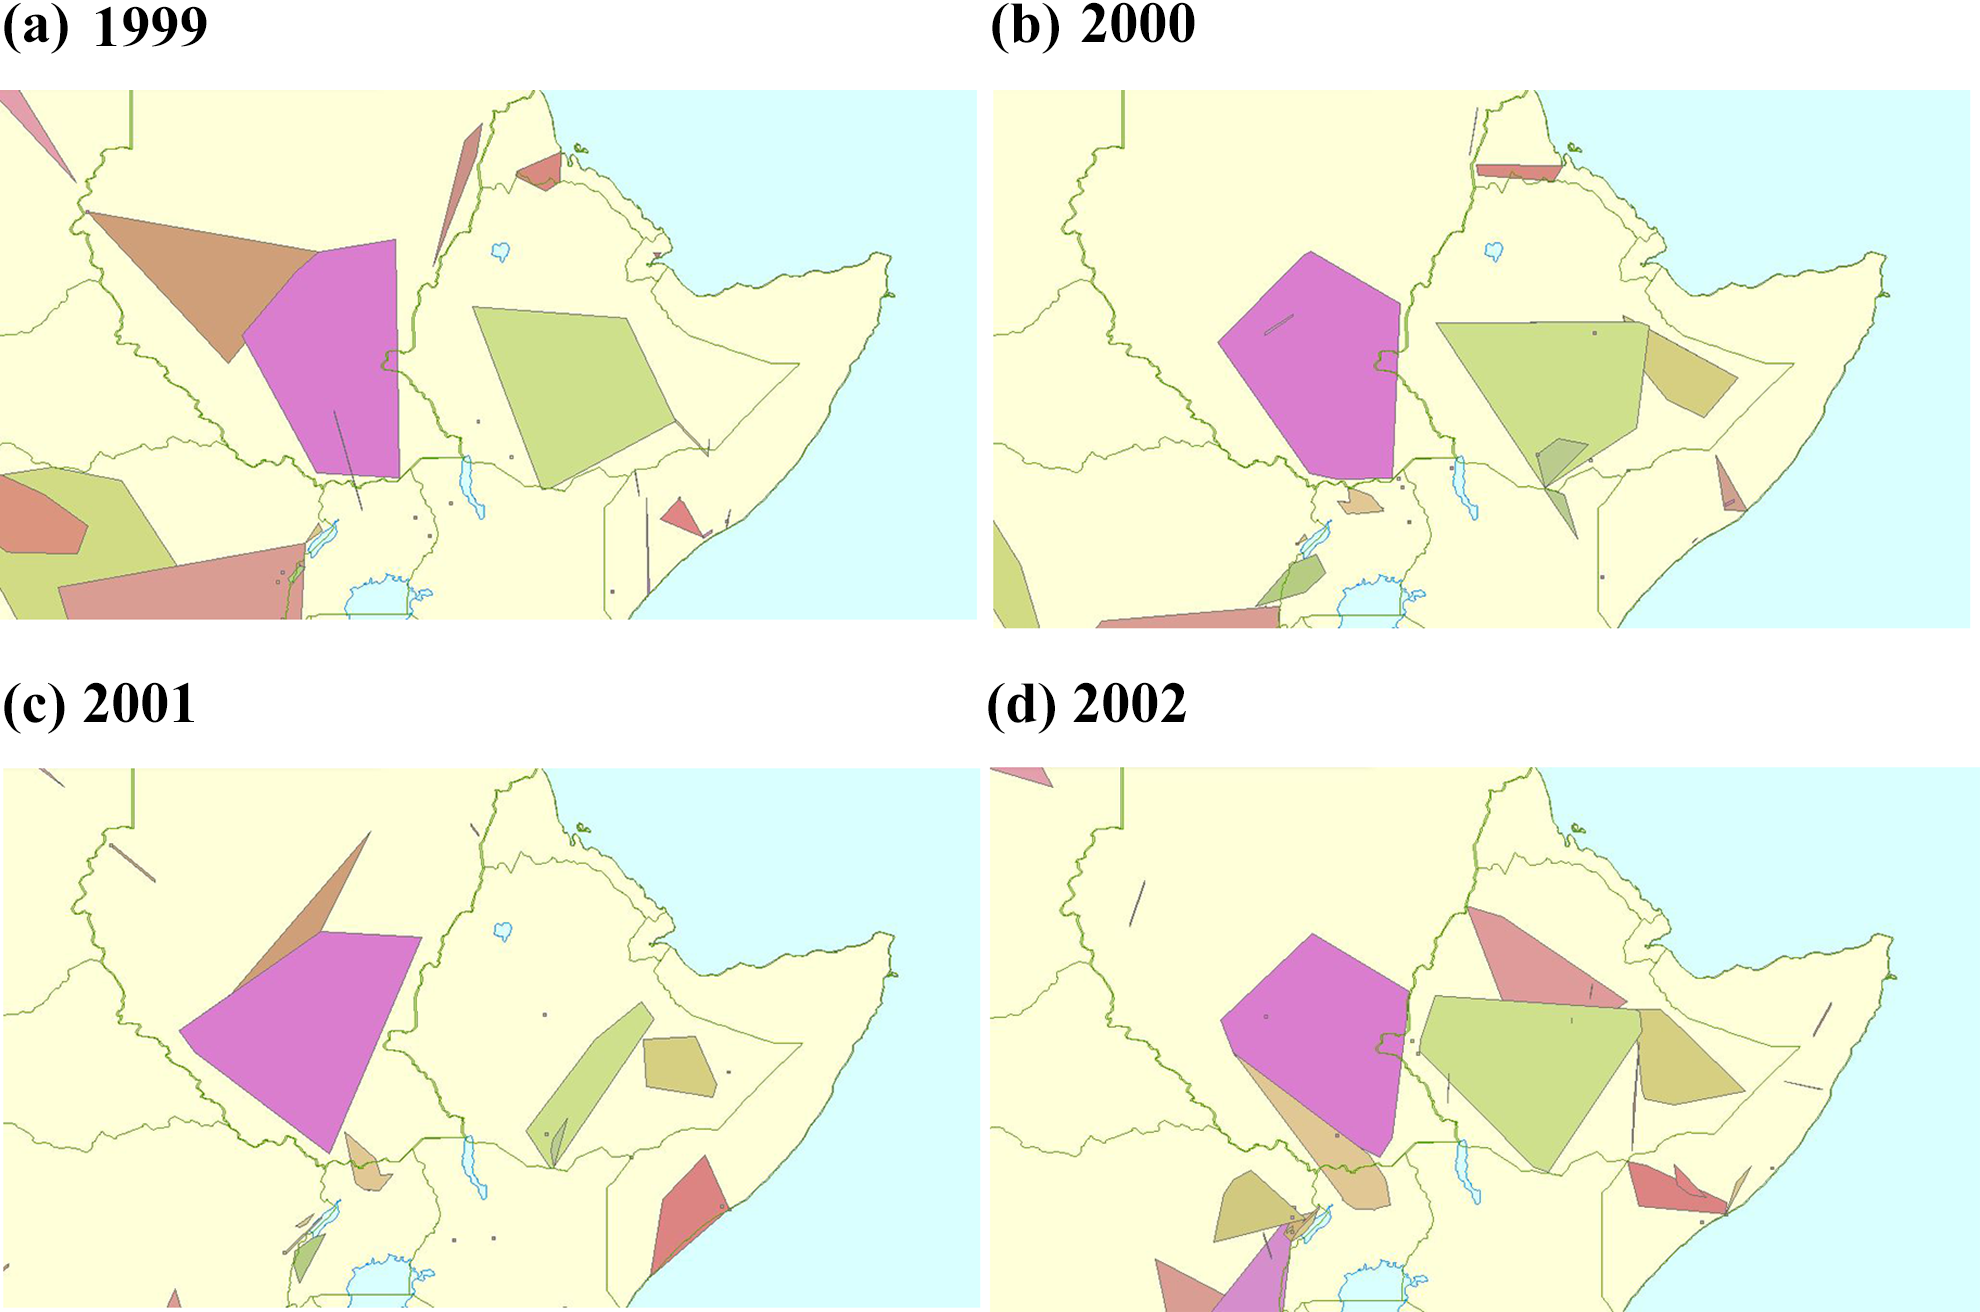
Our main model, known as a SAC model (LeSage & Pace, 2009) or SARAR (Drukker, Prucha & Raciborski, 2013), is written as


Given this model,
Most actors in our data are not observed throughout the entire sample period but rather appear at some point in time and disappear after a few periods. Moreover, geographical areas over which actors operate, and thus their attributes, change from year to year. Figure 3 provides a sense of the spatial dynamics of armed conflict in East Africa with the colour-coded polygons representing active actors in the region between 1999 and 2002. This unbalanced nature of our panel does not cause problems because our estimation strategy does not require balance as long as the weighting matrix W reflects the true underlying temporal patterns (Dube & Legros, 2014).
7
However, high unbalancedness prevents us from including a lagged value of the dependent variable for actor i on the right-hand side and estimating what Anselin, Le Gallo & Jayet (2008) call a time-space recursive model. We employ the geo-spatial two-stage least squares (GS2SLS) estimator which belongs to the family of instrumental variables (IV) estimators and uses the spatially lagged explanatory variables
The W matrix
As noted above, we treat the data as a series of cross-sections stacked over T time periods. The time dimension of the model alleviates concerns about simultaneous dependence which can plague simple cross-section spatial lag models (LeSage & Pace, 2009). Appropriate construction of the weighting matrix W ensures that temporal effects move forward in time, that is, that future observations do not affect current or past outcomes (Dube & Legros, 2014).
The model allows us to trace spatial diffusion over time. The spatio-temporal matrix W is a row-standardized product of element-by-element multiplication of spatial and temporal weighting matrices,
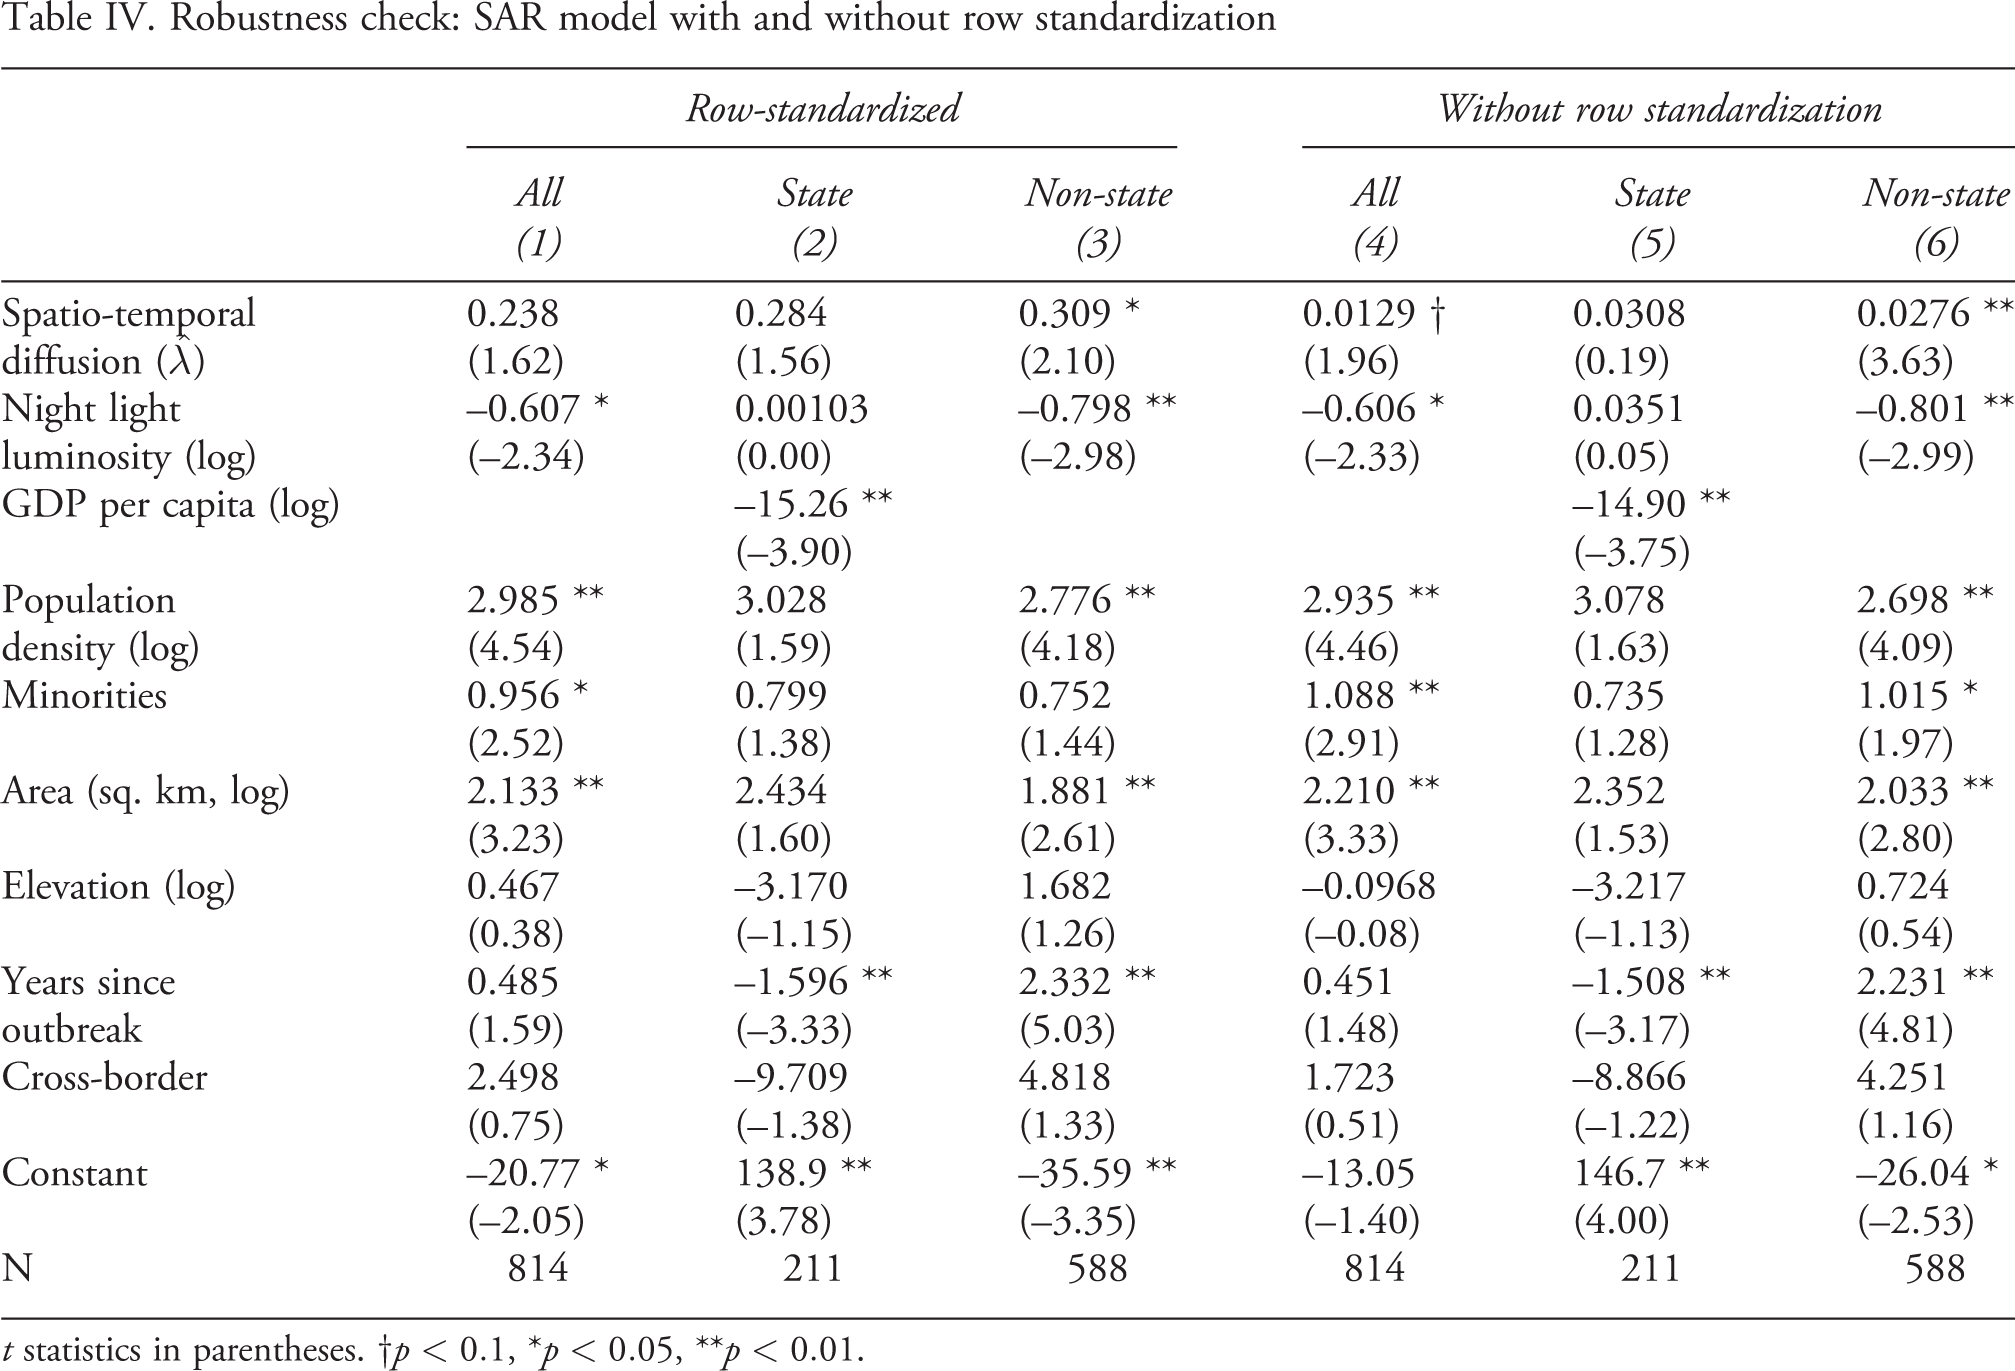
Row standardization of the spatial weighting matrices, that is, dividing the cells by row sums so that the weights in each row add up to 1, ensures that the spatial lag coefficient estimate has the same units as the dependent variable, thus allowing us to interpret it as the magnitude of interdependence, and that there is an easy stationarity check (Plümper & Neumayer, 2010). However, these advantages can also distort the relative weights on the impacts that observations are allowed to exert on one another, potentially undermining the validity of the interpretation of results pertaining to distance decay (Elhorst, 2014). For example, consider two possible universes of conflict actors, each consisting of three actors. In the first universe actor A has two neighbours, both at a distance of 50 kilometres. In the second, actor B has two neighbours at a distance of 500 kilometres. Under row standardization, actor A’s neighbours receive weightings of ½ each and actor B’s neighbours receive weightings of ½ each. Thus, row standardization only recognizes relative distances, ignoring the fact that actor A’s neighbours are much closer to it in its universe than actor B’s neighbours are in its universe. We follow what seems to be the most common approach in the literature and row-standardize our spatio-temporal weighting matrix, W, for our main results. However, we also show that our results are robust to the alternative specification of the weighting matrix.
Regression results
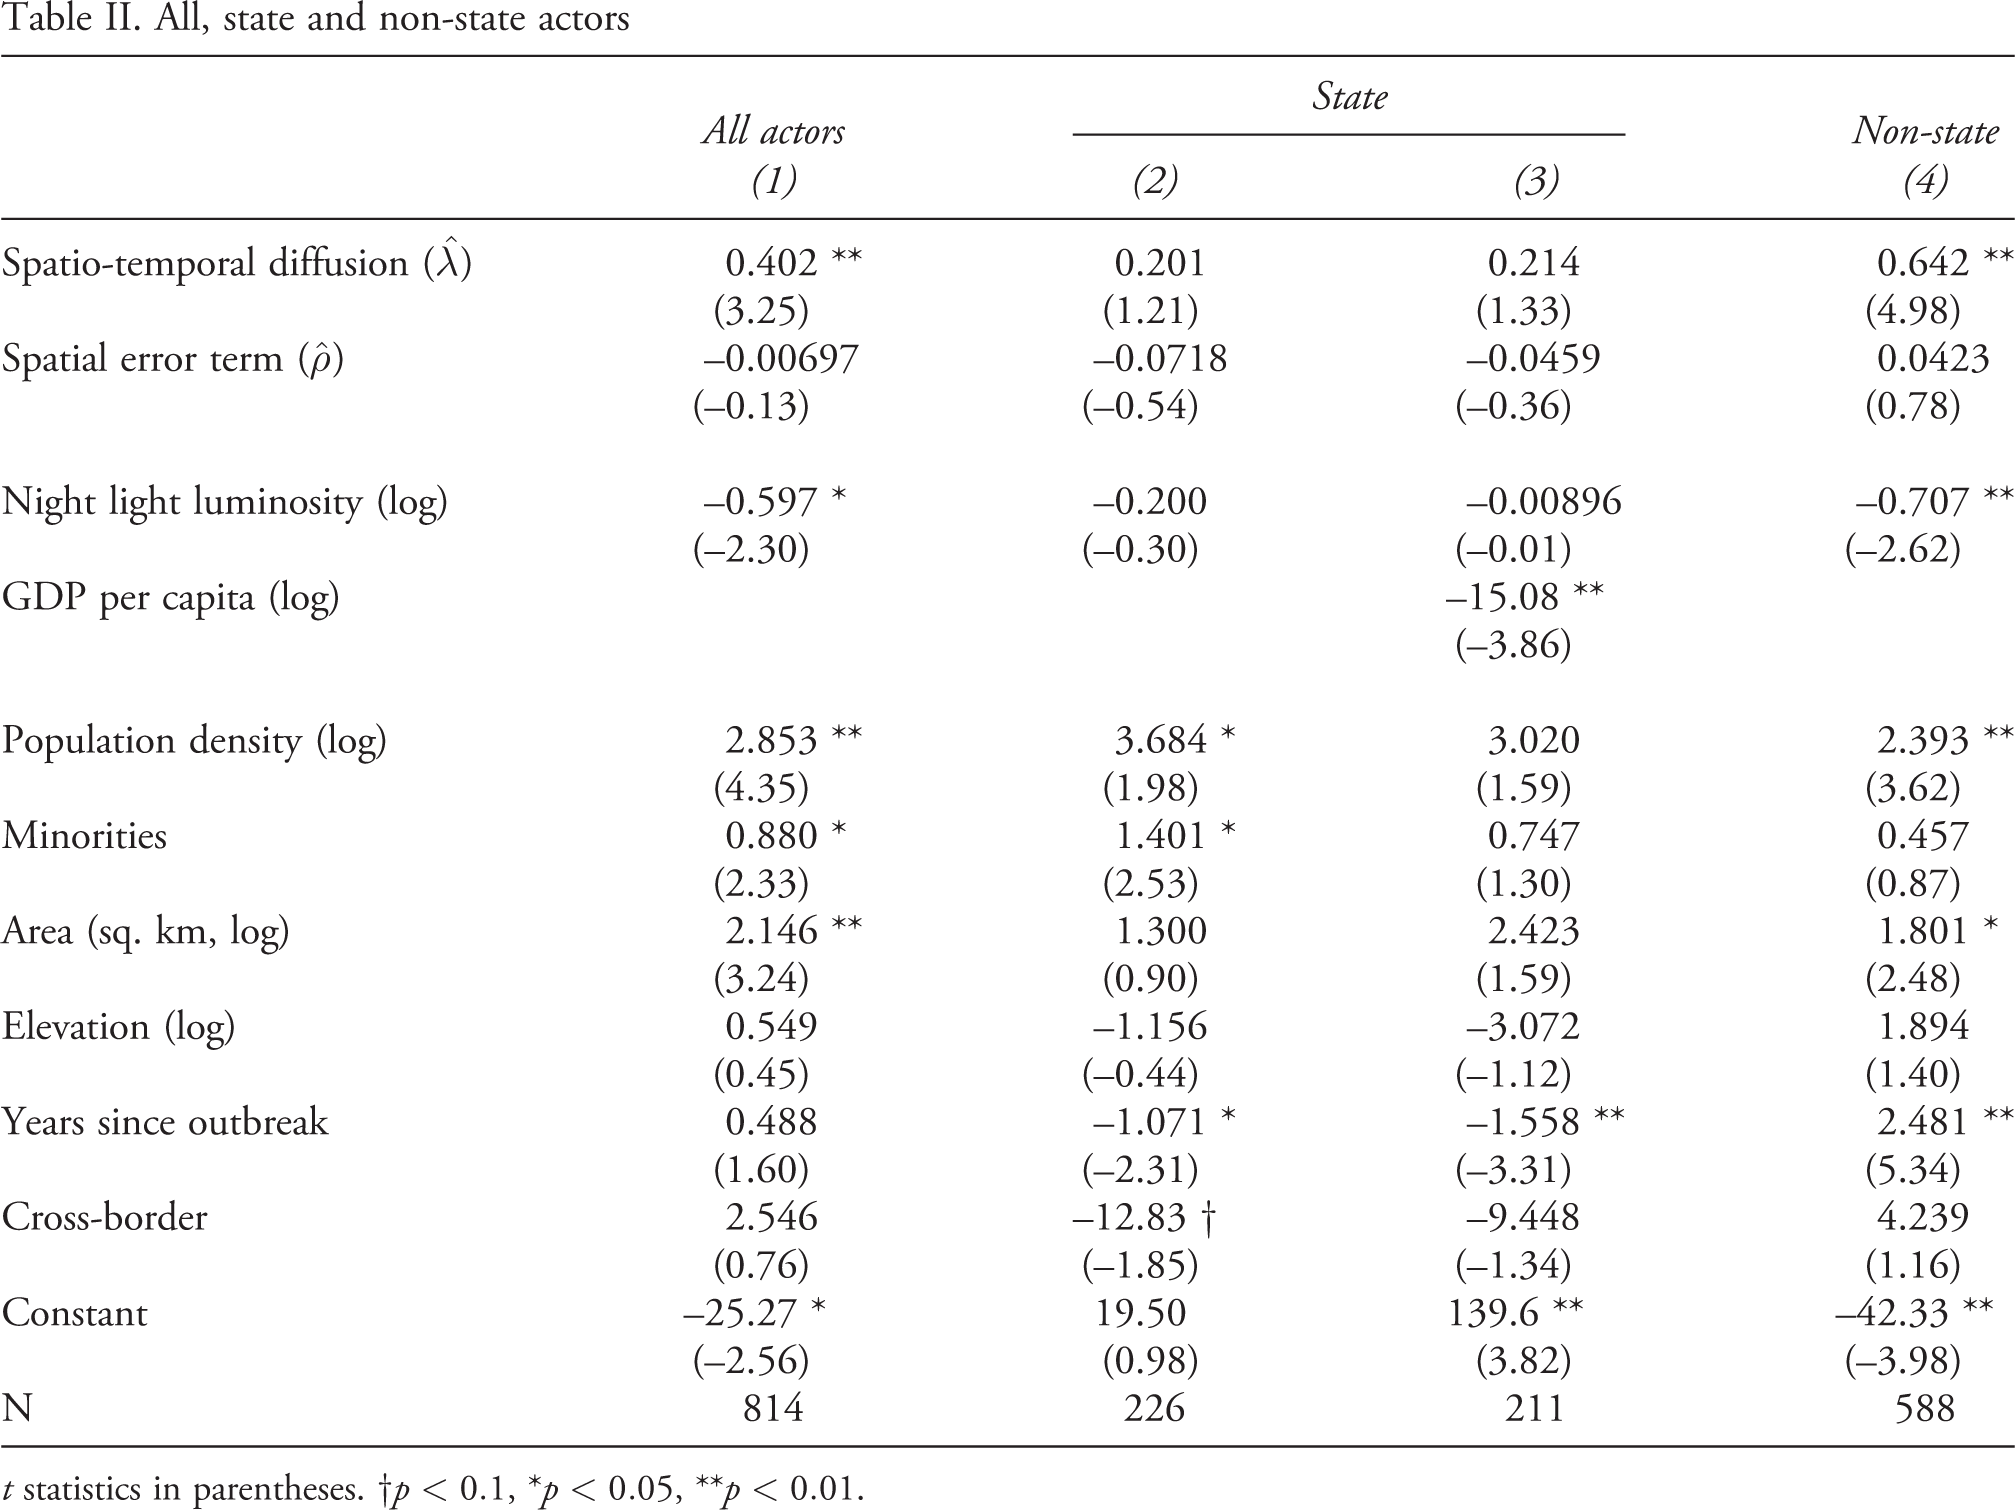
Table II shows the regression results for all actors combined, state actors and non-state actors. There are two state actor regressions: one with only night lights to measure economic activity and another that adds GDP per capita. All variables are measured per polygon, except for GDP per capita, which is measured at the national level, and years since outbreak.
9
The key parameters
Spatial effects
The top two rows of Table II display the estimates for the spatial parameters. The positive and statistically significant estimates of the parameter
All, state and non-state actors
t statistics in parentheses.
We find no evidence of spatial dependence in the error term,
Economic activity
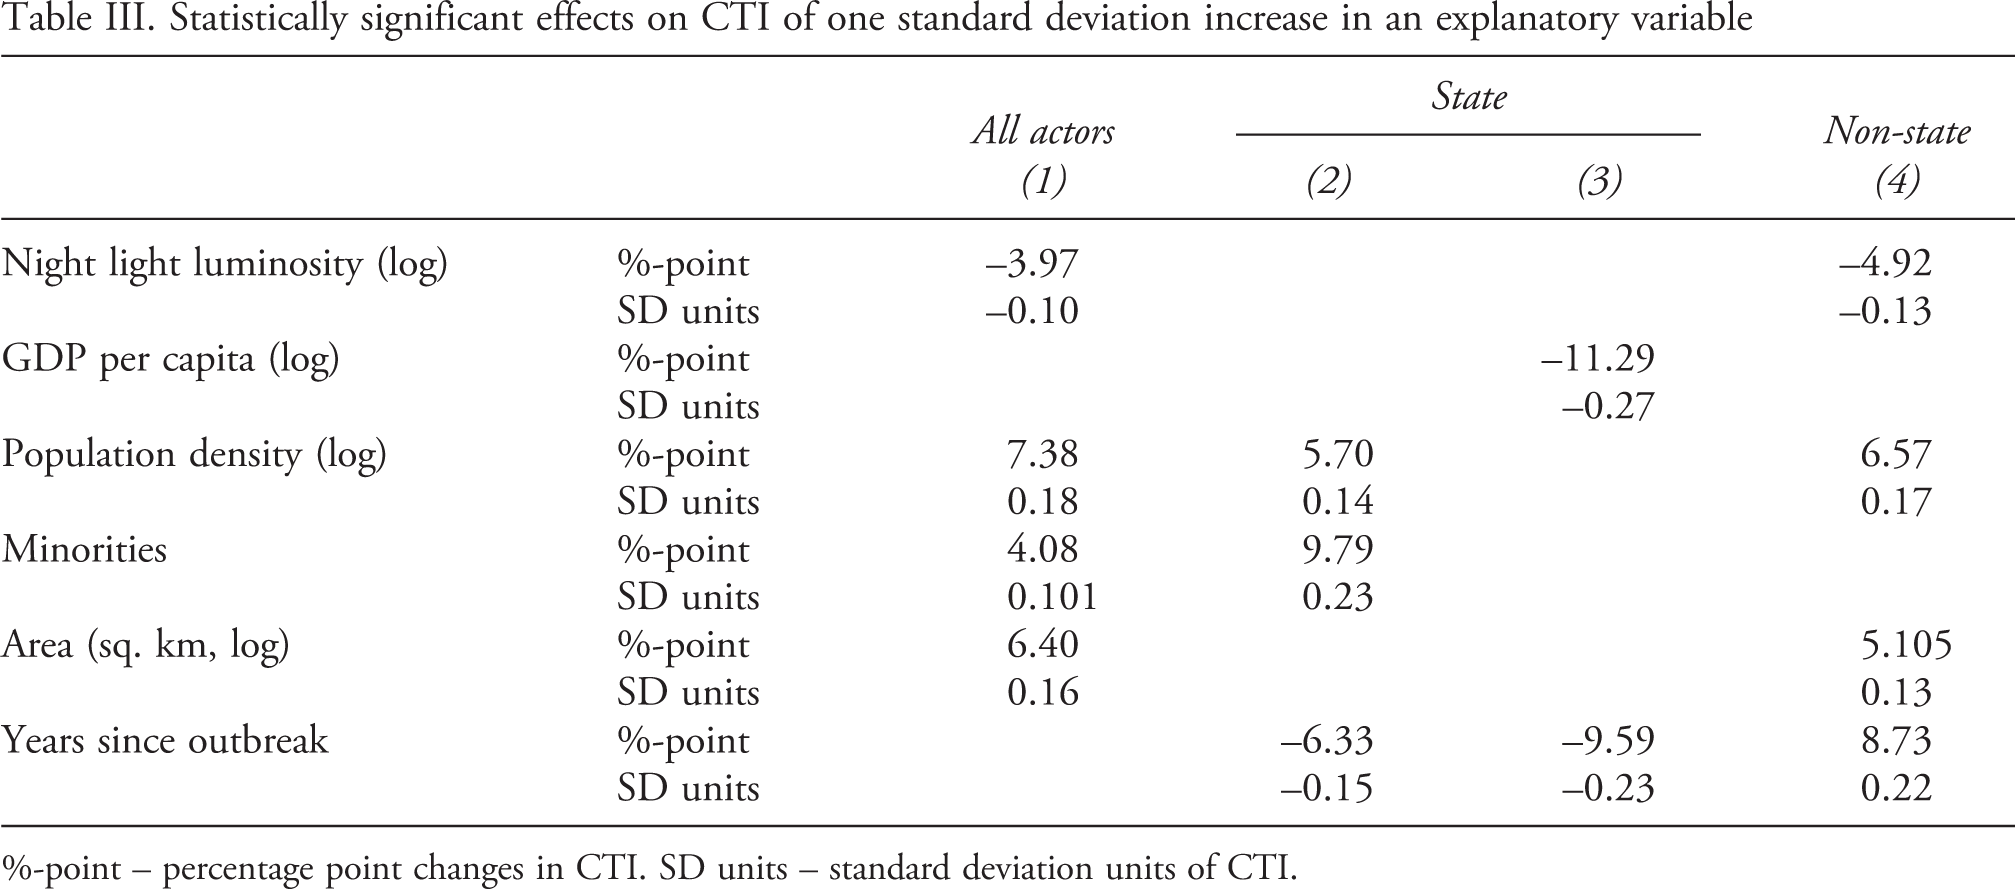
The magnitudes for the spatial variable discussed above are easy to assess since they are already in CTI units. However, for the remaining variables we need to do some simple conversions to understand coefficient sizes. Thus, Table III quantifies the magnitudes of all the statistically significant (
Table III shows that the estimated coefficients on night light luminosity and GDP per capita support the resource-scarce actor civilian targeting hypothesis, with magnitudes that look fairly large in percentage points of the CTI (5–11 points) but look smaller in SD units of the CTI. That is, civilian targeting by both state and non-state groups appears to decrease as available economic resources increase. Although state actors do not appear to respond to local economic activity within conflict zones as measured by night light luminosity, their lethal behaviour does seem to be affected by the performance of the entire economy under their control. This makes sense since, unlike rebel groups and other subnational actors, governments are able to extract income from other, relatively peaceful parts of their countries and spend it on war efforts within contested areas. 10
Statistically significant effects on CTI of one standard deviation increase in an explanatory variable
%-point – percentage point changes in CTI. SD units – standard deviation units of CTI.
Geographic and geopolitical factors
Population density, land area and years since outbreak are all positively linked with civilian targeting by non-state actors, with one standard deviation increases in these variables associated with increases of between five and nine percentage points in CTIs. 11 These findings can be viewed as giving further, indirect support to the resource-scarce actor civilian targeting hypothesis; it might be relatively expensive to control dense populations, patrol large land areas and participate in long conflicts. We also find that state actors may be more likely to resort to civilian targeting in areas with higher population density or larger numbers of ethnic minorities, although these results are not conclusive. Interestingly, although, on average, state actors have higher CTIs than non-state actors do (Table I), the gap closes over time in prolonged conflicts.
Robustness check
The statistically insignificant estimates of the parameter of spatial dependence in the error term,
Three examples
Robustness check: SAR model with and without row standardization
t statistics in parentheses.
The conflict in North and South Kivu of the Democratic Republic of Congo (DRC) shows two waves of the spread of civilian targeting, both to new actors and to higher activity levels. Again, the patterns are potentially explainable by retaliation or emulation. In 2006 the DRC government, the Democratic Forces for the Liberation of Rwanda (FDLR) and the Mayi Mayi killed 255 civilians in one-sided violence according to the UCDP data. By 2007 these three groups were joined by the National Congress for the Defence of the People (CNDP) with civilian killings escalating to 713. Violence held steady in 2008, with the same groups killing 731 civilians, until they escalated up to 1,871 civilian fatalities in 2009. The arrest of CNDP leader Laurent Nkunda in early 2009 led to a peace treaty between the government and the rebel groups, reducing one-sided violence to 68 fatalities in 2010 and 76 in 2011. However, in 2012 civilian targeting spread dramatically with the Mayi Mayi reactivating and M23 (mainly remnants of the CNDP), Raia Mutomboki, the Alliance of Patriots for a Free and Sovereign Congo (APCLS) and Nyatura perpetrating 1,301 intentional killings of civilians. Year 2013 was still worse with the same groups minus the Mayi Mayi and Raia Mutomboki intentionally killing 1,495 civilians. One-sided violence is ongoing in the DRC although levels have fallen to slightly more than 70 per year between 2014 and 2016. Raleigh & Choi (2017) present a more detailed study of this action–reaction mechanism of civilian targeting in the DRC.
Our final example is West Africa between 1989 and 2004 where civilian targeting spread from country to country, a dynamic that was probably fuelled more by emulation than by retaliation. First there was one-sided violence in Liberia with the government, the National Patriotic Front of Liberia (NPFL) and the Independent National Patriotic Front of Liberia (INPDL) killing 18 civilians in 1989 and 3,045 civilians in 1990 according to UCDP. Civilian targeting spread to neighbouring Sierra Leone in 1991 after NPFL fighters crossed over and attacked government troops. The government of Sierra Leone and the Revolutionary United Front (RUF) killed 660 civilians in one-sided violence in that year. RUF leader Foday Sankoh had links to the NPFL and may have learned some practices from that group. The United Liberation Movement of Liberia for Democracy (ULIMO) also formed in 1991 from Liberian ex-patriots and fought alongside the government of Sierra Leone before re-entering Liberia. All these groups targeted civilians throughout their existence. Between 1997 and 2000 three more groups started targeting civilians in the two countries: the Kamajors, the Armed Forces Revolutionary Council (AFRC) and the Liberians United for Reconciliation and Democracy (LURD). Intentional targeting of civilians spread to Liberia’s neighbour Ivory Coast in 2002 with the government, the Patriotic Movement of Côte d’Ivoire (MPCI) and the Movement of the Ivory Coast of the Great West (MPIGO) killing 451 in 2002 and 606 civilians in 2003. Finally, in 2004 civilian targeting abated across the region.
Discussion
We stress two main findings plus a few intriguing possibilities. First, we identify spatio-temporal spillovers whereby civilian targeting by non-state actors tends to spread to other nearby non-state actors. Many factors, reaching beyond the scope of our article, could drive such behaviour, including emulation of observed tactics, noticing that abusive actors are not punished for their crimes, or simply revenge. Second, for both state and non-state actors we find evidence for the resource-scarce actor civilian targeting hypothesis according to which civilian targeting is decreasing in the resources available to conflict actors. Third, we also find positive relationships for non-state actors between civilian targeting and population density, land area and years since conflict onset. These latter results seem broadly consistent with the resource-scarce actor civilian targeting hypothesis. A further implication of the years-since-onset result is that, although state actors have higher average CTIs than non-state actors do, the distance between the two tends to shrink during prolonged conflicts.
Analysts who try to predict crises and policymakers should be aware of the evidence that civilian targeting spreads across space and time. Thus, policy measures aimed at one group committing atrocities could have spillover effects outside the immediate neighbourhood within which they occur. Moreover, the observation that resource-poor conflict actors pose special threats to civilians provides some guidance regarding which civilians are the most vulnerable. More specific policy advice will require further research. We obtain our results from African data, including 5,397 recorded incidents of one-sided violence, between 1992 and 2010. Although we can think of no reason why the relationships uncovered in this article would be particular to just this period in African history, it remains to be seen how well these results generalize to other times and places. Future research should focus on determining which mechanisms drive the uncovered spatio-temporal spillovers of civilian targeting. We can ask, for example, whether civilian targeting stems from emulation or retaliation? This may require field-based case studies investigating the motives, planning and strategies of conflict actors. A large-N study tackling this question would require data on precise timings of events and, most importantly, linkages between civilian victimizations and warring actors. If diffusion was observed between two conflicted actors who attack civilians supporting their opponent then revenge would be a likely motive. On the other hand, if civilian targeting was committed by proximate actors who are not in conflict with each other or who kill civilians not linked to either actor, then diffusion through emulation would appear a more likely explanation. A promising avenue for future research, requiring the availability of high-resolution spatial data, is the role that exploitable mineral resources play in determining conflict strategies and the treatment of civilians. In general, we suggest that future research on conflict should pay increasing attention to the geographic dimension of interactions between warring actors and their immediate environment as well as among different warring actors.