
Abstract
Based on spatial panel regressions for 1990–2012, this article draws publicness differences between peacekeeping personnel contributions to UN and non-UN peacekeeping operations. The analysis shows that UN missions are much less responsive to personnel spillovers, derived from other contributors’ peacekeepers, than is the case of non-UN missions. UN peacekeeping missions display either no response or free riding to these personnel spillovers, while non-UN missions indicate spillover complementarity. Moreover, a number of controls distinguish the two kinds of peacekeeping, where non-UN missions display income normality and UN missions’ deployments increase with the number of concurrent peacekeeping missions. The latter suggests that some countries specialize in supplying UN peacekeepers as a money-making venture. The positive response to the population variable supports this conjecture for UN missions, because a greater population base provides the recruits for peacekeeping operations. Our spatial empirical analysis accounts for the endogeneity of peacekeeper spillovers. The article concludes with a host of robustness tests that account for the alternative classes of peacekeepers, African Union and ECOWAS missions, and other empirical variants.
Keywords
Introduction
In recent years, there has been great research interest in various aspects of peacekeeping missions including burden sharing (Bove & Elia, 2011; Victor, 2010), mission effectiveness (Doyle & Sambanis, 2006; Hultman, Kathman & Shannon, 2013a,b), deployment decision (Fortna, 2008), and peacekeepers’ targeting (Dorussen & Gizelis, 2013; Salverda, 2013). Although most analyses involve UN peacekeeping activities, several articles also examine non-UN peacekeeping, primarily regarding which countries carried the financial or peacekeeper burdens for past missions (Bove & Elia, 2011; Gaibulloev, Sandler & Shimizu, 2009; Shimizu & Sandler, 2002). This enhanced focus on peacekeeping research followed the tenfold increase in UN peacekeeping spending from the 1980–88 period to 1994 (Khanna, Sandler & Shimizu, 1999). For 1994–2006, non-UN peacekeeping operations cost $121.6 billion compared to $27 billion for UN peacekeeping missions for the same period (Gaibulloev, Sandler & Shimizu, 2009). These non-UN peacekeeping costs skyrocketed with complex multidimensional operations in Iraq and Afghanistan that involved peace enforcement and nation rebuilding. Clearly, UN and non-UN peacekeeping missions demanded resources on an unprecedented scale following the end of the Cold War (Bellamy & Williams, 2013a,b,c; Daniel, 2013). Such demands raised many questions, addressed in the ensuing research.
The primary purpose of the current article is to investigate the determinants of donor countries’ personnel contributions to UN and non-UN peacekeeping operations (PKOs) for 1990–2012, based on a public good approach that allows for jointly produced donor-specific gains and pure public benefits. Donor-specific gains solely benefit the country providing the peacekeeping troops, police, and observers (e.g. in terms of training or trade opportunities), while pure public benefits help all countries interested in reduced violence and enhanced stability. We are particularly interested in discerning differences between UN and non-UN PKOs on how countries respond to this derived mix of private and public benefits. We show that UN PKOs possess relatively more donor-specific benefits than non-UN PKOs when examining troop, police, and observer (henceforth, denoted by peacekeeper or personnel) burden sharing. This is because the UN remunerates countries for sending peacekeepers, thereby giving poor countries with inexpensive peacekeepers a means to earn income. Much less opportunity applies to non-UN PKOs, because peacekeeper-sending countries are generally not compensated for their personnel or equipment. Exceptions to this non-compensation rule include some African Union (AU) and Economic Community of West African States (ECOWAS) peacekeeping operations, which were partly funded by the European Union (EU) and the USA. For other non-UN peacekeeping missions, costs lie with the providing country (Bellamy & Williams, 2013b; Tardy, 2013). From a publicness viewpoint, one country’s non-UN personnel contributions may be substitutable or complementary to those of other contributing countries. Substitutability implies free-riding incentives, whereas complementarity suggests a unity of purpose as a threshold force with reinforcing characteristics (e.g. combat and logistical support) is achieved to maintain the peace. As a consequence, peacekeeper-contributing countries will increase their personnel in sync with those of other contributing countries. For both types of missions, we also include some donor-specific proxies, such as the share of PKOs in the donor’s own region, because nearby conflict can adversely impact contributors through refugee flows and/or trade disruption.
An earlier article by Bove & Elia (2011) also analyzes the public/private motives for supplying peacekeepers to UN and non-UN missions for a shorter time span covering 1999–2009. Unfortunately, these authors’ analysis cannot truly capture the publicness or spillover dependence of UN or non-UN peacekeeping missions, because their estimated supply equation does not include troop spillovers as an independent variable. Such spillovers involve the troop contributions of other countries to a PKO. Even though these spillovers are in these authors’ utility-maximizing representation, they fail to include them in their estimating equation. Thus, it is not surprising that Bove & Elia (2011) find that country-specific benefits, not public benefits serving the collective interest, explain troop contributions to UN and non-UN PKOs. A true study of peacekeeping publicness requires the inclusion of spillovers or else the provision equation for peacekeepers is misspecified.
By highlighting peacekeeper spillovers, we establish that non-UN peacekeeping displays a clear complementarity between a contributing country’s own peacekeepers and those from other countries. The same does not hold for UN PKOs, where there is either evidence of free riding or no evidence of publicness or peacekeeper spillover dependence. For example, when we divide the UN sample between poor and rich countries, neither cohort displays publicness or any response to peacekeeper spillovers. The poor cohort is deriving benefits from money making in offering peacekeepers and from other donor-specific benefits (e.g. trade stability). Our spatial empirical analysis accounts for the endogeneity of personnel spillovers, which is required because each contributing country’s peacekeeper deployment strategically depends on the peacekeepers provided by other countries. Moreover, we find that the influence of the control variables, which capture some donor-specific motives and constraints, differs between the two types of PKOs. To establish robustness, we estimate empirical variants including the generalized method of moments (GMM) and least squares dummy variable (LSDV) regressions.
Our study is noteworthy because of the growing importance of non-UN PKOs. In particular, the study shows how personnel burdens for such missions are shared and how this sharing differs from UN PKOs. Countries that supply the bulk of personnel to the two types of missions differ greatly. We also show how responses to peacekeeper spillovers for the two types of missions vary based on institutional considerations – for example, the use of UN assessment accounts for financial support and UN compensation of peacekeeping personnel.
Preliminaries and the relevant literature
Our definition of peacekeeping mission is that of the United Nations (2008: 7): ‘Today’s multidimensional peacekeeping operations are called upon not only to maintain peace and security, but also to facilitate the political process, protect civilians, assist in disarmament, demobilization and reintegration of former combatants, support the organization of elections, protect and promote human rights, and assist in restoring the rule of law.’ As such, peacekeeping includes monitoring of ceasefires, traditional peacekeeping, peace enforcement, humanitarian aid, nation-building, police training, and peacebuilding. Peace enforcement involves Security Council sanctioned coercive force to restore peace. Our peacekeeper sample is as broad as possible, based on UN data on UN peacekeeping missions and International Institute for Strategic Studies (IISS) data on non-UN peacekeeping missions. IISS data on the latter include small training and observer missions as well as traditional peacekeeping and large peace enforcement missions. Some missions involve few participating countries while others include many, which is also true of UN peacekeeping missions. Given our interest in how countries share peacekeeping personnel burdens, we must be as inclusive as possible in terms of missions.
Peacekeeping contributions or burdens can be measured in two distinct ways: financial or peacekeeper contributions. For UN peacekeeping, UN member countries are assessed a fixed share of the annual costs of UN peacekeeping operations since the ratification of UN General Assembly Resolution 3101 on 11 December 1973. 1 Although these assessment shares are altered periodically, historically they do not change by much. Countries’ assessment shares differ among ten classes of members (Coleman, 2014; Solomon, 2007). The five permanent Security Council members, who decide peacekeeping missions, pay 22% above their regular budget assessment scale, which hinges in part on their per capita income. Rich industrial countries, not permanent Council members, pay their regular budget assessment scale. The small remaining assessments are levied on other countries, which in aggregate cover very little of UN peacekeeping expenses. For the fiscal year starting on 1 July 2013, the UN peacekeeping budget was about $7.8 billion with just ten countries assessed over 80% of the expense (United Nations, 2014). Despite mandatory UN financial assessments, many UN members are in arrears, so there is, in practice, some volition taken regarding when to pay their assessments (Shimizu, 2005). In contrast, there are no assessments in terms of financial burdens for non-UN peacekeeping. Participating countries in non-UN PKOs send their personnel and equipment, and, except for some AU and ECOWAS missions, cover the associated costs. AU and ECOWAS countries must cover their first three months of expense, after which peacekeeping countries must wait for some offsetting reimbursement (Tardy, 2013).
Countries voluntarily contribute troops or police to UN peacekeeping missions and are compensated at a base rate of $1,028 per month for each peacekeeper (Coleman, 2014: 10). There is also a monthly stipend of $68 for equipment and clothing and $5 for personal weaponry. Specialists receive a monthly supplement of $303 (United Nations, 2014). These payments are covered by UN peacekeeping assessments. For non-UN peacekeeping in Europe, Asia, and Oceania, participating countries contribute their own troops and materiel, without any offsetting compensation (Tardy, 2013); hence, the cost per peacekeeper for non-UN missions to the contributing country is generally higher than for UN missions. UN compensation means that some countries with inexpensive personnel can actually earn money by sending their peacekeepers to UN peacekeeping deployments (Bellamy & Williams, 2013a,c). Thus, it is not surprising that some countries – Bangladesh, Ghana, India, Nepal, Nigeria, Pakistan, and Senegal (United Nations, 2014) – contribute a large number of peacekeepers to UN PKOs (Bobrow & Boyer, 1997). To establish this net gain, we compute the annual costs per military person for recent years by multiplying the country’s total military expenditure by its personnel budget share and dividing the product by the number of active military personnel. The data on personnel budget share (for the most recent available year) are from the United Nations Office for Disarmament Affairs (2014), while data on military expenditure are drawn from the Stockholm International Peace Research Institute (SIPRI) (2014). Active military personnel data come from IISS (recent years). The annual costs per military person are as follows: Bangladesh, $4,553 (in 2009); Ghana, $5,555 (in 2012); India, $9,768 (in 2012); Nepal, $1,892 (in 2011); Nigeria, $10,199 (in 2012); Pakistan, $3,417 (in 2012); and Senegal, $9,571 (in 2011). Thus, the UN compensation per peacekeeper of over $12,000 per year constitutes, in part, a donor-specific benefit from peacekeeping for countries contributing the most UN peacekeepers in recent years. A similar calculation using NATO’s (2014) personnel budget share statistics gives the annual costs per military person as: Canada, $137,054 (in 2011); France, $119,273 (in 2009); Italy, $156,181 (in 2011); and United States, $138,465 (in 2013). Rich countries with relatively expensive forces cannot come close to covering their personnel costs from UN compensation, so that any contributed forces to UN missions result in additional costs beyond their assessments from the United Nations.
In summary, financial contributions are mandated, while personnel contributions are voluntary for UN PKOs; in contrast, financial and personnel contributions are generally voluntary for non-UN PKOs. These differences may affect the mix of country-specific and public benefits derived from the two types of PKOs and, in so doing, can influence how countries support these alternative operations. With regard to UN PKOs, we anticipate that UN members increase their payments in tandem owing to the assessment accounts, so that the financial response or spillover elasticity to the contributions of others should be near 1 in value. In contrast, UN personnel contributions are expected to display a substitution relationship with more populated and poorer countries supplying more UN peacekeepers. For AU and ECOWAS missions, cost offsets to contributing countries are in terms of their expenses and do not allow countries with really cheap troops or police to make a profit, unlike UN missions. Hence, personnel contributed to AU and ECOWAS is not profit driven, making these missions more akin to other non-UN missions. This is later shown by our robustness test when such missions are removed from our non-UN sample, but our findings do not change.
On the related literature
Our current exercise is related to, but quite different from, the Gaibulloev, Sandler & Shimizu (2009) article, which contrasts financial contributions to UN and non-UN PKOs. In contrast to this earlier article, the current exercise examines the determinants of personnel contributions to these alternative PKOs. In the earlier article, the authors show that the payment of UN peacekeeping assessments possessed a spillover elasticity of 1 as anticipated, so that UN members’ financial payments moved in sync. Public good benefits and donor-specific interests in the conflict region explained financial burden sharing for non-UN peacekeeping missions. These donor-specific interests are captured by the countries’ nearness to the conflict, the donors’ trade openness in the conflict zone, and the donors’ foreign direct investment (FDI) in the conflict zone. For financial burdens, Gaibulloev, Sandler & Shimizu (2009) establish that UN peacekeeping missions are more guided by the achievement of the global public good of world peace, while non-UN peacekeeping missions are more motivated by peacekeeper-specific benefits. For personnel burdens, spillover responses to non-UN missions should be positive as participating countries seek to assemble forces sufficient for the given mission. As such, one contributor’s peacekeeping forces are complementary to those of its allies, resulting in a significant positive spillover coefficient. Other differences distinguish these two studies – for example, the time periods, the sample countries, and the empirical methods. The earlier study has only 29 peacekeeping countries, while the current study has over three times that number. Finally, the current study has different controls to account for personnel contributions.
As mentioned earlier, the current article is also related to Bove & Elia’s (2011) analysis of the determinants of the supply of UN and non-UN peacekeeping troops. Unlike their interesting study, we maintain the spillover or publicness variable, so that we can directly address how the two types of peacekeeping missions respond differently to personnel spillovers. Another difference concerns our longer time period of 1990–2012 that allows us to cover the post-Cold War period during which peacekeeping activities grew greatly. In addition, Bove & Elia (2011) use per capita GDP as a proxy for the value of a peacekeeper, while we use per capita GDP more traditionally as a measure of a contributing country’s well-being. We anticipate that peacekeeping is more apt to be a normal good rising with income for non-UN missions, because richer countries have more to lose than poor countries from conflicts that threaten markets, FDI, resource supplies, and trade. Many non-UN PKOs are in countries where rich countries have strategic and economic interests. We cannot, however, follow Bove & Elia’s (2011) two-step – participation and troop-contribution choices – modeling approach due to challenges of modeling spatial dependence for the participation stage in a panel framework. 2 A final difference concerns our use of troops, police, and observers and Bove & Elia’s (2011) use of just troops. For our analysis, having all three types of peacekeepers is appropriate because we are measuring burden-sharing responses to the two types of PKOs. Personnel-contributing countries must consider remuneration differences between the two kinds of missions. In two articles, Hultman, Kathman & Shannon (2013a,b) distinguish the three types of personnel, because each type will differentially affect civilian and battlefield deaths. This distinction, however, should not impact our burden-sharing findings, especially since troops and police are remunerated at the same base rate by the UN (Coleman, 2014). Our robustness test supports this conjecture when we run the UN analysis by distinguishing troops and police from observers.
In a much narrower, but interesting, study, Victor (2010) investigates factors behind peacekeeping troop contributions in sub-Saharan Africa during the period 1989–2001. Like our current exercise, he examines UN and non-UN PKOs, but concentrates on African states that deployed peacekeepers to other African states. Among other results, Victor (2010) finds that poorer African countries with reduced legitimacy (i.e. more corruption and low world standing) supplied more troops as a means to gain prestige. He also shows that states with a larger military dispatched more troops, which for UN missions is consistent with such missions providing income earnings. Similarly, Lebovic (2004) finds that democratic states with a larger military force supplied more UN peacekeepers during the period 1992–2001. This latter study does not consider non-UN PKOs. In keeping with our results, Lebovic (2004) finds that a country’s population size was a positive determinant of its peacekeeper deployment. Neither Victor’s (2010) nor Lebovic’s (2004) estimations have a peacekeeper spillover variable even though both articles acknowledge jointly produced public good outputs.
Theoretical model
We initially focus on the personnel deployment decision of a non-UN peacekeeping country, taking as given the peacekeeper deployment of other peacekeeping countries. The latter assumption means that we depict the peacekeeper supply decision as a Nash equilibrium. For simplicity, we analyze the personnel decision for all non-UN or UN peacekeeper deployments insofar as the model can be easily tailored to permit such decisions for individual peacekeeping missions. Our model differs from those of Khanna, Sandler & Shimizu (1999) and Gaibulloev, Sandler & Shimizu (2009) on the constraint side owing to the switch in focus from financial contributions to peacekeeping personnel contributions. Moreover, the vector of taste-shifting factors differs, along with the anticipated signs for changes in the model’s parameters on a country’s supply of peacekeepers.
Non-UN peacekeeper provision decision
Each potential peacekeeper-contributing country i possesses utility function,

where


where

where
The budget constraint of a potential peacekeeping country is

where
We substitute Equations (2), (4), and (5) into the utility function in Equation (1) to express country i’s maximization problem as
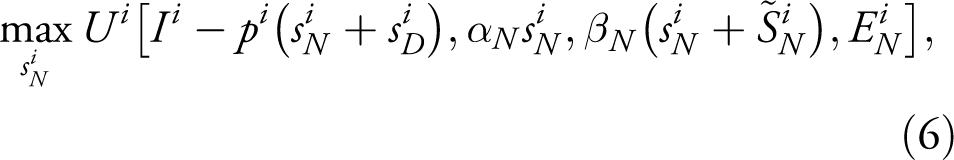
where vector

for the case of non-zero supply. In going from Equation (6) to (7), we have normalized the joint product parameters to equal 1, because we do not have measurements on these parameters. In Equation (7), personnel spillover represents an important determinant of i’s supply of peacekeepers and, as such, must be in the estimated supply equation.
The Nash equilibrium follows from the simultaneous satisfaction of Equation (7) for all potential peacekeeper-contributing countries. We appeal to Cornes & Sandler’s (1994) general theoretical analysis of joint product models to sign the influence of changes in these parameters on a country’s supply of peacekeepers.
If non-UN peacekeeping is a normal good, then the country’s deployment of peacekeepers increases with its income or GDP per capita (GDP/POP). Generally, countries place a greater value on stability and peace at home and abroad as they become richer, since rich countries have more to lose from conflicts that can affect their private interests through trade disruption, reduced resource supplies, or increased uncertainty (Sandler & Hartley, 1999). This concern is more germane for non-UN PKOs, since countries voluntarily contribute their personnel and military equipment to those missions that they view as more essential to their security. The price of peacekeeping personnel is anticipated to have a negative influence on the voluntary supply of non-UN peacekeepers, because contributing countries must generally cover their own personnel costs. Given the rivalry between non-UN peacekeepers and other uses for a contributor’s troops and police, we anticipate that non-UN peacekeeper deployment will fall as a country has greater other needs for such personnel, so that
The components of
UN peacekeeper provision decision
The derivation of the UN peacekeeper supply equation involves only a few differences with the earlier non-UN supply derivation. From a notational viewpoint, we replace the N subscript for non-UN missions with a UN subscript for UN missions. The key difference is the budget constraint, which is now

where
which has the same interpretation as Equation (7). Nevertheless, the signs on the coefficients of the independent variables may differ for UN missions when compared to those of non-UN missions. Income is likely a less important determinant of UN peacekeeper deployment compared to non-UN peacekeepers, because UN personnel-deploying countries now tend to be poor as they seek net payments for their peacekeepers through UN operations. In fact, UN personnel are likely an inferior good – that is, an increase in income per capita is associated with a country deploying fewer UN personnel. A decrease in the net price of its UN peacekeepers owing to greater reimbursement will stimulate a country’s supply of peacekeepers. Insofar as countries with smaller per capita income are apt to have cheaper peacekeepers, this is another reason to expect a negative relationship between the supply of UN peacekeepers and income per capita. We cannot test the net price hypothesis directly, because per peacekeeper reimbursement has not changed over our sample period and we do not have panel data on
Next, we turn to some taste-shifting parameters, captured by
Data
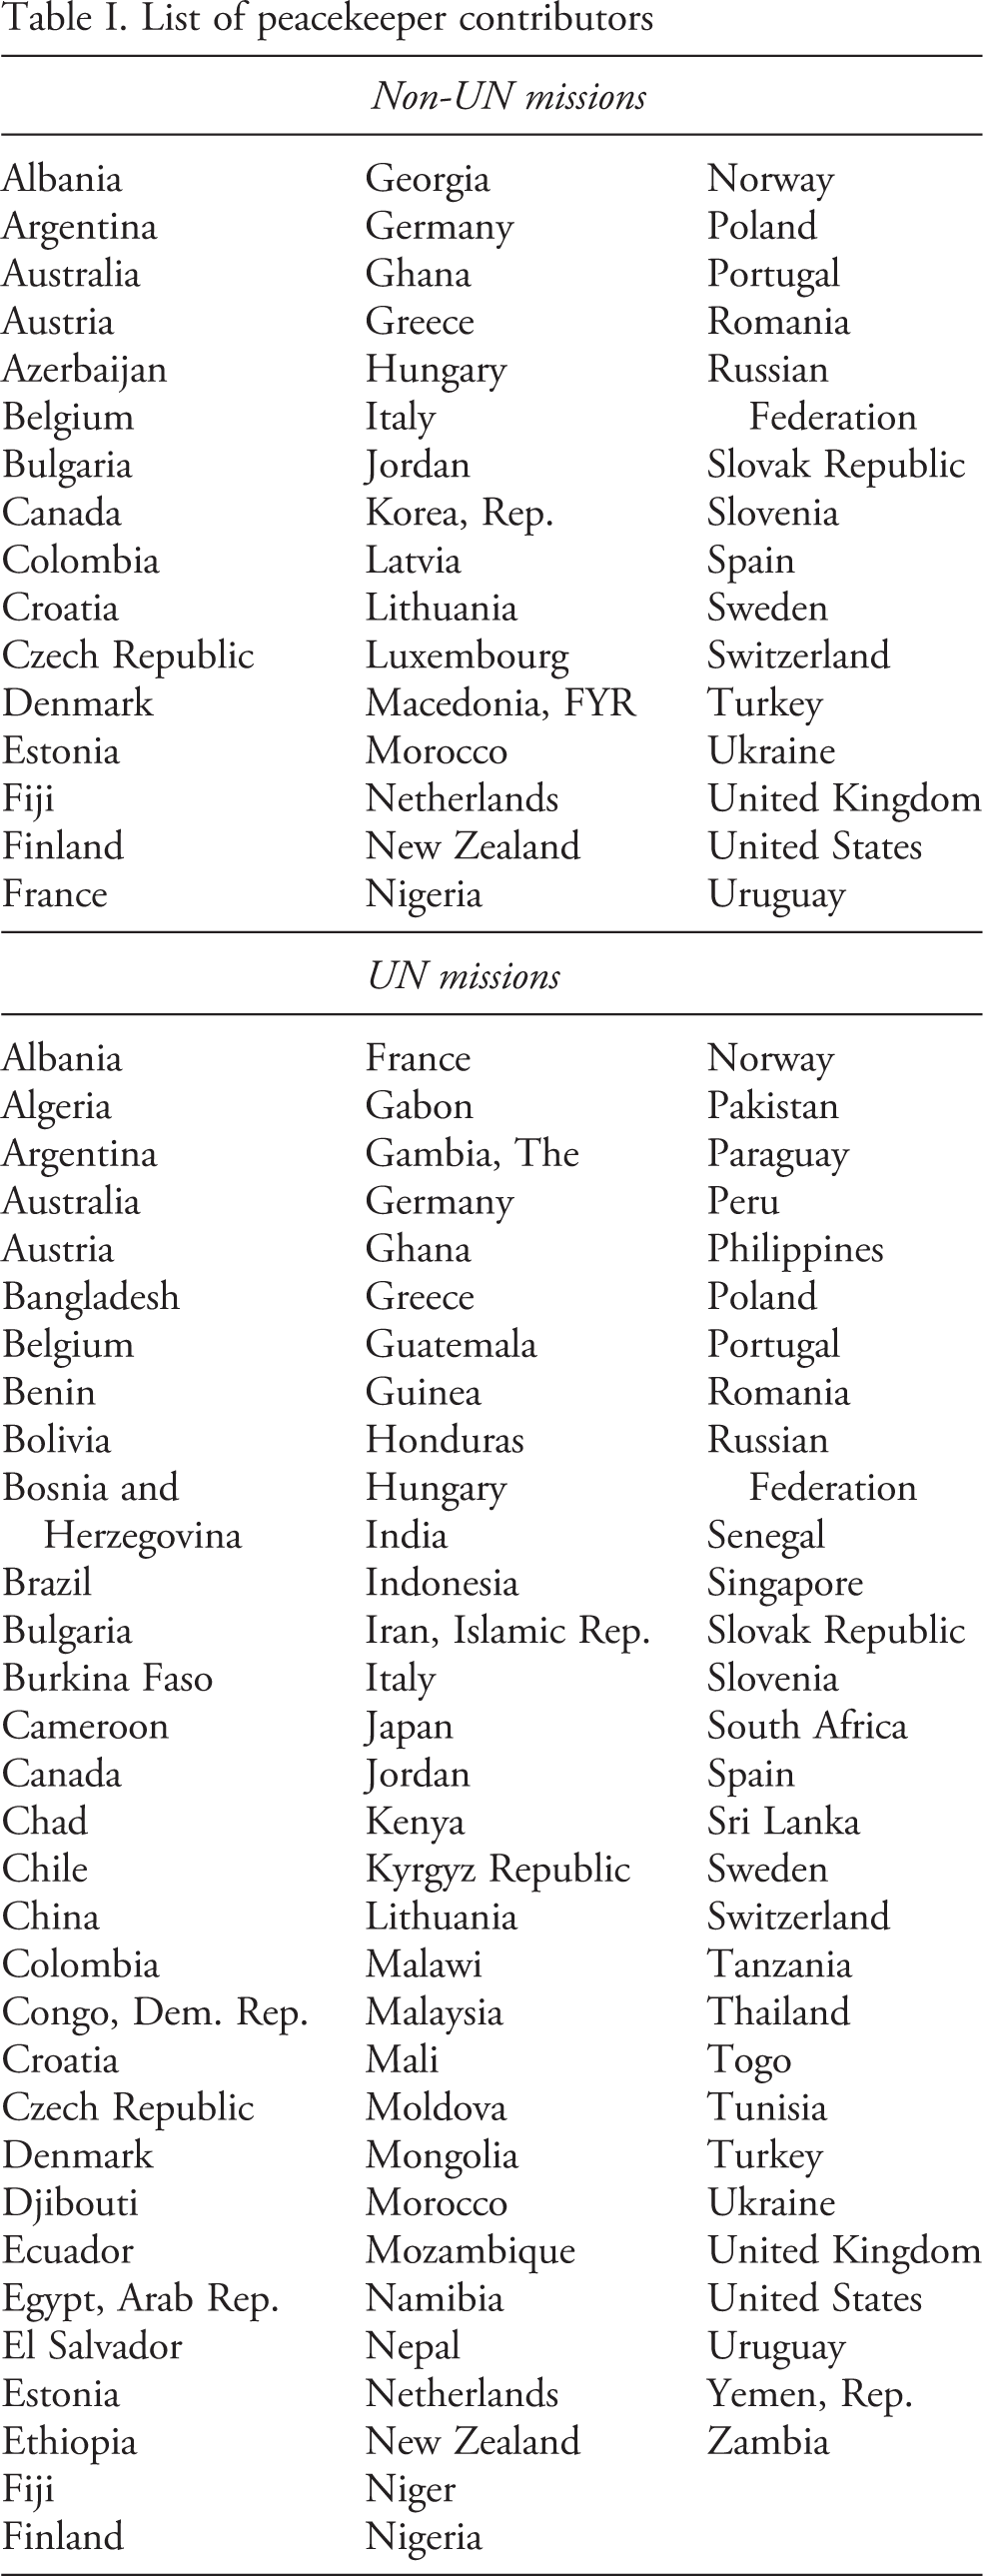
The empirical analysis relies on datasets on various UN and non-UN peacekeeping missions, conducted globally during 1990–2012. Data on the number of personnel contributed to non-UN PKOs are drawn from the IISS (1991–2013), which records the peacekeeper figures by contributing country, year, and mission. 8 According to IISS, these figures are assessments as at 1 June for 1990–95, at 1 August for 1996–2005, and at 1 November for 2006–12. There are 112 countries that contributed to at least one non-UN peacekeeping mission (broadly defined) over the sample period; however, many of these supplying countries gave peacekeepers infrequently so that there are lots of zero entries each year, which may render linear regression results biased. To address this issue, we implement a two-step procedure. First, we require that a country must contribute non-UN peacekeepers for a minimum of ten years during the entire sample period to qualify as a sample country. This threshold reduces our sample of non-UN peacekeeper contributors from 112 countries to 47 countries. Second, we group years into three roughly equal-sized periods (i.e. 1990–97, 1998–2005, and 2006–12) and aggregate the annual contributions of each sample country within periods. Thus, our non-UN dataset consists of a panel of 47 contributing countries over the three periods. The dependent variable is the log of the number of personnel deployed by a supplying country for a given period. We add 1 to the peacekeeper numbers before taking the log because there are few cases with zero values. The sample countries are listed in Table I. In Table II, non-UN missions in our sample and their locations are listed.
List of peacekeeper contributors
List of non-UN missions and locations
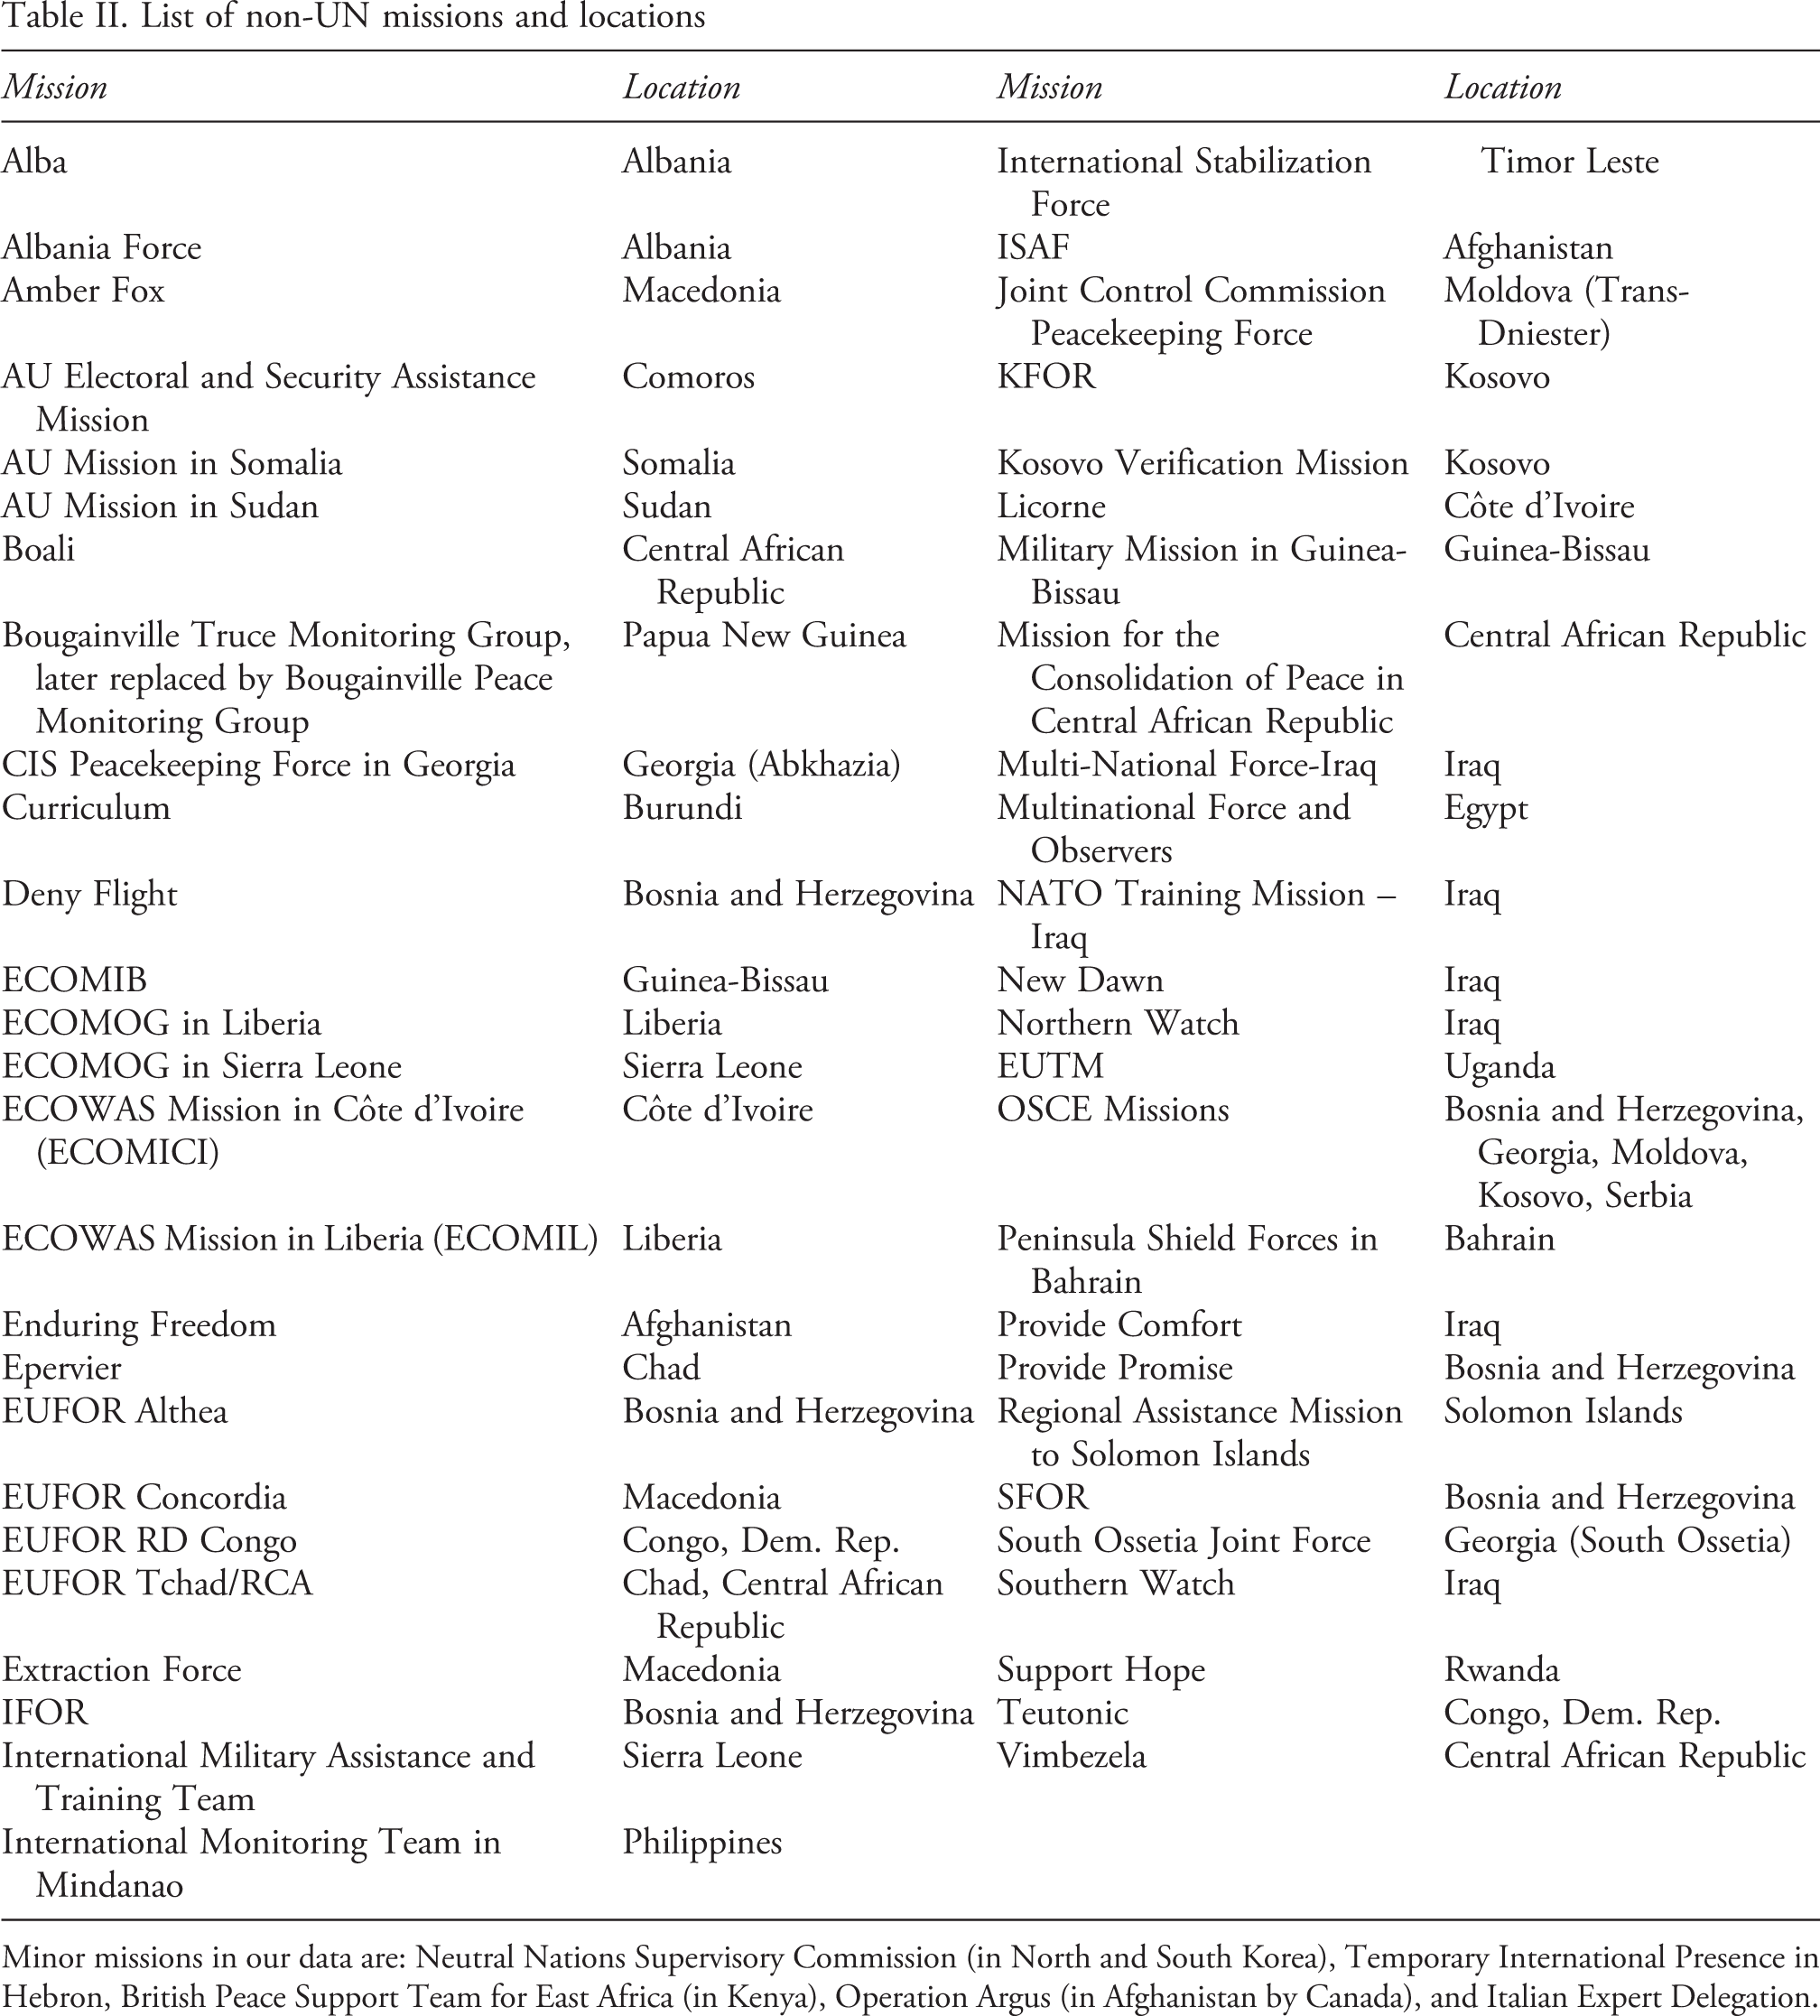
Minor missions in our data are: Neutral Nations Supervisory Commission (in North and South Korea), Temporary International Presence in Hebron, British Peace Support Team for East Africa (in Kenya), Operation Argus (in Afghanistan by Canada), and Italian Expert Delegation.
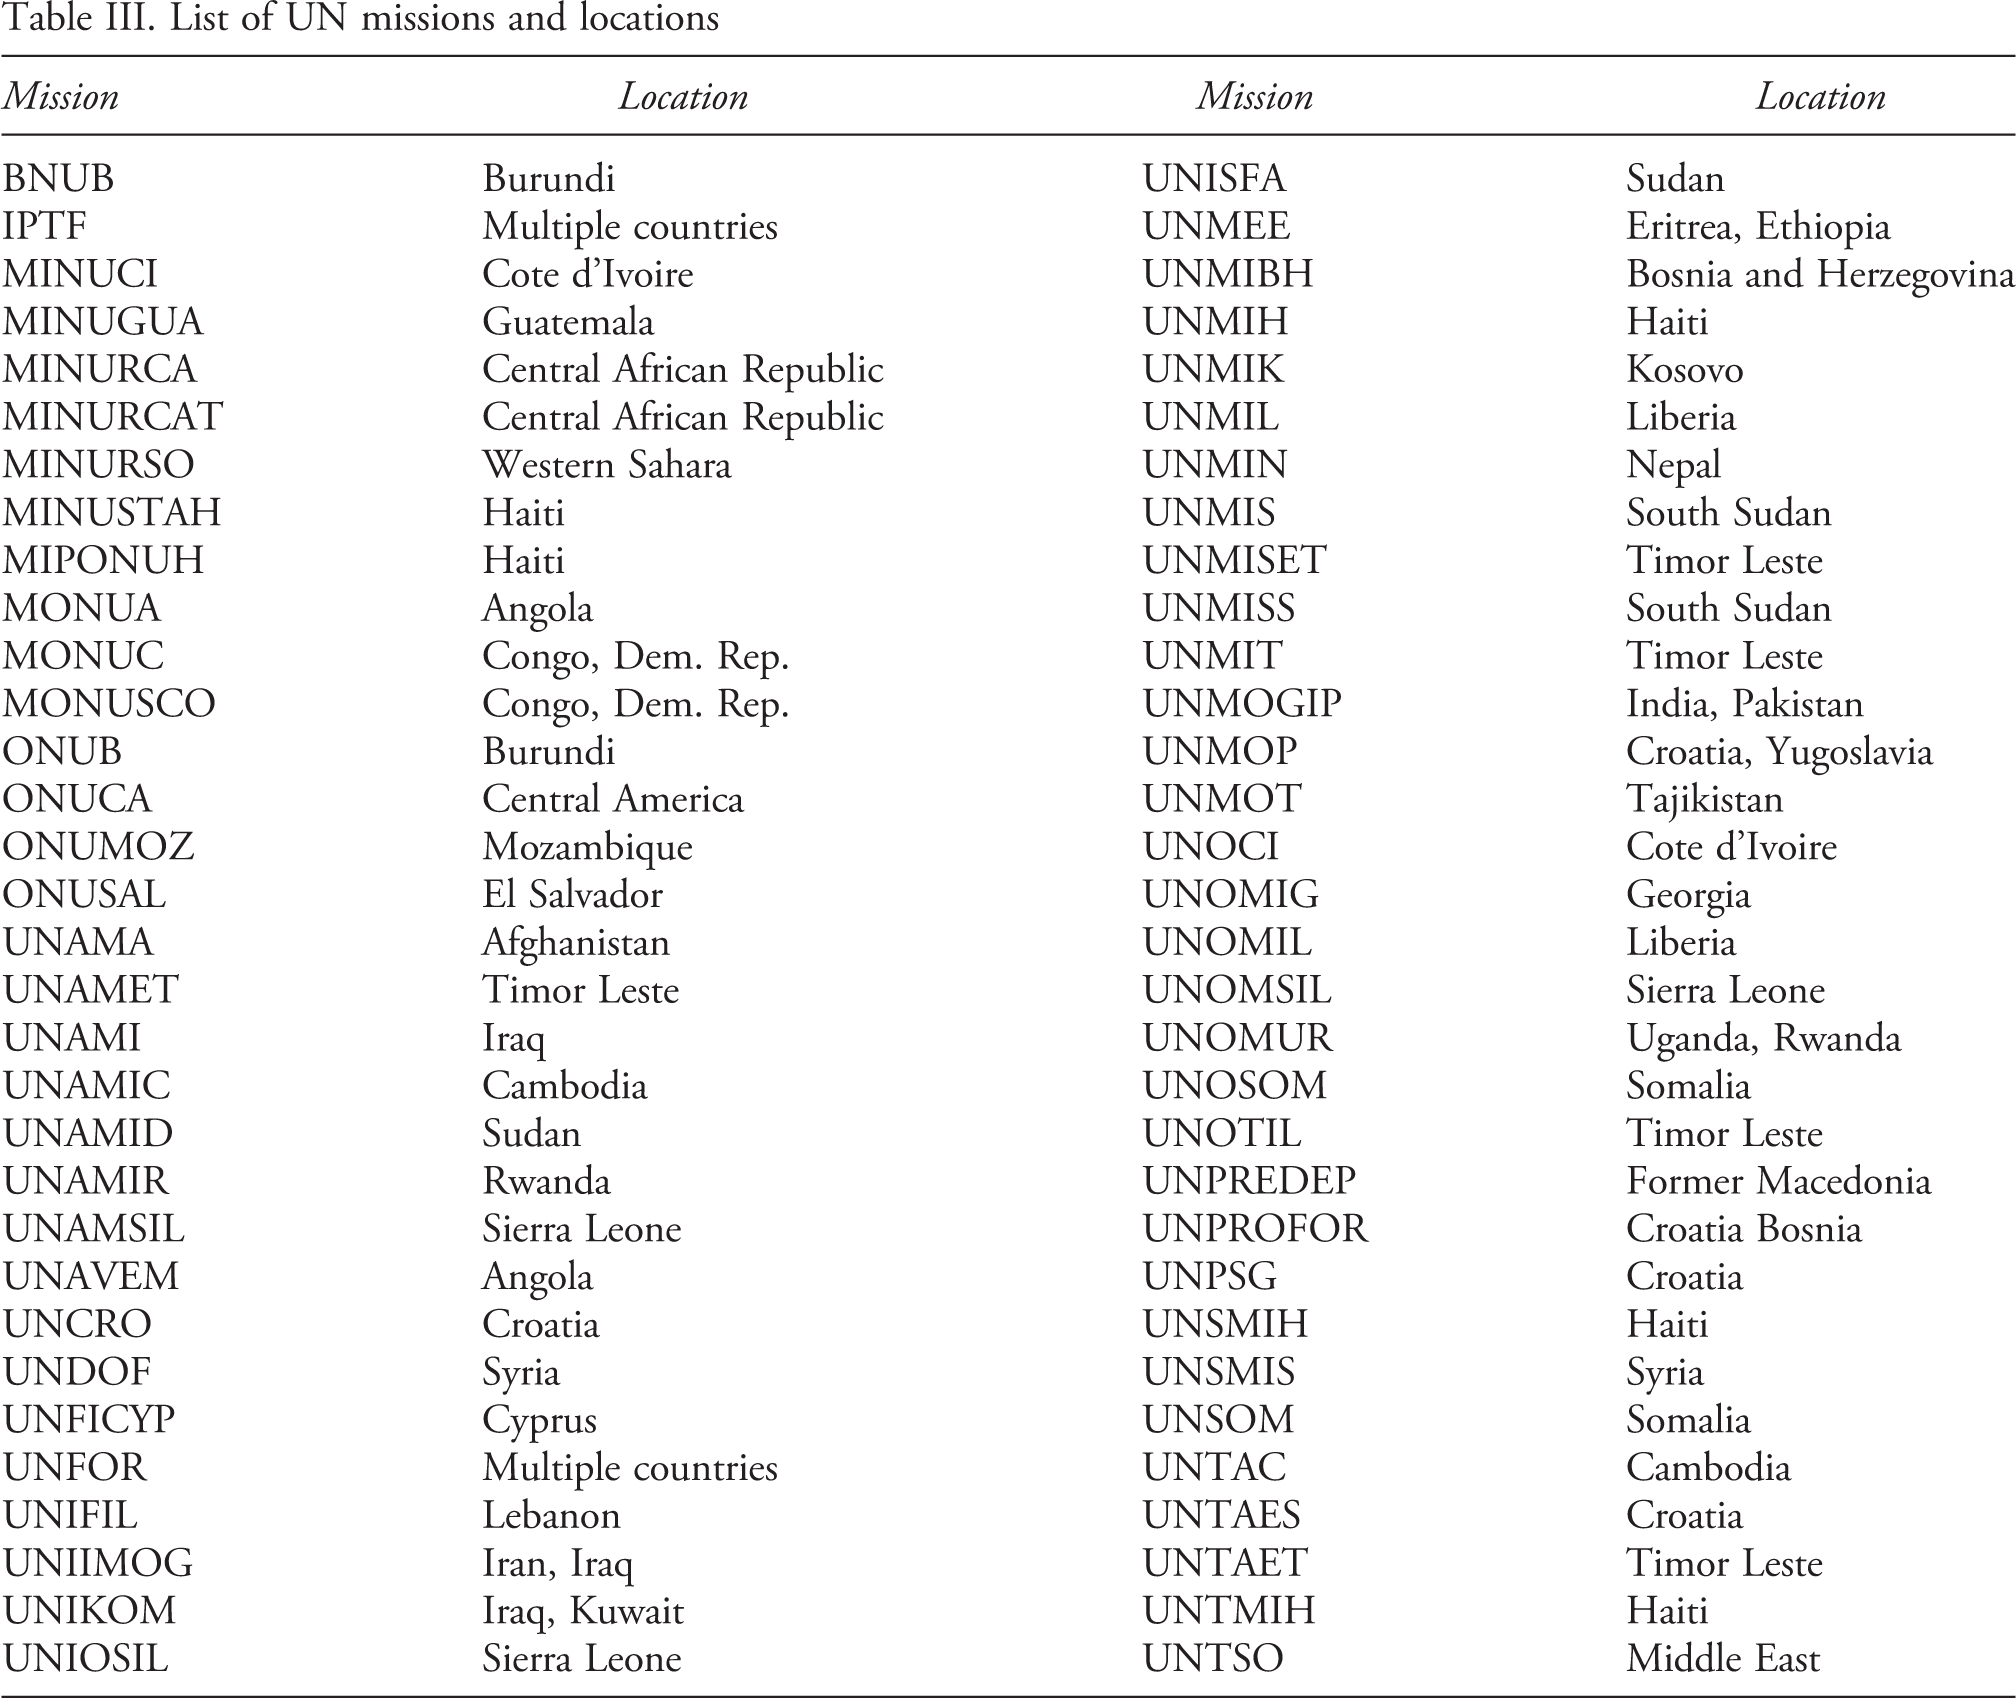
Data for peacekeepers supplied to UN PKOs are extracted from the UN Department of Peacekeeping Operations (1990–2012) monthly summaries, which record peacekeeping troops, military observers, or police contributions by country, mission, and month. Given that types of peacekeepers are not distinguished for non-UN missions, comparability to UN missions dictates that we should not distinguish them for UN missions in our primary runs. For each sample year, UN peacekeeper contribution averages are then computed for each country across contribution months. If, say, a country contributed peacekeepers to a mission for just eight months, then the average is calculated over these eight months. In total, there are 148 countries that supplied at least one peacekeeper, observer, or police to UN PKOs during 1990–2012. Based on our ten-year threshold for contributing peacekeepers, the number of sample donor countries falls to 92, as listed in Table I. Then, each country’s personnel contribution is aggregated into three periods as described earlier. We compute the dependent variable for UN regressions by adding 1 to the number of peacekeepers and then taking the log of the resulting value. The UN dataset consists of information on 92 donors over the three periods. UN missions and their locations are displayed in Table III. Although some countries are dropped from the samples, our non-UN and UN samples are representative and include countries that contributed more than 95% of total peacekeepers over the sample period.
List of UN missions and locations
Annual data on GDP per capita in constant 2005 international dollars (PPP), population, and trade as a percentage of GDP are drawn from World Bank (2013) World Development Indicators. We average these annual values for each of our periods and then compute the log of GDP per capita, ln(GDP/POP), the log of population, ln(POP), and the log of trade openness, ln(OPEN) as explanatory variables. Military personnel (i.e. active troops) data are taken from IISS (1991–2013) for 1990–2012. Based on these data, we compute ln(Military personl.), which indicates the log of a donor country’s average number of active military personnel after subtracting the number of personnel contributed to the relevant PKOs. The number of peacekeeping missions that a sample donor country participated in during a given period, denoted by PKO, is computed from our peacekeeping data. These peacekeeping data are also used to calculate the share of peacekeeping missions (Share of missions) in a donor’s region during a particular period – that is, (number of concurrent missions in the donor’s region)/(total number of ongoing missions). We rely on the World Bank regional classifications for donor and recipient regions.
Methods
We assume that country i’s supply of non-UN peacekeepers (Equation (7)) in period t is a linear function of its determinants and specify the empirical model as:
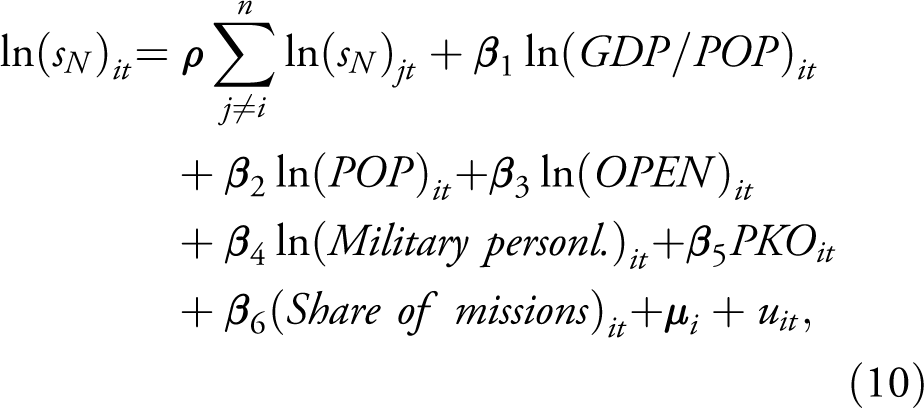
where
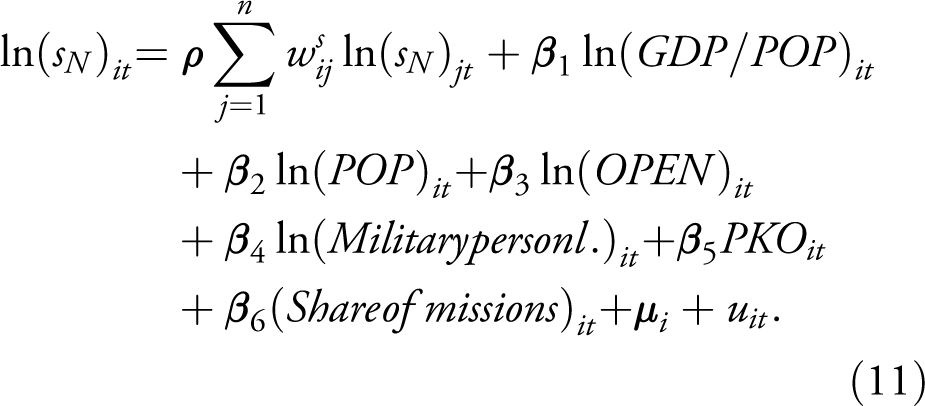
Hence, the spillover term now represents the weighted sum of other countries’ peacekeepers for a given period. Equation (11) is the spatial fixed-effects model with spatially lagged dependent variable, 9 which we estimate using maximum likelihood (ML) method (Elhorst, 2014). 10 We cannot include time-specific effects in our regressions, because our spatial weights matrix is of equal weights. Inclusion of time fixed effects would render estimates inconsistent. 11
As a robustness check, we also estimate Equation (11) using the two-step efficient GMM estimator, where the spatial lags of the explanatory variables (except personnel spillover) are used as external instruments for
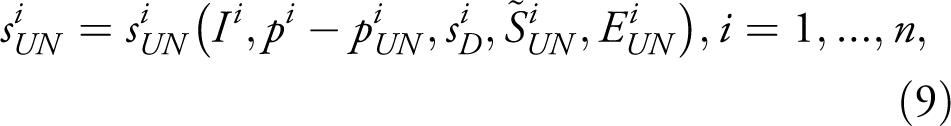
The supply of UN peacekeepers (Equation (9)) is estimated similarly.
Results
Table IV presents regression results for the supply of peacekeepers to non-UN missions. For IISS-denoted missions, the sample size corresponds to the 47 countries that satisfy our threshold criterion multiplied by the three sample periods. Models 1 and 3 are the baseline models, which include peacekeeper spillover, income per capita, population, and trade openness. Models 2 and 4 add the donor’s (logged) number of military personnel, its number of PKOs in a given period, and the donor’s share of its own region’s peacekeeping missions. Models 1 and 2 are estimated using spatial pooled OLS regression, whereas Models 3 and 4 are estimated using spatial fixed-effects regression.
Spatial panel regression (MLE) of supply of non-UN peacekeepers
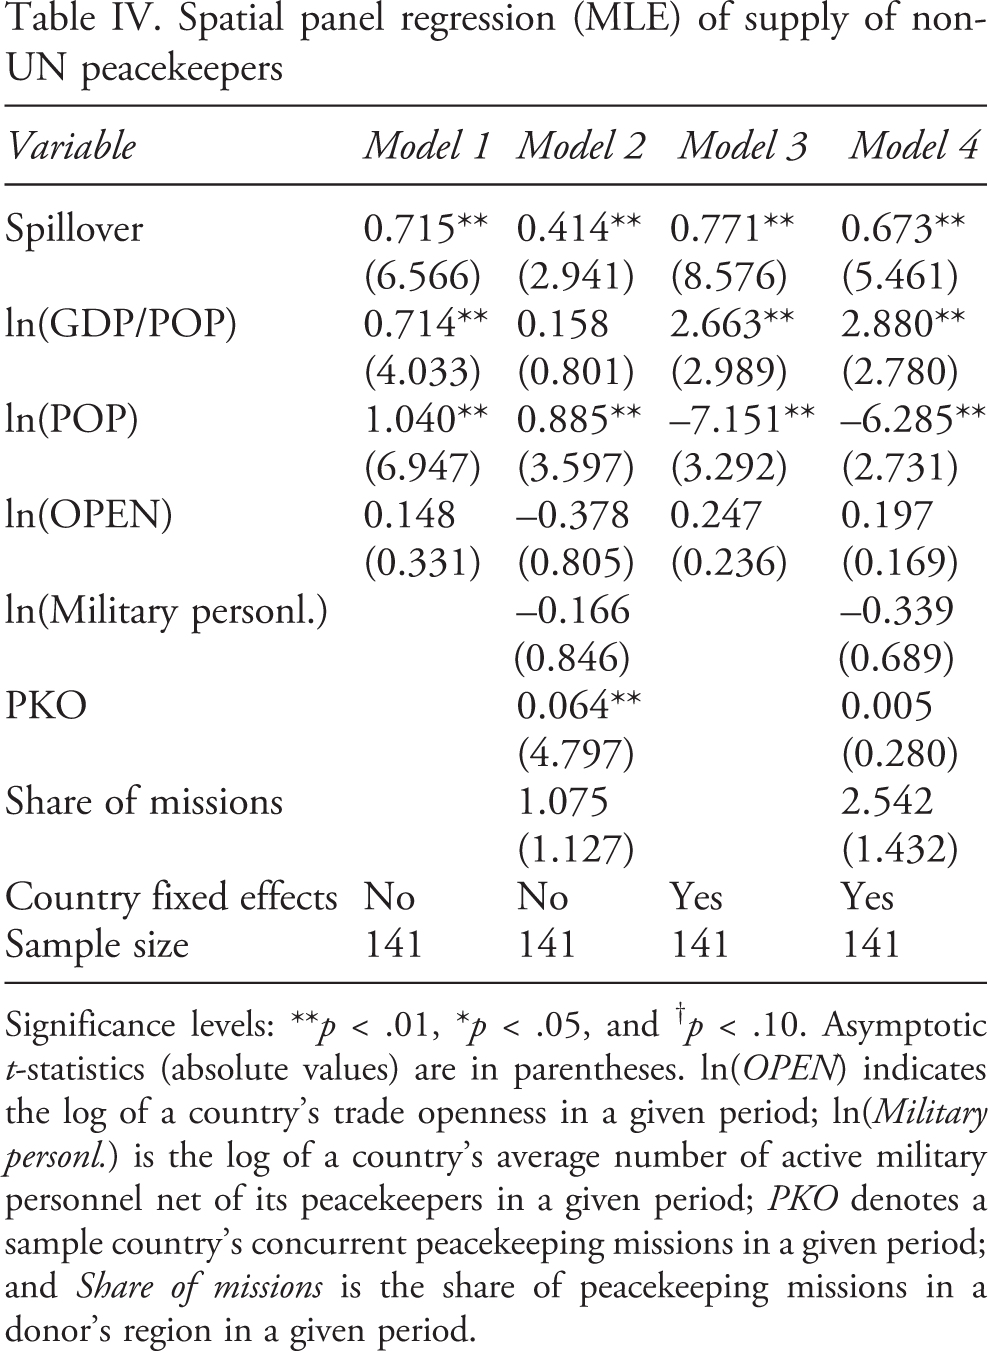
Significance levels: **p < .01, *p < .05, and † p < .10. Asymptotic t-statistics (absolute values) are in parentheses. ln(OPEN) indicates the log of a country’s trade openness in a given period; ln(Military personl.) is the log of a country’s average number of active military personnel net of its peacekeepers in a given period; PKO denotes a sample country’s concurrent peacekeeping missions in a given period; and Share of missions is the share of peacekeeping missions in a donor’s region in a given period.
The association between peacekeeper spillover and the supply of non-UN peacekeepers is positive and statistically significant across all models, implying that the jointly produced donor-specific (private) and public benefits are complements. A country deploys more peacekeepers to a non-UN mission in response to other countries’ peacekeeper contributions, presumably because the supplying country’s private and public interests are served better in a more peaceful environment. This complementarity may be bolstered by strong leadership (e.g. from the United States) and homogeneous contributors. Income has a positive influence on the supply of non-UN peacekeepers. This association is not significant in Model 2. However, when unobservable country-specific fixed effects are controlled, the estimate of income becomes statistically significant with a much larger magnitude, which suggests that the pooled OLS estimates of income are downward biased. The income coefficient is interpreted as the income elasticity and its positive sign signifies that peacekeeper contribution is a normal good. The influence of population on the supply of peacekeepers is positive in Models 1 and 2; but, when unobservable heterogeneities are taken into account, the influence of population becomes negative (Models 3 and 4). This negative association of population on non-UN peacekeeper contributions supports our theoretical expectation that less-populated industrial countries favor greater security and stability. The number of concurrent PKOs is statistically significant in Model 2, but not in Model 4. Other variables are not statistically significant, including the share of missions in a donor’s home region.
Next, we consider the supply of UN peacekeeping personnel. Models 1–4 in Table V are specified similarly to the corresponding models in Table IV. Several essential differences emerge between non-UN and UN peacekeeping findings for these four models. First, the spillover term is negative (Models 2–4), implying substitutability between jointly produced private and public outputs, consistent with free riding. In contrast to non-UN missions, a more peaceful environment associated with a UN mission does not appear to increase a peacekeeper-sending country’s private gains, except for personnel remuneration. Second, income per capita is mostly positive but is significant only in Models 1 and 3. Third, the association between population and the supply of UN peacekeepers is positive and significant in the fixed-effects regressions (Models 3–4). As a country’s population increases, it deploys more peacekeepers to UN peacekeeping missions, which supports the money-making hypothesis described in the theoretical section. Finally, the (logged) number of military personnel and the number of concurrent PKOs are statistically significant (Model 4); they were not statistically significant in the non-UN peacekeeping sample. The number of military personnel reduces the number of UN peacekeepers, whereas the number of PKOs increases the number of peacekeepers deployed by a country to UN peacekeeping missions. Both results concur with the theoretical expectations regarding crowding out and money making, respectively.
Spatial panel regression (MLE) of supply of UN peacekeepers
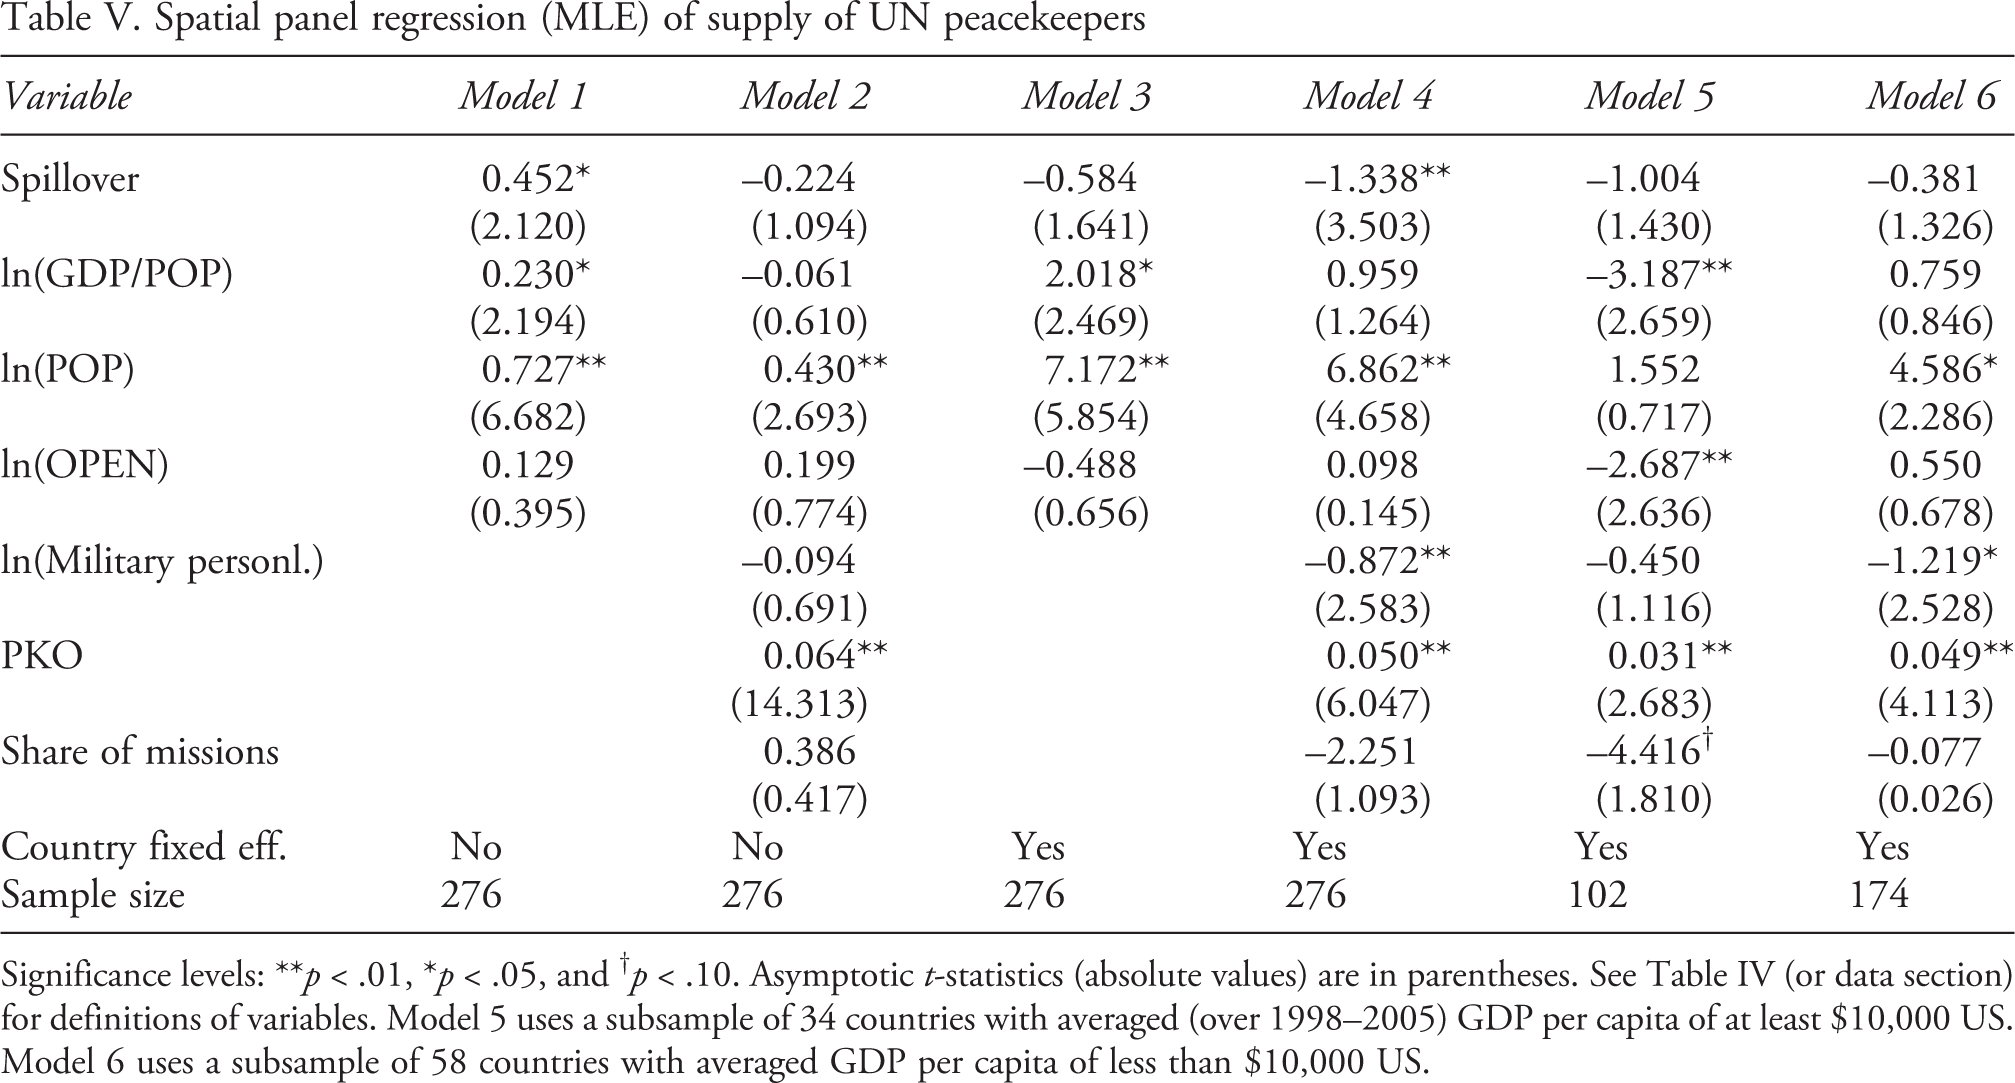
Significance levels: **p < .01, *p < .05, and † p < .10. Asymptotic t-statistics (absolute values) are in parentheses. See Table IV (or data section) for definitions of variables. Model 5 uses a subsample of 34 countries with averaged (over 1998–2005) GDP per capita of at least $10,000 US. Model 6 uses a subsample of 58 countries with averaged GDP per capita of less than $10,000 US.
We also split the UN sample into two subsamples based on donor countries’ averaged GDP per capita over 1998–2005 and re-estimate Model 4 for each subsample. Model 5 presents regression results for a subsample of 34 countries with averaged GDP per capita of at least $10,000. Model 6 indicates results for 58 countries with averaged GDP per capita of less than $10,000. The $10,000 is chosen as a threshold in part to ensure that we have a reasonable sample size for relatively richer countries. For higher income countries, the income elasticity of supply of peacekeepers to UN peacekeeping missions is negative. As a country’s GDP per capita increases, the number of peacekeepers deployed to UN peacekeeping operations declines. In our sample, high-income countries deploy most of the non-UN peacekeepers. Therefore, this negative income elasticity of the supply of UN peacekeepers, combined with a positive income elasticity of the supply of non-UN peacekeepers (Table IV) implies that as a richer country’s income increases, its non-UN personnel contribution crowds out its UN personnel contribution. We have further checked this crowding-out hypothesis, by including the number of concurrent non-UN PKOs as an additional explanatory variable. The effect of income remains negative but becomes statistically insignificant; however, the association with respect to non-UN PKOs is negative and statistically significant. Thus, as a country participates in more non-UN peacekeeping missions, it reduces its peacekeeper deployments to UN peacekeeping missions, which supports our conjecture (results are available upon request). We take this finding cautiously because of potential endogeneity that may arise from the inclusion of non-UN PKOs. Further research is needed on this very important issue.
As a relatively higher income country becomes more open in terms of trade, it reduces the number of peacekeepers deployed to UN peacekeeping missions. This suggests that UN missions may not serve rich contributing countries’ trade interests. The share of UN missions in a donor’s region has a negative effect on peacekeeper deployments, but this effect is only marginally significant. We note that three variables – income per capita, trade openness, and share of UN missions – are not statistically significant for the full sample (Model 4 in Table V). The number of concurrent PKOs is positive and statistically significant, which is similar to the full-sample results, but population and military personnel are not statistically significant, contrary to the full-sample results. The statistically insignificant effect of population suggests that the money-making peacekeeper deployment hypothesis is not supported for the subsample of higher income countries. The regression results for the subsample of lower income countries are, however, generally in line with the full-sample findings. Income per capita, share of missions in the donor’s region, and trade openness are not statistically significant, which implies that the poorer countries derive private benefits from money making and not from standard private country-specific proxies. Population and the number of concurrent PKOs are positive and statistically significant, whereas the military personnel variable is negative and statistically significant for the poorer peacekeeper donors, also consistent with money making. The spillover term is not statistically significant for either subsample, indicating a lack of publicness for UN peacekeeping for the split sample.
As a robustness check, we apply the two-step efficient GMM estimator to non-UN and UN samples – see Table VI. We compute standard errors, which are robust to heteroskedasticity and autocorrelation for statistical inference. Our main conclusions hold. The GMM estimator of the spatial panel model includes country-fixed effects. However, the time-specific effects are not included because their inclusion would lead to inconsistent estimates caused by the equally weighted spatial weights matrix. Therefore, we exclude the spillover term and implement the least squares dummy variable (fixed-effects) estimator, which includes both country-specific and time-specific effects. The results are not sensitive to this specification.
Robustness analysis of supply of peacekeepers
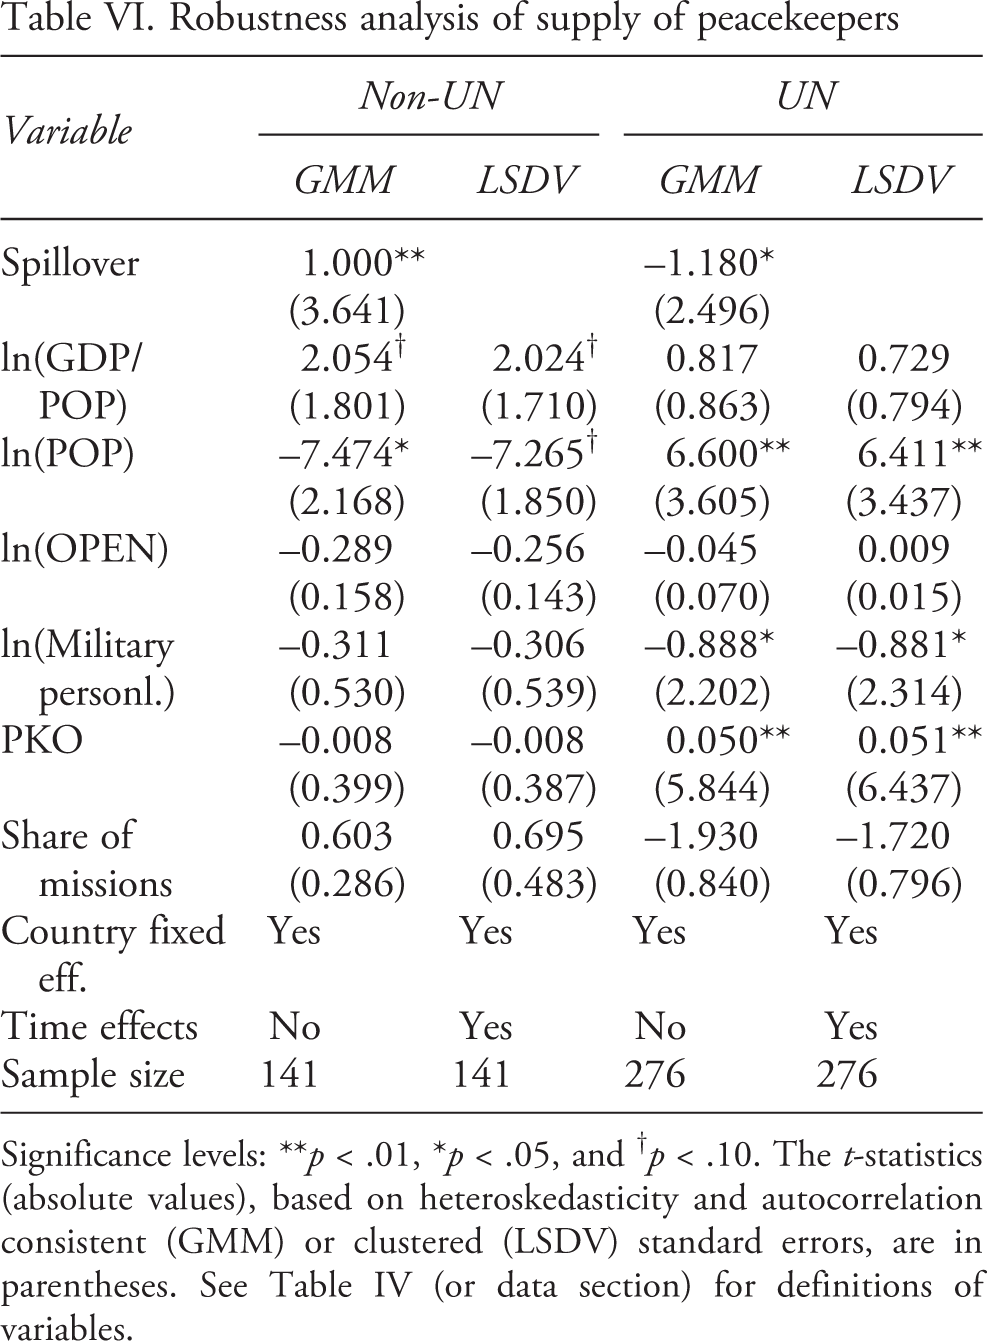
Significance levels: **p < .01, *p < .05, and † p < .10. The t-statistics (absolute values), based on heteroskedasticity and autocorrelation consistent (GMM) or clustered (LSDV) standard errors, are in parentheses. See Table IV (or data section) for definitions of variables.
Table VII provides further robustness analysis. To save space we only show the regression results for the main specification (Model 4 in Tables IV and V). Model 1 presents results for the UN sample using only troops and police contributions. The results are not sensitive to the exclusion of observers. We cannot make a similar distinction for the non-UN sample because IISS data are not available at a disaggregated level for most years. Next, from SIPRI (2014), we obtain data on personnel contributions for the following non-UN missions: AU Mission in Burundi, International Peace Monitoring Team for the Solomon Islands, Multinational Interim Force in Haiti, OAU Observer Mission in Burundi, OAU Observer Mission in the Comoros, and Observer Mission in the Democratic Republic of Congo. These missions are not included in the main sample insofar as they are not listed in IISS data. We add to our data the sample countries’ contributions to these missions and then re-estimate the regressions. The findings hold (Model 2). Finally, we remove AU and ECOWAS missions (AU Mission in Sudan, AU Mission to Somalia, AU Electoral and Security Assistance Mission, ECOMOG in Liberia, ECOMOG in Sierra Leone, ECOMICI, ECOMIL and ECOMIB), where participating countries receive partial reimbursement. 12 Our main results hold in Model 3.
Robustness analysis of supply of peacekeepers
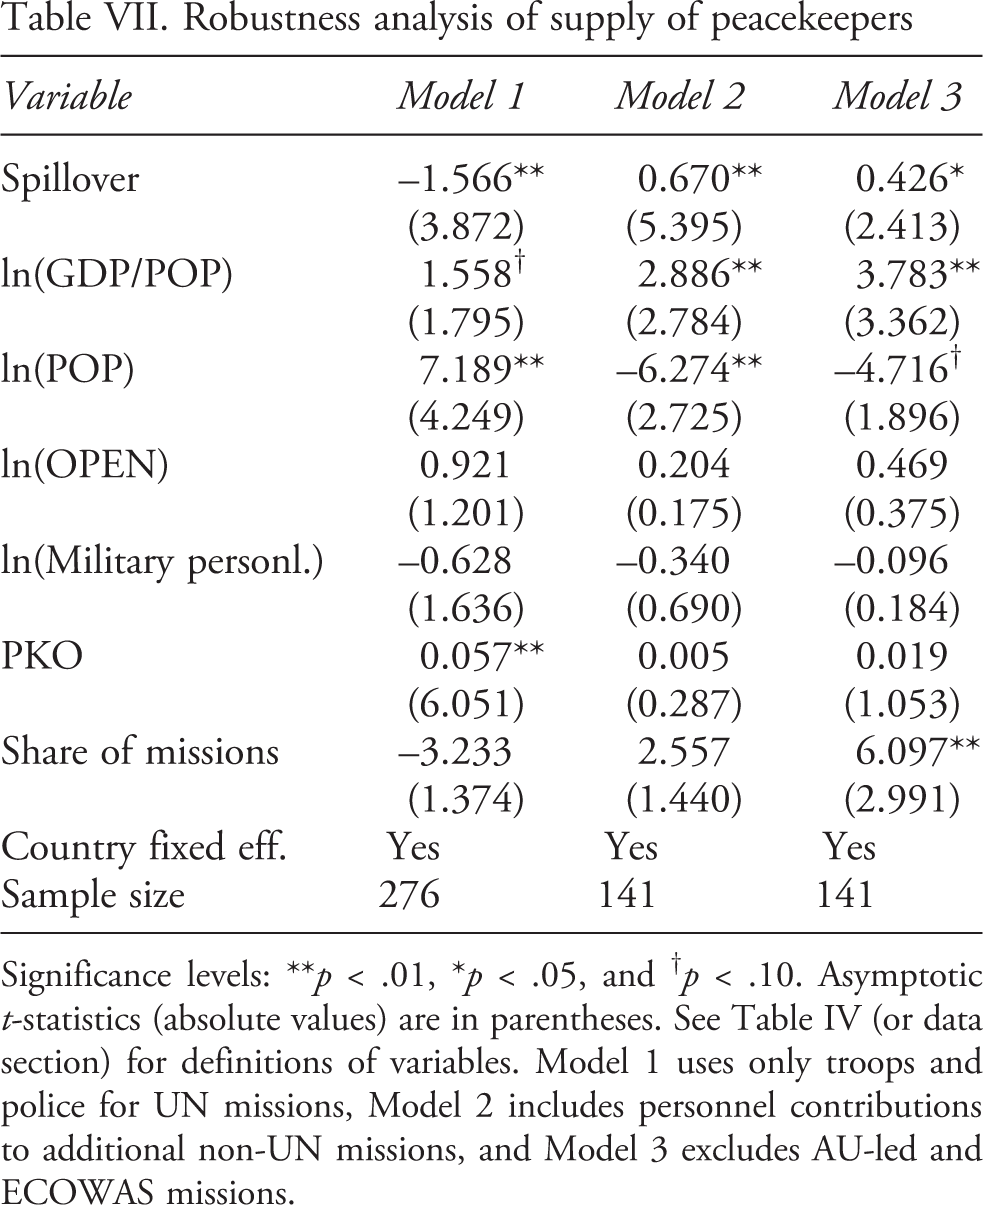
Significance levels: **p < .01, *p < .05, and † p < .10. Asymptotic t-statistics (absolute values) are in parentheses. See Table IV (or data section) for definitions of variables. Model 1 uses only troops and police for UN missions, Model 2 includes personnel contributions to additional non-UN missions, and Model 3 excludes AU-led and ECOWAS missions.
Concluding remarks
This article presents spatial panel estimates for the supply of peacekeepers to both UN and non-UN peacekeeping missions during 1990–2012. In particular, our reduced-form equations follow from an explicit utility-maximizing, game-theoretic model. Accordingly, our estimates explicitly account for the endogeneity of the peacekeeper spillover variable in every set of estimates. Over the sample period, we find that UN peacekeeper contributors are more motivated by money-making personnel deployments than by other contributor-specific gains, such as regional stability. This is shown, in part, by dividing UN peacekeeper countries into rich and poor cohorts. In addition, non-UN peacekeepers are found to be motivated by publicness considerations, reflected in the positive and significant peacekeeper spillover term. The opposite or no reaction to these peacekeeper spillovers characterizes UN peacekeeper contributors, highlighting different responses to the publicness associated with contributing peacekeepers to the two types of missions. For UN peacekeeping, the negative spillover coefficient, when present, is indicative of free riding, while the insignificant spillover coefficient is indicative of an absence of publicness. Moreover, derived contributor-specific benefits also differed between the two types of missions.
The results here show that contributors’ publicness response to the two types of peacekeeping missions depends on whether they give financial or peacekeeper support. For financial support, UN missions displayed more publicness than non-UN missions (Gaibulloev, Sandler & Shimizu, 2009), while the opposite is true in the current study for peacekeeper support owing to remuneration for UN peacekeeper countries. This emphasizes that the degree of publicness is dependent on institutional arrangements, which is long expected but, until now, not shown empirically.
Footnotes
Replication data
The execution files and data to produce the tables can be found at http://www.prio.org/jpr/datasets.
Acknowledgements
We have profited from helpful comments provided by two anonymous referees and Han Dorussen.
Notes
References
Supplementary Material
Please find the following supplemental material available below.
For Open Access articles published under a Creative Commons License, all supplemental material carries the same license as the article it is associated with.
For non-Open Access articles published, all supplemental material carries a non-exclusive license, and permission requests for re-use of supplemental material or any part of supplemental material shall be sent directly to the copyright owner as specified in the copyright notice associated with the article.