
Abstract
The shift from physical music consumption to online music streaming has fundamentally transformed the market for recorded music, giving consumers access to millions of songs on demand. Because streaming platforms pay artists and labels on a per-play basis, sustained listening and effective discovery have become essential for generating meaningful revenue. With traditional marketing losing relevance for recorded music, curated collections in the form of playlists have emerged as a potentially vital tool for labels to lift streaming demand. As a result, labels have started to deploy playlist marketing by either curating their own playlists or targeting influential playlists curated by others. However, the success factors behind the impact of playlists on song demand remain insufficiently understood. An analysis of 200,455 quasi-experiments where songs are listed on playlists and later delisted shows an average listing effect of 8.5% more global streams and a carryover effect of 4% after delisting. Although these effects are highly heterogeneous, they can be systematically explained by playlist design characteristics, including playlist popularity, the song's prior playlist exposure, the fit between the song and playlist, curator identity, and the curation approach. These findings empower labels to deploy more informed playlist marketing to lift streaming revenue.
Keywords
Over the past decades, the business model for recorded music has undergone a significant transformation, with a substantial shift from physical music consumption (e.g., CDs) to digital music consumption, particularly online music streaming. Whereas music streaming was essentially unknown in 2000, nowadays, two-thirds of the global recorded music revenue (valued at USD 29.5 billion) comes from streaming (IFPI 2025). On streaming platforms such as Spotify, revenue for music artists and labels is directly tied to the frequency of their songs being streamed (Bergantiños and Moreno-Ternero 2025). This shift contrasts sharply with earlier music formats such as CDs and downloads, where revenue from purchased music did not depend on continued listening. Concurrently, the digitization of music means that platforms such as Apple Music and Spotify now offer consumers online access to vast libraries of content. For example, Spotify's catalog exceeds 100 million tracks, with over 120,000 new songs added daily (Ingham 2023). The reason is that, unlike in traditional brick-and-mortar stores, there are practically no restrictions on shelf space and the number of products that online platforms for digital goods (e.g., music, digital books, shows, movies) can offer. While these massive assortments provide unparalleled choice, they can also overwhelm consumers, a phenomenon known as the “tyranny of choice” (Chernev, Böckenholt, and Goodman 2015; Schwartz 2004).
The new business model of streaming provides music artists and labels with a strong economic incentive to drive repeated consumption of their content. However, traditional marketing instruments, such as pricing, promotions, and distribution, have become essentially obsolete because consumers have the entire assortment at their fingertips with zero marginal cost for listening to an additional song. This is due to platforms such as Spotify and Apple Music following a subscription-based model, where consumers pay a fixed fee rather than paying per song or album.
Thus, for music artists and their labels, the challenge posed by vast assortments is to ensure that consumers not only discover their content but also consume it and return to it. This challenge is especially pressing in access-based consumption business models, such as music streaming services, where artists are paid per stream (Bergantiños and Moreno-Ternero 2025).
In this context, curated collections in the form of playlists have emerged as a potentially vital tool to support consumers in making choices from large assortments. We define playlists as subsets of larger assortments that are grouped based on one or more shared characteristics or benefits (Boughanmi, Ansari, and Li 2025). Playlists expose consumers to new music and help them consume and discover music they may like. On Spotify, consumers can choose from many playlists, with some attracting more than 35 million followers. 1 Recognizing the growing potential of curated playlists to drive streaming demand (and the reduced relevance of traditional marketing instruments), major and independent music labels have started to deploy playlist marketing. Playlist marketing can be either direct (curating their own playlists) or indirect (pitching their songs to playlists curated by others). Both the direct and indirect playlist marketing approaches require insights into those song and playlist characteristics that increase the payoff from playlist listings. For example, popular playlists with many followers may be more effective, while songs with a lot of prior exposure may benefit less from being listed.
Aguiar and Waldfogel (2021) offer some initial evidence of the importance of playlists by studying the economic consequences of popular songs (in the Top 200 charts) being listed on one of the six largest playlists on Spotify. However, their study focuses on already successful songs and the largest playlists and does not explore the heterogeneity in effectiveness across different playlists or songs. It leaves open the question of how artists and their music labels can best leverage different types of playlists—whether through their own curation or by targeting third-party playlists—to generate the biggest uplift in streams for their songs.
The goal of this article is to measure the (heterogeneity in the) effectiveness of playlists in driving music demand for individual songs. By uncovering how playlist design characteristics explain the heterogeneity in playlist effects, our research provides new insights for artists and their labels to enhance streaming revenue through playlists. Given the potentially high commercial relevance of curated collections, these insights enable more informed playlist marketing by identifying the types of songs and playlists that lead to the strongest uplifts in streaming demand.
Thus, we address two important research questions that the academic literature has not addressed and that are important to the real-world stakeholders of artists and the labels: (1) To what extent does the inclusion of a song on curated playlists influence its demand across a wide range of songs and playlists, both during the playlist listing and after its removal? (2) How do playlist design characteristics explain the heterogeneity in the effects?
Previous work on music streaming (see Table 1) has examined how streaming leads to more variety in music consumption (Datta, Knox, and Bronnenberg 2018), how COVID-19 restrictions affect country-level music consumption (Sim et al. 2022), and how the entry of a new music video channel for official music content (Kretschmer and Peukert 2020) and user-generated content (Wlömert et al. 2024) affect streaming demand. Pachali and Datta (2025) examine how a song's inclusion on a playlist and the positioning of the playlist within the app affect the number of followers of this playlist. Their findings suggest that including a song by a major label artist has a modest effect on followers (.45%). To the best of our knowledge, there is just one extant paper studying playlists as the focal driver of streaming demand. Aguiar and Waldfogel (2021) assess the impact of playlist inclusion on song demand, focusing on samples of Spotify's top six playlists and relatively successful songs in the Top 200. They find that appearing on these major platform-operated playlists can increase streams by millions, providing initial evidence for the platform's substantial power to influence song success.
Literature Studying the Drivers of Streaming Demand.
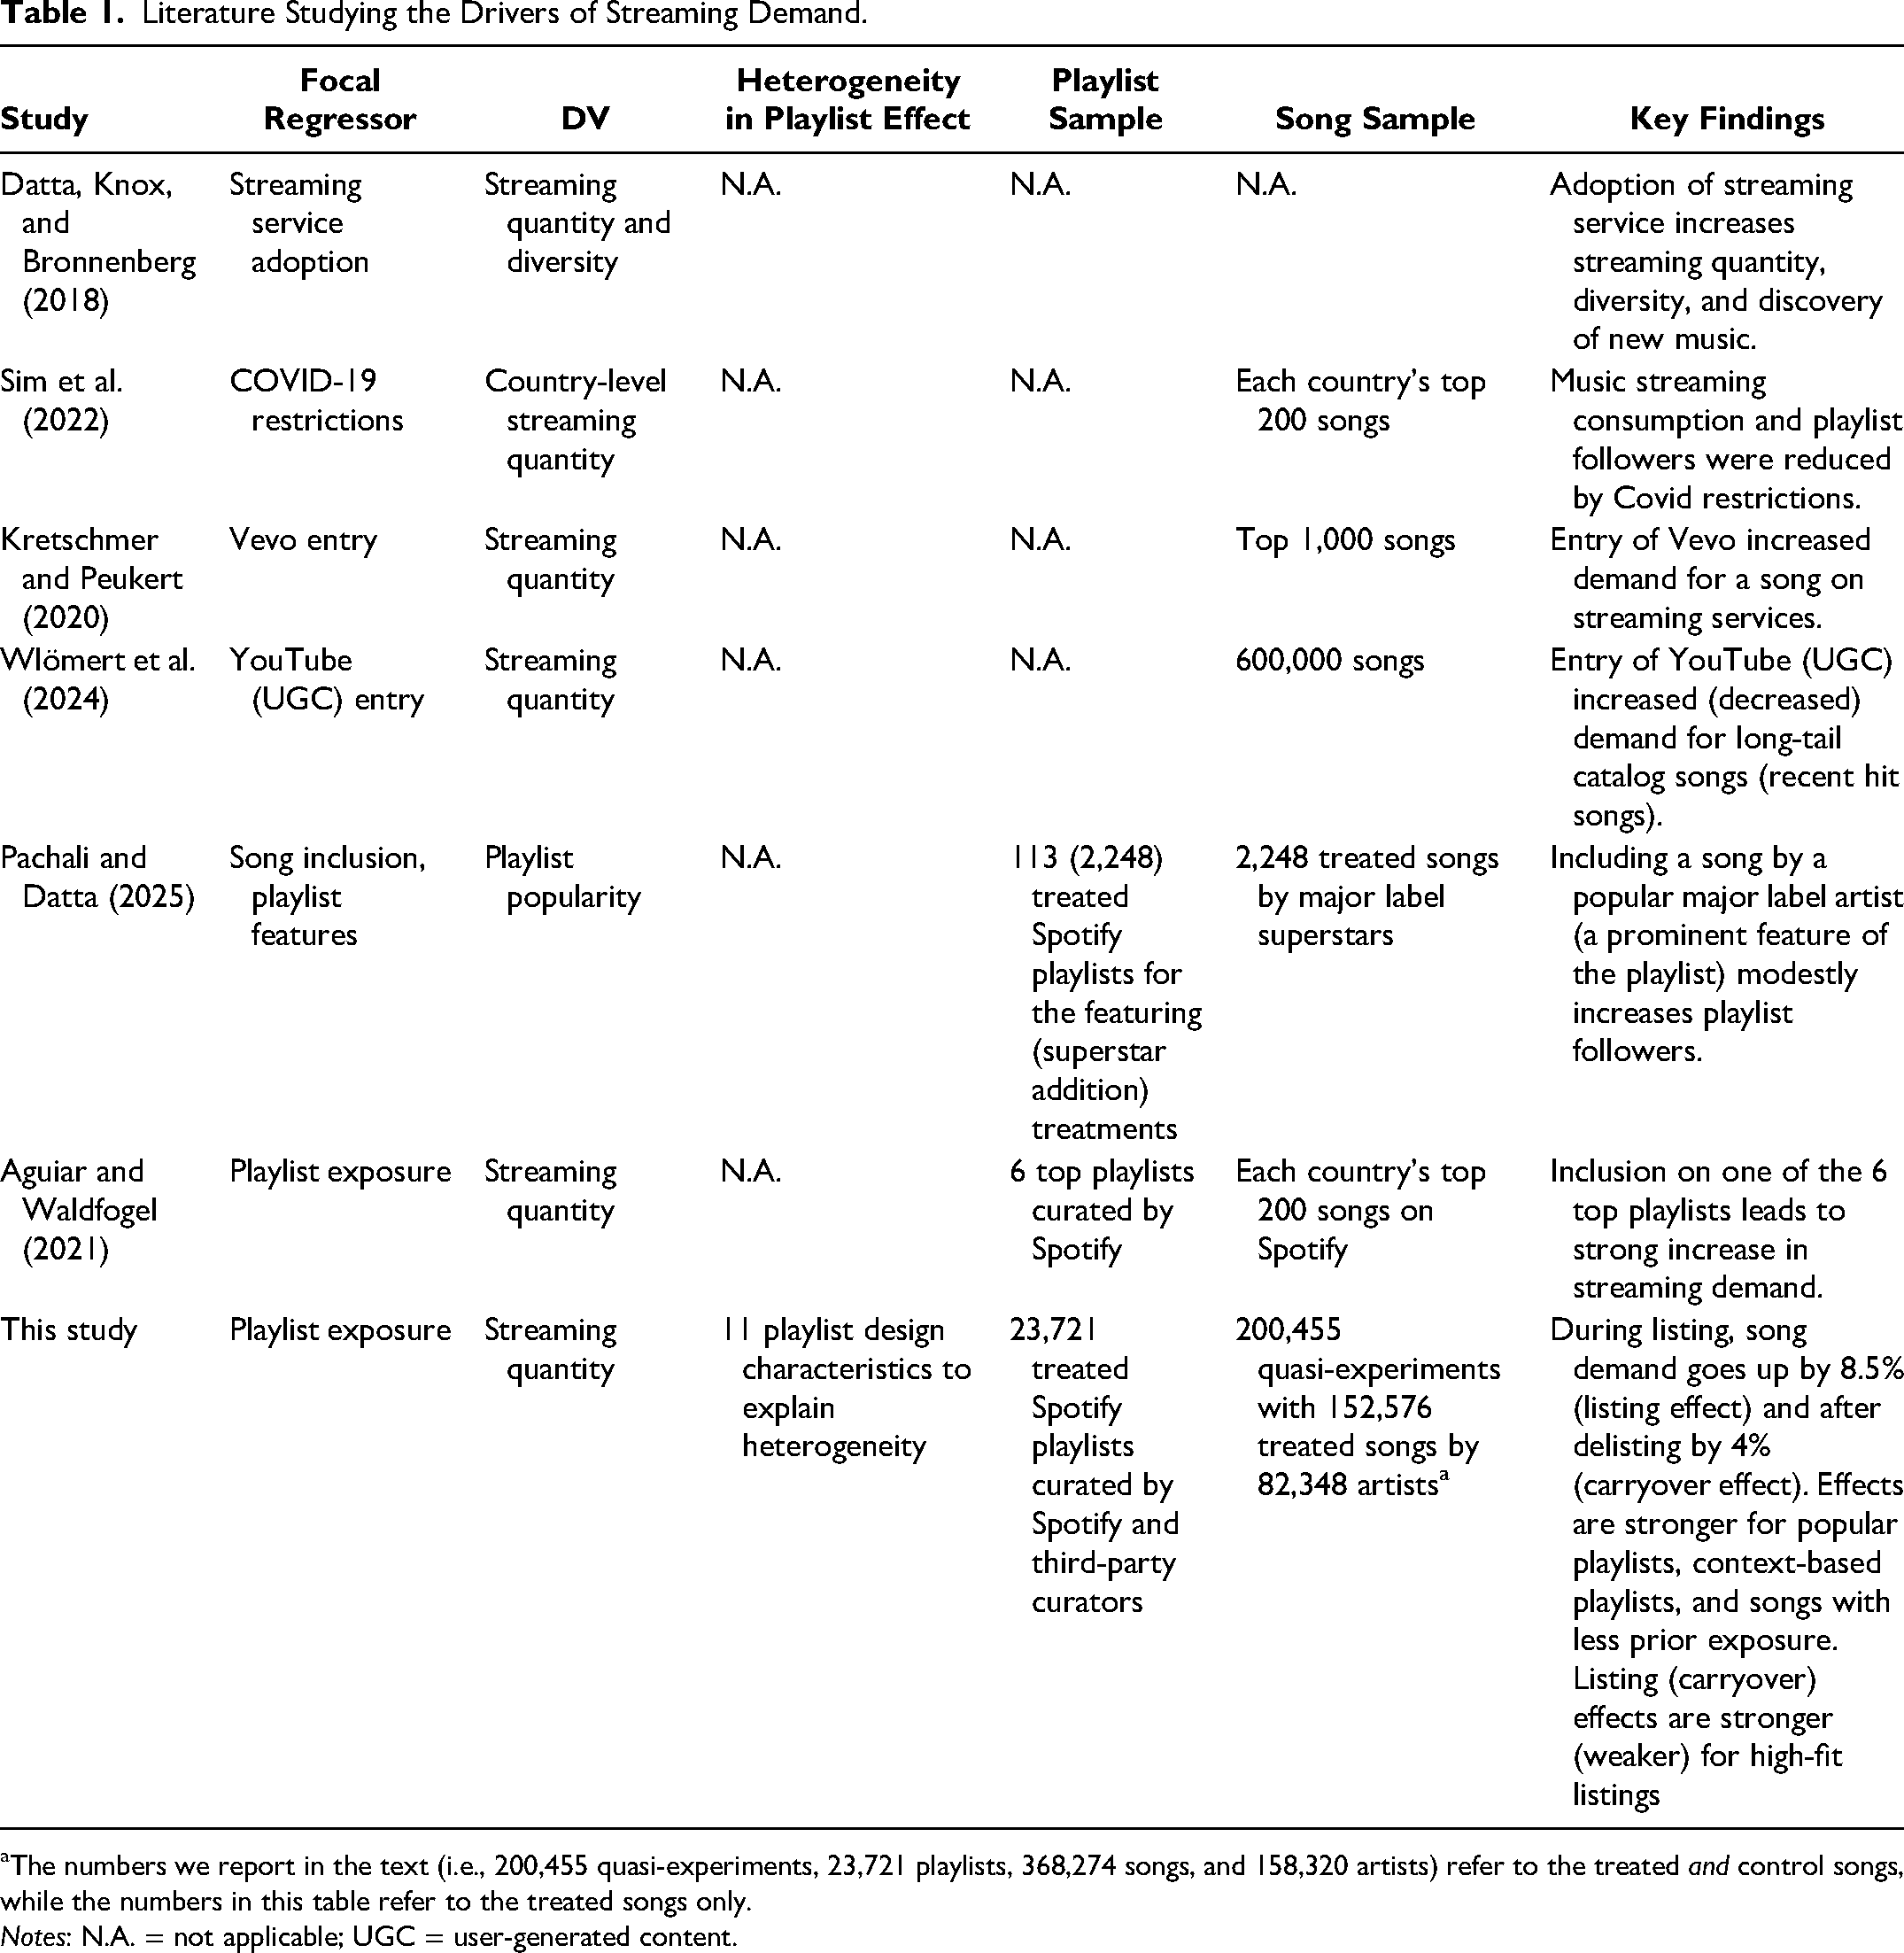
The numbers we report in the text (i.e., 200,455 quasi-experiments, 23,721 playlists, 368,274 songs, and 158,320 artists) refer to the treated and control songs, while the numbers in this table refer to the treated songs only.
Notes: N.A. = not applicable; UGC = user-generated content.
While these studies provide valuable insights into the growing influence of streaming platforms, they do not shed light on the diverse factors driving heterogeneity in listing and carryover effects. As such, they do not take the perspective of music artists and their labels that want to deploy playlist marketing to drive streams for their songs.
To address this research gap, we start from the notion that playlists are a key tool for artists and their labels to let users consume and discover songs. Once a song has been listed on a playlist, it is exposed to playlist followers who may listen to the song during the listing period, leading to a lift in streams, which we define as the listing effect. Listening to the song may mean the user discovers it, may like it, and adopts it (i.e., the song may become part of the user's internal repertoire or personal playlist, such that the user may listen to it even after the song has been delisted from the playlist). We define this as the carryover effect. We use playlist design characteristics (e.g., playlist popularity, a song's prior exposure, fit between song and playlist) to explain the heterogeneity in the listing and carryover effects.
We analyze global streaming data from Spotify, the world's leading on-demand music streaming service, for 23,721 playlists featuring a large and diverse set of 368,274 songs from 158,320 artists, using more than three years of daily data (1,154 days) totaling over 123 billion streams. We identify 200,455 quasi-experiments by observing periods when a song is added to one playlist only (capturing the listing effect on daily streams) and later delisted (capturing the carryover effect). Using a difference-in-differences (DiD) approach, our analysis reveals a strong average listing effect of 8.5% and a carryover effect of 4% after delisting. These effects show considerable variability, with some songs seeing increases of up to 22%, while others, particularly those on less popular playlists or with extensive prior playlist exposure, gain little.
Our article contributes to the literature on music streaming by being the first to systematically study the substantial heterogeneity in both listing and carryover effects across different types of playlists and songs using large, representative samples of playlists, artists, and songs (see Table 1). Our unique global data set enables us to identify the key factors explaining variability in streaming outcomes and provide valuable new guidance to artists and their labels to enhance playlist targeting and curation. We find that playlist design characteristics that increase a song's exposure (more playlist followers, more prominent playlist position, shorter playlist) lead to stronger uplifts in demand during the listing period, the carryover period, or both. We also find that songs with less prior playlist exposure benefit more from playlist inclusion, and that songs also benefit from a higher prior playlist exposure of other songs on the playlist.
Importantly, three playlist design characteristics have contrasting impacts on listing and carryover effects. While listings with a higher fit in terms of both musical attributes and colistings on other playlists enhance the listing effect—likely because they improve the overall listening experience—they reduce the carryover effect as they limit the potential for new music discovery. In addition, while playlists managed by music labels themselves somewhat reduce the listing effect, they enhance the carryover effect. Finally, playlists curated by context, focusing on activities or situations rather than genres or artists, lead to stronger uplifts during both the listing and carryover periods, as they are associated with longer and recurring listening occasions.
Institutional Background
Music is an industry of strong consumer and economic significance. Online users in a large global survey reported spending, on average, 26 hours per week listening to music, and almost 90% of them rely on on-demand streaming services (IFPI 2019), with the number of subscribers to streaming services exceeding 700 million users globally (Leu 2024).
Since the early 2000s, the recorded music industry has moved from selling physical goods (CDs, LPs) to selling digital goods (e.g., MP3 files) to selling access to streamed music. The transition to access-based consumption has fundamentally changed the business model for artists and labels. Unlike the traditional transaction-based model, where income was generated per unit sold, artists in the streaming economy earn revenue based on content usage. Platforms such as Spotify, for example, distribute approximately 70% of their revenue from subscription fees and advertising as royalties to rights holders proportional to their streaming market shares (Strassen 2023). The rightsholders then pay the artists from these revenues based on the agreed terms. A song needs to be streamed for 30 seconds to count toward these revenues. The rates paid to labels and artists per stream can vary across platforms (see, e.g., The Trichordist 2020), as they depend on the revenue generated and content usage intensity. Typically, however, the amount is a fraction of a dollar cent per stream, e.g., USD .006 per stream for Apple Music.
In this landscape, playlists have emerged as a central tool for consumers to discover new music. Conceptually, playlists can be seen as a form of rebundling of previously unbundled content (Elberse 2010), where playlist curators group songs together based on either similarity in content (e.g., rap music, classic rock) or based on the context in which the music is enjoyed (e.g., while studying, while working out). Unlike traditional promotional avenues, artists and labels cannot purchase a spot on these playlists, which is against the platforms’ terms and conditions (Spotify 2020).
In response, artists and labels have made playlist marketing a priority, with the goal of having their songs included on influential playlists. Labels deploy direct and indirect approaches to playlist marketing. The direct approach is that labels (and even some artists) curate their own playlists on music platforms. Major labels have established brands under which they manage portfolios of popular playlists, some of which attract millions of followers. For example, “Digster” is the brand under which Universal Music Group curates playlists, “Filtr” is Sony Music's playlist brand, and “Topsify” is Warner Music Group's playlist brand (Billboard 2017). These brands and their associated playlists allow labels to directly decide which songs to include on these playlists (e.g., songs with less prior exposure) and how the playlist is curated (e.g., context-based, content-based). Over the years, the labels’ significant investment in their playlist networks has led to a substantial growth in playlist reach. When we cumulate the global follower numbers across all managed playlists in our data, the major label curator brands rank just behind Spotify's playlists, occupying the #2 (Filtr), #3 (Digster), and #4 (Topsify) spots. Smaller, independent labels also curate their own playlists on streaming platforms.
The indirect approach to playlist marketing is that labels have dedicated sales teams pitching the songs of their artists for consideration to be included in influential playlists managed by the music platform itself or third parties (McCarty 2025). To facilitate this process, platforms such as Spotify operate dedicated channels through which the pitch takes place (https://artists.spotify.com/playlisting).
Using the example of the “Hot Country” playlist, Figure 1 illustrates how playlists are presented in Spotify's user interface (Panel A) and how a song's inclusion in the playlist can impact its demand (Panel B). The “Hot Country” playlist is the most popular country music playlist on Spotify and ranks among the top 20 overall with approximately 7.6 million followers.
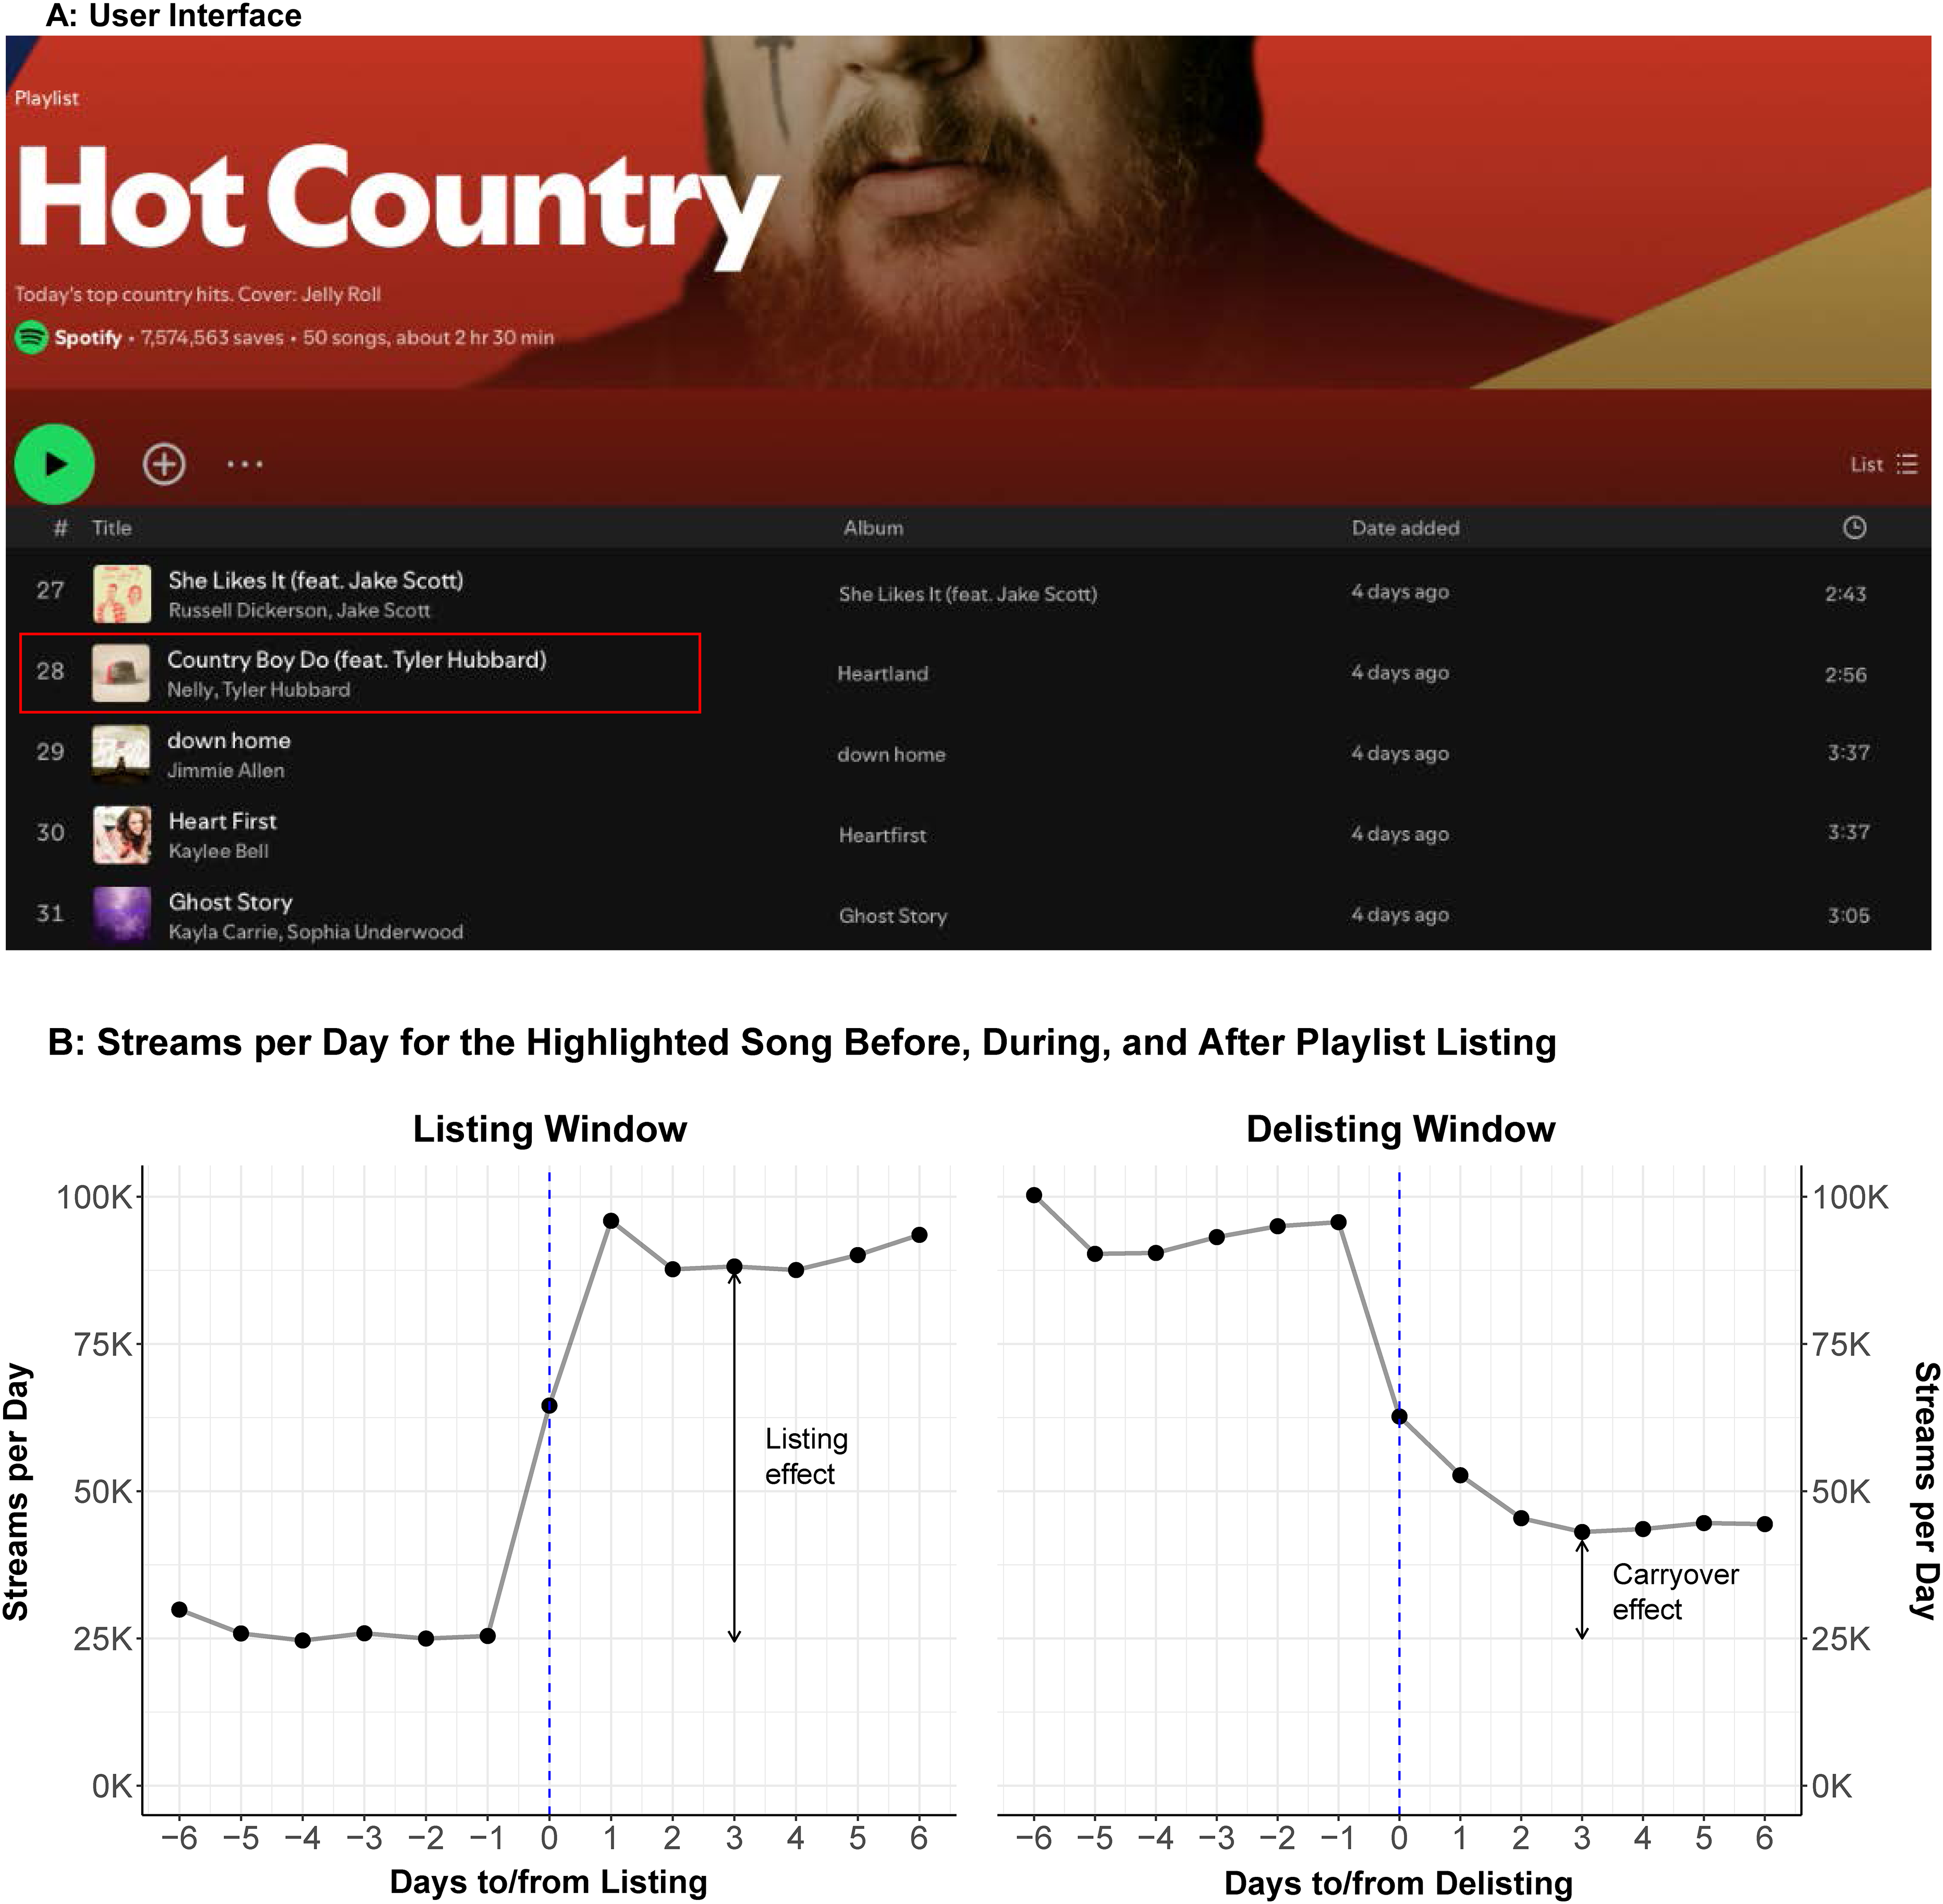
Example of a Listing and Delisting of a Song to/from a Playlist.
Panel B focuses on the song “Country Boy Do” by Nelly and Tyler Hubbard, which was added to the playlist at position #28 on May 20, 2022. The left graph in Panel B tracks the song's streaming trajectory six days before and after the playlist inclusion, which we refer to as the listing window. Streams increase significantly from around 25,000 before listing to approximately 100,000 after the inclusion, suggesting a listing effect of around 75,000 additional daily streams. The right graph shows the trajectory six days before and after the song was removed from the playlist on July 22, 2022 (the delisting window). Streams drop sharply after removal, from around 100,000 to 40,000, which is around 15,000 streams higher than the 25,000 streams observed before inclusion. This lasting increase in demand (or carryover effect) may be due to users who discovered the song on the playlist and saved it to their libraries for repeated listening.
Our analysis focuses on (1) the listing effect—how playlist inclusion influences daily streams, and (2) the carryover effect—how much of the lift in streams is retained after delisting. Figure 2 presents patterns for 34 additional songs listed on and removed from the “Hot Country” playlist. The thin gray lines show individual songs, and the thick black line indicates the average. Songs consistently show an increase in daily streams after being listed, although the magnitude of the effect varies. After delisting, there is a sharp decline, but average streams remain around 60,000—higher than the prelisting level of 40,000. Some songs return to baseline, while others maintain elevated demand. In summary, the model-free evidence from Figure 2 not only shows a positive relationship between playlist inclusion (our key independent variable) and streaming demand (our key dependent variable) but also substantial heterogeneity in the listing and carryover effects.
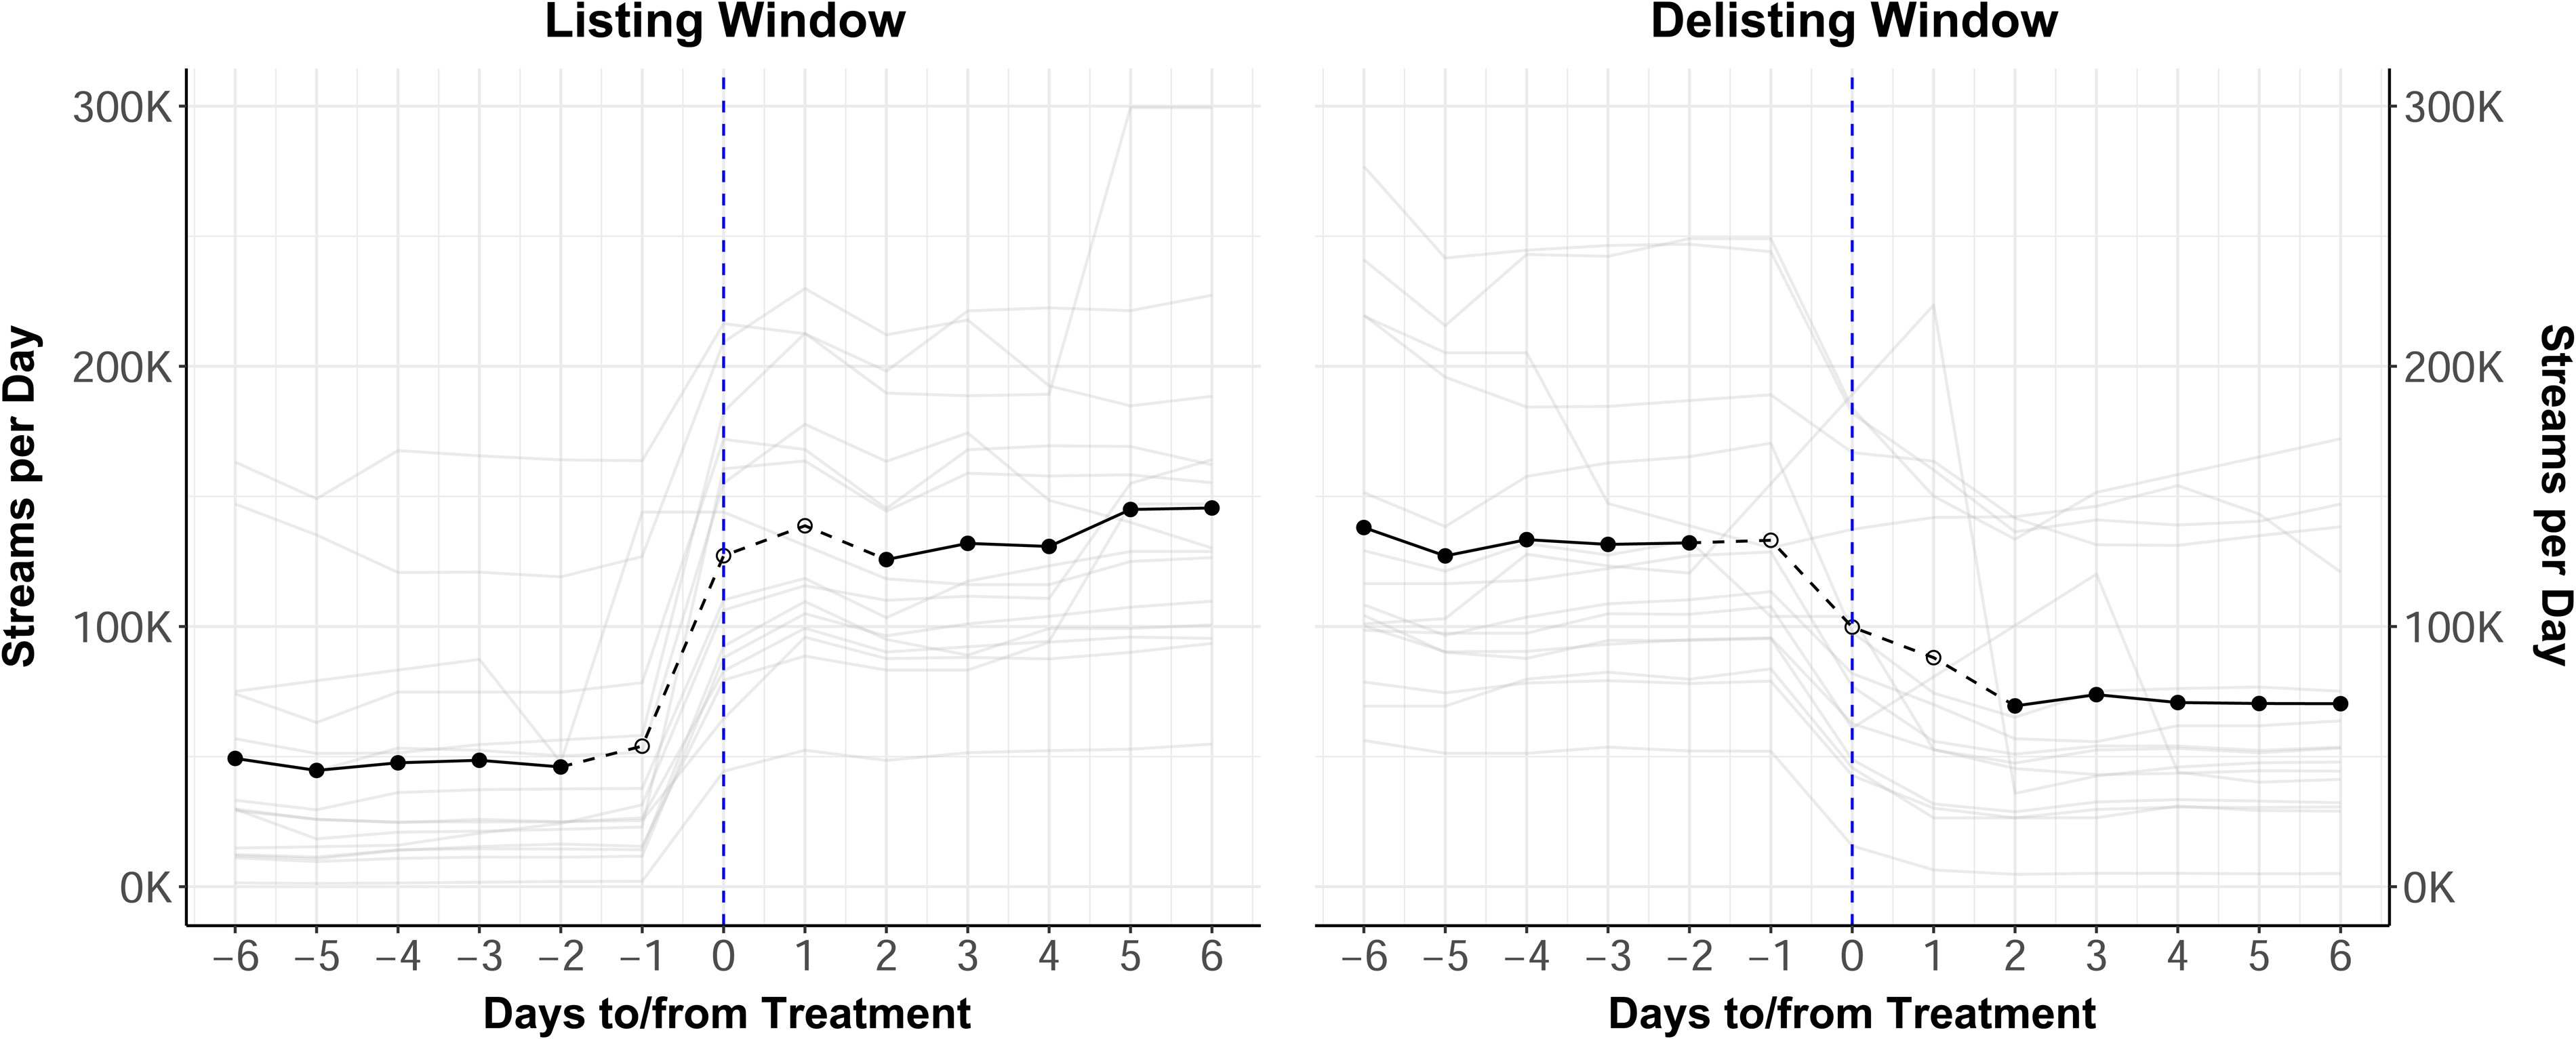
Model-Free Evidence: “Hot Country” Playlist (7.6 million followers).
Conceptual Framework
We first discuss the theoretical expectations for the main effect of playlists on streaming demand before we discuss the expectations regarding the heterogeneity in the effect.
Playlists and Streaming Demand
Digital platforms for access-based consumption may offer millions of options. On Spotify, for example, approximately 120,000 new songs are added every day (Ingham 2023). This makes it very difficult for consumers to discover and pick songs that they like. Playlists can make it easier for consumers to navigate these millions of options, providing opportunities for discovery. The starting point is that the curator of a playlist (which may be the music label, the platform, or a third party) decides to add a song to their playlist. The effect of interest is the additional number of streams a song receives that it would not have received if it had not been included.
Many users subscribe to playlists to make their lives easier and to listen to whatever unknown or known content is offered by the playlist(s) they follow. Thus, when a song is listed on a playlist (this is our focal treatment), it is exposed to playlist followers who may listen to the song during the listing period, leading to a lift in streams, which we define as the listing effect. Importantly, however, if a song appears on a playlist, this does not automatically lead to additional streams for the song in the same period compared with the situation where the song is not on the playlist. That is, an additional stream only happens if a follower listens to the playlist and if the listening session is long enough for the playlist to reach and play the focal song. Thus, the listing effect of playlist inclusion on demand during listing is not a given.
Listening to the song may lead the user to discover it, appreciate it, and adopt it (i.e., the song may become part of the user's internal repertoire or personal playlist, such that the user continues to listen to it even after the song has been delisted from the playlist). We define this as the carryover effect, which is a potentially important secondary role that playlists play, implying that being included on a playlist can be beneficial for a song's demand after it is delisted.
Heterogeneity in Listing and Carryover Effects
Our focal interest is the heterogeneity in the playlist's effect on streaming demand during listing (listing effect) and after delisting (carryover effect). The conceptual framework (Figure 3) visualizes how playlist design characteristics, organized in four groups, explain the heterogeneity in these effects. These four groups capture (1) exposure on the focal playlist, (2) exposure and support elsewhere, (3) fluency of playlist consumption experience, and (4) how the playlist is curated by whom and for how long the song stays on it.
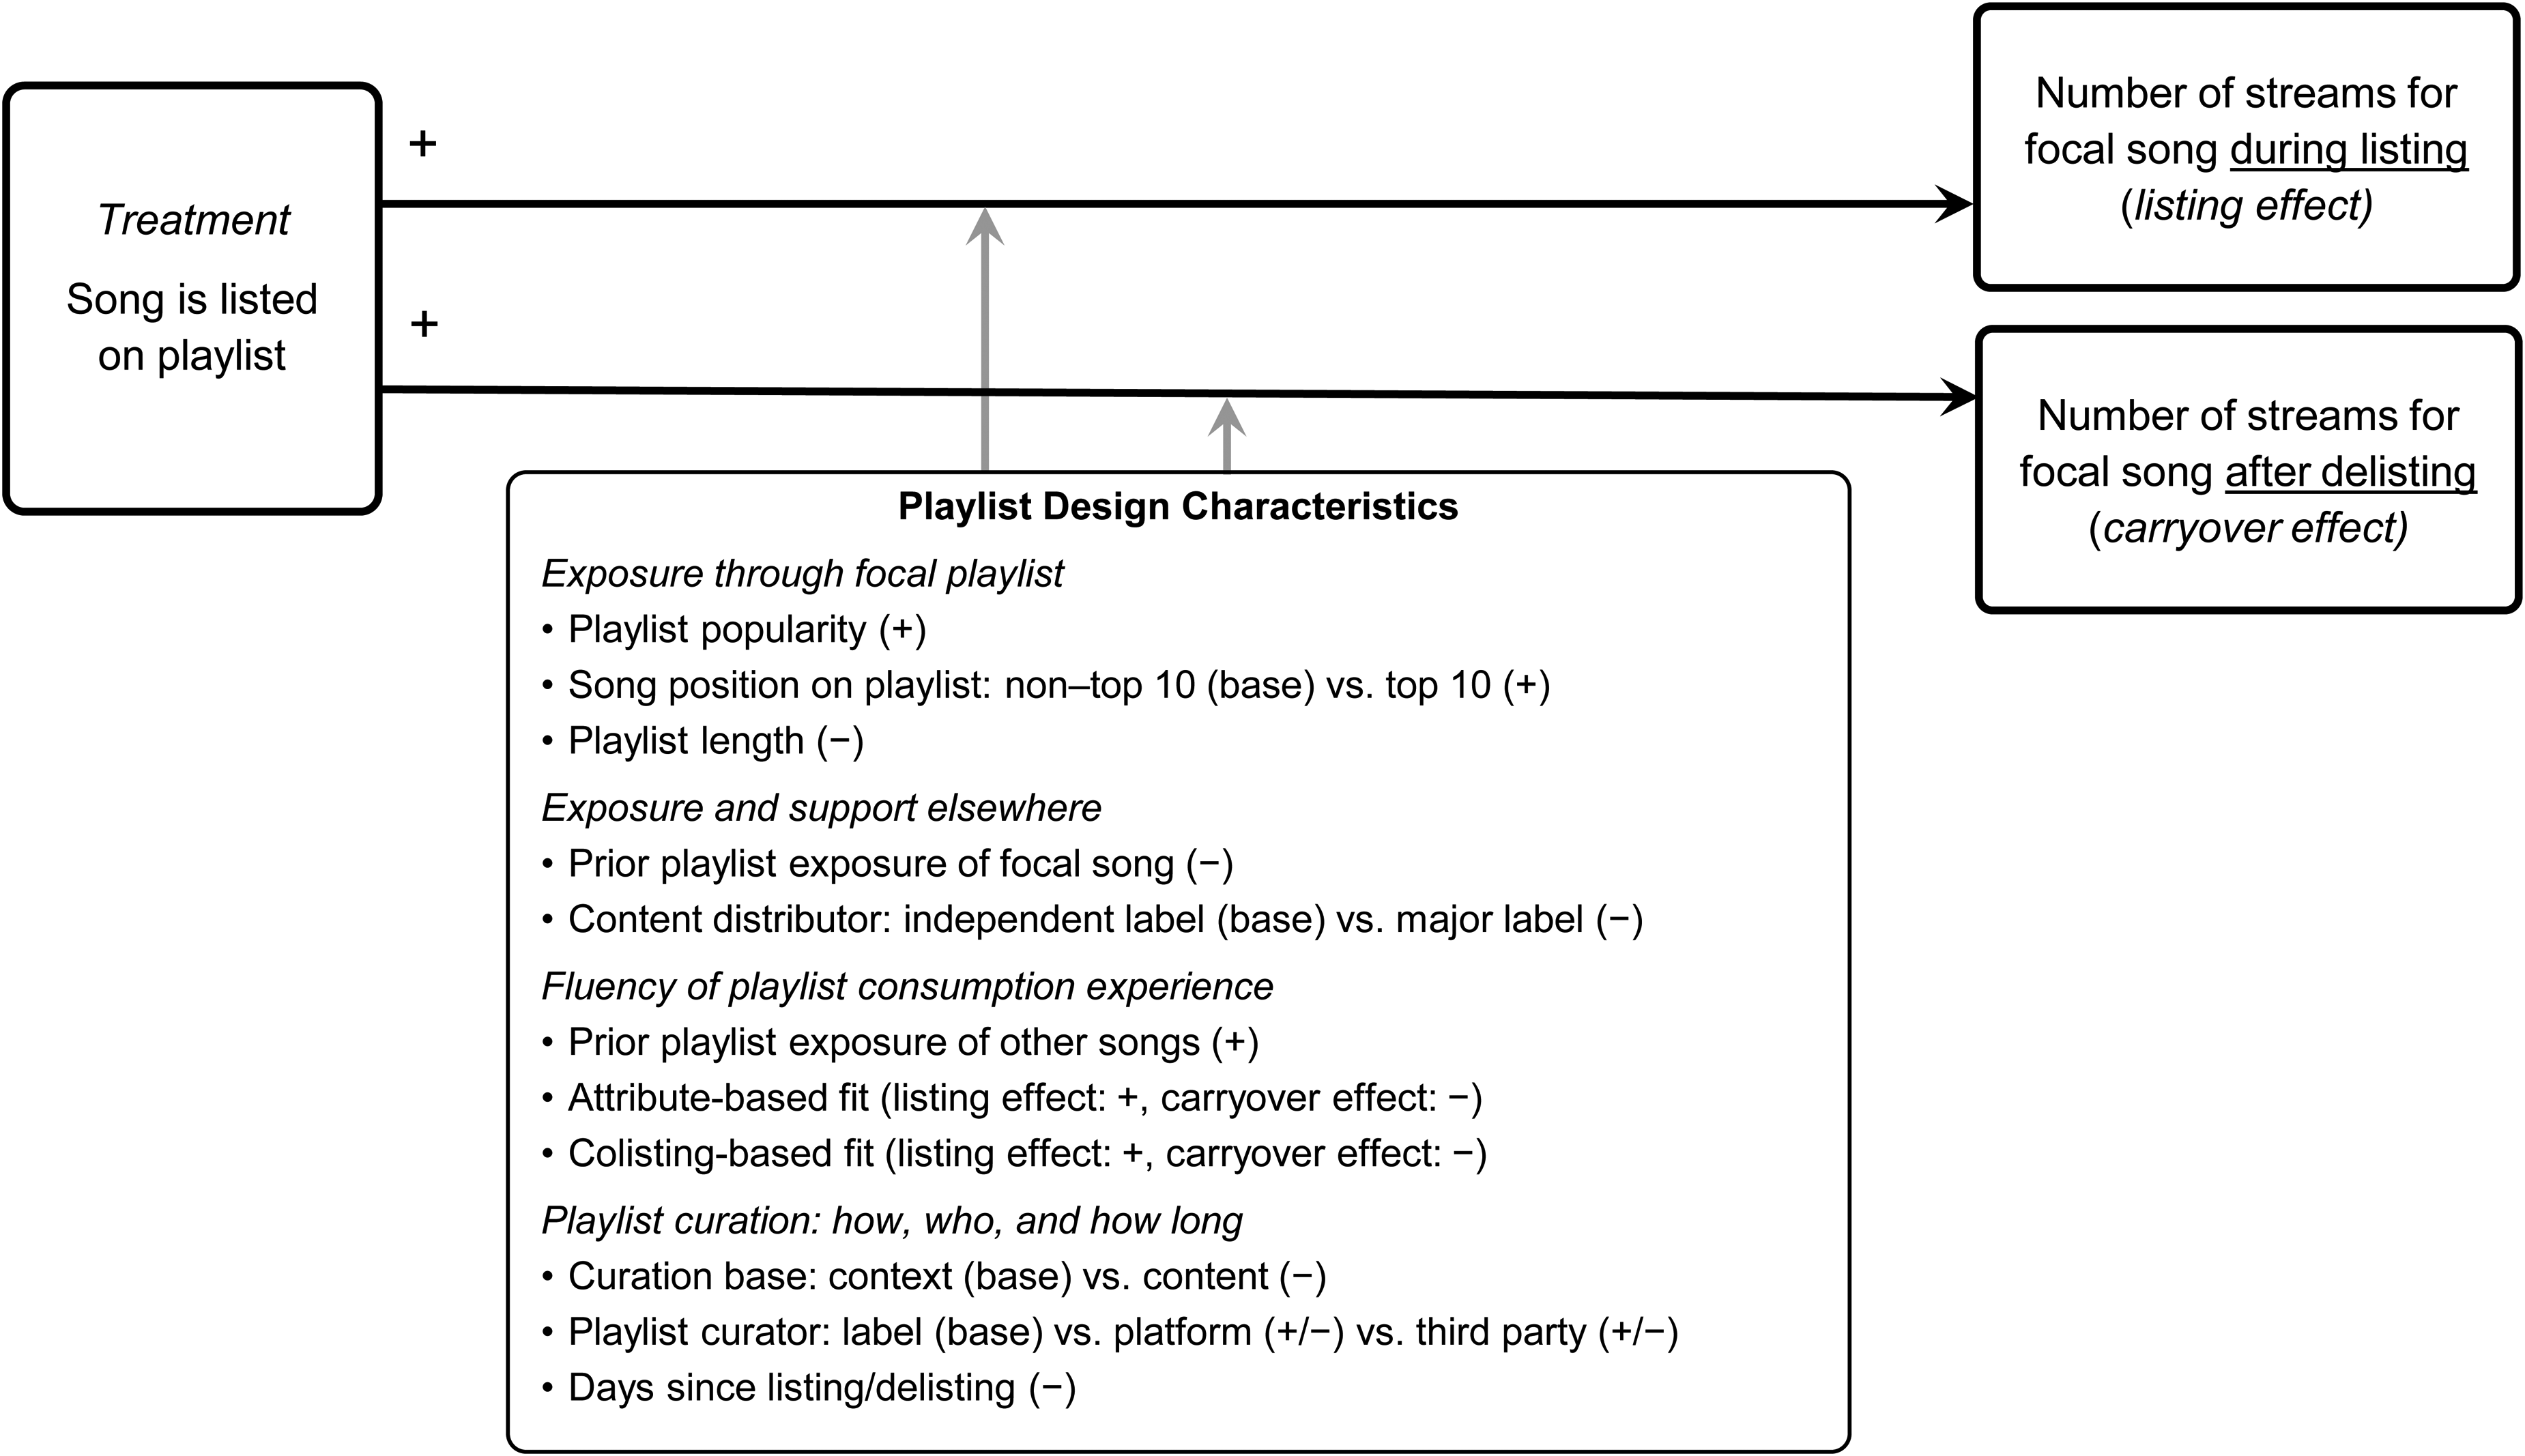
Conceptual Framework.
Exposure through focal playlist
As discussed, it is not a given that a consumer will actually encounter and consume a song that is featured on a playlist. The first group of characteristics therefore considers three key factors that are related to the exposure that a playlist creates and that affect the likelihood that consumers will listen to a song once it is included on a playlist. First and foremost, while many popular public playlists have thousands, if not millions, of followers, other playlists have a much smaller follower base. A follower is defined as a subscriber to the playlist, which means that the playlist appears prominently on their home screen of the music app. The more popular a playlist is, the more potential users are exposed to the focal song that has been added to the playlist. Analogous to how influencer follower size enhances influencer effectiveness (Leung et al. 2022), we expect that the playlist popularity amplifies the number of streams a song receives during listing (listing effect) as well as the number of streams after delisting (carryover effect).
The second characteristic is song position. If a consumer listens to a playlist that includes the focal song, it does not necessarily follow that she will encounter this song on the playlist. It is more likely that a song is consumed on a playlist if it is listed near the top of the playlist (i.e., top 10) than near the bottom. Even though some consumers play content on playlists in random order through shuffle play, others do not. As a result, we expect stronger listing and carryover effects for songs that are among the first ten songs of a playlist. This reasoning aligns with industry recommendations (e.g., SchniTunes, 2022) and traditional retailing, where the shelf location of an item significantly impacts its sales (e.g., Drèze, Hoch, and Purk 1994). Relatedly, when the playlist is long (i.e., large number of songs), a user is less likely to be exposed to the focal song due to the sheer volume of other tracks. Similar to how more influencer posts dilute their individual effectiveness (Leung et al. 2022), we expect weaker listing and carryover effects for longer playlists.
Exposure and support elsewhere
This group of characteristics is related to the exposure and support a song receives elsewhere. We expect that songs will benefit more from discovery via playlists if consumers are less familiar with the song from previous encounters (Hendricks and Sorensen 2009). As such, we posit that songs with higher prior playlist exposure will have less uplift in streams during the listing (listing effect) and after delisting (carryover effect). Similarly, we expect that major labels continue to have better means of making their content known to relevant audiences, which is why we expect that independent labels will benefit more from placements of their songs on playlists.
Fluency of playlist consumption experience
The third group of playlist design characteristics relates to the smoothness or fluency of the consumption experience. We propose that listeners will particularly enjoy those playlist listings that enable a smooth listening experience, a notion captured by processing fluency (Reber, Schwarz, and Winkielman 2004). Following this notion, prior playlist exposure of the other songs on the playlist increases listener familiarity, which will likely raise fluency. This fluency generates positive affect and improves memory encoding, amplifying both listing-period streams and postdelisting carryover. Processing fluency is also strengthened by the listing's attribute-based fit, which is the extent to which the songs on the focal playlists match the focal song in terms of musical style. Viewed through the lens of recommender systems, including songs on a playlist with a high attribute-based fit is akin to content-based filtering (André et al. 2009), where objects with matching features are grouped. Because such playlist listings are easier to process, listeners require less cognitive effort, which in turn creates positive affect (Reber, Schwarz, and Winkielman 2004). However, very high fluency reduces the element of novelty or surprise and hence the likelihood of serendipitous discovery, which thus weakens carryover (André et al. 2009; Kim et al. 2021). Hence, we expect that a playlist listing has stronger listing effects when attribute-based fit is high; however, in contrast, the carryover effect will be weaker if attribute-based fit is high, as this fit comes at the cost of serendipitous discovery.
Conceptually related yet distinct from attribute-based fit, colisting-based fit captures how expected the focal listing is based on prior co-occurrence patterns. Hence, while attribute-based fit assesses how similar a listed song is to the other songs on the playlist in terms of their musical style, colisting-based fit does not consider song characteristics but rather considers the extent to which the listed song has previously been colisted on other playlists with the songs that appear on the focal playlist. Attribute-based fit and colisting-based fit are not only conceptually distinct, but their empirical correlation in our data is even negative at −.109 (p = .000). Colisting-based fit can be viewed as a manifestation of collaborative filtering (André et al. 2009), where recommendations are based on what other users consume together, according to the joint context, rather than on the similarity of content. Songs that fit in terms of prior colistings entail expected sequences, which increases fluency, thus amplifying the listing effect (Reber, Schwarz, and Winkielman 2004) but diminishing carryover by reducing unexpected encounters (Kim et al. 2021). The latter prediction is consistent with the strength of weak ties argument, which suggests that less predictable mixtures foster novel discovery (Pyo, Lee, and Park 2022; Rajkumar et al. 2022).
Playlist curation: how, who, and how long
As to how the playlist is curated, we distinguish between context (vs. content) curation. Content-based playlists are organized around musical attributes, e.g., artist names (e.g., “This Is Ed Sheeran”) or genres (e.g., “Classic Rock”). In contrast, context-based playlists focus on primary user activities or situational contexts, for example, a playlist for running, cleaning, or songs to play in the car (Boughanmi and Ansari 2021). From a theoretical standpoint, context-based playlists align with goal-directed consumer behavior and situational needs (Belk 1975), supporting repeated use and habit formation (Wood and Neal 2007). Context-based playlists are often associated with (1) prolonged engagement (e.g., studying for hours), which strengthens the listing effect, and (2) recurring listening occasions (e.g., daily runs), which strengthens the carryover effect. Accordingly, we expect that including a song on context (rather than content-based) playlists results in stronger effects both during the listing period and after delisting.
As to the identity of the playlist curator, we distinguish between the artists’ label (base), the streaming platform, or a third-party curator. As mentioned previously, music labels manage their own playlists primarily featuring music by their artists under contract (e.g., songs owned by Universal Music on playlists belonging to their “Digster” brand), with the obvious commercial intent of increasing the number of streams for their songs. Given this incentive alignment (e.g., Bergen, Dutta, and Walker 1992; Eisenhardt 1989) and the commercial nous of music labels, we expect that songs listed on playlists curated by the artist's own label will exhibit stronger listing and carryover effects compared with those curated by third parties. Streaming platforms (e.g., Spotify) also have a commercial intent in their playlist curation, but their goal is not necessarily to boost individual song performance, but rather to maximize overall user engagement and retention. Because their objective function is broader and potentially independent of the success of any single track, we do not formulate an expectation about whether platform-curated playlists have more or less effective listing and carryover effects than third-party-curated playlists. We do note that platform-curated playlists tend to have more followers than most other playlists and may therefore be more effective overall. We account for this by controlling for playlist popularity in our conceptual and empirical model. We also expect the listing and carryover effects to change over time, likely declining as time passes. To account for this temporal decay, we adjust for the number of days since the song was listed or delisted, respectively.
Data
Sample
We study the global music streaming market across more than three years, from June 2021 to July 2024, using data from Soundcharts, which tracks daily global streams per song on Spotify, the industry's largest platform. We combine these daily song-level streaming data with daily data on all relevant Spotify playlists, obtained from a cooperation partner. The relevant playlists for our study are public (accessible to all users) and human-curated (not algorithmically generated). 2 To focus on playlists with relevant reach, we rank them by follower count and select the playlists cumulatively representing 90% of all playlist followers, resulting in 134,137 playlists. These playlists span a diverse set of content selections, from major playlists with millions of followers (e.g., Today's Top Hits: 35 million followers, RapCaviar: 16 million followers, Viva Latino: 15 million followers) to smaller niche playlists (e.g., Blues Piano Legends: 41,000 followers, Haryanvi Workout: 21,100 followers, Sunday Morning: 6,000 followers). For the playlists in our sample, we observe daily snapshots akin to Figure 1, Panel A, which provide details about the songs listed, their positions, and metadata, such as the curator, playlist title, and follower count.
Empirical Strategy
Using the playlist data, we construct quasi-experiments by tracking songs as they are listed on and delisted from playlists. The focal treatments are (1) the inclusion of song i on a given playlist on day t0 and (2) its delisting from the same playlist at a later moment in time on day t1 (on average 88 days later).
Quasi-experiments
To identify the effect of playlist listing and delisting on demand, we leverage quasi-experimental variation from when a song is added to a playlist and later removed. Specifically, we construct a dataset of quasi-experiments by identifying, for each song, events where it is listed on a single playlist and later delisted from the same playlist (at least six days later). By concentrating on narrow windows of six days before and after the listing (delisting) at time t0 (at time t1), we reduce the risk of extraneous events influencing song demand. We chose six days as the window length because many playlists are updated every week.
We focus on periods where no other major playlist listings or delistings occur for the focal song in the six days before and after these events to isolate the effect of the focal playlist. Given the vast number of playlists (tens of thousands), it is common for a song to experience minor listings or delistings on small playlists. Hence, we include only those quasi-experiments where the change in the number of other playlist followers is less than 10% compared with the focal playlist. For example, suppose a song is listed on a playlist with 10,000 followers. In that case, we only retain the quasi-experiment if the aggregate number of additional playlist followers due to other playlist listings in the same period is less than 1,000. Our analysis also controls for the number of other playlist followers. A check (reported in a subsequent section) shows robust results when reducing this noise level from 10% to 5% and 0%.
In total, we identify 200,455 quasi-experiments where we observe both the listing and delisting of a specific song on a specific playlist. These quasi-experiments comprise 152,576 unique treated songs by 82,348 unique artists that are listed on 23,721 unique playlists. 3 Our sample includes a diverse selection of songs spanning 24 genres, both new releases and older tracks, by artists ranging from global superstars like Taylor Swift, Eminem, Ed Sheeran, and Beyoncé to emerging and lesser-known artists. Table 2 shows descriptive statistics, and correlations are in Web Appendix B. The focal dependent variable is the number of streams for a given song i on day t. On average, a song receives approximately 15,000 streams per day.
Variable Overview.
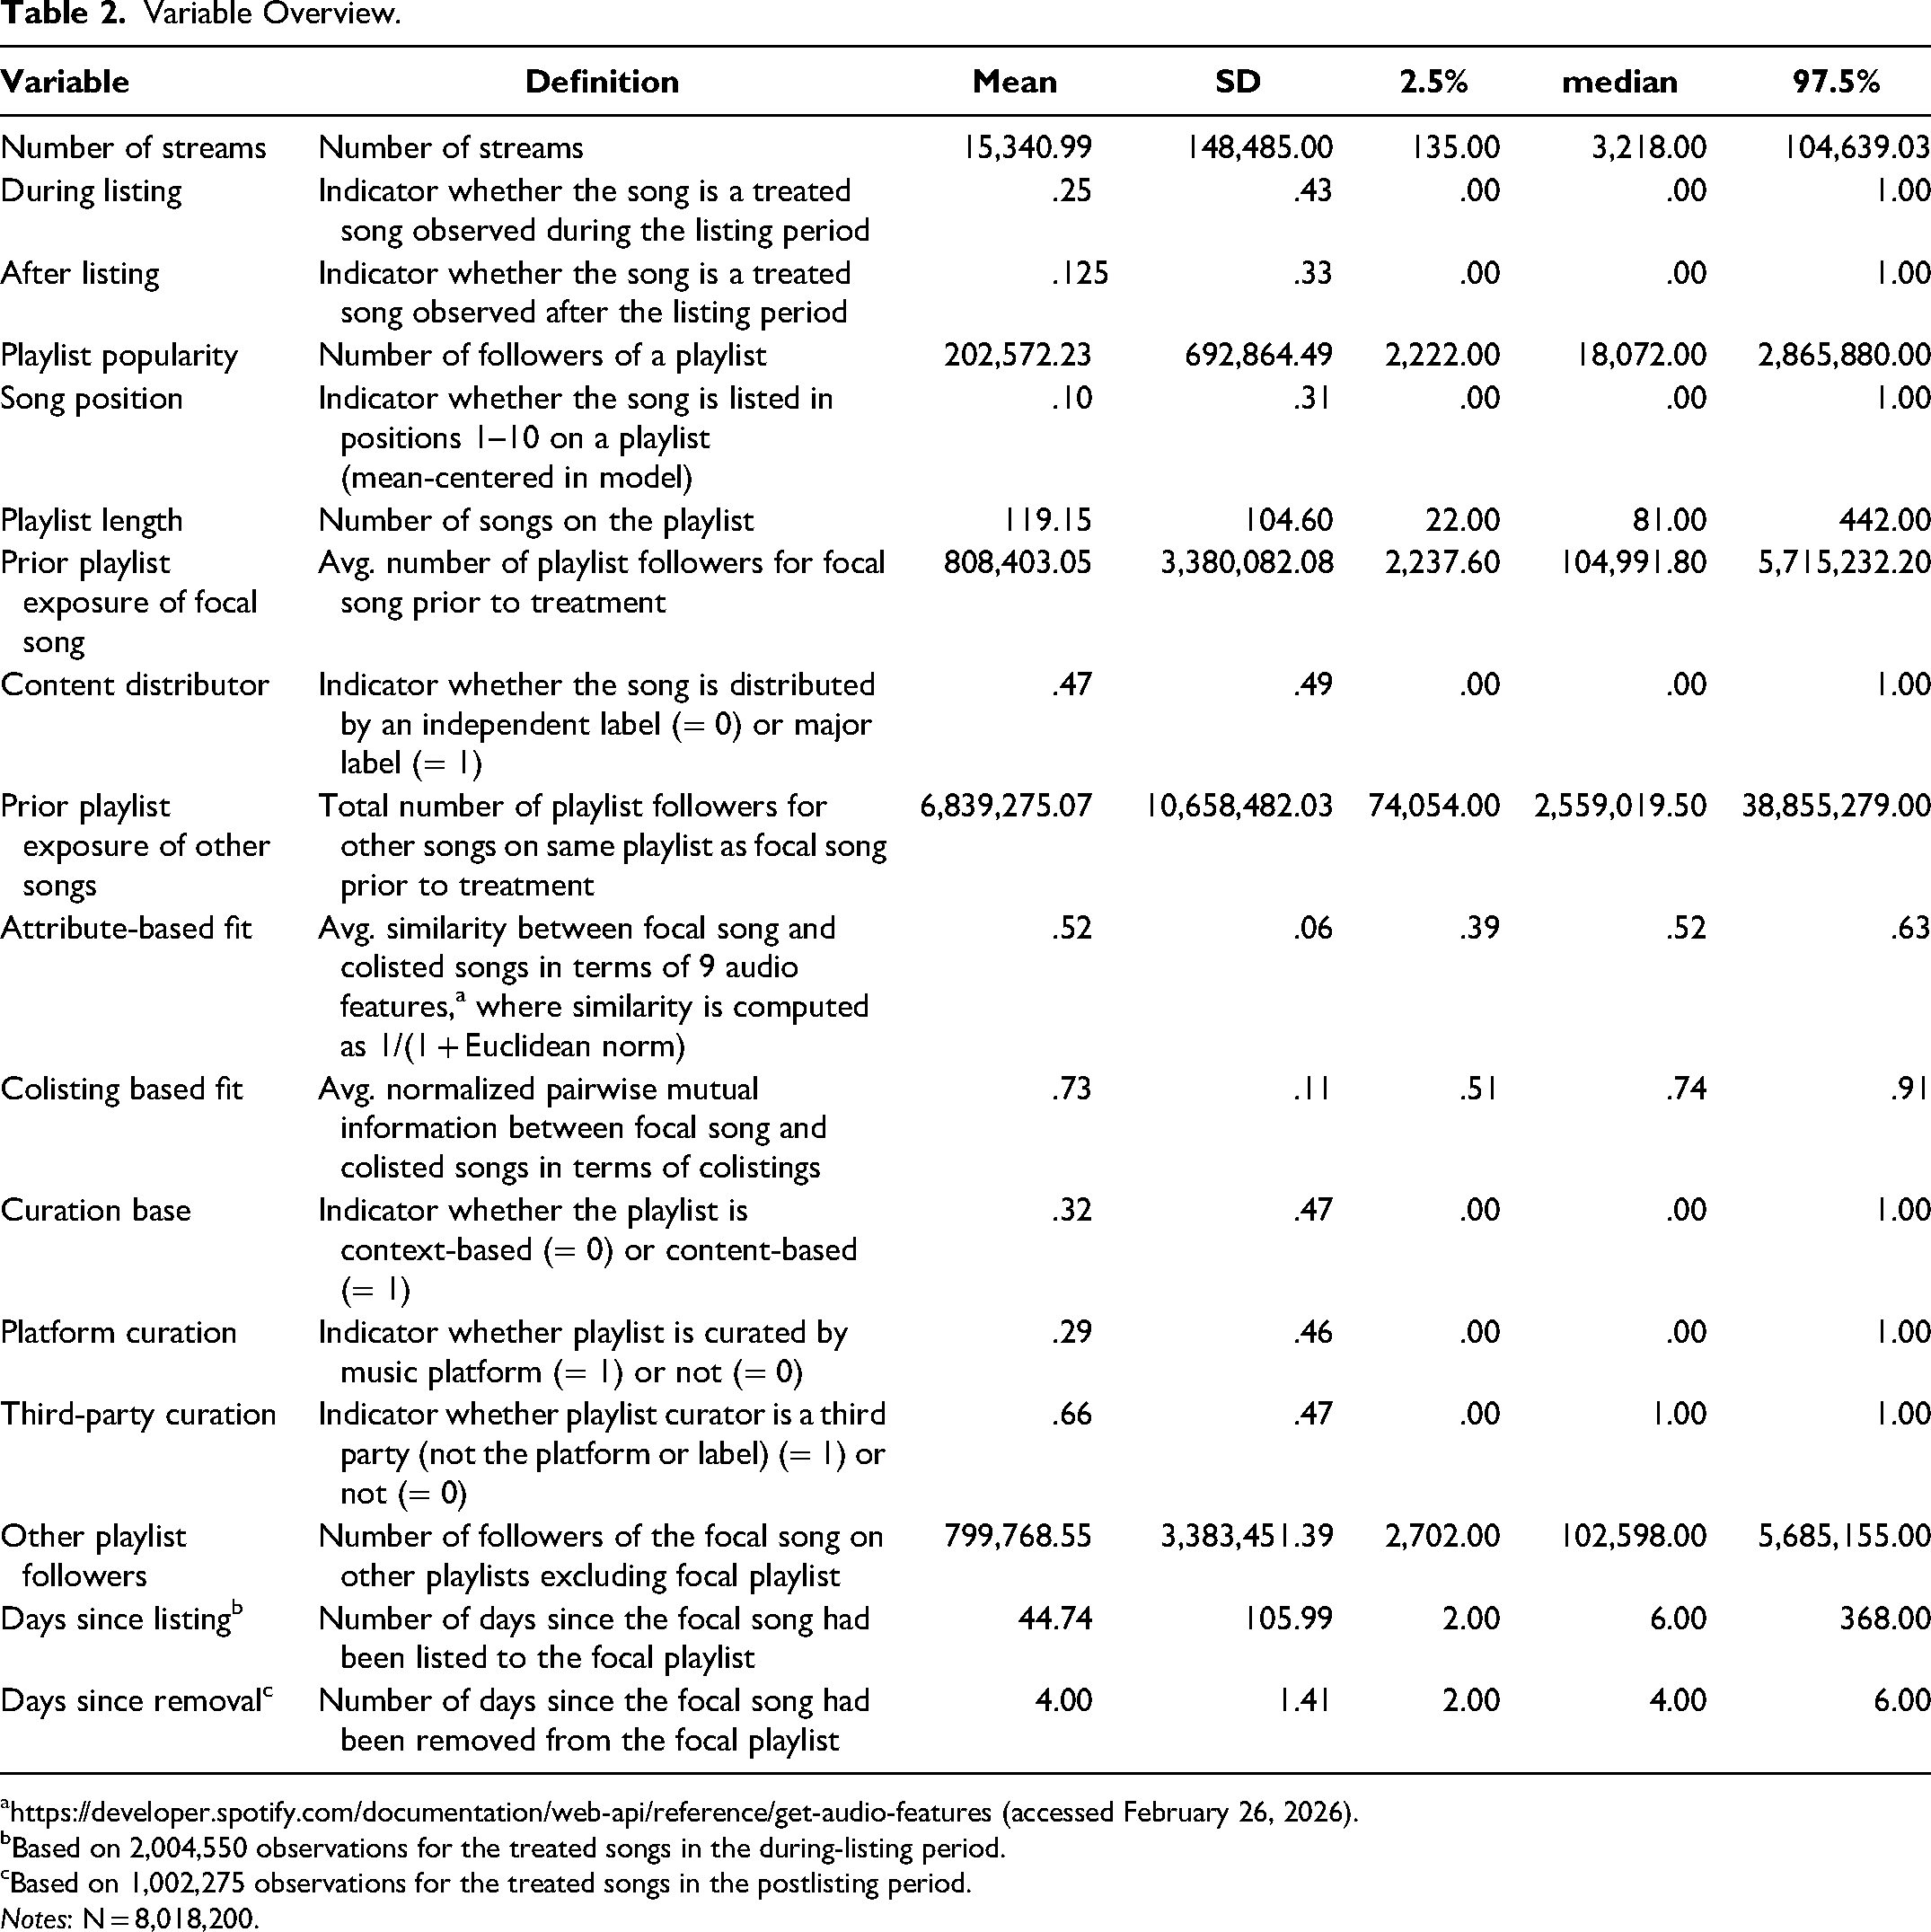
https://developer.spotify.com/documentation/web-api/reference/get-audio-features (accessed February 26, 2026).
Based on 2,004,550 observations for the treated songs in the during-listing period.
Based on 1,002,275 observations for the treated songs in the postlisting period.
Notes: N = 8,018,200.
Control songs
For each listing quasi-experiment at time t0, we find a control song that matches the treatment song as closely as possible. To mitigate potential violations of the stable unit treatment value assumption, which requires that treatment effects on one unit do not impact control units, the control song should (1) not experience any listing or delisting, (2) not be by the same artist, and (3) not be colisted with the treated song on other playlists at the time of listing. Jointly, these three measures strongly reduce the risk of indirect treatment effects (Goldfarb, Tucker, and Wang 2022; Pachali and Datta 2025). To ensure a basic level of comparability, we select all potential control songs satisfying conditions 1–3 that were listed on one of the playlists from our sample for a total period of at least one year and that were added to and removed from one of the playlists at least once during the observation period. This results in a pool of 1,156,706 potential control songs. From this pool, we initially select for each quasi-experiment 100 potential controls that—at the beginning of the quasi-experimental time window at day t0 − 6— share the same age as the treatment song, 4 belong to the same genre (using 24 predefined genres provided by the data source), and have a similar playlist follower count (i.e., within the same quintile). We then augment the initial pool of 100 control songs by adding other controls considered in other quasi-experiments taking place at t0, in order to increase the likelihood of finding a good match. From this pool of control songs, we conduct one-to-one matching by selecting the control song most similar to the treatment song based on (1) the pretreatment streaming demand separately on days t0 − 6, …, t0 − 1, and (2) the relative daily changes of streams between t0 − 6 and t0 − 1 to ensure parallel trends. Specifically, for each listing period at t0, we calculate the Euclidean distance between the treatment song and each potential control song using matching criteria 1 and 2. We select the control song with the lowest Euclidean distance for each window. To further enhance parallel trends prior to treatment, we exclude 1% of quasi-experiments with the highest root mean square error in the pretreatment streams, as these quasi-experiments may not have sufficiently similar trends prior to treatment. As we will discuss in more detail, this approach is effective in selecting control songs that show very similar demand patterns prior to treatment, suggesting that the parallel-trend assumption is plausible.
We proceed in the same way to find the (potentially different) control song for the delisting at time t1. The only difference is that we now consider 100 potential control songs that are eligible at the focal delisting event at time t1 (i.e., at the point in time when the song was removed from the playlist). Next, we proceed in the same way as for the listing event to arrive at the single-best matching control song. Web Appendix C shows that the matching was successful in terms of balancing the covariates of the treated and control songs.
Figure 4 shows a stylized example where the treated and control songs both had 40,000 daily streams before treatment, and the control song stayed at 40,000. Listing raises the treated song to 80,000 streams (lift = 40,000). After delisting, it settles at 60,000, so the carryover is 20,000 (60,000 − 40,000).
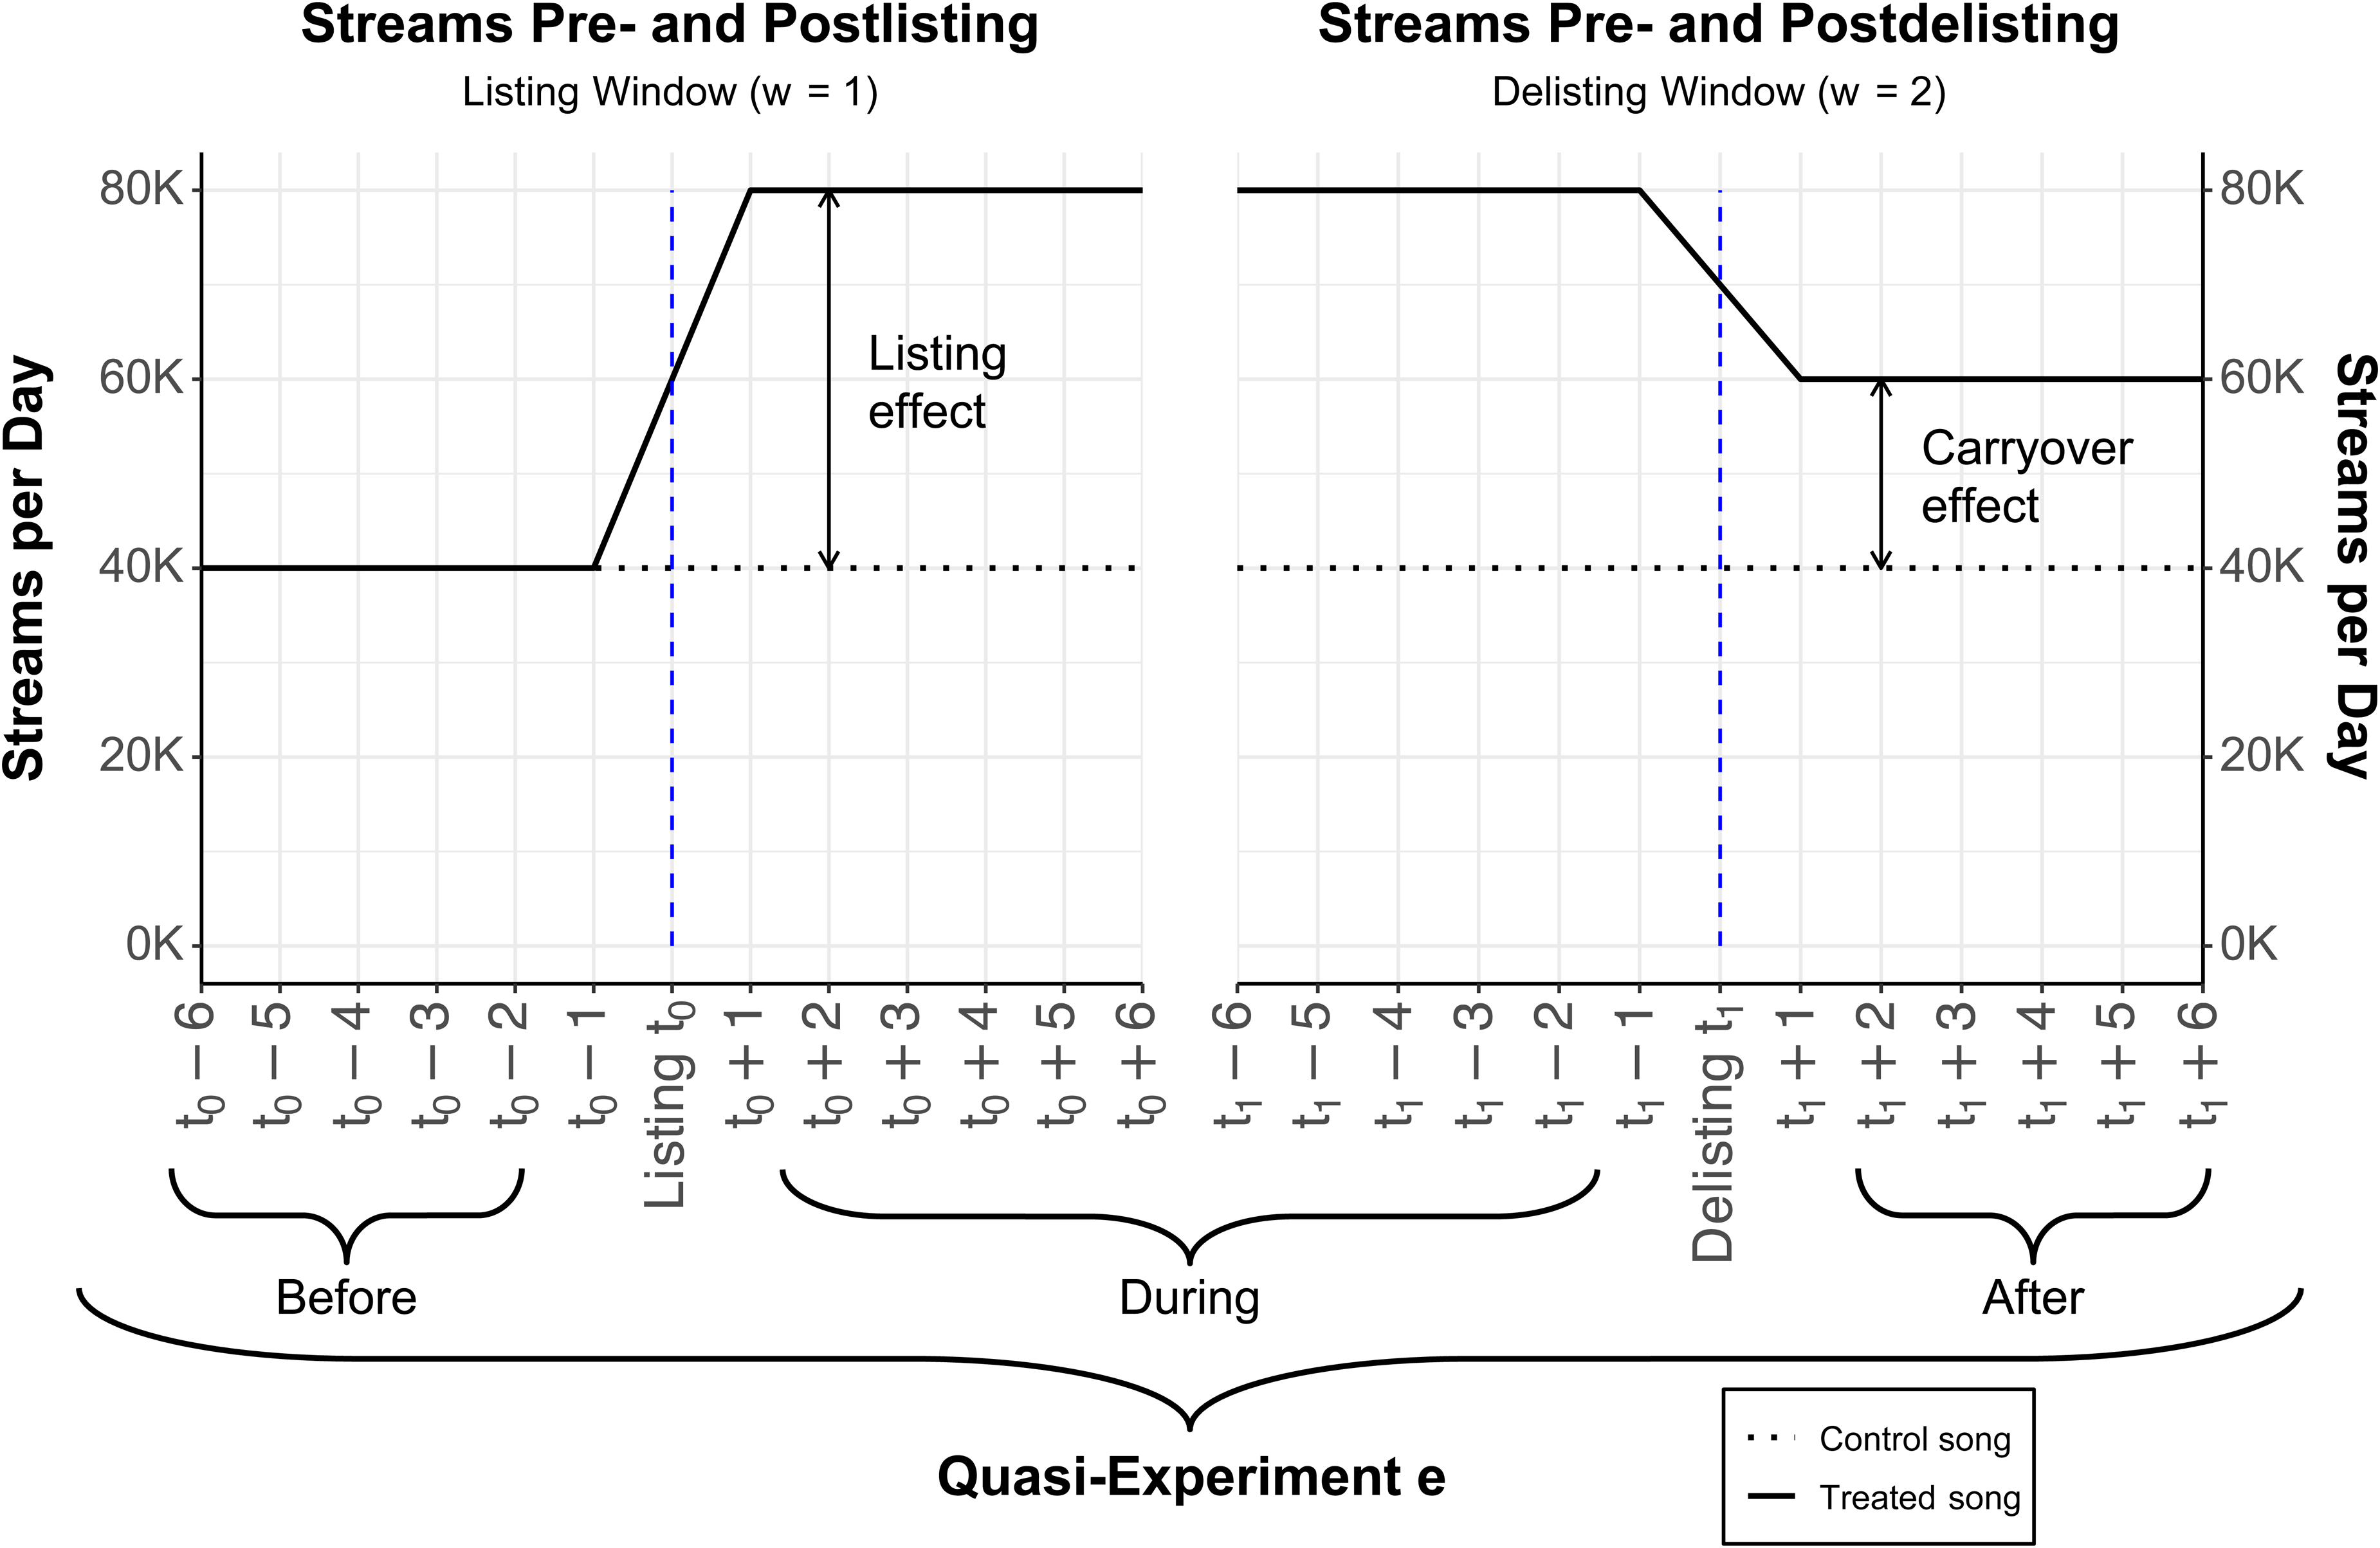
Stylized Example of Listing and Carryover Effects Due to Playlist (De)Listing.
Stacking the quasi-experiments
To estimate the listing effect across the quasi-experiments, we employ a DiD estimator. Treatment songs are listed on the focal playlist at t0, while control songs remain constant in their playlist listings (no listing or delisting). We observe songs over a 13-day window (t0 − 6, t0 + 6) surrounding the listing day t0. To capture the delisting effect, we add a second 13-day quasi-experimental window (t1 − 6, t1 + 6) surrounding the day t1 when the same treatment song i is delisted from the same playlist.
Each quasi-experiment e involves a treatment song i being listed on a playlist (and later delisted) and its corresponding control songs i′ (for listing) and i″ (for delisting). We stack their daily streaming observations from t0 − 6, …, t0 − 2; t0 + 2, …, t0 + 6; t1 − 6, …, t1 − 2; and t1 + 2, …, t1 + 6, where we exclude the listing day t0 and delisting day t1 (as well as the two days adjacent to the treatment days), as these are transition days between listing statuses. Each quasi-experiment thus contributes a total of 40 observations to the dataset (i.e., 2 songs [treatment and control] × 10 days [listing window] + 2 songs × 10 days [delisting window]). Stacking the 40 observations per quasi-experiment across 200,455 quasi-experiments results in 40 × 200,455 = 8,018,200 observations.
DiD model
The dependent variable (number of streams per song per day) is highly skewed, as is typical in entertainment markets, where a small number of superstars often accounts for a disproportionate share of demand (Hennig-Thurau and Houston 2019). In the analyses, we take logarithms to account for the skewed distribution. To estimate the listing effect, we use a DiD model with a dummy variable DuringListinget that equals 1 when a song is listed on a given playlist—specifically, during the last five days of window w = 1 (t0 + 2, …, t0 + 6) and the first five days of window w = 2 (t1 − 6, …, t1 − 2). To estimate the carryover effect, we introduce a dummy variable 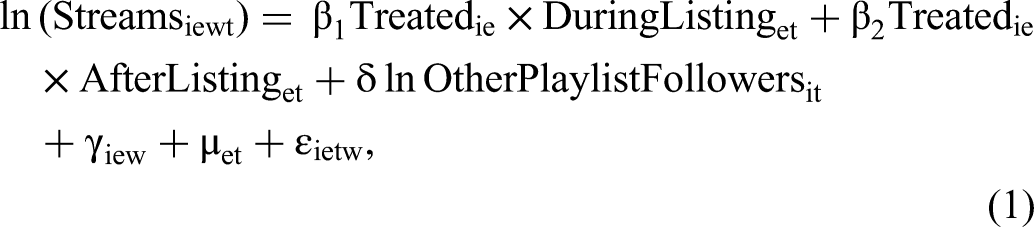
Model 1 uses a rich set of fixed effects. γiew is a fixed effect for song i (treatment or control), quasi-experiment e, and time window w (listing window or delisting window; see Figure 4). This fixed effect takes care of any unobserved differences between songs, between the two windows (listing and delisting) for the same song, and between quasi-experiments (e.g., a song may be listed and delisted on the same playlist in two quasi-experiments at different moments in the three-year observation period). For each quasi-experiment, there are four fixed effects γiew: For the listing window (w = 1), there is a fixed effect for treatment song i and control song i′, and for the delisting window (w = 2), there is a separate fixed effect for treatment song i and control song i″. Across all 200,455 quasi-experiments, there are 4 × 200,455 = 801,820 of these fixed effects.
These song/quasi-experiment/window fixed effects account for song- and window-specific unobservables, such as a potential surge in song popularity due to social media, promotional efforts, or publicity. We note that this fixed effect does not absorb an unobserved demand shock that occurs exactly on the same day as the playlist listing. For example, on a given day t, a song is played on a popular TV show, which may lead to more playlist listings on that same day but also to more demand, creating a potential confound for measuring the causal effect of the playlist listing on demand. However, the way we construct the sample is such that we only select those cases where a song is added to just a single playlist in the time window. If a confounding event happens, such as a song being played in a TV show, it is implausible that just one of the 23,721 playlists in our sample would include the song in the same window. It is far more likely that at least several playlists do the same to capitalize on the sudden rise in popularity of the song; in this case, the quasi-experiment is not included in our sample. Thus, restricting the sample to cases where songs are added to a single playlist in the time window strongly reduces the risk of an unobserved demand shock.
μet is a fixed effect for quasi-experiment e and day t of the quasi-experiment, accounting for unobserved day-specific events that (throughout the quasi-experiment) may affect both the treatment and control song. These fixed effects are quasi-experiment-specific, which allows for the possibility that different quasi-experiments (that may take place at the same moment in time) are differentially affected by unobserved time effects. For a given quasi-experiment, there are 20 μet fixed effects, for a total of 20 × 200,455 = 4,009,100 fixed effects.
This specification allows us to interpret β1 as the listing effect due to the listing of treatment song i on a given playlist, which is the average treatment effect on the treated (ATT). It captures the difference in streams for this song during the listing period compared with the prelisting period, controlling for the trajectory over this period for the control song and any systematic differences in streaming levels between the treatment song and control song in the listing/delisting windows (through fixed effects γiew). Similarly, β2 represents the carryover effect (also ATT), capturing the difference between prelisting streams and postdelisting streaming levels after the song is removed from the playlist, again controlling for the control song's trajectory and any systematic level differences. In Web Appendix D, we provide numerical examples that show how this specification recovers the effects of interest.
Assumptions underlying the DiD approach
The validity of our DiD approach relies on the assumption of unconfoundedness, which implies that, conditional on observed covariates, the assignment of treatment is effectively random. This assumption ensures that posttreatment differences can be attributed to the treatment rather than preexisting differences. To strengthen comparability, as explained, we match control songs with treated songs based on similar characteristics, including release date, playlist follower count, and pretreatment demand levels. A necessary requirement in this context is that we can reasonably assume that treated and control songs would have behaved similarly in the absence of treatment. To increase confidence in this untestable assumption, it is common to assess the trends of treated and control units prior to treatment, and we should generally expect that treated and control units behave similarly prior to treatment. To assess the parallel pretreatment trends, we apply a dynamic DiD model by interacting the treatment dummy with period-specific dummy variables (see, e.g., Cunningham 2021, section 9.4.3). This analysis, conducted separately for the listing and delisting windows, shows a very close alignment between treated and control songs during the pretreatment period and estimated treatment effects in the pretreatment period that are essentially zero (Figure 5).
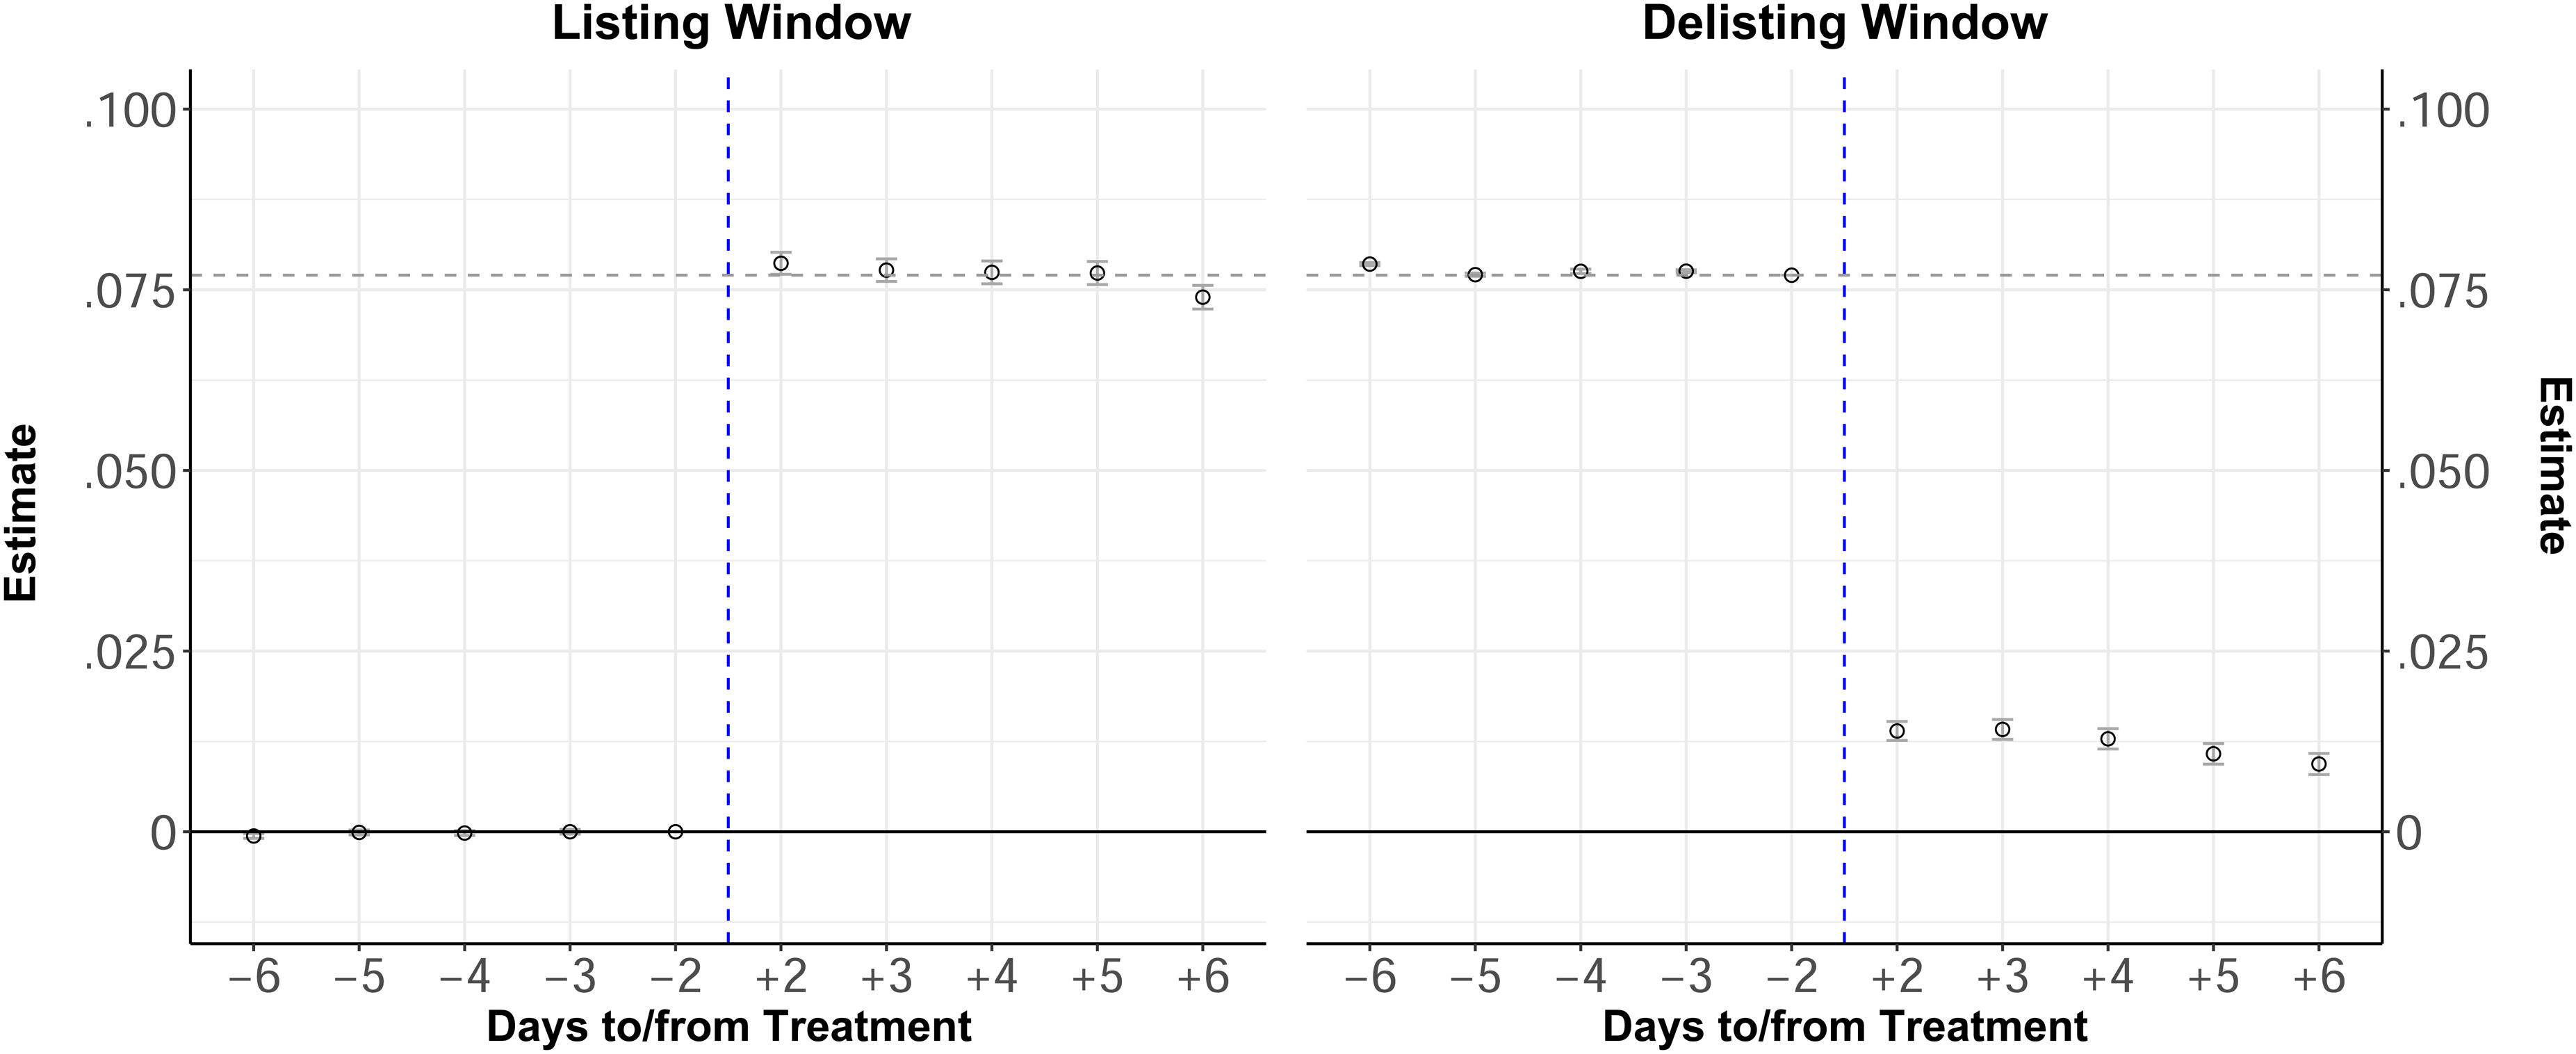
Daily Treatment Effects During Listing and Delisting Windows.
This provides strong support for the plausibility of the parallel trend assumption and makes it unlikely that the results arise due to deviations from the parallel-trend assumption (Goldfarb, Tucker, and Wang 2022). This is also confirmed by placebo tests, which show insignificant treatment effects using a placebo treatment in the pretreatment periods of the listing and delisting windows (see Web Appendix E).
Results
Overall Playlist Effectiveness
Table 3, Model M1, shows the results of estimating Equation 1 across the entire data set.
Model Estimation Results for M1 Without Interactions and M2 with Interactions.
Notes: Standard errors are clustered at the song–quasi-experiment–window level; interaction variables are grand mean-centered, except DaysSinceListing and DaysSinceDelisting. p-values are reported to three decimal places; as a result, very small p-values may appear as .000, even though they are never exactly zero.
We find a listing effect of β1 = .077 and a carryover effect of β2 = .012. The more complete Model M2 that includes interaction effects reports a listing effect of β1 = .082 and a carryover effect β2 = .039. These effects are log multipliers, implying that during listing the number of streams goes up by (exp(.082) − 1) × 100% = 8.5%, whereas after listing it goes up by 4.0% (=(exp(.039) − 1) × 100%). Dividing β2 by (β1 + β2) implies that a sizable 32% of the listing effect carryover after the song has been delisted, suggesting that playlists facilitate music discovery.
Heterogeneity in Playlist Effectiveness
We next investigate heterogeneity in playlist effectiveness. We note that for all continuous playlist design characteristics, we use logs in the analysis.
Operationalization of playlist design characteristics
Our measure for playlist popularity is the number of followers observed at the time of listing. We measure song position on the playlist as a dummy for whether a song is among the playlist's first 10 songs. Playlist length is the number of songs on the focal playlist.
We measure the focal song's prior playlist exposure as the average number of playlist followers during the pretreatment period, while the prior playlist exposure of the other songs on the playlist is the total number of playlist followers for these songs during the pretreatment period. We use distributor information to classify songs as either major or independent label (base) releases. We base our measurement of attribute-based fit on audio features provided by Spotify that describe the musical style of each song across nine dimensions, such as valence or danceability, 6 and calculate the average over all pairwise similarities between the focal song and the songs colisted on the same playlist on the day a song is added to the playlist.
To measure a listing's colisting-based fit, we capture to what extent a song is frequently colisted with other songs that are featured on the focal playlist (i.e., the normalized pairwise mutual information (NPMI; Archak, Ghose, and Ipeirotis 2011):
A context-based playlist is curated according to a specific context (e.g., workout, driving), whereas content-based curation is based on content-based criteria, such as genres, rankings, or artist names. We utilize a large language model to classify each playlist and prompt OpenAI's API (model version gpt-4o-mini-2024-07-18) with a definition of the different playlist types and examples. We then record the category assigned to each playlist from the API's response. The exact prompt can be found in Web Appendix G.
We can directly observe which playlists are curated by the platform (Spotify) itself. We identify curator names that either contain the names of music labels (e.g., Universal, Kontor, Empire, Sony, Warner) or playlist brand names of the corresponding music labels (e.g., Digster, Filtr, Topsify) to code whether the focal song is on a playlist curated by the artist's own label. Since our primary focus is on how labels can utilize playlists to influence demand for their artists, we use own label-curated as the base category. Third-party curators are any curators who are not the platform or the focal artist's label.
Expanded DiD model
To study the heterogeneity in listing effects, we expand the stacked DiD model:
Estimates
Table 3, Model M2, shows the results of estimating Equation 3. Figure 6 shows the effect sizes by plotting the listing and carryover effects across different quintiles of the characteristics (average across the bottom 20%, across the next 20% bin, etc.). Columns 1 and 2 in Figure 6 show the variation in the listing effect (i.e., the interactions between the characteristics and the during-listing dummy), while Columns 3 and 4 show the variation in the carryover effect (i.e., the interactions between the characteristics and the after-listing dummy).
Heterogeneity in Marginal Effects on Streaming Demand Ordered from Most to Least Heterogeneous Listing Effect.
Effect size calculation
The effect sizes in Figure 6 are the uplifts in streams in response to an additional playlist listing. To illustrate the calculation, we use the playlist popularity (highest quintile) as an example. We set the value of the characteristic (playlist popularity in the example) to the mean of the highest quintile, fix all other variables at their mean and dummy variables at their base levels, 8 and calculate the implied playlist effect (log multiplier) as βm = β1 + θmMm,Q5. Here, β1 (= .082; Table 3) is the direct effect estimate for a playlist listing on demand, θm is the estimate for the effect of playlist popularity on the listing effect (= .039; Table 3) and Mm,Q5 is the mean playlist follower count (mean-centered log-values) in the highest (fifth) quintile (= 2.929). The resulting log multiplier is .082 + .039 × 2.929 = .196. We then convert the log multiplier to a percentage change: 100% × (eβm − 1) = 100% × (e.196 − 1) = 21.6%, corresponding to the Q5 (quintile 5) result in the top left graph of Figure 6. We repeat the same procedure for all characteristics to obtain Figure 6. We order the playlist design characteristics by most to least heterogeneous effects, based on the summed absolute changes in listing and carryover effects across moderator values (see Table 4).
Effect Sizes and Revenue Impact Across Varying Playlist Design Characteristics.
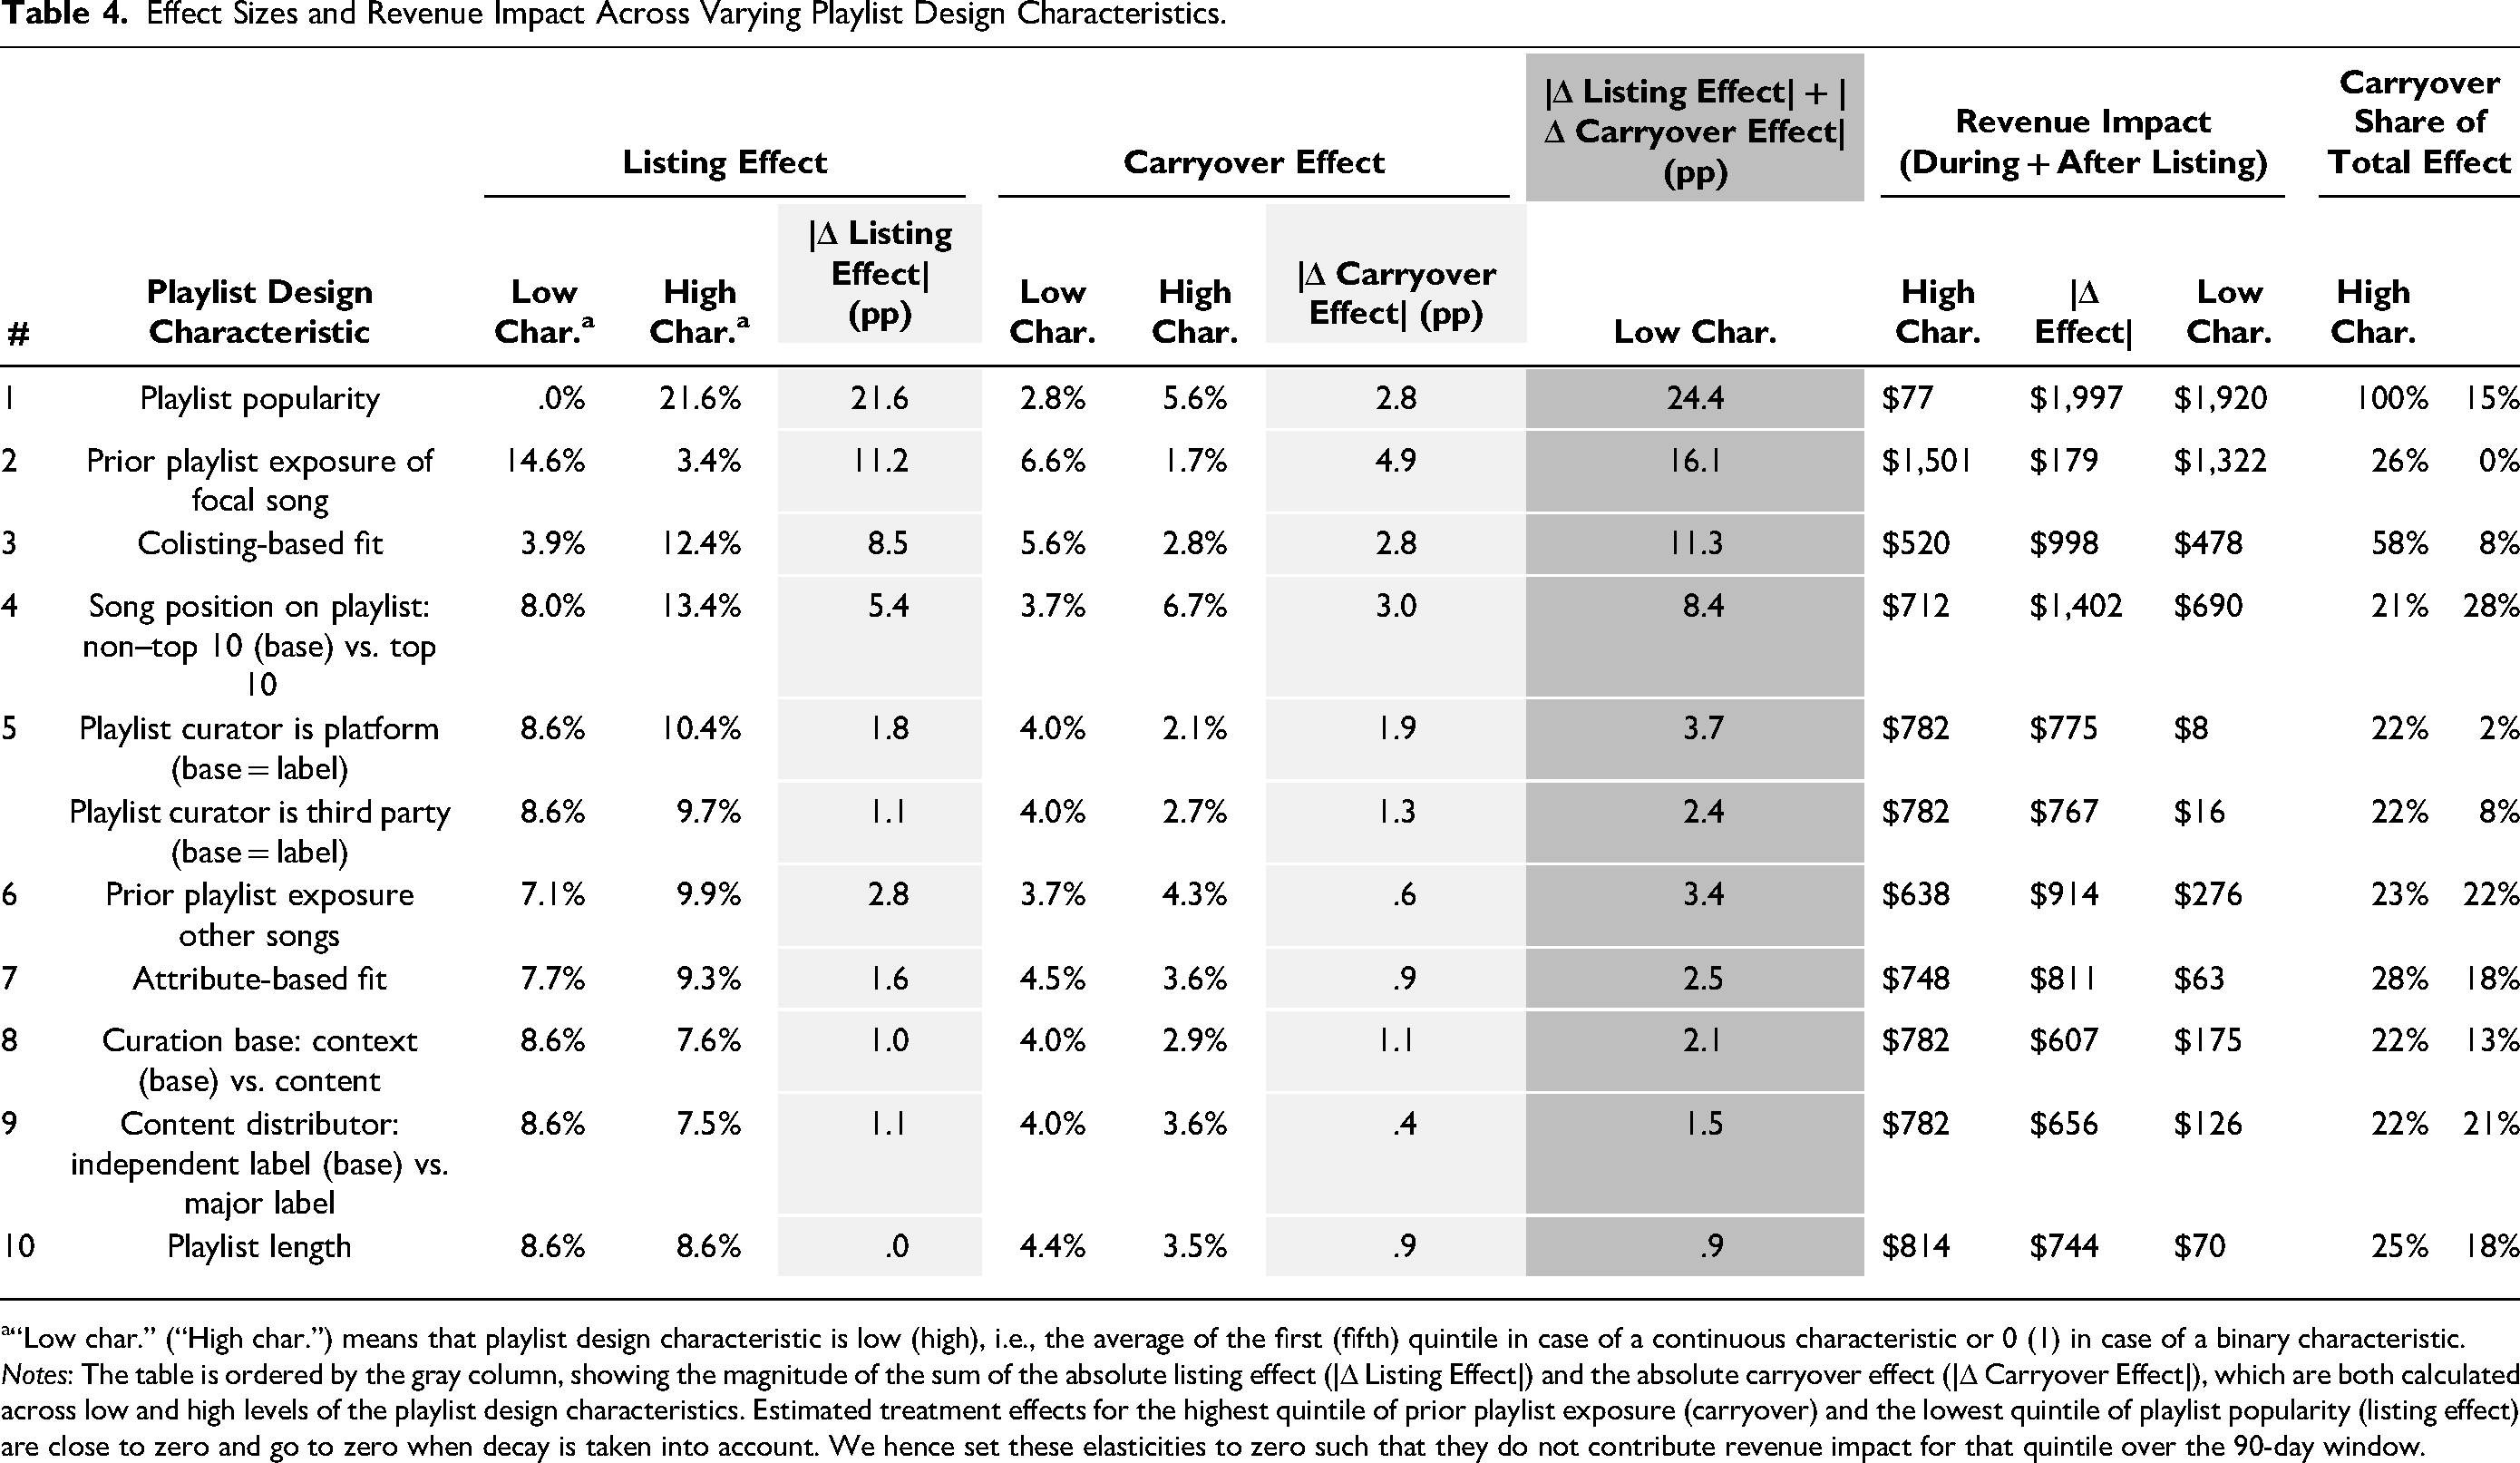
“Low char.” (“High char.”) means that playlist design characteristic is low (high), i.e., the average of the first (fifth) quintile in case of a continuous characteristic or 0 (1) in case of a binary characteristic.
Notes: The table is ordered by the gray column, showing the magnitude of the sum of the absolute listing effect (|Δ Listing Effect|) and the absolute carryover effect (|Δ Carryover Effect|), which are both calculated across low and high levels of the playlist design characteristics. Estimated treatment effects for the highest quintile of prior playlist exposure (carryover) and the lowest quintile of playlist popularity (listing effect) are close to zero and go to zero when decay is taken into account. We hence set these elasticities to zero such that they do not contribute revenue impact for that quintile over the 90-day window.
Figure 6 shows substantial heterogeneity in the playlist effects. The estimation results show that we find the strongest (#1) heterogeneity in the effects for playlist popularity. While for large playlists (top 20% follower count), the listing effect yields a 21.6% increase in streams, for small playlists (bottom 20% follower count), the listing effect is zero (.0%). The carryover effect varies from 5.6% for the most popular playlists to 2.8% for the least popular playlists.
We find the next-strongest (#2) heterogeneity in effect sizes for a song's prior playlist exposure, where the uplift is inversely related to prior exposure. For the listing effect, the uplift for songs with the highest prior exposure (+3.4%; Figure 6) is much weaker than the uplift experienced by songs with the least prior exposure (+14.6%). The carryover effect is quite weak (+1.7%) for the songs with the highest prior exposure (top quintile) and 6.6% for the least-exposed songs in the lowest quintile (Figure 6). These results align with the notion that songs with less prior exposure benefit relatively much more from being discovered. 9
We distinguish between two types of fit between a song and the playlist on which it appears. As shown in Figure 6, colisting-based fit (#3) and attribute-based fit (#7) both enhance the uplift during the listing period, but the effect is much stronger for colisting-based fit (and third-most heterogeneous overall). Songs in the top quintile of colisting-based fit see a +12.4% increase in streams, compared with +3.9% in the bottom quintile. In contrast, colisting-based fit has a negative relationship with the carryover effect: Songs with lower colisting-based fit show more persistent streaming after removal. Specifically, the carryover effect is twice as large for songs with the lowest fit (+5.6%) compared with those with the highest fit (+2.8%). This pattern suggests greater discovery of unfamiliar content when a song's presence on a playlist is less expected based on prior colistings. A similar directional pattern emerges for attribute-based fit, though the heterogeneity in effect sizes is weaker (#7 out of 10) than for colisting-based fit (#3 out of 10).
The #4 characteristic in heterogeneity is related to the song's position on the playlist. The listing effect is stronger for songs in a top 10 position (13.4%) compared with non–top 10 positions (8.0%), and a similar finding holds for the carryover effect (6.7% vs. 3.7%). This suggests that songs listed among the top 10 on a playlist experience greater uplift in streaming demand, both during listing and after delisting. Hence, although playlists can be consumed in a random order (shuffle play), it pays off to be listed near the top of the playlist.
The playlist curator (#5) matters for the playlist effect. Even after adjusting for other factors, particularly playlist popularity, platform-curated playlists still create the largest lift during listing (+10.4%), compared with label curators (+8.6%) and other curators (+9.7%). In contrast, we find the largest carryover effect for label curators (+4.0%), followed by other curators (2.7%) and platform curators (2.1%). This finding suggests that while platforms may be able to curate playlists that users enjoy while listening (therefore boosting the lift in stream for a song listed on such playlists), labels are better at curating playlists that facilitate discovery and thus create stronger carryover effects.
On the next rung down in terms of heterogeneity (#6) is the prior exposure of other songs on the playlist. Specifically, the listing effect increases from 7.1% to 9.9% and the carryover effect increases from 3.7% to 4.3% when moving from the lowest to the highest quintile of prior exposure of other songs. Thus, the focal song benefits from being colisted with well-known other songs.
The #8 playlist design characteristic is the curation base. Listings on playlists that are curated according to a specific context (e.g., running, commuting), rather than content-based criteria (e.g., genre, decade of release), create a higher uplift in demand both in the short run as well as in the long run when a song has been delisted from a playlist. While the difference in the listing effect is relatively modest (+8.6% for context-based and +7.6% for content-based curation), the carryover effects are somewhat more pronounced for context-based (+4.0%) compared with content-based curation (+2.9%). Thus, context-based curation enables more potential for discovery.
We find that the content distributor (#9) plays a role as well, with independent labels having stronger listing (+8.6%) and carryover effects (+4.0%) than major labels (+7.5% and +3.6%, respectively). This result aligns with the notion that, since independent labels have fewer means than major labels to promote their artists outside streaming platforms, playlists offer a stronger demand uplift for independent labels, both during and after the listing.
Playlist length (#10) has no impact on the listing effect (8.6% throughout), carryover effects decrease from 4.4% for the shortest playlists to 3.5% for the longest playlists. Thus, longer playlists inhibit discovery somewhat, as manifested in weaker carryover effects.
We discuss the decay parameters subsequently. All in all, we find strong statistical support for the theory-based predictions of the playlist design characteristics that explain heterogeneity in listing and carryover effects. Next, we investigate the revenue implications of the findings.
Revenue Implications
To convert the percentage uplifts shown in Figure 6 into monetary values, we use the model estimates and allow treatment effects to decay over time. We calculate the total revenue impact per quintile Q of each playlist design characteristic m as follows: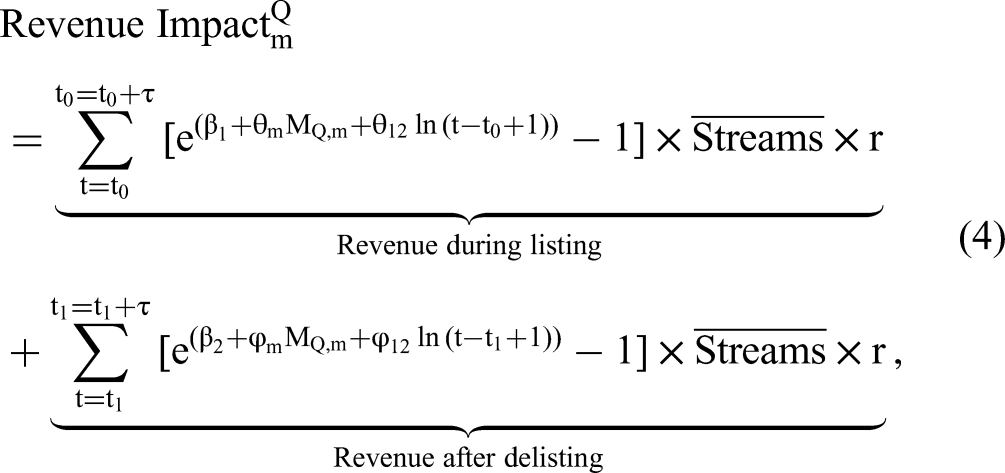
Table 4's “Listing Effect” and “Carryover Effect” columns reproduce the percentage uplifts from Figure 6. The dark gray column shows the sum of the absolute changes in listing and carryover effects in percentage points (pp) between the low vs. high values of the playlist design characteristics. The “Revenue Impact” columns translate these values into changes in monetary compensation for the artist for each playlist design characteristic. The last two columns show the share of the total revenue impact that is attributable to the carryover effect.
Again, two characteristics stand out: playlist popularity and prior playlist exposure. All else equal, listings on a top-quintile playlist yield a revenue impact of $1,997 versus $77 for a bottom-quintile playlist. Similarly, songs with low prior exposure see a strong impact of $1,501 resulting from a playlist listing, compared with just $179 for songs with high levels of prior exposure. The next-strongest revenue impact can be achieved by a top 10 (vs. lower) position on the playlist ($1,402 vs. $712) and by high (vs. low) colisting-based fit ($998 vs. $520).
Across all playlist design characteristics, the average monetary impact is approximately $609 during the listing period and $174 during the delisting period. Although these figures may appear modest in isolation, the average track generates about $8,284 over a 90-day listing period. Thus, the listing impact (accounting for the decay in the listing effect) corresponds to roughly 7% of baseline revenue. The carryover adds about 2.1% over the subsequent 90 days (accounting for the decay in the carryover effect), which amounts to a share of the total effect of 22% that is attributable to carryover. Given that an artist typically has many tracks, placement on prominent playlists can yield substantial aggregate returns. Moreover, not all playlist listings are equivalent: The most effective placements can produce revenue uplifts many times larger than those of the least effective. Finally, the absolute monetary effect depends on baseline streaming levels. Our calculation uses average daily streams (∼15,000); a track with a much higher baseline (e.g., daily streams in the millions) would experience a proportionally larger absolute revenue increase.
Table 4 also shows that the carryover share of the total effect varies meaningfully across levels of the playlist design characteristics. It is particularly high for the least popular playlists where the entire effect comes from carryover, and for songs with low colisting-based fit (58%), suggesting stronger discovery effects in these cases. In contrast, playlists curated by platforms show a very low carryover share (2%), possibly reflecting a focus on maximizing engagement within the current session rather than facilitating future discovery. Similarly, for songs with high prior exposure the share of the carryover is essentially zero, suggesting that discovery plays no role here.
Robustness Checks
Sensitivity analyses
We conduct several sensitivity analyses regarding decisions related to the composition of our estimation sample. We compare the resulting estimates to those of our focal model M2 regarding the listing and carryover effects (β1 = .082, p = .000; β2 = .039, p = .000). A summary table can be found in Web Appendix H. First, one potential concern is that our quasi-experiments allow additional playlist listings as long as their joint follower count is below 10% of the focal playlist's count (and we control for this “noise” via a follower-count covariate). We reestimate the model using stricter criteria for selecting eligible quasi-experiments by lowering this threshold to 5% and 0% and obtain very similar estimates (5%: β1 = .085, p = .000; β2 = .040, p = .000; 0%: β1 = .095, p = .000; β2 = .047, p = .000), see Models MH.1 and MH.2 in Table WH.1.
Another analysis choice we made is to exclude the transition days directly adjacent to the treatment days. We estimate an alternative model where these days are included and find that the focal coefficients are very similar to our main model (β1 = .080, p = .000; β2 = .049, p = .000), as seen in Model MH.3 in Table WH.1.
To address the concern that our findings are skewed toward songs that are frequently (de)listed on playlists, we test the sensitivity of our results to repeated treatment of the same song. Specifically, we estimate models using subsamples that include (1) only the first time a song is listed on a given playlist, (2) only the first time it is listed on any playlist, and (3) only songs that have been listed just once ever. While these restrictions substantially reduce the sample size (by nearly two-thirds in case 3 and disproportionately exclude more popular songs), the results remain highly robust, as shown in Models MH.4–MH.6 in Table WH.2.
Lastly, while our sample is representative of the commercially relevant playlists curated by Spotify, it underrepresents small third-party playlists with lower follower counts (Web Appendix A). We reestimate our model using weighted least squares (MH.7, Table WH.2), applying weights to match the full distribution of playlist follower counts, and obtain similar estimates (β1 = .086, p = .000; β2 = .037, p = .000).
Web Appendix H shows that the sign and magnitude of the interaction effects are largely consistent with those in our main model across all robustness tests. Thus, we conclude that our sample composition choices do not materially affect the key findings.
Decay in listing and carryover effects
Our primary analysis of the listing effect focuses on the first six days following a song's listing and the six days prior to its delisting. Based on the decay parameter estimate of θ12 = –.003 (p = .000), we find that even 90 days after listing (the average listing duration), 84% of the initial listing effect is retained (β1 + θ12 × ln(90days) = .082 − .003 × ln(90) = .069), and .069/.082 × 100% = 84%. We visualize the decay of treatment effects in Web Appendix I.
Our analysis of the carryover effect is restricted to the six days after delisting to ensure there are no confounding events. Based on this window, we estimate that 42% of the initial carryover effect is retained 90 days after delisting (Web Appendix I). However, it is not clear how the carryover effect evolves beyond this window—whether it further decays due to, for example, listener fatigue, forgetting, attention reallocation, or reduced novelty. To test the sensitivity of the carryover effect, we estimate our model with longer delisting windows of 13, 20, and 27 days. This analysis involves an inherent trade-off: Longer observation windows increase the risk of confounding events (e.g., additional listings or delistings for treatment or control units), shrinking the pool of valid treatment–control pairs available for comparison and skewing it toward less successful songs and smaller playlists (high-profile tracks are quickly relisted elsewhere). Thus, the sample size falls from 200,455 quasi-experiments at 6 days to 163,709 (13 days), 138,467 (20 days), and 120,175 (27 days), corresponding to reductions of 18%, 31%, and 40%, respectively. With this caveat, Table WI.1 (Web Appendix I) shows that both the carryover coefficient (β₂) and the decay parameter (φ12) are very similar, both rising moderately as the window lengthens, which is likely due to this restricted sample focusing on less successful songs and playlists. Even 27 days after removal, the net carryover remains positive (see Web Appendix I for details). We note that for all extended time windows, the interaction effects remain very similar to the focal window, providing additional evidence for the robustness of the findings.
Discussion
The digitization of information goods such as music, books, and video has changed the ways consumers find, consume, and pay for these goods. Whereas in the predigital era, consumers had to carefully consider their budgets given the relatively high prices of CDs, books, and videos, today's access-based subscription services such as Spotify and Netflix mean that consumers have access to virtually unlimited amounts of digital content at zero marginal cost.
For the producers of information goods, such as music artists, this new access-based business model comes with several challenges. One key challenge is that in the predigital era, producers (e.g., artists) were paid at the moment of purchase and did not have to worry about consumption, whereas nowadays, producer revenue is a function of how often digital content is consumed. For example, music artists only receive $.006 per stream and, hence, it is in their interest to promote (repeated) consumption, especially since streaming is by far the largest source of income in the recorded music industry. As physical distribution and traditional forms of promotion, such as price discounts, are not relevant in online platforms for access-based consumption, artists and music labels must find new ways to market their content to audiences.
Playlists have emerged as a marketing tool that helps consumers navigate abundant choice and serves as a promotional vehicle for content producers. Consequently, artists and their labels must understand which playlist listings are most likely to generate uplift in their streams. This article helps artists and their labels in identifying these most promising playlist design characteristics, to either curate playlists themselves (direct playlist marketing) or to pitch their songs to influential playlists (indirect playlist marketing).
To this end, we analyze a global music dataset with unprecedented coverage of both large and small playlists, as well as a wide range of more and less well-known songs. This allows us to examine (1) how playlist inclusion affects streaming demand during and after listing, and (2) how the listing and carryover effects vary with playlist design characteristics.
We find an average listing effect of 8.5%, which translates into an approximate playlist elasticity (% change in demand due to 1% more playlists) of 1.77. 11 This is a very effective marketing tool compared with advertising elasticity of .258 and a radio play elasticity of .224 documented for recorded music (Papies and Van Heerde 2017).
Based on our findings, three key themes emerge that relate to (1) the heterogeneity of playlist effectiveness, (2) the split between listing effects (short-term) and carryover effects (long-term), and (3) the dual role of colisting-based fit and attribute-based fit.
Theme 1: Playlist Effectiveness Is Far from Homogeneous
Several papers have studied questions in the music industry in general and streaming in particular (see Table 1). Our article contributes to this literature by being the first to systematically study the substantial heterogeneity in the effect of playlist listings. The current state of the literature regarding the effects of playlists on demand (i.e., Aguiar and Waldfogel 2021) shows very strong listing effects but could not investigate potential heterogeneity. Aguiar and Waldfogel (2021) is limited in scope in the sense that it only studies (1) the six largest playlists globally (representative for the top .02% of the playlists in our estimation sample), (2) platform-curated playlists, (3) content-based playlists, and (4) the top 200 songs (representative for the top .1% of the songs in our estimation sample). Our study extends Aguiar and Waldfogel (2021) in several important dimensions by empirically demonstrating that not all playlists are alike. Quite in contrast, the effectiveness of playlists in stimulating streaming demand varies strongly and predictably along several dimensions of heterogeneity, as can be seen in Figure 6 and Table 4. We regroup them in three key categories based on our findings.
The first category aligns with the exposure effect enabled by playlists. Unlike Aguiar and Waldfogel (2021), who study six playlists with the world's highest follower counts, we study more than 23,000 playlists varying widely in popularity and other playlist design characteristics. In line with the notion that playlists with fewer followers offer less exposure, we find considerably lower listing and carryover effects for such playlists. Another strong factor is a song's prior playlist exposure. While Aguiar and Waldfogel (2021) analyze the most popular songs, we find that less well-known songs and songs distributed by independent labels enjoy much stronger relative uplifts due to playlist inclusion not just during the listing but especially after delisting. This finding extends previous work showing that publicity especially benefits less-well-known products (Berger, Sorensen, and Rasmussen 2010), and that curation through playlists can contribute to consumers being better informed about content that matches their preferences (Hendricks and Sorensen 2009). We also find that within-playlist exposure (especially top 10 position and, to a lesser extent, playlist length) shapes listing and carryover effects.
The second category aligns with the fluency of the consumption experience of playlists. Playlists with other songs with higher prior exposure, playlists managed by the platform itself, and playlists with a better colisting-based and attribute-based fit will create a more fluent consumption experience, enhancing listing effects. The downside is that these very same characteristics may inhibit carryover effects, as discussed in more detail in Theme 3 below.
The third category aligns with recurring coconsumption experiences. In particular, playlists curated by context (vs playlists curated by content as studied in Aguiar and Waldfogel 2021) benefit from the recurring nature of contextual consumption experiences associated with the playlist (e.g., running, studying), creating stronger listing and carryover effects.
Theme 2: Playlist Effects Do Not Just Play Out During Listing
This research contributes to the literature by quantifying both the immediate impact of playlist exposure during listing and the subsequent carryover effect after a song has been delisted, as well as the heterogeneity in these effects. This analysis is new to the literature and documents that a meaningful share of the total uplift in streams occurs after the playlist listing ends. On average, the carryover effect accounts for about 32% (β2/[β2 + β2], M2, Table 3) of the total effect (22% if decay is taken into account, see revenue simulation), highlighting that discovery through playlists plays a significant and lasting role in driving demand. Our analysis also identifies conditions under which the carryover effect becomes even more prominent. For instance, when a song has a low colisting-based fit with the playlist, the carryover share rises to as much as 52% (Table 4).
Theme 3: The Dual Role of Playlist Fit and Platform Curation
One of the article’s key findings is that the (1) fit between the focal song and the other songs on a playlist and (2) platform curation exert a dual influence on the magnitude of the song’s uplift in streaming demand. Listings with higher colisting-based and attribute-based fit, as well as listings curated by platforms, enhance the listing effect, likely because they create a more fluent listening experience. On the flip side, they also constrain discovery and thus reduce carryover effects. This extends the literature, in particular on recommender system regarding the trade-off between conventional (high-fit) recommendations and diverse (low-fit) recommendations (André et al. 2009) and aligns with the exploitation (sticking close to known preferences) versus exploration (seeking novel content) framework (Cao et al. 2024). We note that colisting-based fit moves the needle much more in terms of heterogeneity in effect sizes between high and low levels of fit than attribute-based fit. A potential reason is that colisting-based fit summarizes revealed playlist choices by curators, shaped by listeners’ response. We speculate that, as such, by capturing which tracks work together, previous colistings aggregate curator intent and user taste in a way that simple audio attributes cannot.
Managerial Implications
Music artists and their labels can use our findings to make more informed decisions on playlist marketing, either directly (curating their own playlists) or indirectly (pitching their music to other playlist curators). The first main takeaway is that playlists are an effective driver of shaping demand, with a strong average listing effect (+8.5%) and carryover effect (+4.0%), which can become even stronger depending on playlist design characteristics. These findings align with the notion that playlists are located “where the rubber hits the road” (i.e., within streaming contexts), whereas other forms of marketing, such as advertising and radio plays, are outside of these contexts. The inclusion of a song on a playlist directly exposes subscribers to the song and gives them a free trial opportunity. As other components of the marketing mix, such as price and distribution, have become essentially obsolete in the streaming context, the new key question that marketing managers in this industry face is how to identify or create the most influential playlists. Our research adds to answering this question by the following takeaways.
Driving exposure through playlists
Grounded in a broad and generalizable empirical foundation, this research confirms that it is critical for artists and music labels to secure exposure through playlist placements. One of the strongest drivers of playlist effectiveness is its follower count, with a listing in the top quintile generating much more additional revenue than one in the bottom quintile. Tracking the overall follower count of the playlists a song is listed on is an important metric for artists and their management, as it is strongly predictive of the number of streams a song obtains. Yet, as the relevance of the other playlist characteristics shows, being placed on a large playlist does not secure a strong uplift. To further enhance exposure, a prime position (e.g., among the first ten) is important as it enhances listing and carryover effects, implying that, while theoretically possible, most consumers do not consume music in shuffle mode. Similar benefits for carryover effects arise from shorter playlists. Labels managing their own playlists can translate these insights into practice by reserving the top playlist slots for low-exposure tracks and limiting list length to prevent songs from being buried and losing uplift.
Further, music labels managing their own playlists can create strong opportunities for exposure, consumption, and discovery of music from their artists. While at first glance the playlist ecosystem appears to be dominated by platform-curated playlists, artists and labels can be encouraged by our finding that label-curated playlists generate the stronger carryover effects than platform or third-party lists for playlists with comparable follower counts.
However, the fact that placements on the largest playlists are the most effective puts artists and labels in a difficult position. While tens of thousands of playlists exist, artists and labels should focus their indirect marketing efforts on the larger playlists (e.g., the top quintile). This has the undesirable side effect of placing a lot of power in the hands of playlist curators, which labels can and should counteract by creating their own playlists attractive enough to attract a follower count on par with other top playlists.
Platform operators are well aware of the power of playlists and have started to monetize them. While according to its own rules, Spotify does not allow “pay for play” on its platform, Spotify started offering fledgling artists spots on playlists curated by the platform, for which artists have to pay through a reduced payment per stream (Perez 2020). Our analysis allows artists and labels to make an informed decision on whether the expected lift in streams due to listing and carryover effects compensates for the reduction in payment per stream. For example, if we can expect a 50% lift in the number of streams due to a playlist listing, then a 25% reduction in payment per stream may be worthwhile.
We find that lesser-known songs (i.e., those in the bottom quintile of prior playlist exposure) experience higher relative uplifts than highly exposed tracks. This pattern reflects the merits of serendipitous discovery: When a playlist introduces a song unfamiliar to its listeners, it creates genuine first exposures rather than merely reminding existing fans. For music labels curating or pitching to playlists, the key implication is clear: Prioritize underexposed tracks rather than relying solely on established hits. By deliberately featuring some fresh or niche songs, especially on larger playlists, artists and labels can benefit from the fact that novelty drives discovery, thus building new fan engagements and creating substantially higher long-term revenue potential. One caveat to this finding is that we also find that it is especially helpful if songs are surrounded by other songs on the playlist with a lot of prior playlist exposure, which means that curators should not be tempted to include only lesser-known content.
Driving consumption and discovery through playlists
Our findings suggest that music labels curating playlists control two key levers that affect music consumption and discovery. A listing's attribute-based fit (songs on the focal playlist are very similar to focal song in terms of their content characteristics) and especially a listing's colisting-based fit (the playlist features songs that are often colisted with the focal song on other playlists)—both of which can be readily calculated—enhance listing effects during the song's spell on the playlist, in line with the notion that such playlists offer a fluent consumption experience. Hence, if the objective is to provide a fluent and smooth consumption experience and obtain relatively strong listing effects, high-fit placements, both in terms of song attributes and particularly in terms of prior colistings, are recommended. However, if the goal is to broaden the repertoire of playlist followers by offering music that is somewhat out of the ordinary, a lower-fit placement with songs that less resemble each other and that are less often colisted with the other songs is preferable. The benefit of such less fluent playlists is that they have more potential for discovery, as demonstrated by their relatively stronger carryover effects.
Importantly, colisting-based fit is a much stronger driver of heterogeneity in the effects than attribute-based fit. The implication is that if a music label wants to stimulate long-term discovery (at the expense of short-term consumption), the key metric to select songs on is a low NPMI (capturing prior colistings) with the focal playlist rather than selecting content that has a low fit based on the musical features. In other words, the fact that songs have not been listed together much makes it more suitable for discovery than if songs are dissimilar musically. This finding speaks to the recommendation system literature (e.g., André et al. 2009; Cao et al. 2024) on the higher effectiveness of collaborative filtering (based on co-occurrences; analogous to colisting-based fit) compared with content-based filtering (analogous to attribute-based fit).
One further lever is context- versus content-based curation. Compared with content-based playlists (based on genre or artist), context-based playlists entail not only stronger listing effects (during listing) but also stronger carryover effects after delisting. While content-based playlists cater to specific types of music a user wants to listen to (e.g., ’80s rock, Taylor Swift), context-based playlists provide music to complement users’ recurring activities such as running, studying, or commuting. The complementarity of the activity may enhance exposure (e.g., listening to a running playlist during a one-hour run), and the recurring nature of the activity may drive repeat consumption of a song discovered through the playlist. Of course, the context needs to fit the artists’ music, but we argue that with some creativity, the same artist may produce music suitable for different activities (e.g., running, lounging, driving) featured on context-based playlists.
In sum, we find heterogeneous yet predictable listing and carryover effects, making playlists a crucial marketing instrument in the era of streaming. At the same time, the high relevance of playlists suggests that it is in the artists’ and music labels’ interest to avoid playlist curators occupying a dominating gatekeeper position that allows them to determine which songs will succeed (Aguiar and Waldfogel 2021). This suggests that content producers and policymakers should carefully observe how playlist curators exercise their power.
Generalizability and Opportunities for Future Research
We study curation in the context of playlists in the music market. Context-specific studies like ours offer high internal validity and provide relevant insights for stakeholders within the specific context (Stremersch et al. 2023). We suggest that our findings are also relevant for actors in other digital goods, such as video content or e-books, where other forms of curation have emerged that share similarities with playlists. In particular, personalized recommendations (based on a user's consumption history) are common and have received research attention (e.g., Adomavicius et al. 2018). Critics and intermediaries have also been creating curated lists, facilitating the consumption vis-à-vis an overwhelming number of offerings. Examples include lists of “must-read books” (e.g., Penguin's list of 100 must-read classics) and “must-watch movies” (e.g., the IMDb Top 250 Movies). These examples bear similarities with playlists and facilitate discovery in markets with abundant choice among experience goods. We expect that the key findings from our analysis also hold in these settings (e.g., that not all items on these curated lists benefit equally and that less known and out-of-the ordinary content will likely benefit more). It would also be interesting to study how individual users differ in their use of playlists. Follow-up research can also look in more depth at the role of playlist curators, who can be viewed as influencers (i.e., people with a large and engaged follower base; Lanz et al. 2019).
Our research also offers avenues for additional consumer behavior research. For example, playlist popularity (the number of playlist followers) may not only directly impact how many potential users are exposed to songs on the playlist but also signal that the type of music on the playlist is popular, which may appeal to some consumers but may deter others who want to be more unique in their tastes. In a similar vein, a top song position may also signal song popularity.
Although our data cover Spotify, the core mechanisms (i.e., the algorithmic and human playlist curation, abundant catalog, and per-stream payment) are common across major streaming services. Consequently, we expect the cognitive and economic underpinnings of our findings to extend well to other platforms, though testing this assumption on services such as Apple Music or Deezer remains a worthwhile avenue for future research.
Supplemental Material
sj-pdf-1-jmx-10.1177_00222429251395986 - Supplemental material for Driving Music Demand in the Age of Streaming: Understanding the Heterogeneity in Curated Playlist Effectiveness
Supplemental material, sj-pdf-1-jmx-10.1177_00222429251395986 for Driving Music Demand in the Age of Streaming: Understanding the Heterogeneity in Curated Playlist Effectiveness by Nils Wlömert, Dominik Papies and Harald J. van Heerde in Journal of Marketing
Footnotes
Acknowledgments
The authors are grateful for helpful comments from Stephan Seiler and seminar participants at Bocconi, INSEAD, University of Maryland, Texas Christian University, University of Houston, Vrije Universiteit Amsterdam, Macquarie University, University of Western Australia, Koç University, University of Cologne, Goethe University Frankfurt, LMU Munich, Singapore Management University, University of Technology Sydney, ANZMAC, the Marketing Analytics Symposium Sydney (MASS), and the European Quant Marketing Seminar (eQMS). The authors thank Matthias Frühwirth for assistance with data management.
Coeditor
Shrihari Sridhar
Associate Editor
S. Sriram
Declaration of Conflicting Interests
The author(s) declared no potential conflicts of interest with respect to the research, authorship, and/or publication of this article.
Funding
All authors certify that they have no affiliations with or involvement in any organization or entity with any financial or nonfinancial interest in the subject matter or materials discussed in this manuscript. The authors have no financial funding to report for this project. One author has received funding for joint research activities from music labels for projects unrelated to this research project.
Data Availability
An alternative disclosure plan was approved for this article. The data that support the findings of this article are not available due to a nondisclosure agreement; however, code and disguised data were shared with the Editor in Chief.