
Abstract
Digital platforms facilitate exchanges between platform actors, such as trading between buyers and sellers. However, providers of digital platforms also compete with other actors, referred to as third parties, on their own platforms. In such settings, self-preferencing can occur if the platform treats its own offerings better than comparable third-party offerings—a practice often deemed inappropriate. However, detecting self-preferencing is challenging. This article addresses this challenge conceptually and empirically by putting forward a conceptual framework that defines self-preferencing and conceptualizes two self-preferencing tests. It implements this framework empirically in two studies across three international Amazon marketplaces using a novel metric to measure a product's nonpersonalized visibility. The aggregate findings provide little evidence for self-preferencing in both studies. However, the more disaggregated findings at a country and product category level vary from weak self-preferencing to strong self-depreferencing. As implementing self-preferencing tests requires researchers to choose between several empirical alternatives and assumptions, the approach proposed herein includes extensive sensitivity, specification curve, and heterogeneity analyses whose results support the robustness of the findings.
A digital platform is an online infrastructure that enables the efficient exchange of goods, services, or information—which we collectively refer to as “offerings”—between two or more platform actors (e.g., Constantinides, Henfridsson, and Parker 2018; Goldfarb and Tucker 2019). Numerous types of digital platforms exist, covering a wide range of activities such as retailing, trading, sharing, gaming, and dating.
Efficient exchange requires matching between platform actors, such as buyers and sellers. However, the number of offerings on platforms is usually large. Therefore, platforms add value through recommendations—helping buyers find sellers (and their offerings) and, sometimes, vice versa. Recommendations occur in a wide range of formats. For example, a platform provider might label particular sellers as “recommended sellers,” designate certain offerings as the platform's “choice,” or rank offerings in its search results.
These recommendations strongly influence buyers and, as a result, affect competition among sellers. Thus, platform providers wield significant power in determining which products to recommend. For example, sellers on platforms like Amazon Marketplace struggle to sell products if they do not appear near the top of the search results. Similarly, artists on streaming platforms such as Spotify benefit enormously from being included in curated playlists such as “Best of Hip-Hop” or “Today's Top Hits” (Aguiar and Waldfogel 2021).
Many platform providers also serve as platform actors, here referred to as “first parties.” For example, Amazon—the provider of the largest retailing platform in many Western countries (Amazon Marketplace)—competes with third parties in multiple dimensions: Amazon offers its own products (e.g., Amazon Basics), acts as a retailer on the platform (by selling third-party brands), and provides fulfillment services. Such a setup is a global phenomenon: Among the 20 most visited retail platforms globally, 12 offer their own private label products, and 14 platforms are retailers on their own platform (Jürgensmeier, Bischoff, and Skiera 2024). In such cases, the incentives of the roles of platform provider and platform actor might not perfectly align, and self-preferencing could occur; that is, the platform could treat its own offerings better than those of competitors. Such behavior is often considered unfair. For example, the recently enacted Digital Markets Act in the European Union (European Parliament 2022) prohibits, and the proposed American Innovation and Choice Online Act (2021) in the United States seeks to prohibit, self-preferencing on dominant platforms as a means of ensuring fair markets.
Thus, there is a need for a systematic approach to detect such conduct, particularly amid persistent accusations of self-preferencing on high-profile platforms (e.g., Mattioli 2019; Yin and Jeffries 2021). In one report, for example, a seller of coffee grinders complained that Amazon's newly introduced competing product “ranked well right away … because they’re an Amazon brand” (Jeffries and Yin 2021). Perhaps most notably, the U.S. Federal Trade Commission, jointly with 17 U.S. states, sued Amazon in September 2023, alleging that the platform illegally maintains monopoly power by “biasing Amazon's search results to preference Amazon's own products over ones that Amazon knows are of better quality” (Federal Trade Commission 2023).
Moreover, awareness of self-preferencing has trickled down to consumers. According to a survey we conducted with 300 frequent online shoppers in the United Kingdom, almost four in five consumers (78%) expect a platform's search results to favor its own products. Consumers also acknowledge the likelihood that such self-preferencing affects their purchase decisions, as 94% of respondents stated that platform recommendations through search results influence their product choices (Web Appendix A provides further details on our survey).
In light of these considerations, we develop an approach capable of testing for a platform provider's self-preferencing, building on a conceptual framework encompassing two distinct types of self-preferencing tests. We note that this approach can also reveal instances of self-depreferencing, that is, preferring competing offerings over the platform's own—a practice that may seem less obviously noncompetitive than self-preferencing, yet nonetheless raises questions about a platform provider's neutrality. We apply this approach in two empirical studies to measure self-preferencing in nonpersonalized search results across three international Amazon marketplaces. We suggest a novel measure to capture a product's visibility on an entire platform across a large number of keywords instead of measuring visibility based on a few individual keywords. Finally, we assess the findings’ robustness through various means, including specification curves, to systematically examine the results’ dependence on modeling choices. These contributions converge to fill the need for a valid, applicable system that platform providers, regulators, and third parties can use to verify compliance with anti-self-preferencing regulations.
Potential Self-Preferencing and Self-Depreferencing on Digital Platforms
Self-preferencing can occur whenever a platform provider also serves as an actor on its platform. There are numerous examples of platform providers that serve in such a dual role. In particular, many major retail platforms use a business model in which they both serve as a platform provider and offer their own products or services—including Amazon, mentioned previously, as well as Walmart, Target, and Macy's in the United States; Zalando, Saturn, and Kaufland in Europe; Mercado Libre in Latin America; Shopee in Southeast Asia and Latin America; Wildberries and Ozon in Russia; Flipkart in India; and JD.com in China (Jürgensmeier, Bischoff, and Skiera 2024). Additional examples outside the retail industry include Google's search platform, where search results could prioritize links to Google's services (e.g., Google Shopping or Google Flights). Apple's App Store may rank Apple's own apps better than others, and Google's Play Store might also do so. Online advertising platforms (e.g., Google with its Ad Manager and its own ad inventory) might prioritize their own services, and streaming platforms (e.g., Netflix or Amazon Prime) might prioritize their own content. Between 2002 and 2015, eBay owned PayPal and thus acted as both a marketplace provider and a payment provider on that marketplace.
Several studies have looked at settings in which a platform provider simultaneously serves another role that could interfere with its neutrality. For example, Hunold, Kesler, and Laitenberger (2020) show that online travel agencies punish actors offering lower prices on other channels through worse search rankings. Cure et al. (2022) find that meta-search platforms prioritize offerings from sales channels owned by the same or a linked entity. Aguiar, Waldfogel, and Waldfogel (2021) assess platform ranking bias on Spotify and find that Spotify's playlists favored songs by female instead of male artists and songs published through independent instead of major labels. Given that the major labels partially own Spotify, the latter indicates that Spotify favors music from third parties over its own.
Some studies have examined Amazon Marketplace, which is also the focus of our empirical studies. A media report by Jeffries and Yin (2021) suggests that Amazon's private label brands often receive the top spot in the search results, albeit without considering the offerings’ attributes, such as price. Considering such attributes, Farronato, Fradkin, and MacKay (2023) find that, for a small set of keywords searched by very frequent Amazon shoppers, Amazon ranks its brands better than those of competitors. Waldfogel (2024) finds that, for search results of a sample of 100 keywords, Amazon prioritized its offerings less after the European Union introduced the Digital Markets Act, which bans self-preferencing for large platforms (European Parliament 2022). Furthermore, Kittaka, Sato, and Zennyo (2023) offer a literature review on self-preferencing by platforms.
Our study differs in several aspects from existing studies. First, we use a broader and more robust measure of products’ visibility in platform search results. Specifically, the studies cited previously all use a measure we call “product-keyword visibility,” which captures the visibility of a product for one keyword (e.g., the product's rank when searching for this keyword). The measure we suggest—referred to as “product visibility”—captures the visibility of a product across one million keywords, approximating visibility on the entire marketplace. In contrast to product-keyword visibility, our measure avoids potentially misattributing self-preferencing to fluctuations in the search results of individual keywords. Therefore, it enables us to conclude whether self-preferencing affects a product across all relevant keywords and not just one.
Second, the extant literature on self-preferencing on Amazon has primarily focused on whether the platform prefers its private label brands, such as Amazon Basics. We extend the analysis to products sold by Amazon as the retailer, a highly relevant part of the marketplace, as documented by Jürgensmeier, Bischoff, and Skiera (2024). Their analysis of 600 million available offerings on 11 international Amazon marketplaces indicates that Amazon is a retailer for 31% of the available offerings. However, only .02% of offerings are Amazon's private label products, so focusing on the latter might be less relevant than assessing the competition through Amazon retail.
Third, we use nonpersonalized search results that do not require disentangling self-preferencing from consumers’ preferences for first-party offerings. On the contrary, using personalized search results could require such disentanglement. Suppose an individual consumer strongly preferred first-party offerings, and the platform reflected these preferences in the personalized search results by treating first-party offerings better than third-party offerings. This preferred treatment of first-party offerings would not indicate self-preferencing because the search results correctly reflect this individual consumer's preferences. However, disentangling consumer preferences from self-preferencing is challenging without measuring and accounting for each consumer's preferences—which are hardly available to outside researchers.
Finally, we are the first to use specification curve analyses (Simonsohn, Simmons, and Nelson 2020) to systematically examine the extent to which model specifications impact the self-preferencing results—enabling us to evaluate the robustness of our conclusions.
The preceding literature and public discourse mostly focus on self-preferencing, that is, the platform provider preferring its own offerings over competing ones, which could be motivated by the platform provider's desire to sell more of its own offerings. However, giving preference to specific groups could also occur in the other direction through self-depreferencing, that is, preferring competing offerings over the platform's own. This practice also reflects a lack of neutrality in the platform provider's fulfillment of its role, and thus warrants attention. While the motivation for a platform provider to engage in self-depreferencing is less intuitive than that for self-preferencing, we suggest that platform providers face at least three incentives in this regard.
First, platform providers earn a commission from third-party sales that might yield a higher profit than comparable first-party sales. Such commissions can be sizable. For example, commission rates for third-party sellers on Walmart's platform are between 5% and 20% (Walmart 2025), and Amazon charges between 8% and 15% (see Web Appendix B for the categories’ third-party commission).
Second, the high regulatory scrutiny on self-preferencing and the threat of major financial penalties could incentivize platforms to err on the side of caution when deciding how to treat their own offerings compared with third-party offerings. The Digital Markets Act foresees fines of up to 10% of the platform's global revenues and up to 20% for recurring violations of the self-preferencing ban (European Parliament 2022). If offerings on a platform exhibit an obvious association with the platform provider—for example, Amazon Basics products—the platform provider might decide to make compliance with self-preferencing bans evident by giving higher preference to third-party instead of first-party offerings.
Finally, commissions from third-party sales are not the only revenue that the platform earns from third-party actors. Increasingly, platform providers sell advertising space to third-party actors. In 2024, Amazon reported a fast-growing advertising business, now generating revenue worth U.S. $56 billion (Amazon 2025). While Amazon does not disclose profit margins for its advertising business, industry expert Evans (2023) estimates that advertising margins might exceed 50%—much higher than the rather low retailing margins. Suppose third-party actors felt that they could not compete with first-party offerings due to self-preferencing. In that case, they might abandon the platform and, with it, cease paying for highly profitable advertising.
Our study further considers the heterogeneity of self-preferencing by considering a wide variety of settings in which self-preferencing or self-depreferencing might occur. For example, platforms could vary the degree of self-preferencing by country (e.g., due to varying regulatory frameworks or varying degrees of competition with other platforms or offline retailers), by product category (e.g., due to varying profitability of first-party sales by category), or by the degree of a product's vertical integration (e.g., because self-preferencing for an Amazon Basics product would be much easier to identify than self-preferencing for products that Amazon sells as a retailer). Thus, our study's results will contribute to a better understanding of whether platforms apply self-preferencing or self-depreferencing consistently across settings or selectively depending on the setting's characteristics. Simultaneously, such a broad assessment ensures that we avoid coincidentally analyzing a setting not representative of the degree of self-preferencing on the whole platform.
Conceptual Framework to Measure Self-Preferencing on Digital Platforms
Testing for self-preferencing is challenging, given that platforms closely guard their algorithms, and its detection requires access to extensive data. Although the literature mentioned previously has started considering this challenge, there is currently no firmly established approach to test for self-preferencing on platforms (Crémer et al. 2023). We aim to suggest such an approach—which starts with conceptualizing self-preferencing.
Basic Idea of Self-Preferencing
We start by denoting the platform provider's offer as the first-party offering and all other offerings as third-party offerings. For a specific platform, first-party and third-party offerings might be defined in multiple ways, according to the type of self-preferencing the analyst is interested in detecting. For example, in the case of Amazon Marketplace, we could define a first-party offering as a product brand owned by Amazon (e.g., Amazon Basics) and a third-party offering as any product brand owned by a company other than Amazon. Recall, however, that Amazon not only offers its own products on Amazon Marketplace but also serves as a retailer and fulfillment provider. To identify self-preferencing of Amazon's retail or fulfillment services, we could define a first-party (third-party) offering as a product (not) sold or fulfilled by Amazon.
Other digital platforms require similar distinctions. For example, in the case of Google's search engine results, the first-party offering could refer to results that link to Google's services (e.g., Google Shopping, Google Maps, or Google Flights), and third-party offerings to results that link to properties not owned by Google (e.g., eBay, OpenStreetMap, Kayak).
Self-preferencing, or self-favoring (Höppner 2024), means that the platform treats the first-party offering better than the third-party offering. Such a practice is commonly considered to be biased (e.g., Reimers and Waldfogel 2023) or discriminatory (European Parliament 2022). By a similar logic, self-depreferencing can also be considered to be discriminatory. Correspondingly, a platform's treatment of its offerings can be considered nondiscriminatory if the platform treats first-party and third-party offerings similarly. Thus, discriminatory treatment can manifest in two forms:
1.Similar offerings of the first party and the third party receive dissimilar treatment. 2.Dissimilar offerings of the first party and the third party receive similar treatment.
In subsequent sections, we describe two types of tests for discriminatory treatment, each corresponding to one of these forms: the conditioning-on-observables (COO) test (e.g., Aguiar, Waldfogel, and Waldfogel 2021; Farronato, Fradkin, and MacKay 2023) and the outcome-based (OB) test (Aguiar, Waldfogel, and Waldfogel 2021; Reimers and Waldfogel 2023), respectively. Throughout this article, for convenience, we primarily refer to these tests as “self-preferencing tests”; however, these tests can be straightforwardly applied to self-depreferencing as well.
Self-Preferencing in the Case of Identical Offerings
Let us assume that we have two identical offerings, one from a first party and one from a third party. “Identical” means that the two offerings are precisely the same, and all that differs is that one is affiliated with (e.g., sold or manufactured by) the first party and the other with the third party. It is not easy to identify two identical offerings in the real world. On a digital retailing platform such as Amazon Marketplace or Walmart, two sellers must offer the same product at the same price, which is rather easy to identify. However, for the offerings to qualify as “identical,” additional conditions must be met; for example, the two sellers must offer the same service and have the same reputation, which is much more challenging to identify.
Nevertheless, let us assume that we observe two identical offerings, which differ only in the name of the company with which they are associated (i.e., the first party or the third party). The mere name of the company should not affect the attractiveness of the offer, given that, by definition, all attributes that consumers might use to distinguish the two companies—for example, the associated service quality or reputation—are equal. Accordingly, both offerings should be equally appealing to the consumer, and the platform should give them equal treatment in terms of how well it “recommends” them to consumers, for example, how visible the platform makes the offerings in the search results. A nonequal treatment represents discriminatory behavior. We refer to such a deviation as self-preferencing if the platform treats the first-party offering better than the third-party offering. Self-depreferencing (or self-disfavoring) occurs if the platform treats the third-party offering better.
Self-Preferencing in the Case of Nonidentical Offerings
However, it is highly unlikely to find two identical offerings on a platform. On a retailing platform, for example, two offerings of the same product could differ along several dimensions, such as the price or the reputation of the two retailers. In this case, deviation from equal treatment of the two offerings could be justified if one offering is more attractive for the buyer than the other. This scenario raises the question of how to measure such attractiveness and, thus, the extent of deviation that is “justified.”
An option to directly account for a product's utility is to focus on a product's observable attributes under the assumption that these attributes influence the product's (unobservable) attractiveness to consumers. This approach builds on the idea mentioned previously, which is that “similar offerings should not receive dissimilar treatment.” In this case, the analyst constructs a regression analysis in which an offer's treatment level is the dependent variable, and the offer's observable attributes—including the mere name of the provider—are the independent variables. The parameter of the mere name of the provider captures the extent to which treatment is discriminatory: A value of zero (or close to zero) signals nondiscriminatory treatment, and a value different from zero signals discriminatory treatment. In the latter case, self-preferencing occurs if the first party's name relates to better treatment, and self-depreferencing occurs if the first party's name relates to worse treatment. The left panel of Figure 1 visualizes this test, which we refer to as the COO test, following the terminology of Reimers and Waldfogel (2023).
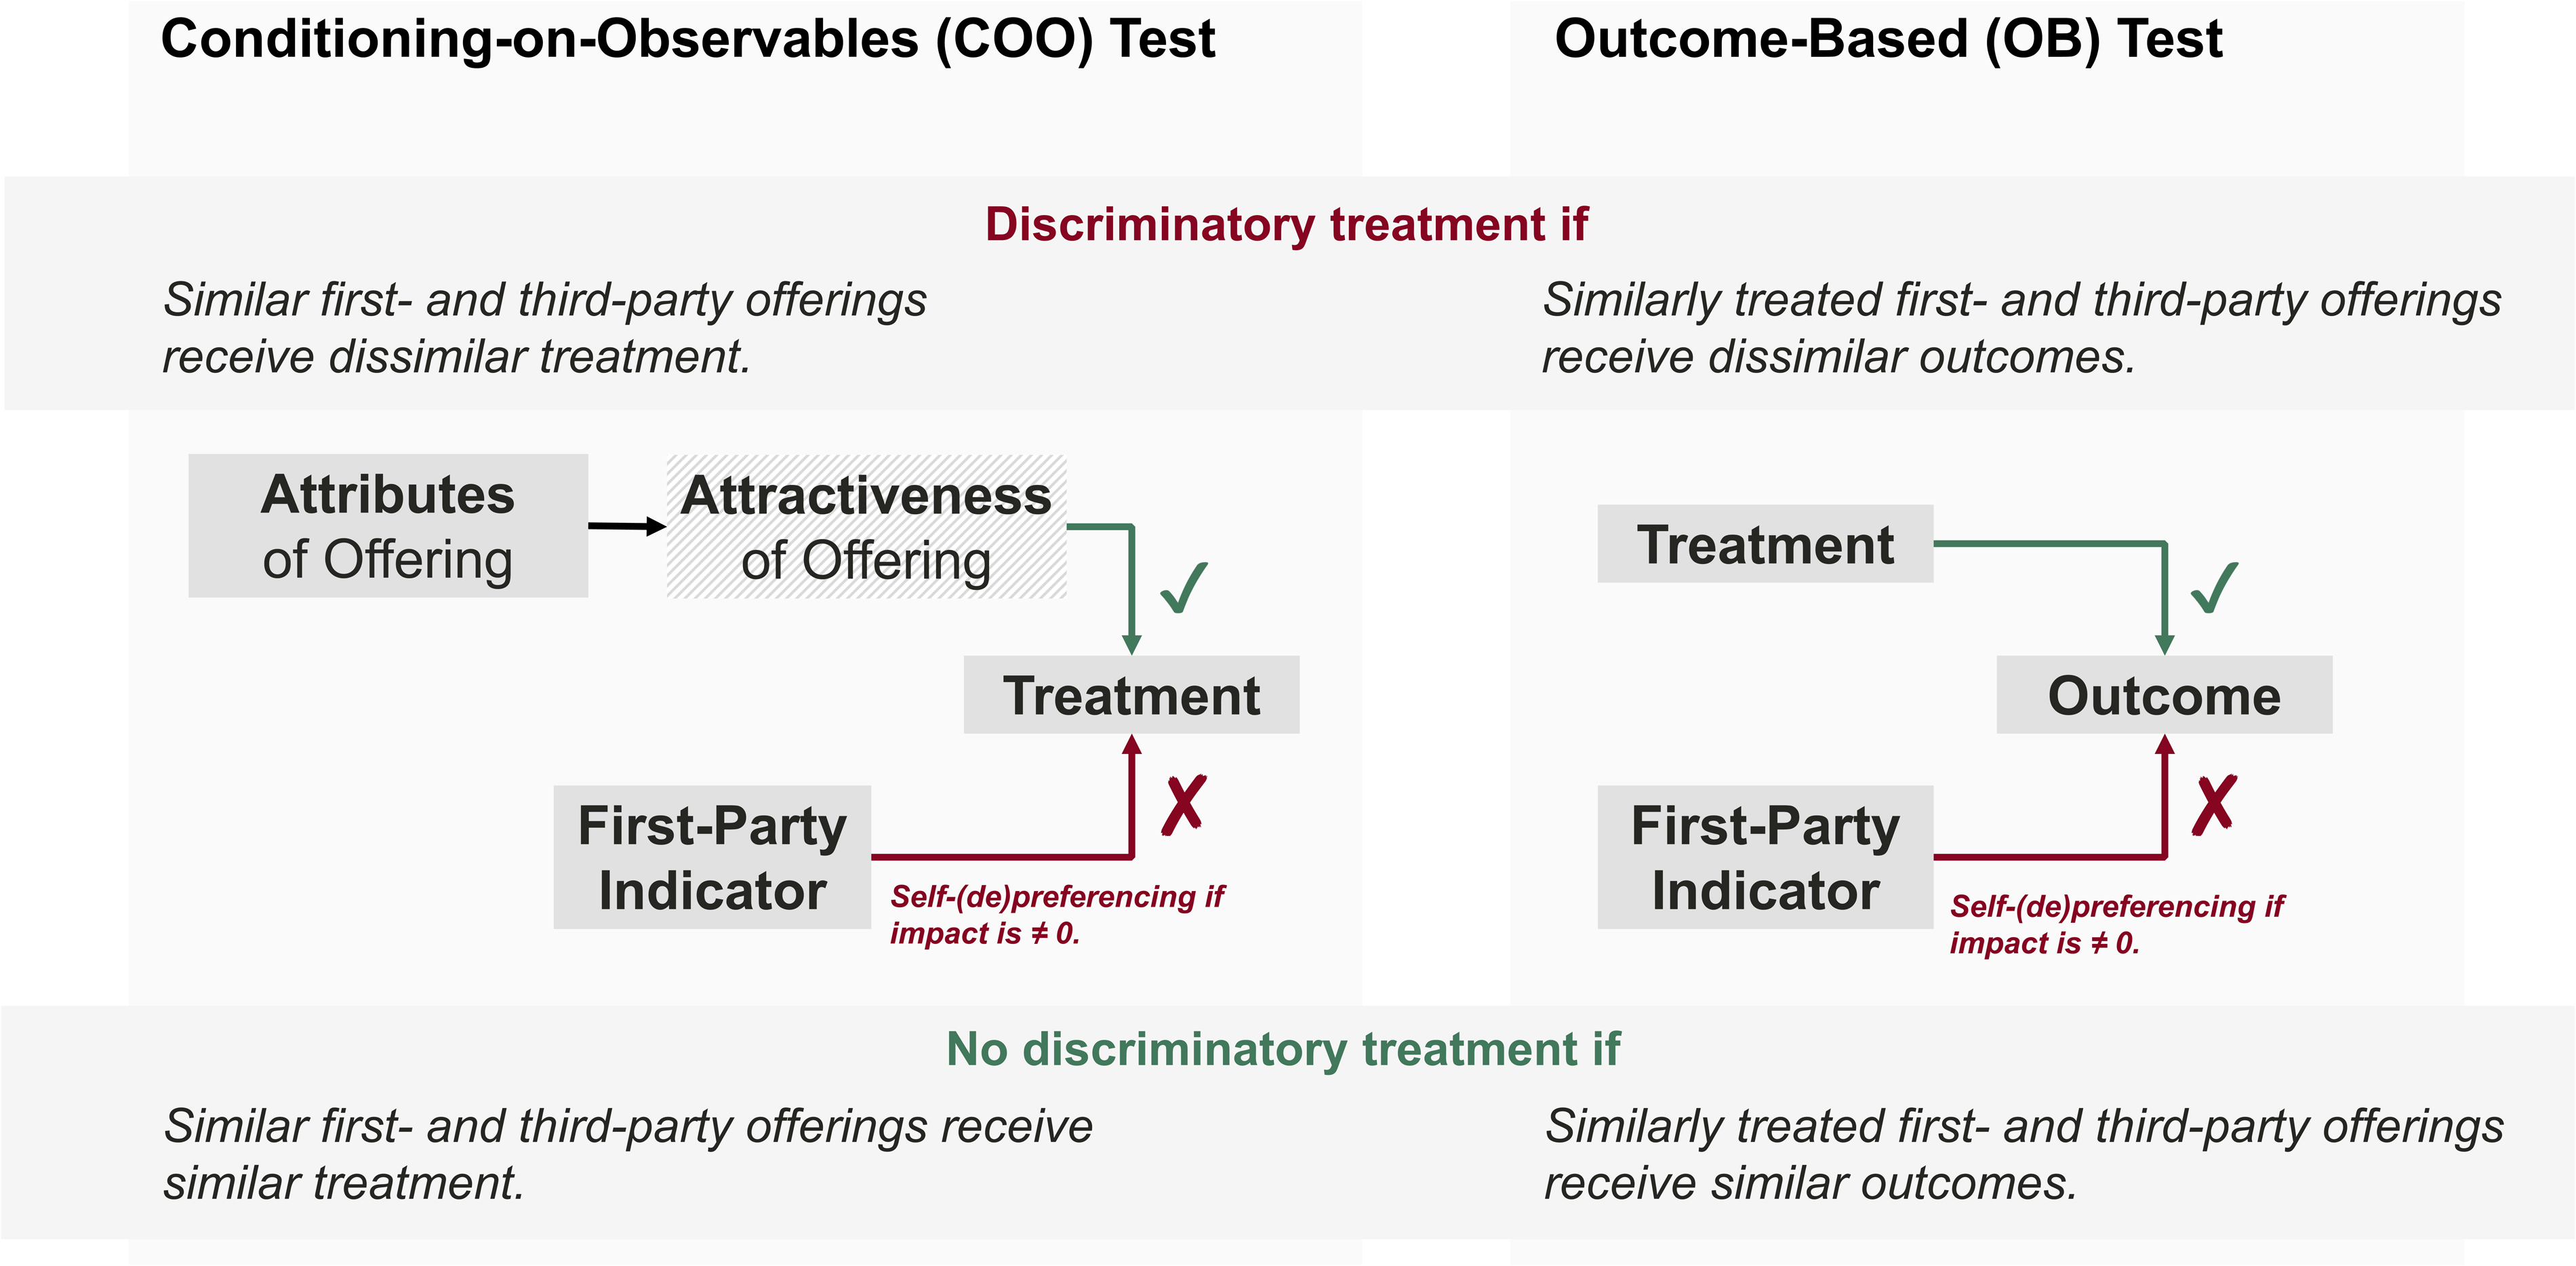
Illustration of Tests to Measure Self-Preferencing.
As depicted in the right panel of Figure 1, the OB test circumvents the need to measure offerings’ attractiveness or to observe attributes that affect this attractiveness. Instead, it relies on three straightforward variables: the treatment and the mere name of the provider, which are the independent variables in the regression, and the outcome, which is the dependent variable (e.g., the quantity sold). The idea of the OB test is that two offerings receiving the same treatment from the platform should lead to the same outcome under nondiscriminatory treatment. Discriminatory treatment occurs when the same treatment comes with different outcomes because that implies the treatment of the two offerings should have also been different to accurately reflect consumer preferences. Thus, self-preferencing occurs if, after controlling for the treatment, the coefficient of the first-party indicator shows that the outcome was worse for the first-party offering than for the comparable third-party offering, suggesting that the first-party treatment was too good given consumer preferences. Conversely, if the first-party offerings realized better outcomes conditional on the same treatment, the first-party offerings’ treatment should have been better, and self-depreferencing occurred.
Though it does not require observing offerings’ attributes, the OB test does not fully eliminate the risk of omitted variable bias. Specifically, this approach necessitates the inclusion of control variables that capture other factors—besides treatment—that might influence the outcome variable and correlate with the first-party indicator. In our context, an important attribute that might influence a product's sales and correlate with the platform indicator can be the first-party seller's advertising on the platform (e.g., appearance in sponsored search results).
Organic Search Visibility as Measurement of Platform's Treatment
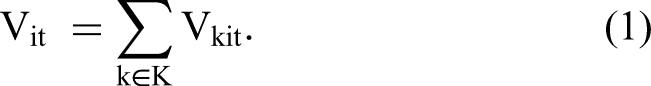
We measure the platform's treatment of an offering through visibility in organic search results, a metric developed by Sistrix (2025), a search engine optimization firm that popularized the metric and supplied the visibility data for this study. The core metric is product visibility, that is, the visibility of offering i in period t, Vit. It is the sum of many product-keyword visibilities, that is, the “raw” visibility Vkit of offering i for keyword k in period t across all keywords
To compute the value of Vkit, we multiply the number of consumers’ search queries Nkt with keyword k in period t by a function that depends on the ranking of offering i in the search results obtained from a search query with keyword k in period t:

We can define the function f in various ways; one straightforward way of defining it is as an inverse relationship between the search rank and the expected click probability (ECP). In other words, the greater a listing's search rank (meaning, the further down it appears in the search results), the lower the probability of clicking on the listing. The ECP (different from, e.g., an offer-specific observed click-through rate) estimates how likely consumers are to click on an offering on a given rank—across similar keywords and irrespective of which offering occupies this rank.
We prefer the ECP over the raw ranks because the ECP incorporates the empirical finding that consumers’ probability of clicking on a search result concentrates disproportionally among the top search results and decreases rapidly with increasing rank (e.g., Agarwal, Hosanagar, and Smith 2011; Feng, Bhargava, and Pennock 2007; Ghose and Yang 2009; Skiera and Nabout 2013). In addition, it leaves enough flexibility to account for different functional forms of the expected “rank–click” relationship across different offering categories or search intents. Still, and importantly for our application, the ECP is rank- and keyword-specific, but not offer-specific. Hence, the ECP does not measure the offer's success but instead characterizes how desirable a given rank is for a given keyword, irrespective of which specific offering occupies this rank.
For our studies, the data provider Sistrix recorded the search results in anonymized browsing sessions, that is, without user information or cookie retention. Sistrix estimates f based on third-party data for the number of impressions and clicks for keyword-specific ranks in the search results. 1 Accordingly, our variable accounts for the highly nonlinear ECP for each rank. Weighting the ECP by the number of search queries for a keyword makes the search results comparable for different keywords, thereby enabling the eventual computation of a visibility “market share” on the entire platform.
Because our data are derived from nonpersonalized searches, using our metric enables us to draw conclusions about the search results absent personalization and, thus, absent any expectations the platform might have about a specific user's behavior. While platforms might use personalized search results when they know certain aspects of consumers’ preferences, using such personalized search results creates a challenge for self-preferencing tests. Suppose the platform has learned that a consumer prefers first-party over third-party offerings. The search results could then legitimately reflect this preference and feature first-party offerings more prominently than competing third-party offerings. In this case, an analyst testing for self-preferencing must also account for this consumer's preference for first-party offerings to avoid misattributing the legitimate reflection of consumer preferences in the search results to a platform engaging in self-preferencing. However, measuring individual consumer preferences is extremely challenging for analysts without access to the consumer's data, such as past purchases. Thus, our use of anonymized search results alleviates the concern of conflating individual consumer preferences with self-preferencing.
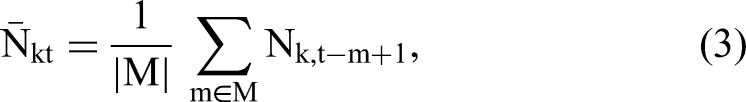
The visibility metric Vkit, defined in Equation 2, depends on seasonal search traffic fluctuations. That is, since Vkit depends multiplicatively on Nkt, its value is higher when more consumers search for a particular keyword, even if it just represents a seasonal increase. Hence, comparing an offer's search rankings at different points in time creates a risk of conflating (seasonal) changes in the popularity of an offering with changes in the platform's rankings. As we are interested only in the latter changes, we account for seasonality by weighting f by the seasonality-free popularity of a given search query.
To this end, we replace Nkt in Equation 2—that is, the number of searches in period t—with the number of average keyword searches over the entire length of the past seasonal cycle:

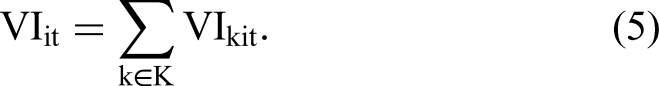
Next, similarly to Equation 1, we sum this product-keyword visibility index over the entire set of keywords K on the platform to derive the product visibility index:
As the last computation, we transform the product visibility index VIit into a relative product visibility index. This metric sets the product visibility in relation to the sum of all products’ visibility in the same period t:
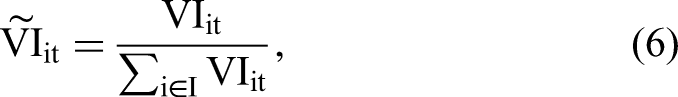
Sistrix computes each product's visibility as described in Equations 1 to 6. Because Amazon Marketplace features millions of offerings, an individual offer's visibility share is very small. Hence, Sistrix (2020) multiplies those values by one million for easy interpretation. The metric builds on data from an automated daily web scraper that records the results of one million representative keyword searches on the Amazon search engine.
We use Sistrix's daily visibility metric for each product as the dependent variable in our analyses. As mentioned, it covers the search results for one million keywords across the entire platform. Using this large keyword set to determine a product's visibility has several advantages. First, the resulting metric can resemble a product's market share of visibility on the entire platform. Thus, it enables us to compare the visibility of multiple products, even if they never appear in the same search result.
Second, it captures the ranks of individual products across many keywords. For example, our product visibility of “Amazon Basics Rechargeable AA Batteries” on Amazon Marketplace in the United Kingdom rests on the product's ranking in 815 keywords. Of these 815 keywords, 150 contain “rechargeable” and “battery.” However, the Sistrix keyword set—used for the computation of our product visibility—includes 7,744 keywords fulfilling the same condition (i.e., containing “rechargeable” and “battery”)—meaning that there is only a 150/7,744 ≈ 1.9% chance for this particular Amazon Basics product to appear in the search results when analyzing a random keyword that contains both “rechargeable” and “battery.”
Finally, the third—and arguably most important—advantage of using product visibility instead of product-keyword visibility is that a large keyword set instead of individual ranks avoids misattributing variation in rankings to self-preferencing. The reason is that search results differ even for two substantively identical but syntactically different keywords. However, these differences can lead to opposing results from self-preferencing tests. Suppose two keywords contain two identical words, but in a different order. For keyword A, a particular first-party product ranks first, followed by a third-party competitor’s product in the second rank. Keyword B features the third-party product at rank one and the first-party product at rank two. Because those two products are identical across the two searches, a self-preferencing test would find self-preferencing for keyword A and self-depreferencing for keyword B. Thus, the conclusion might depend strongly on the specific keyword selected to measure a product's visibility.
Our Sistrix data show that this consideration is far from a hypothetical example. The rank of the previously mentioned first-party Amazon Basics product varies tremendously. For the keyword “battery rechargeable aa,” the first-party product occupies the first organic (i.e., nonsponsored) rank, while the third-party competitor product “Duracell Rechargeable AA Batteries” occupies the second organic rank. In the substantively identical but syntactically different keyword “rechargeable aa batteries,” the order is reversed: The third-party product receives the first organic rank, followed by the first-party product at the second organic rank. Thus, self-preferencing tests relying on either one of these two—substantively identical but syntactically different—keywords would yield the opposite result. Our approach, in contrast, uses the ranks of both keywords as input to the overall product visibility, thereby avoiding this keyword dependency.
Two Forms of Competition on a Retailing Platform
Although we outlined that self-preferencing can occur in many forms, we focus our empirical studies on two primary forms of competition that are prevalent on retail platforms: retailer competition, in which the first party and multiple third parties offer the same product (addressed in Study 1); and product competition, in which the first party and multiple third parties offer different but competing products (addressed in Study 2). We proceed to specify how the two forms of competition are realized on Amazon, the platform at the focus of our empirical analysis. While focusing on Amazon for this exposition, we note, as outlined previously, that many other e-commerce platforms have adopted similar forms of competition.
Retailer Competition Through the Buy Box (Study 1)
Retailers, henceforth referred to as sellers, often compete to sell a specific product. In such cases, many platforms (including Walmart, Mercado Libre, Kaufland, and Amazon, among many others) do not list each offering individually (e.g., in the search results). Instead, the platform unifies those offerings into one listing and recommends the offering of one seller by selecting it for the buy box. The buy box is a visually separated box on the product page (on Amazon, it appears in the top right corner), highlighting one seller as the default seller. That seller might be the first party or a third party, and the seller can vary over time. Most consumers proceed to purchase the product from the recommended buy box seller. Indeed, though Amazon does not communicate the exact share, industry experts estimate that the buy box seller receives between 80% (Lanxner 2019) and close to 90% (Zeibak 2020) of product sales. Accordingly, the buy box creates a situation where, at any given time, only one seller effectively sells each product: the seller who holds the buy box. 2
Amazon uses a proprietary algorithm to determine the buy box seller. The company's third-party seller documentation names four attributes influencing the probability of winning the buy box (which do not necessarily correspond to the attributes influencing the search results ranking): competitive pricing, fast and free shipping, high-quality customer service, and a high in-stock percentage (Amazon Seller Central 2022). Similarly, Reiner, Rutz, and Skiera (2023) find that the shipping method (e.g., whether Amazon fulfills product orders) and the lowest price influence the buy box decision. They also find that the buy box seller changes, on average, every 82 hours.
In Study 1, we leverage this variation in the buy box seller over time to identify whether a focal product is more visible in the search results when the first party holds the buy box than when a third party holds the buy box.
Private Label Product Competition (Study 2)
Sellers can avoid retailer competition by offering private label products for which they are the exclusive seller. A prominent example of a private label brand on Amazon is Amazon Basics, which encompasses a large range of product categories (e.g., household goods, electronics, cosmetics, and health care products). For Amazon Basics products, Amazon does not have to compete for the buy box; instead, it competes with third-party products. Hence, competition for sales of private label products is a form of product competition instead of retailer competition via the buy box. Accordingly, we will compare the visibility of first-party (i.e., Amazon Basics) products with comparable third-party private label products in Study 2.
Implementation of Conceptual Framework to Test for Self-Preferencing
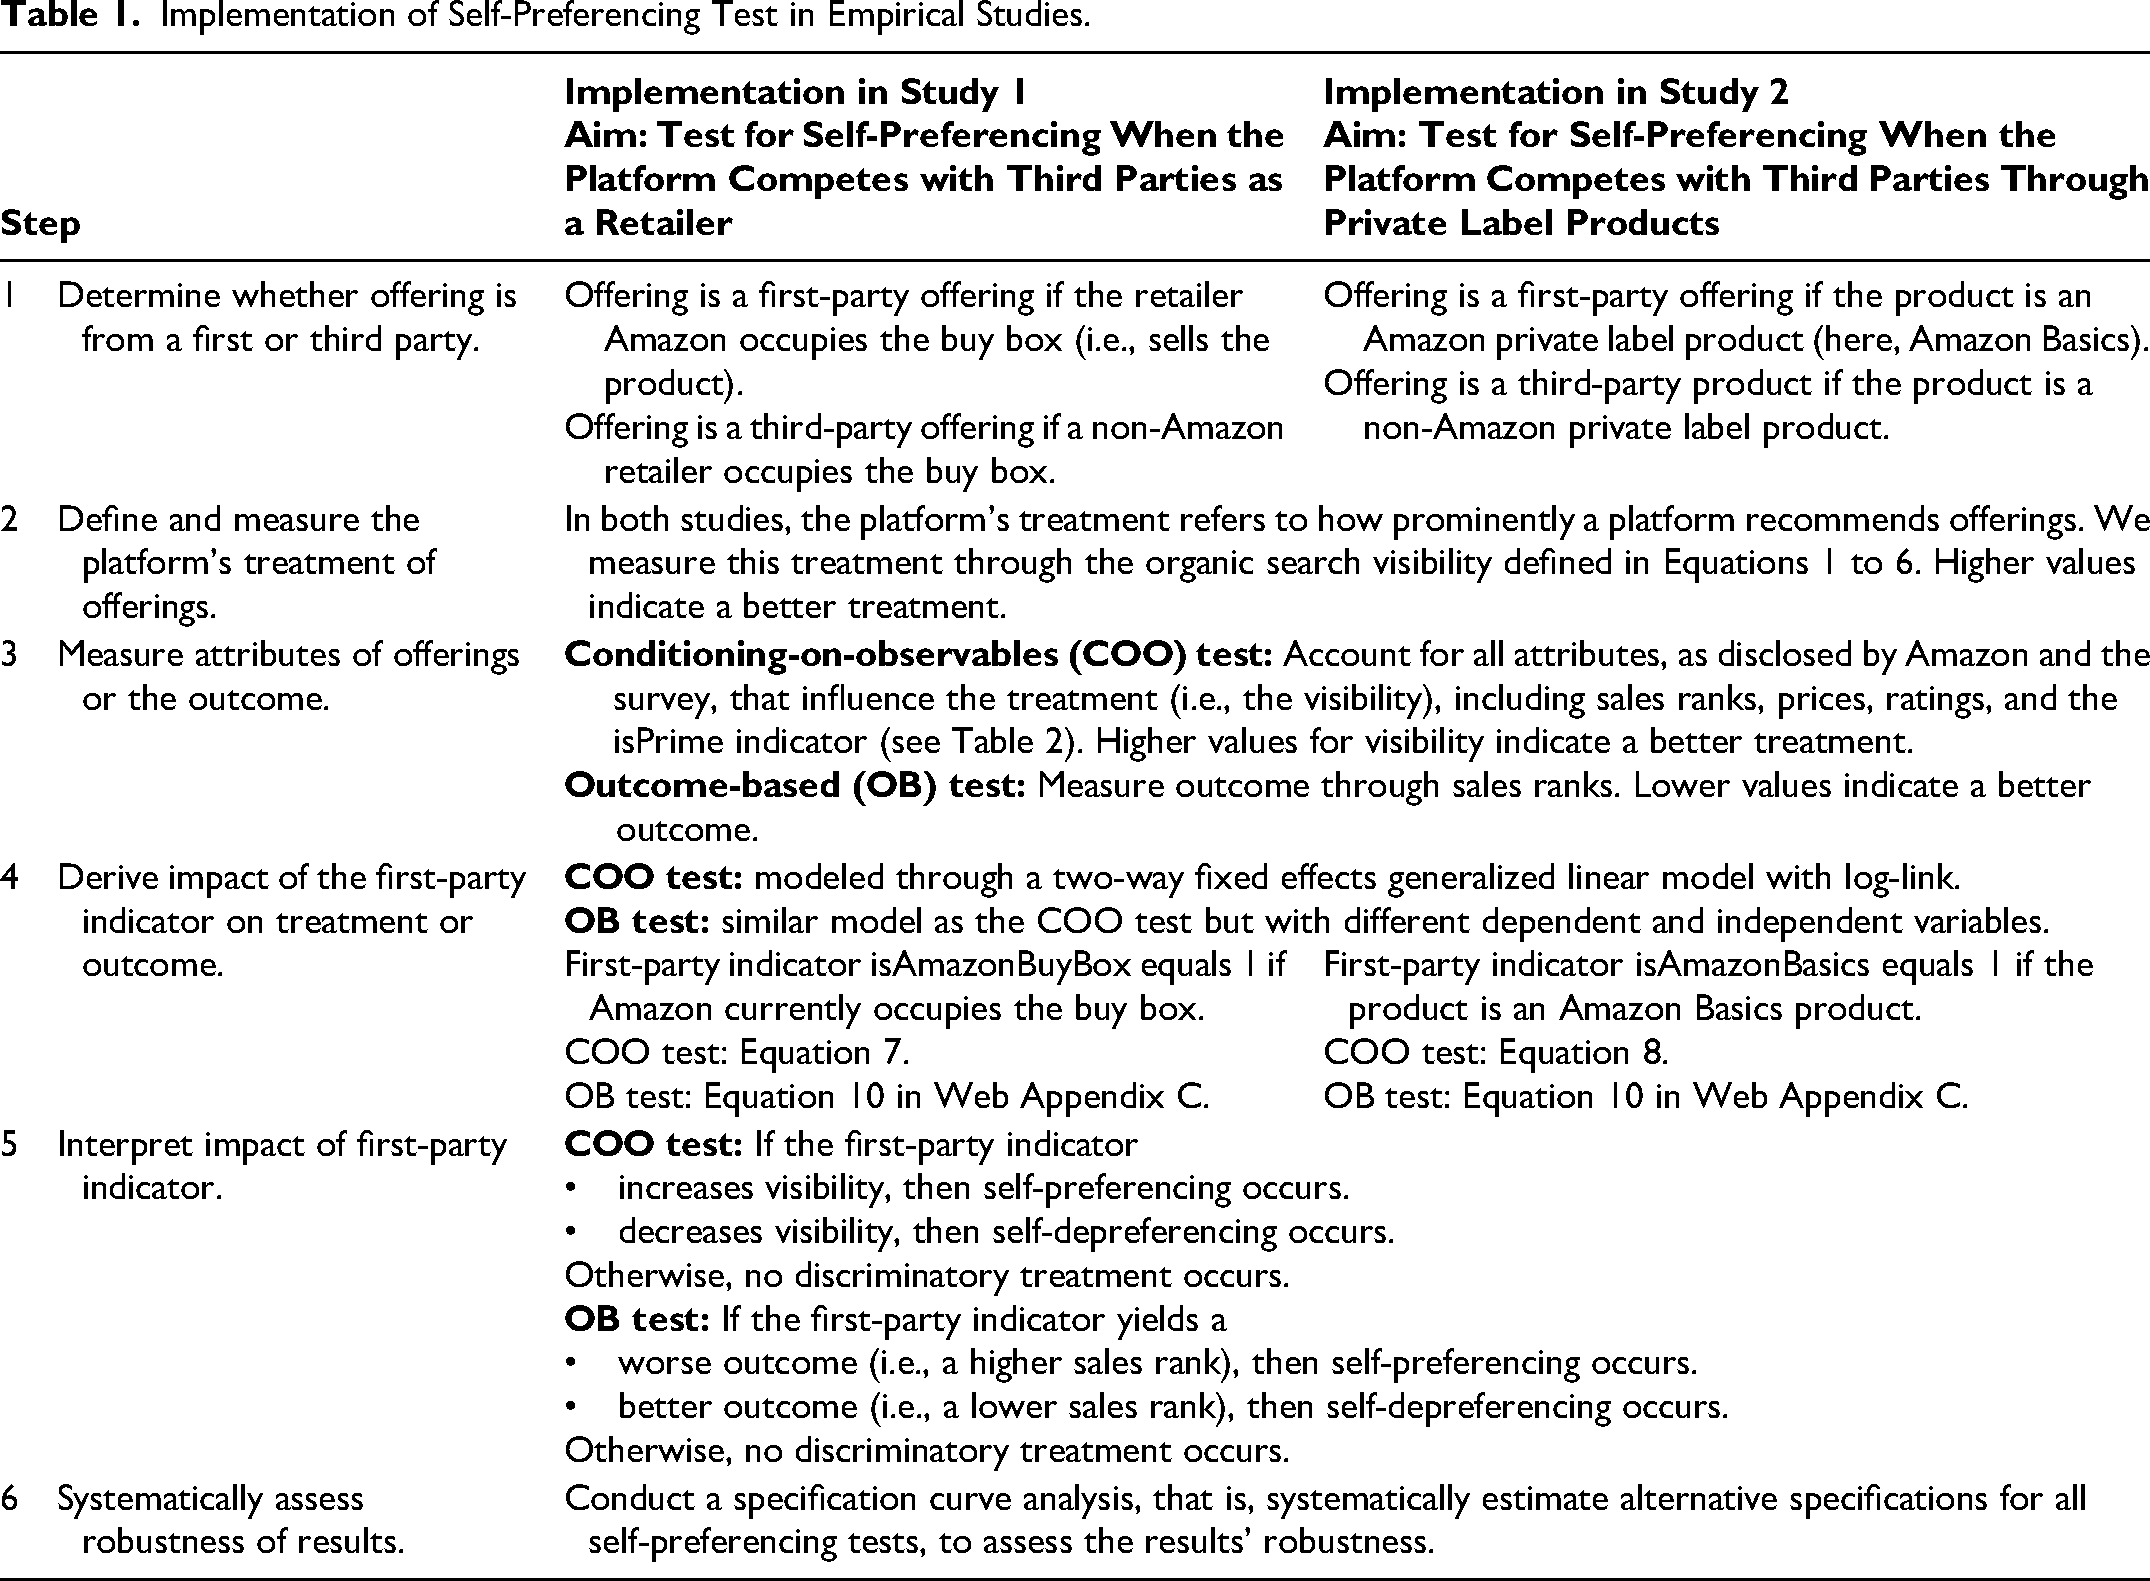
Table 1 summarizes the six-step process of implementing our conceptual framework, in general, and for our specific studies, accommodating the COO approach and the OB approach (Figure 1). In the following sections, we implement these steps in two empirical studies, each corresponding to one of the two primary forms of competition on Amazon Marketplace. We describe in detail our implementation of the COO approach; Web Appendix C provides our analyses for the OB approach.
Implementation of Self-Preferencing Test in Empirical Studies.
Study 1: Testing for Self-Preferencing in Retailer Competition Through the Buy Box
Study 1 focuses on products sold on Amazon Marketplace by multiple retailers (including the first party, i.e., Amazon) over time. Implementing a COO approach, we analyze the search results (i.e., the product visibility) that a product receives with the first party (i.e., Amazon) versus the third-party sellers occupying the product's buy box. Amazon explicitly identifies the occupant of the buy box with the label “Sold by [Seller Name].” The occupants of the buy box vary over time. Self-preferencing would occur if a product (all else equal) receives a better rank in the search result whenever the first party occupies the buy box and otherwise receives a worse rank. Specifically, we examine whether—given that the product is identical and that we use several other variables to control for differences in the attractiveness of the offerings that might influence search visibility—the product is more visible in the search results on days when Amazon, rather than a third party, holds the buy box. (See Web Appendix C for details on our OB-based analysis.)
Model
This study's main model employs the COO test by using the following two-way fixed effects generalized linear model with log-link (also referred to as “Poisson regression”) to model the expected search engine visibility: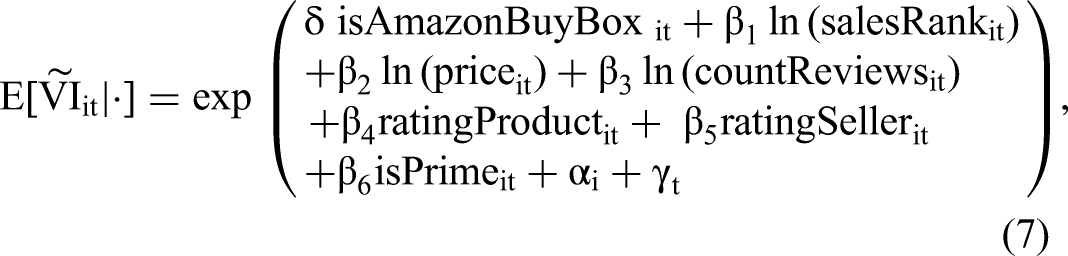
The correct identification of the parameter of the first-party indicator,
Thus, we measure the offerings’ attributes (shown in Table 2) that influence organic search engine visibility on Amazon Marketplace, according to Amazon's disclosure due to EU regulation 2019/1150 (European Parliament 2019). Consumers can access this information on Amazon marketplaces falling under the EU's jurisdiction by clicking “learn more about the results” at the top of the search results. We consider it plausible and justified that these attributes influence consumers’ perceptions of products’ attractiveness. Our consumer survey (see Web Appendix A) supports this conclusion by confirming which attributes inform consumers’ choices. Importantly, the attributes disclosed by Amazon do not include unjustified attributes, for example, whether the product is from a first or third party. If Amazon disclosed that the first-party (third-party) attribute influenced the search results, we could instantly conclude that self-preferencing (or self-depreferencing) occurs.
Amazon's Self-Disclosed Attributes Influencing Search Rankings, Operationalization in This Study, and Comparison with Other Studies.
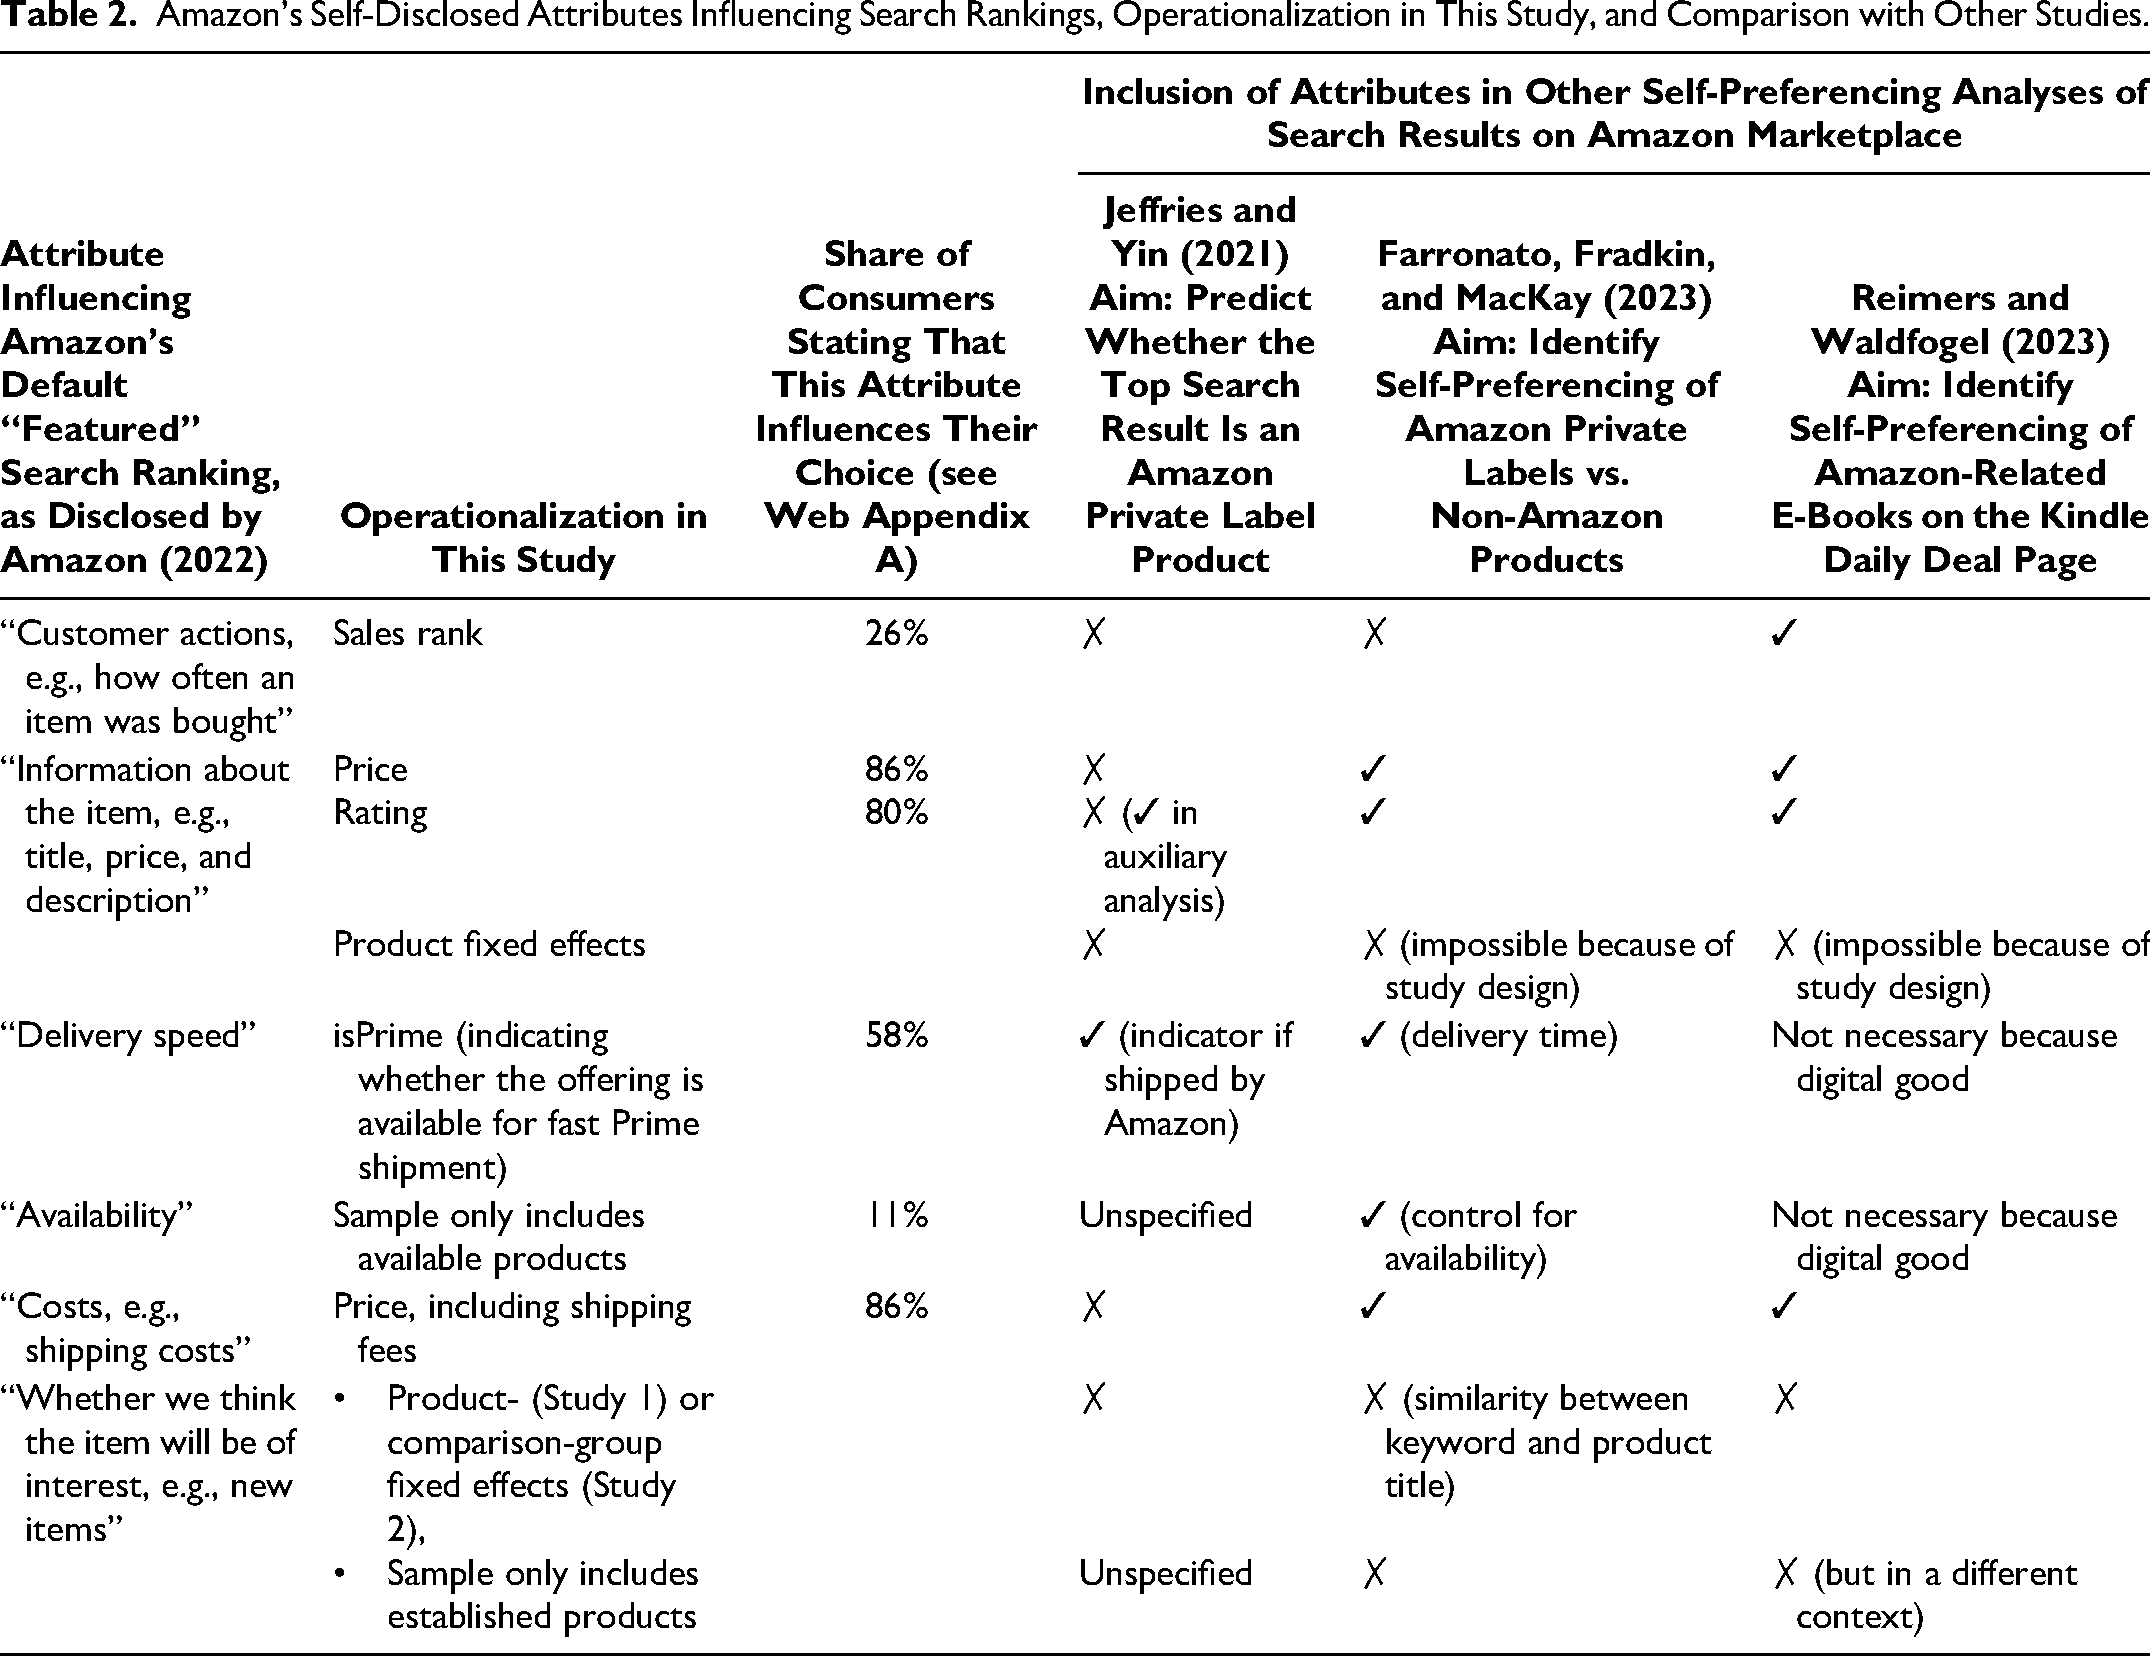
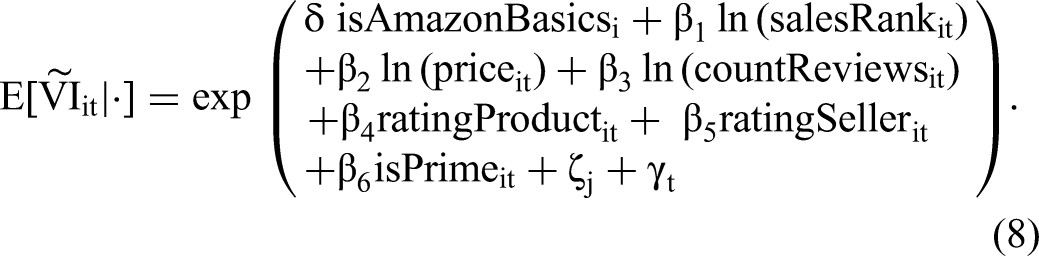
Table 2 explains how we map those disclosed attributes to observable variables or account for them in the model if the attributes are unobserved. Further, Table 2 compares our choices with those used in the three most closely related studies using COO tests to examine self-preferencing. For the OB test, we measure a performance outcome of interest, namely an offering's sales, captured in sales rank. Web Appendix C outlines our model specification for the OB test in Equation 8.
Data, Sample Selection, and Descriptive Statistics
For Studies 1 and 2 combined, we collected data from three country-specific Amazon Marketplace websites, corresponding to the three largest economies by gross domestic product in Europe: the German (Amazon.de), British (Amazon.co.uk), and French (Amazon.fr) websites. Specifically, we collected daily product-level observations, corresponding to 5,503 different products, during the period ranging from May 27, 2020, to January 23, 2021 (daily time-series panel data with T = 242 days; N = 1,037,784 observations). This period includes the coronavirus pandemic, which greatly affected demand for e-commerce. However, our analysis focuses on relative differences between offerings supplied by Amazon versus third parties, and we assume that the broader trends in e-commerce demand did not affect these relative differences. Additionally, we only included products that were available for most of the observation period.
We obtained data on variables of interest from the commercial Amazon tracker Keepa. Keepa is a data provider with a unique record of almost all Amazon products available in several important international markets. The firm updates its database multiple times daily and stores the historical values for each product.
The data we collect from Keepa for each product and each day include the following: the price charged by each seller that offers the product, the product's buy box seller on a focal day, the product's sales rank within its broadest product category (henceforth abbreviated as category), the number of reviews for the product, the product's average star rating, the rating for each seller offering the product, and whether the buy box seller offers Amazon Prime shipping for the product. (The latter four attributes are used only in the COO test and are not required in the OB test; see Web Appendix C.)
Keepa checks time-varying product data multiple times per day but only records a value once a variable changes. We use the last observation of that day to transform such irregularly spaced time-series data into daily observations. In contrast, Sistrix only provides a single value per day. Hence, it could be possible that Sistrix records a product's visibility on day t before a product's price, sales rank, or buy box seller changed at the end of day t. To avoid such a situation, we lag all independent variables from Keepa by one day, which amounts to a time difference of a few hours. This difference also ensures that the search ranking has already been updated and reflects potential product attribute changes. Our robustness checks—described in detail after the two empirical studies—confirm that the small measurement error introduced by nonidentical measurement times during the day is unlikely to affect our conclusions.
Study 1 uses eight samples, comprising daily observations for different samples of products obtained from the three country-specific Amazon Marketplace platforms we consider (Amazon.de; Amazon.co.uk; Amazon.fr). The eight samples include 2,276 products observed for T = 242 days between May 27, 2020, and January 23, 2021 (N = 445,042 daily product-level observations).
Three of the eight samples consist of the relevant best-selling products over the observation period—across all product categories—on each of the three Marketplace websites, respectively (Amazon.de: N = 87,488 observations corresponding to 452 products; Amazon.co.uk: N = 96,316 observations corresponding to 487 products; Amazon.fr: N = 86,678 observations corresponding to 432 products). Additionally, we pool those three samples in a separate dataset to increase our tests’ statistical power. These “best-selling samples” only include products with an average sales rank between 1 and 1,000. They only include products that exhibit varying buy box sellers in the observation period to ensure that we can identify self-preferencing by measuring the same product over time and assessing the impact of different buy box sellers on visibility.
Beyond those best-selling samples, to analyze narrower subcategories that do not necessarily include top-selling products, we collected five additional samples from the German Amazon Marketplace (Amazon.de). One of these samples (N = 93,125 observations corresponding to 483 products) comprises moderately selling products on the website, defined as products with an average sales rank between 10,000 and 11,000. The other four samples correspond, respectively, to four diverse product categories: groceries (N = 19,871 observations corresponding to 98 products), scents (N = 19,454 observations corresponding to 101 products), backpacks (N = 32,787 observations corresponding to 173 products), and batteries (N = 9,323 observations corresponding to 50 products). Each sample contains all relevant products in the respective category with an average sales rank between 1 and 10,000. The diversity of our samples ensures that our findings are not limited to one type of product, category, or country.
Table 3 displays the combined summary statistics for all observations pooled across the three best-selling samples (N = 270,482). In this analysis, the first-party indicator isAmazonBuyBox is 1 if the first party (here, Amazon) holds the buy box on a focal day and 0 if a third party does.
Study 1: Summary Statistics for Pooled Best-Selling Samples from the German, French, and British Amazon Marketplaces.
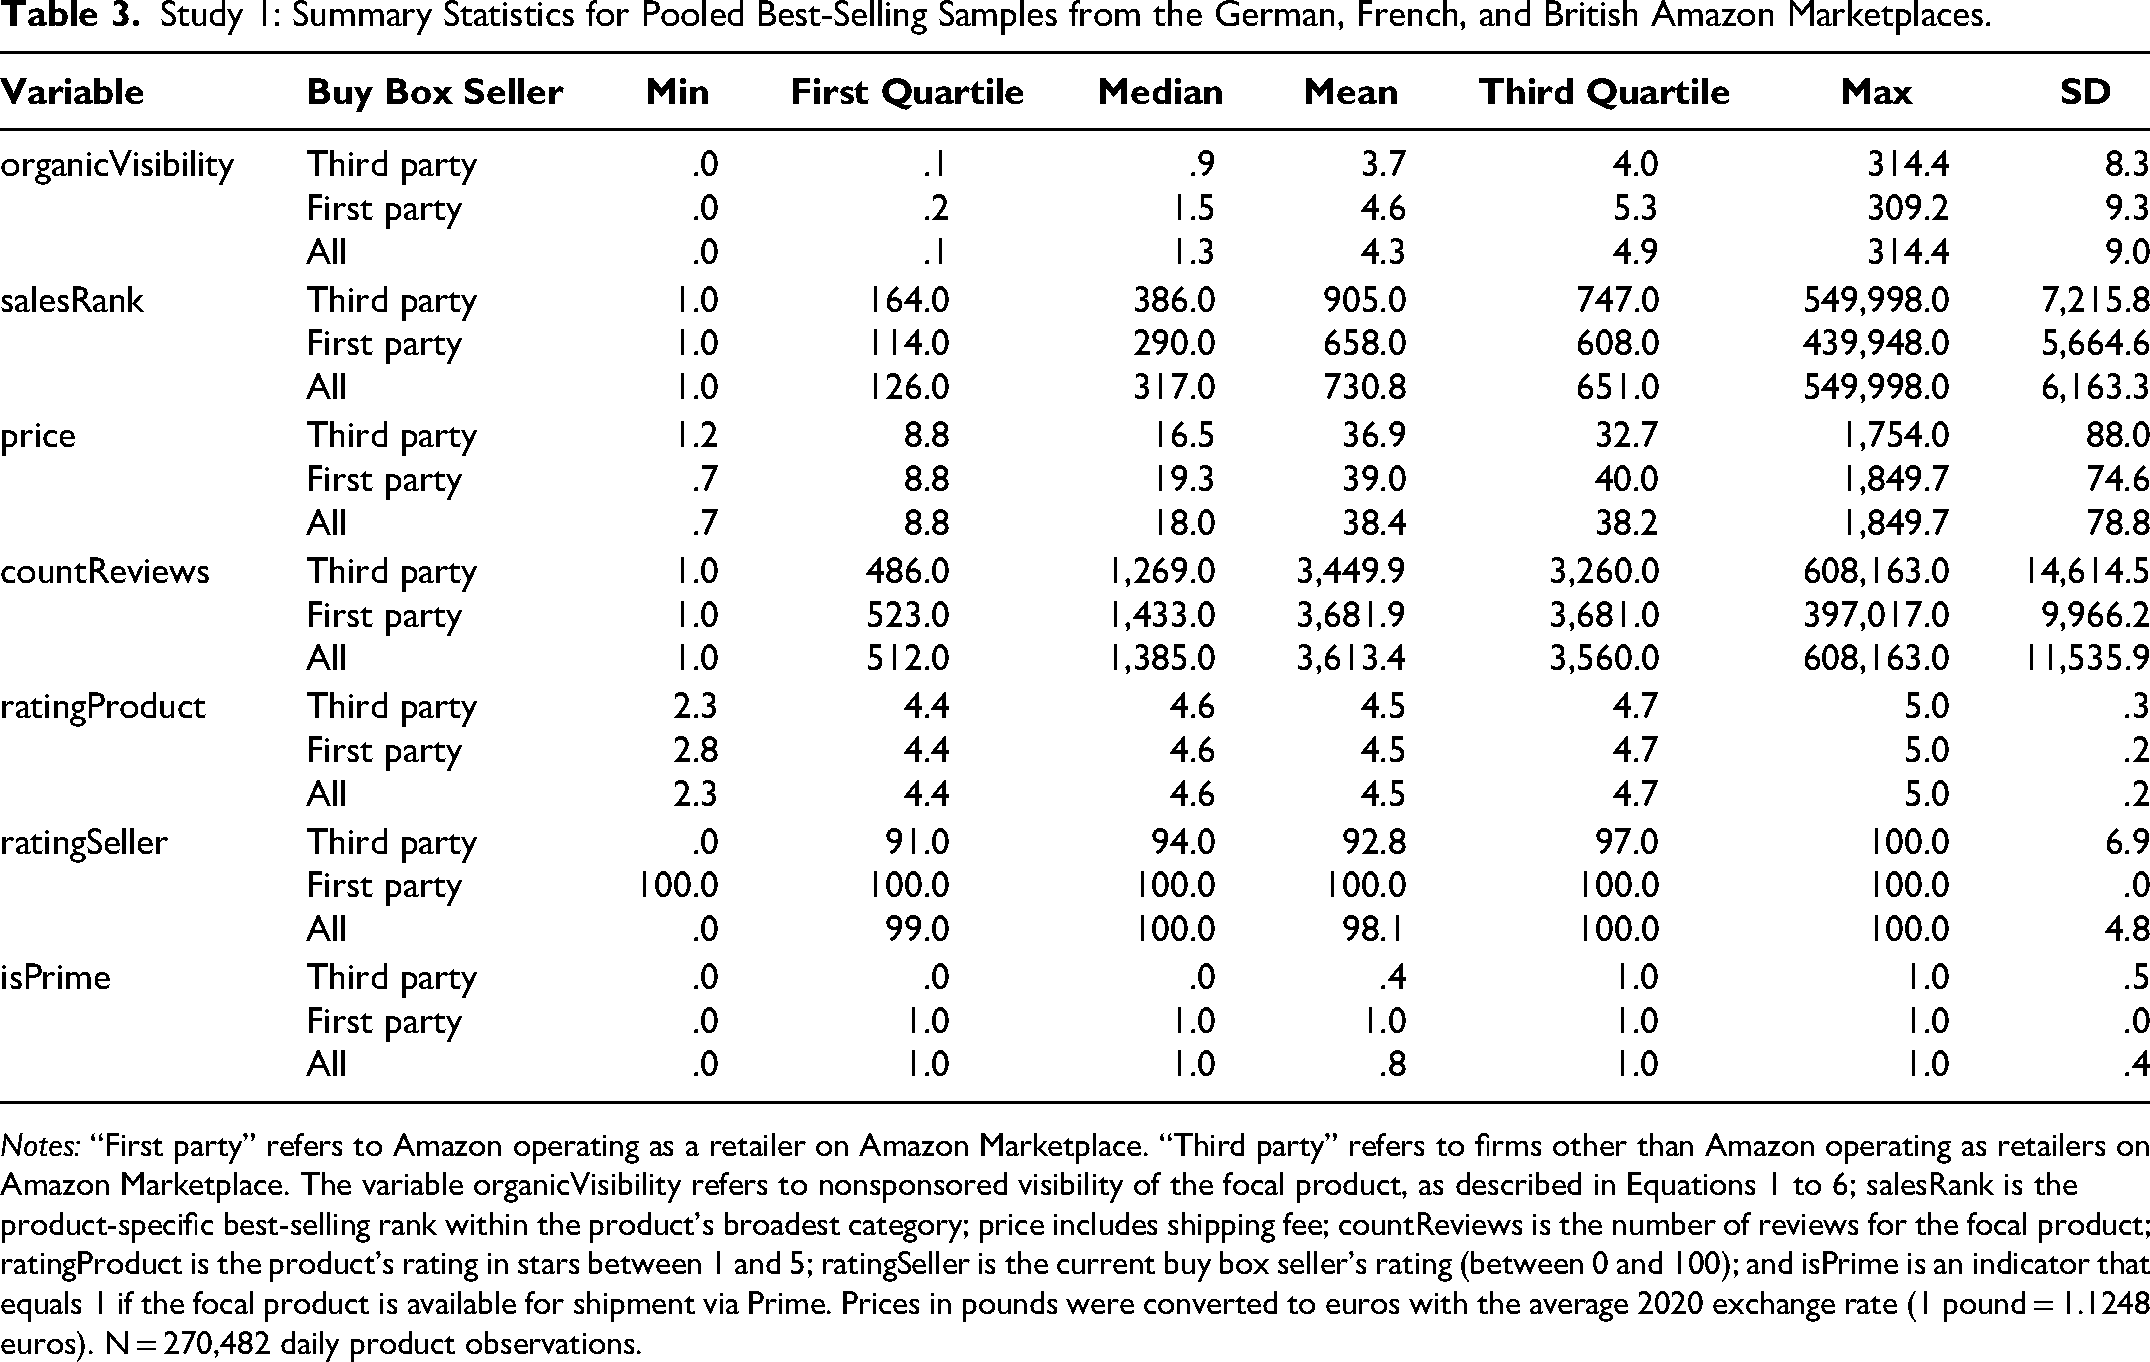
Notes: “First party” refers to Amazon operating as a retailer on Amazon Marketplace. “Third party” refers to firms other than Amazon operating as retailers on Amazon Marketplace. The variable organicVisibility refers to nonsponsored visibility of the focal product, as described in Equations 1 to 6; salesRank is the product-specific best-selling rank within the product's broadest category; price includes shipping fee; countReviews is the number of reviews for the focal product; ratingProduct is the product's rating in stars between 1 and 5; ratingSeller is the current buy box seller's rating (between 0 and 100); and isPrime is an indicator that equals 1 if the focal product is available for shipment via Prime. Prices in pounds were converted to euros with the average 2020 exchange rate (1 pound = 1.1248 euros). N = 270,482 daily product observations.
The first party maintains a significant presence in our three top-selling samples, securing the buy box for 70.4% of the daily observations. In the remaining 29.6% of observations, third-party sellers supply the product through the buy box. Notably, when we look at the entire platform, instead of focusing on the best-selling products, the distribution flips: Our analysis of data from Keepa.com in February 2024 shows that, on the German, French, and British marketplaces, the first party only supplies approximately 25% of all products with an active buy box. Hence, Amazon prioritizes competing for the buy box of best-selling products.
Table 3 shows that, across all three countries, the mean visibility for observations for which the first party held the buy box was higher than that for observations for which third-party sellers held the buy box. Specifically, offerings with the first party holding the buy box, compared with offerings with third parties holding the buy box, were, on average, 11.4% more visible in Germany, 21.8% more visible in France, and 38.6% more visible in the United Kingdom. The higher visibility of the first party alone cannot indicate self-preferencing because it ignores the possibility that the first-party offering is more attractive than the third-party offering. Thus, as elaborated in the conceptual framework, we must consider the attributes influencing offerings’ attractiveness.
In Table 3, the lower average price of third-party offerings indicates that they are more attractive than the first-party offerings. However, other variables suggest the opposite: First-party offerings exhibit higher sales (through a lower sales rank), more reviews, and better shipping (through a higher Prime availability).
We use the variable ratingSeller to proxy the seller's quality. The average seller rating of third parties is 92.8 across our three best-selling samples. A challenge is that the platform Amazon does not provide a rating for the seller Amazon, so the first party lacks a seller rating. We address this concern by assigning Amazon (the first party) a perfect rating (100) to reflect its reputation for high-quality logistics and customer service (see also Raval 2023). Still, this assigned rating might be too high. Hence, as a robustness check, we estimate the model's coefficients with the first-party seller ratings between 0 and 100 in all samples. While we subsequently systematically assess the robustness of our results through the specification curve analysis, we preview here that different values do not lead to different empirical conclusions except in one product category, namely batteries. Here, a seller rating of less than 100 changes a statistically insignificant self-preferencing estimate to a significant one.
Results
Self-preferencing estimates by country and sample
We next incorporate the variables listed in Table 3 into our model to estimate whether Amazon's search algorithm self-preferences. Table 4 presents the results for the eight samples in Models 1–8 and the pooled best-selling sample comprising the combined German, French, and U.K. samples, which adds country fixed effects to the main specification in Model 0-A and country-specific interaction effects with isAmazonBuyBox in Model 0-B. Figure 2 visualizes the self-preferencing estimates
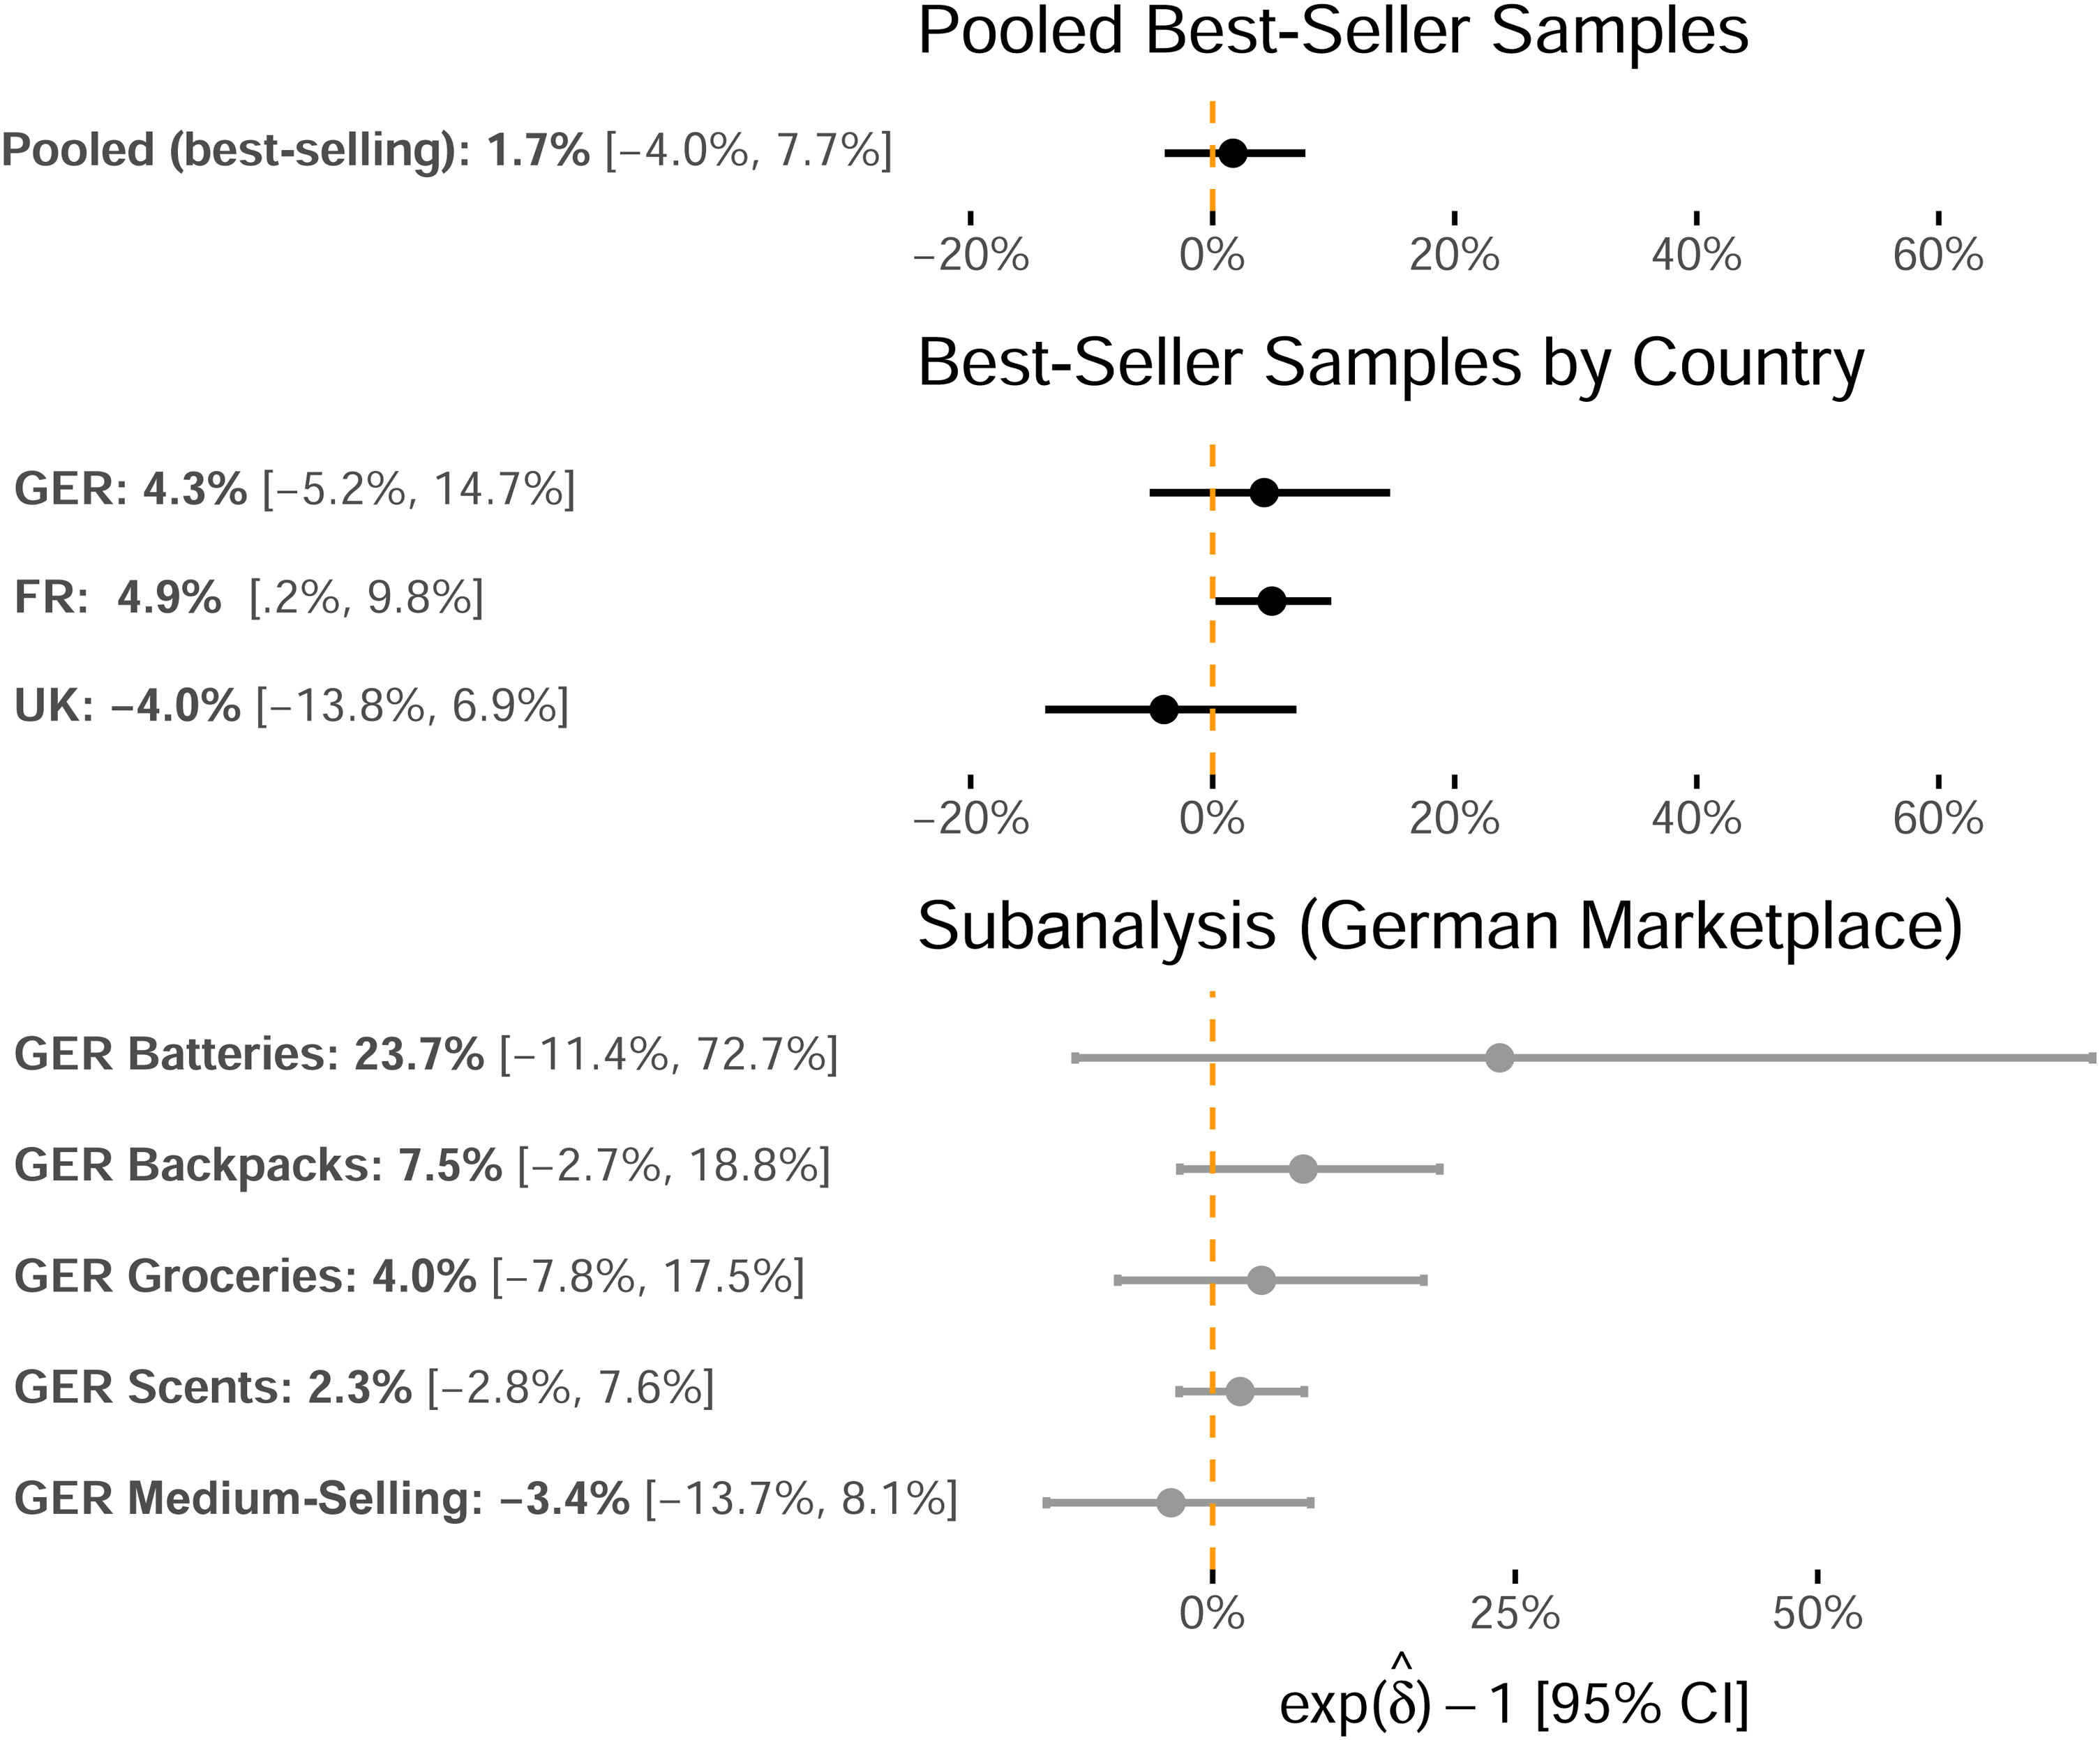
Study 1: Self-Preferencing Point Estimates for the isAmazonBuyBox Indicator Variable and 95% Confidence Intervals.
Study 1: Generalized Linear Model with Log-Link—Estimation Results.
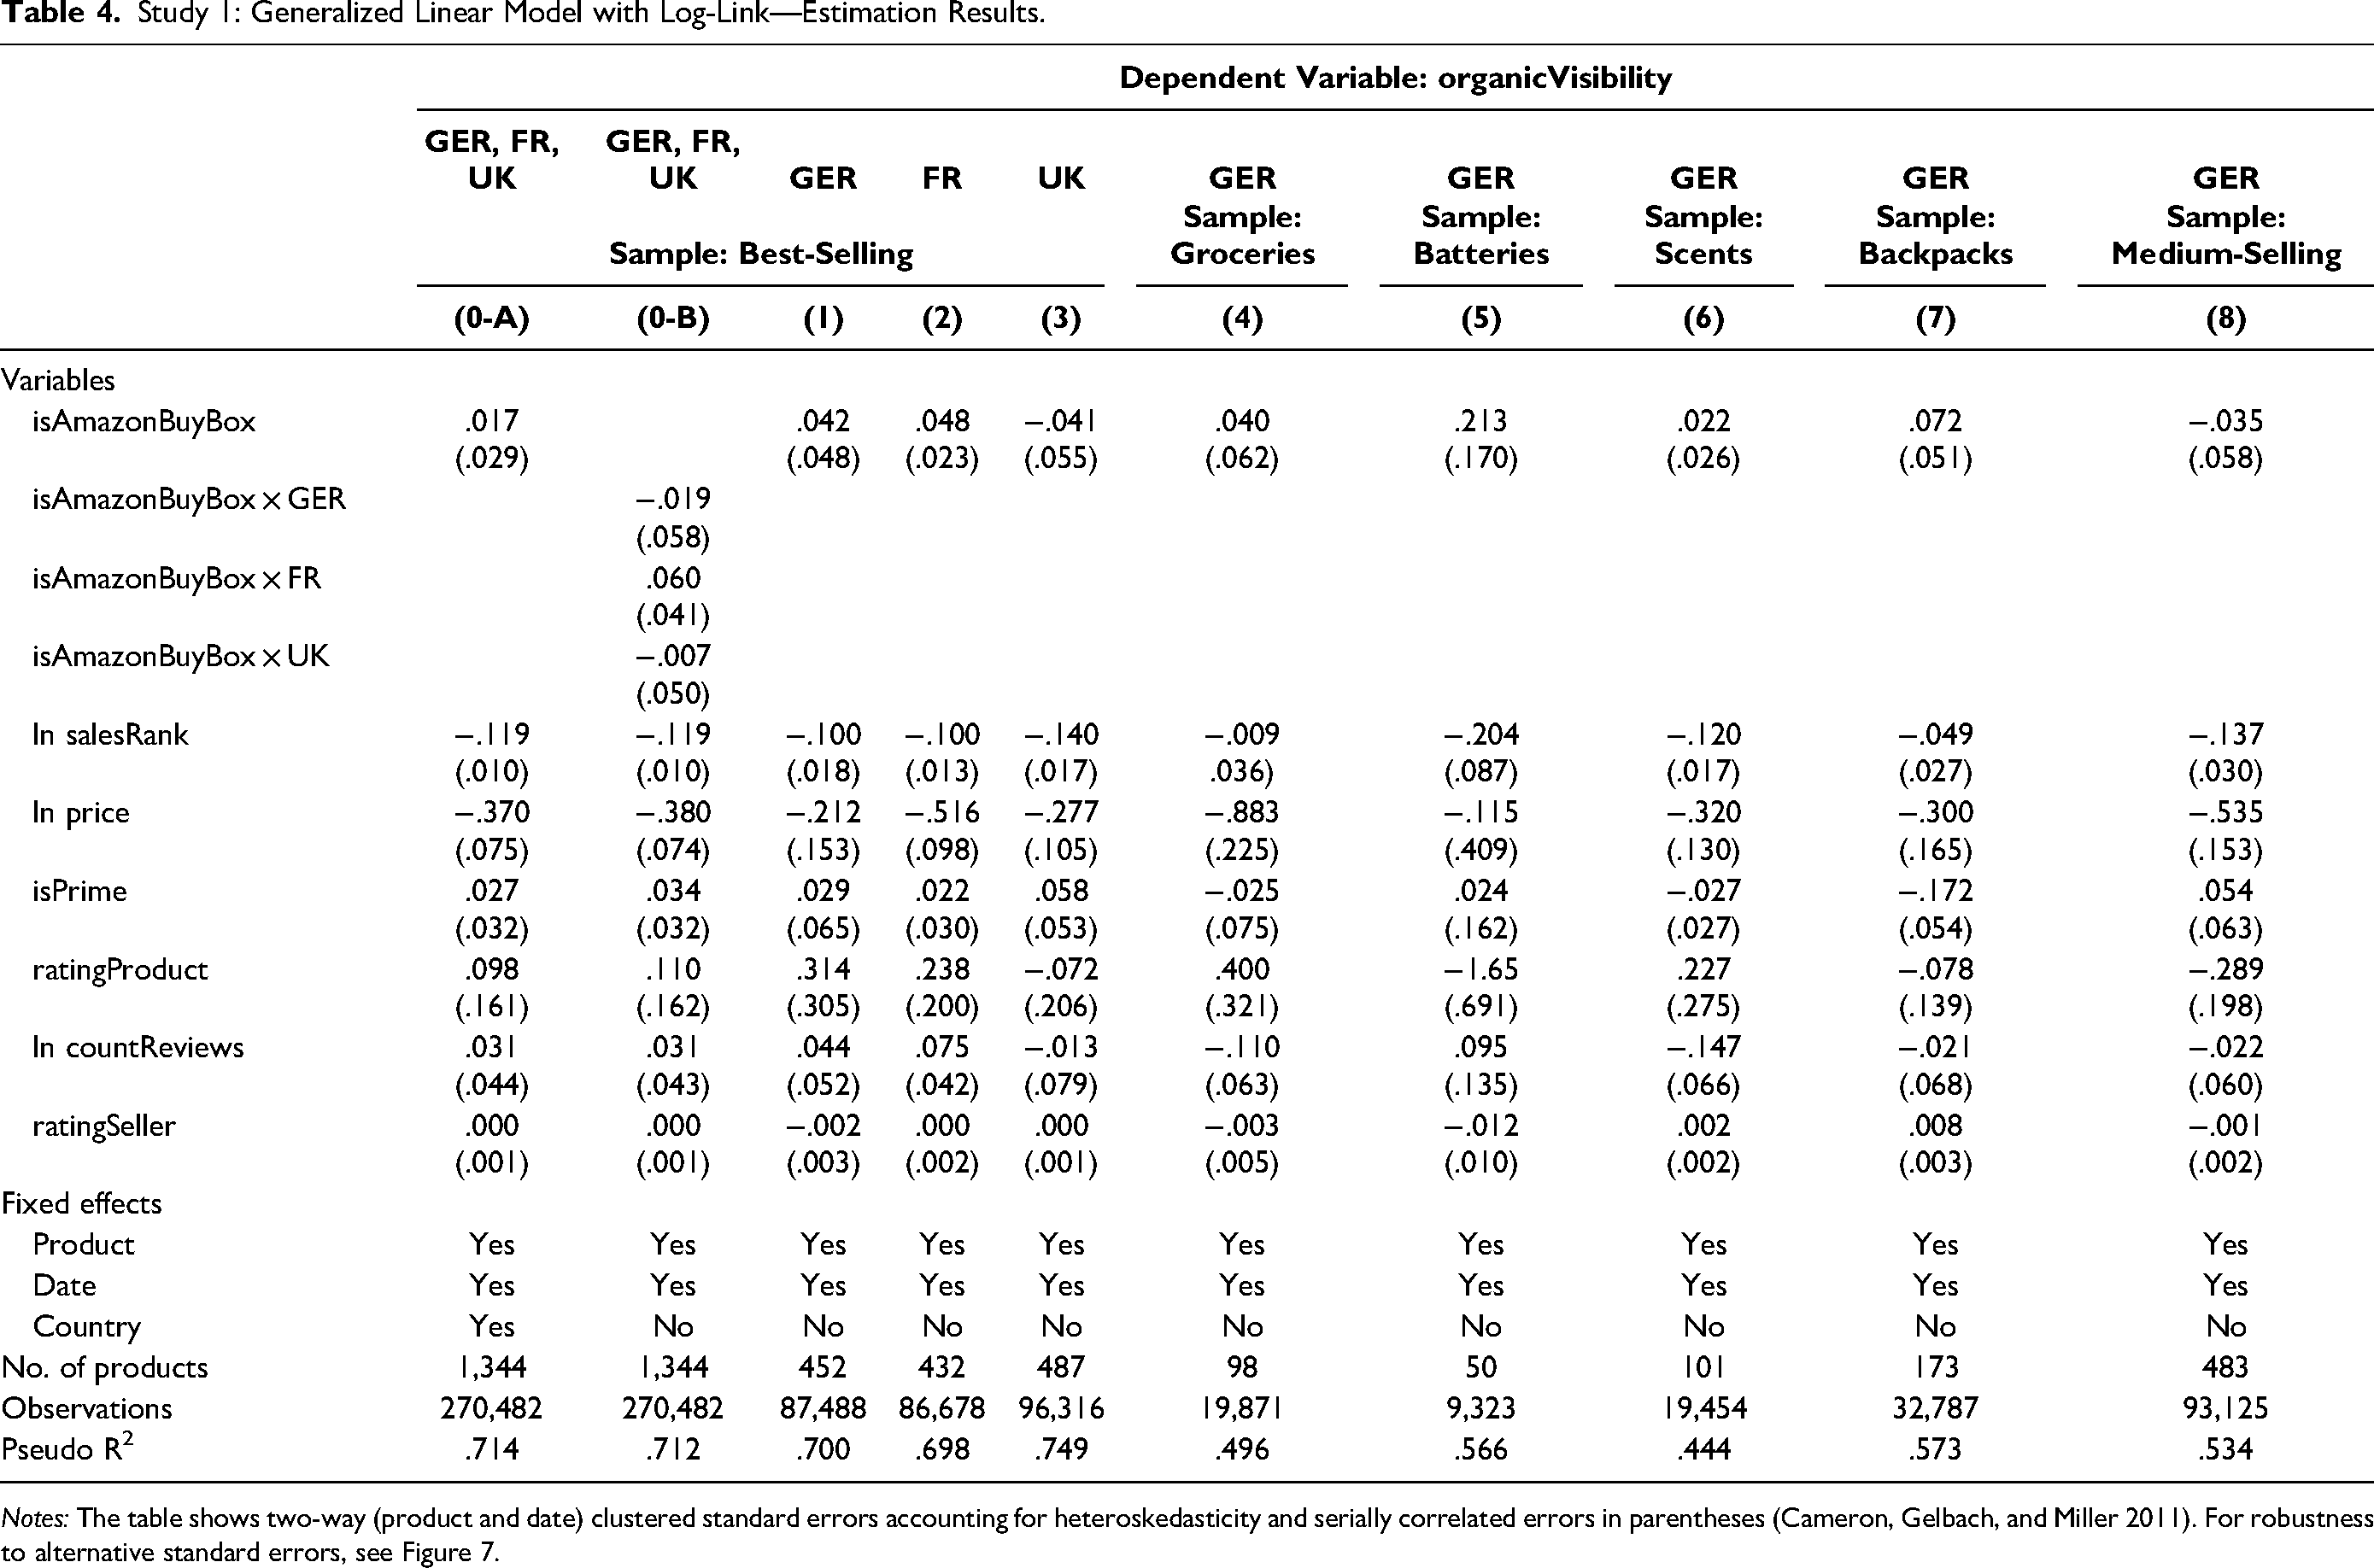
Notes: The table shows two-way (product and date) clustered standard errors accounting for heteroskedasticity and serially correlated errors in parentheses (Cameron, Gelbach, and Miller 2011). For robustness to alternative standard errors, see Figure 7.
For the best-selling samples reported in Models 1–3 in Table 4, the value of the self-preferencing estimate is positive in the German and the French samples, and it is negative in the U.K. sample (Germany: 4.3%, p = .390; France: 4.9%, p = .039; United Kingdom: −4.0%, p = .457). Among these three samples, the self-preferencing coefficient significantly differs from zero (p < .05) only for the French sample. To decrease the probability of suffering a Type II error (incorrectly rejecting the null hypothesis) that influences our conclusions, we increase the number of observations by pooling the three best-selling samples and then estimating the self-preferencing coefficient in Model 0-A. This estimate is also statistically indistinguishable from zero at 1.7% (p = .567). Further, the country-specific self-preferencing estimates in Model 0-B exhibit high p-values, making identifying a nonzero effect unlikely (Germany: p = .749; France: p = .139; United Kingdom: p = .894).
For each of the four product-specific samples from the German marketplace, the value of the self-preferencing coefficient estimate is positive, ranging between 2.3% (scents) and 23.7% (batteries). For the medium-selling sample, the coefficient is slightly negative (−3.4%). However, all estimates are statistically indistinguishable from zero at p > .1.
The positive and significant self-preferencing coefficient for the best-selling sample from France may suggest self-preferenced search results. Nevertheless, since only one out of nine estimates is significantly positive, this analysis provides only very weak evidence that the platform provider's search results prefer products for which it also occupies the buy box.
Heterogeneity analysis: self-preferencing estimates by product category and country
The preceding analysis identifies the mean self-preferencing estimate for each sample and finds only one positive estimate. However, this estimate might mask considerable heterogeneity across our sample's different categories, which include products from almost all of Amazon's broadest root categories. Hence, we implement a category- and country-level heterogeneity analysis on the best-selling samples.
Methodologically, we adapt the main model defined in Equation 7 by including an interaction term, isAmazonBuyBox × Category, instead of the sole isAmazonBuyBox indicator. Similarly to the main analysis, we estimate this equation for each best-selling sample from Germany, France, and the United Kingdom. Then, we interpret the resulting coefficient of the interaction term as the category-specific self-preferencing estimate.
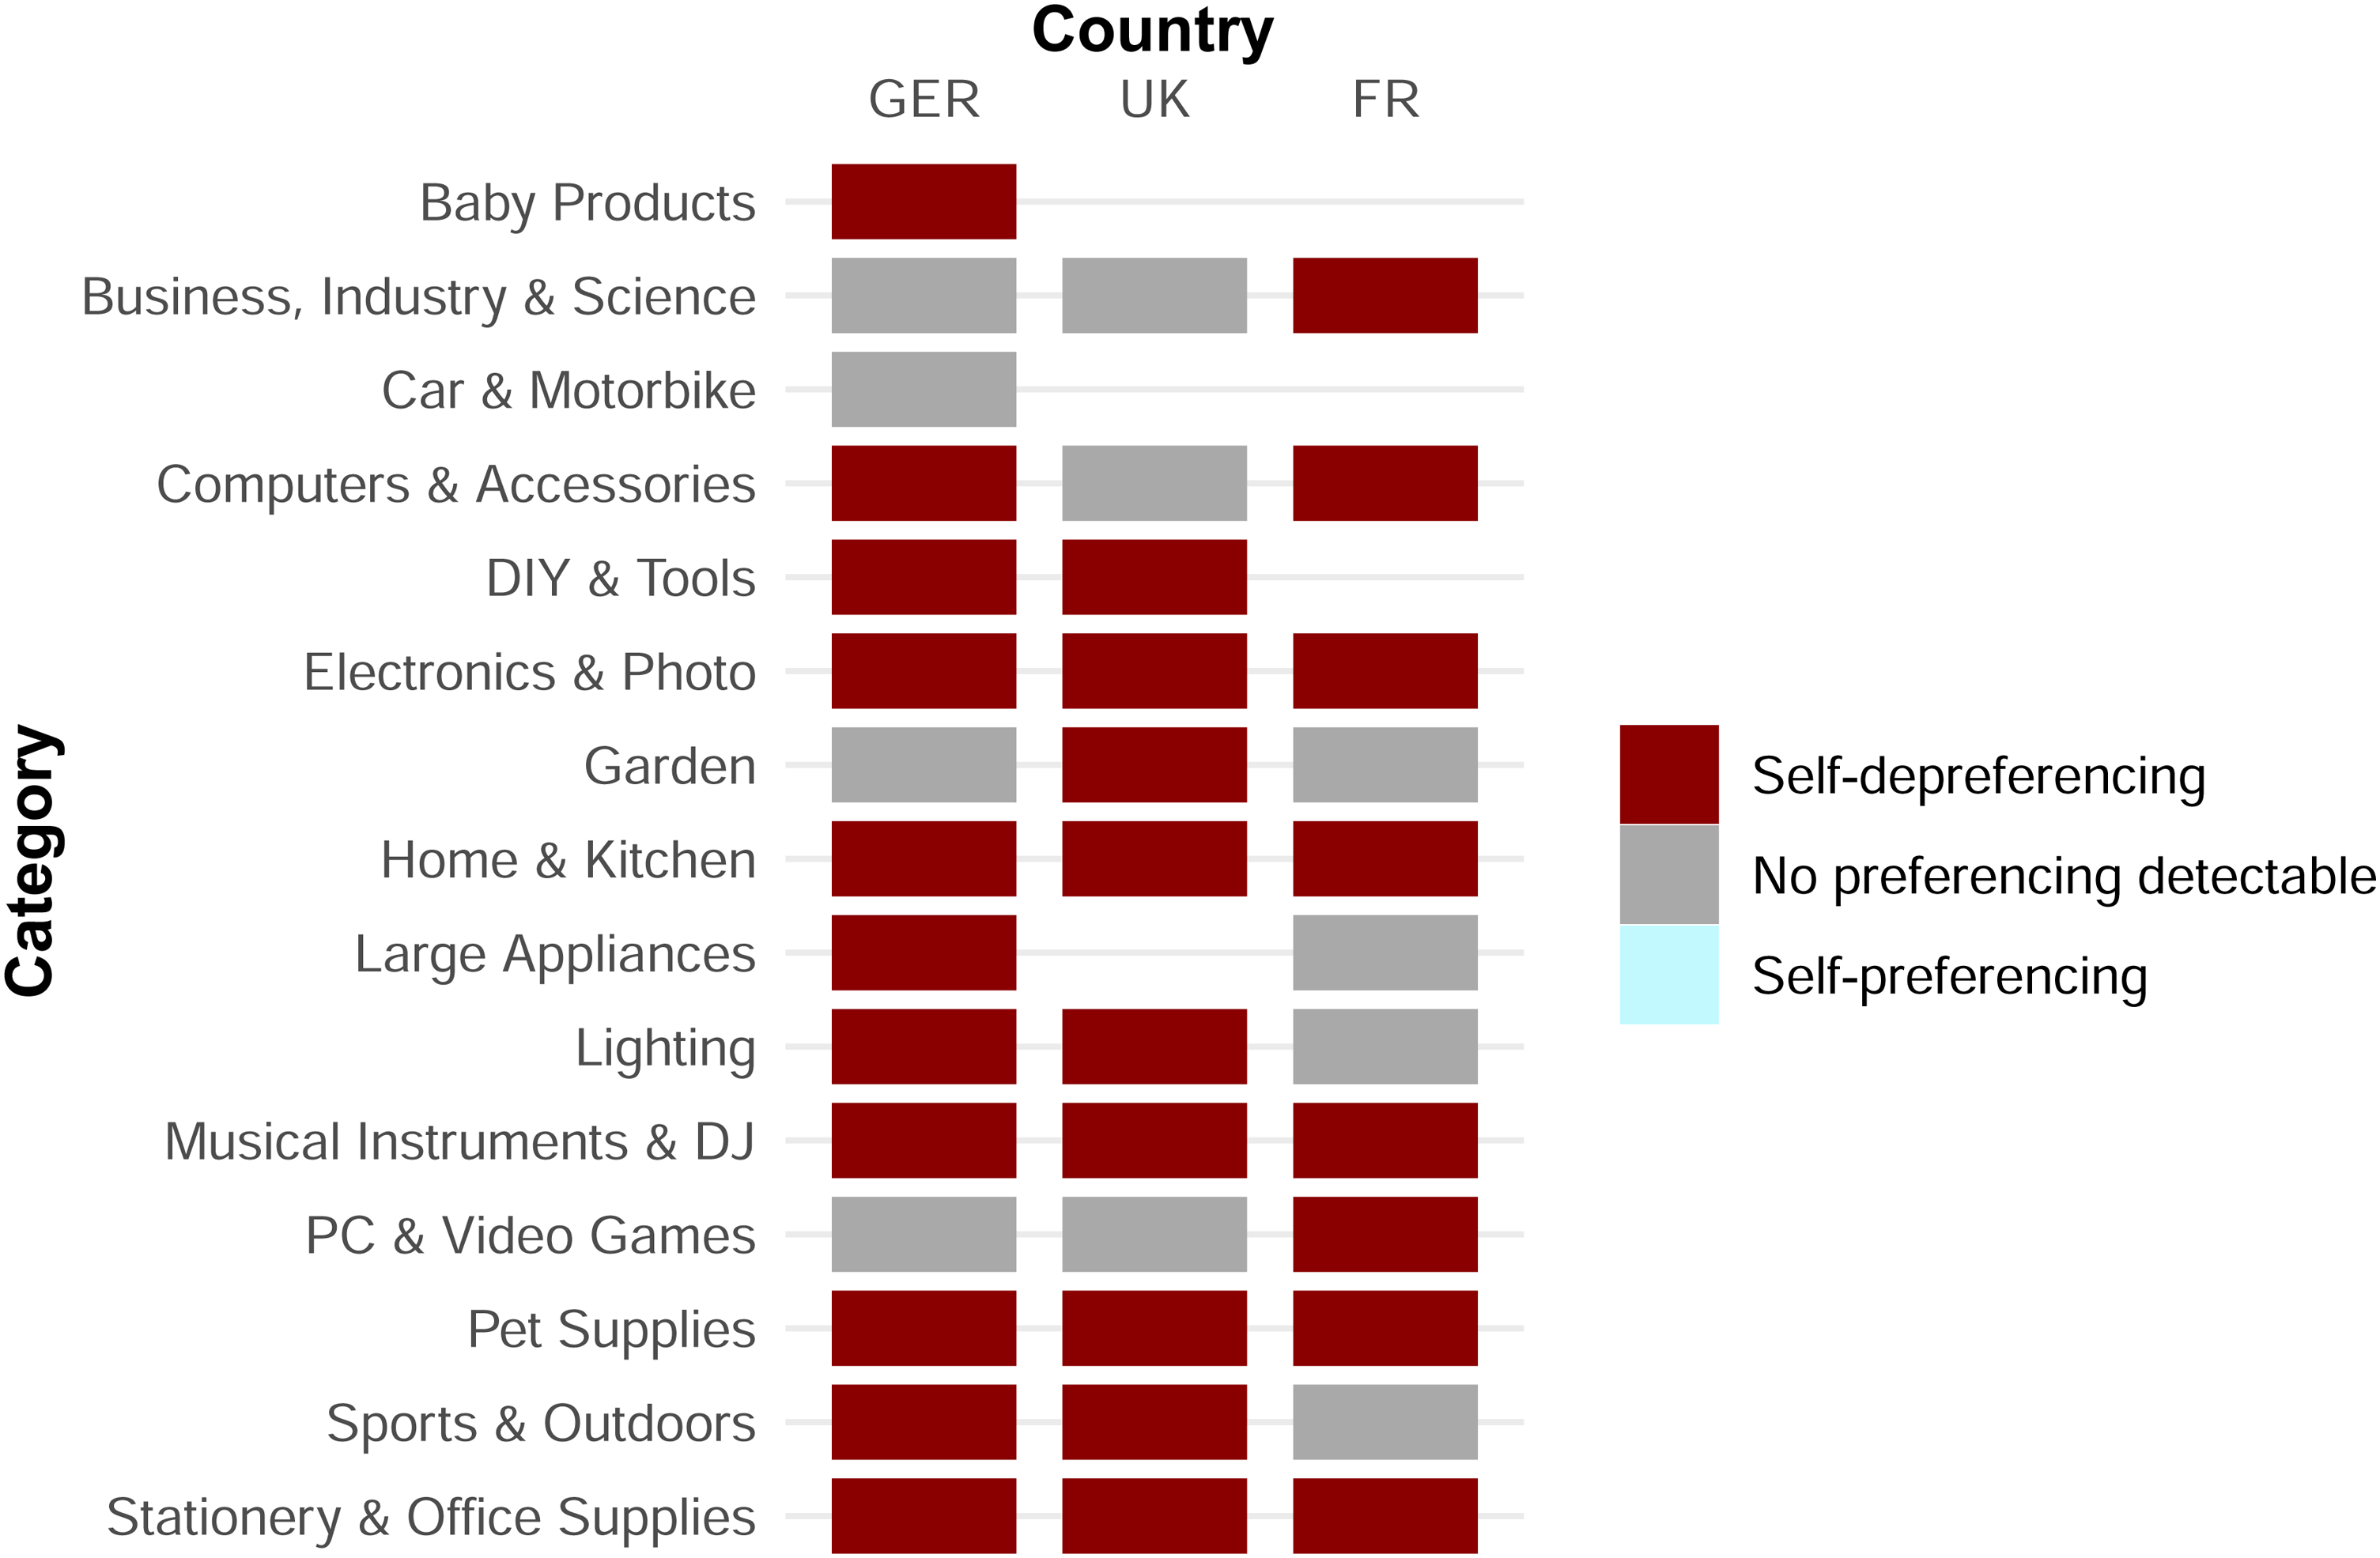
Figure 3 summarizes the results of this heterogeneity analysis. For each category in the three countries, Figure 3 shows whether we can identify self-preferencing, self-depreferencing, or neither.
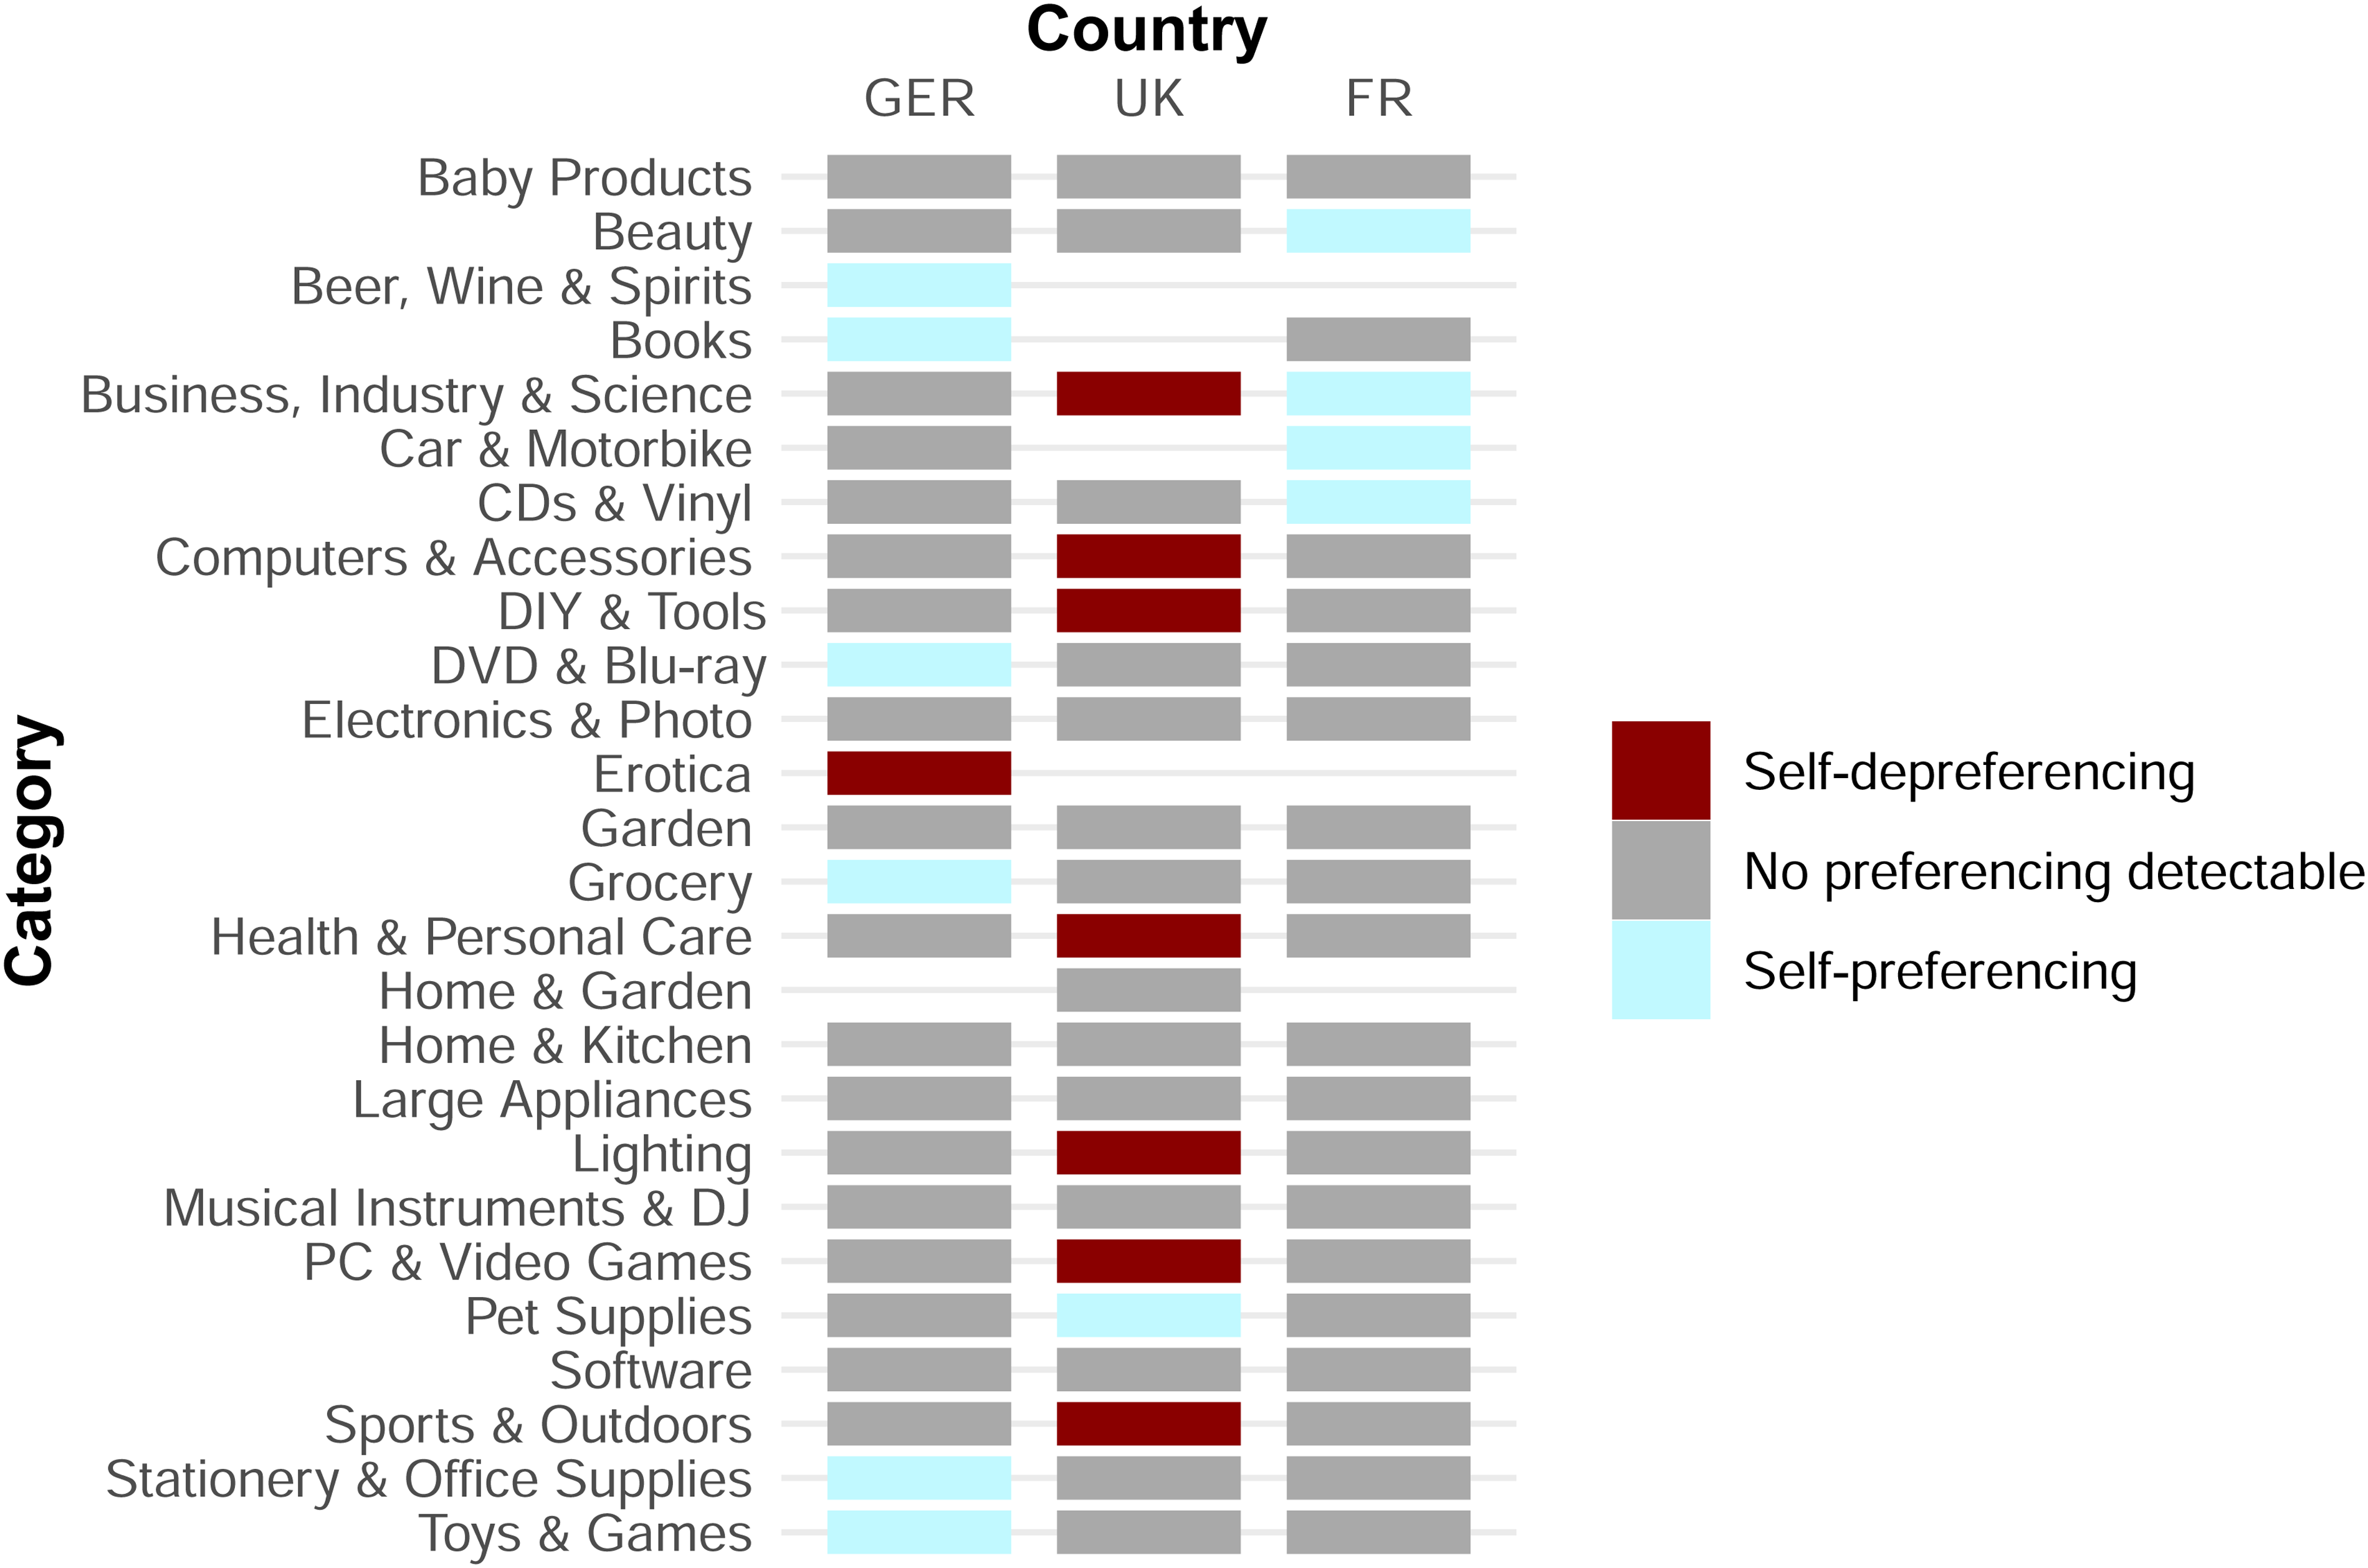
Heterogeneity Analysis: Self-Preferencing Estimate by Country and Category (Best-Selling Samples).
While the results mirror the main analysis by not identifying a self-preferencing estimate different from zero in most categories, there are several exceptions. In 11 category-country combinations, we identify self-preferencing. Eight country-category combinations exhibit self-depreferencing. On the German marketplace, we identify self-preferencing through the search results on the German marketplace in the “Beer, Wine & Spirits,” “Books,” “DVD & Blu Ray,” “Grocery,” “Stationery & Office Supplies,” and “Toys & Games” categories. In the United Kingdom, we identify self-preferencing in only a single category: “Pet Supplies.” Four categories in the French marketplace exhibit a preference for first-party offerings, specifically the “Beauty,” “Business, Industry & Science,” “Car & Motorbike,” and “CDs & Vinyl” categories.
In contrast, we do not identify any self-depreferencing in France. At the same time, we estimate self-depreferencing in one category in Germany and seven categories in the United Kingdom.
As outlined previously, the incentive for Amazon to engage in self-preferencing or even self-depreferencing might depend on whether selling a third-party product generates a higher profit than a first-party product. Since the size of the commissions for third-party sellers varies between 8% and 15% by category, we tested whether the commission relates to the degree of self-preferencing (Web Appendix B). The results of this analysis indicate, however, that the observed commission rates between 8% and 15% did not impact the degree of self-depreferencing.
Still, there might be other reasons why we find self-(de)preferencing in some categories. The platform could, for example, deploy self-(de)preferencing in categories where consumers positively react to such conduct. The platform's granular consumer behavior data might indicate that self-(de)preferencing only in those categories leads to a better outcome (from the platform's perspective—e.g., higher overall category sales). However, contrary to the hypothesis of the category commission influencing the degree of self-preferencing, testing this hypothesis would require detailed consumer-level data, which are unavailable to us.
We further note that while this heterogeneity analysis sheds additional light on potential category differences, we must interpret the results cautiously. Some categories in specific countries only include a low number of observations, so these estimates are noisy.
Study 2: Testing for Self-Preferencing in Private Label Product Competition
Whereas Study 1 looked at self-preferencing in retailer competition, Study 2 examines self-preferencing in product competition. Here, adopting a COO approach (see Web Appendix C for details on the OB approach), we compare the visibility of products exclusively sold by either the first party (Amazon) or third parties. In other words, we examine whether, after controlling for attributes that might influence search visibility, Amazon's private label products (here, Amazon Basics products) are more visible in search results on Amazon Marketplace compared with comparable third-party private label substitutes (subsequently referred to as “third-party products”).
Model
Study 2's model in Equation 8 is a slight modification of Study 1's model in Equation 7. Crucially, Study 2 uses isAmazonBasics—indicating whether a product is an Amazon Basics product—instead of isAmazonBuyBox as the first-party indicator. The corresponding coefficient δ estimates self-preferencing. Additionally, we replace the product-fixed effects with comparison-group-fixed effects ζj for each comparison group j. Each comparison group includes one Amazon Basics product and up to five similar competing private label products. All remaining variables are identical to those in Study 1.
Data, Sample Selection, and Descriptive Statistics
In constructing the sample for this study, we sought to create comparison groups of first-party products (here, Amazon Basics) and comparable products exclusively supplied by third-party sellers. As in Study 1, we collected data from the German (Amazon.de), British (Amazon.co.uk), and French (Amazon.fr) marketplaces.
We collected observations for all first-party products on each of the three Amazon Marketplace sites, for products first listed before 2020. That filter ensures we only compare reasonably well-established products within our observation period (May 27, 2020, to January 22, 2021). We dropped all products with an average sales rank greater than 50,000 to exclude infrequently sold products. Further, we excluded all products unavailable for more than 50% of our observation period.
Next, we identified comparable products from third parties for each first-party product in the dataset by following the procedure of Clara (2023). The platform (Amazon) categorizes products in a category tree, starting with approximately 30 broad root categories and becoming narrower with every node. Products that share the narrowest category are similar and represent close substitutes. For example, the category tree for the product Amazon Basics Waterproof Snow Gloves consists of the following six levels: Sports & Outdoors > Winter Sports > Skiing > Clothing > Men > Men's Ski Gloves. In this category tree, Sports & Outdoors is the broadest root category, and Men's Ski Gloves represents a very narrow subgroup of close substitutes.
For every Amazon Basics product, we obtained all third-party-supplied products from the product's narrowest subcategory that fulfilled the same selection criteria as the Amazon Basics products (first listing date, sales rank, and availability) and additionally had a single buy box seller that was not Amazon. Restricting the set to products with a single third-party buy box seller ensures that we only compare (Amazon vs. third party) private label products to each other, increasing those products’ comparability. Next, we created comparison groups consisting of a single Amazon Basics product and up to five private label substitutes. If a particular Amazon Basics product had more than five substitutes, we randomly sampled five from the larger set.
Our three samples collectively include 592,742 daily product-level observations, corresponding to 749 first-party products (Amazon Basics) and 2,478 third-party substitute products observed on T = 241 days from May 27, 2020, to January 22, 2021. Split by country, Study 2's sample includes 291 first-party products and their close substitutes (i.e., comparison groups) with 217,446 daily observations for Amazon.de, 238 comparison groups with 193,248 daily observations for Amazon.fr, and 223 comparison groups with 182,048 daily observations for Amazon.co.uk.
Table 5 displays detailed summary statistics for the observations. In this analysis, the first-party indicator variable isAmazonBasics, for which we estimate the self-preferencing coefficient δ, takes the value of 1 if the product is a first-party (Amazon Basics) product, and 0 if it is a third-party product.
Study 2: Summary Statistics for Amazon Basics Versus Third-Party Products.
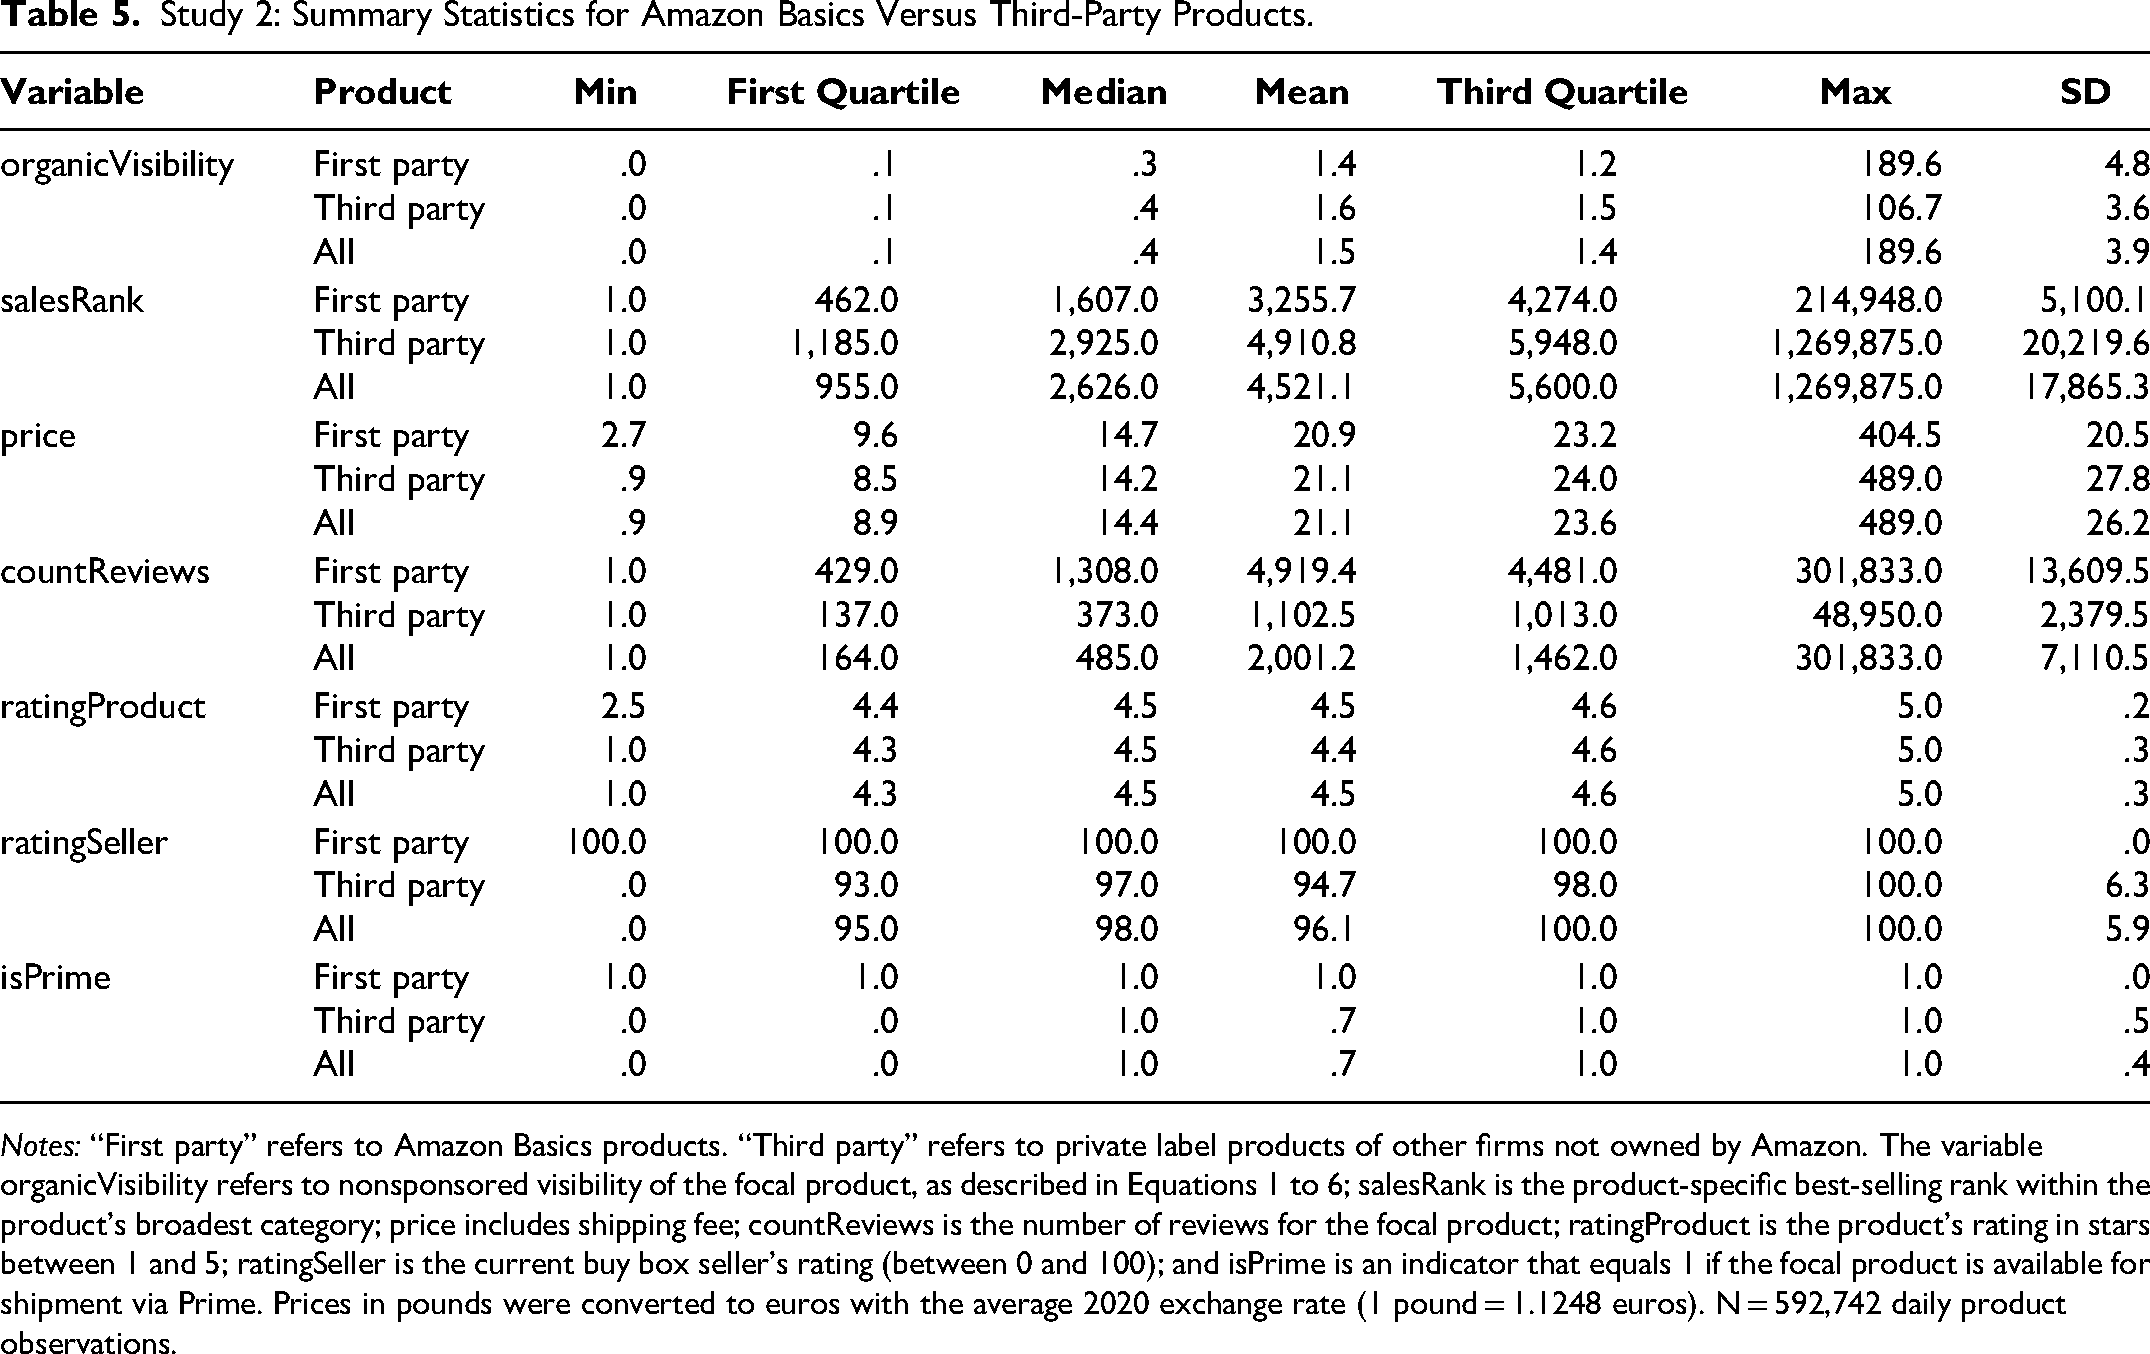
Notes: “First party” refers to Amazon Basics products. “Third party” refers to private label products of other firms not owned by Amazon. The variable organicVisibility refers to nonsponsored visibility of the focal product, as described in Equations 1 to 6; salesRank is the product-specific best-selling rank within the product's broadest category; price includes shipping fee; countReviews is the number of reviews for the focal product; ratingProduct is the product's rating in stars between 1 and 5; ratingSeller is the current buy box seller's rating (between 0 and 100); and isPrime is an indicator that equals 1 if the focal product is available for shipment via Prime. Prices in pounds were converted to euros with the average 2020 exchange rate (1 pound = 1.1248 euros). N = 592,742 daily product observations.
Table 5 shows that the first-party products’ mean organic search visibility is slightly below that of third parties’ comparable products (−9.6% over all three samples). This lower visibility for first-party products is notable because the first-party attributes are more attractive than those of third parties. First-party products exhibit a 33.7% lower sales rank (meaning they sold better) and are 1.0% cheaper than their substitutes (compare the average prices, €20.9 and €21.1). While first-party products receive a slightly higher rating than third-party products at 4.5 versus 4.4 stars, the former products have 4.5 times as many reviews as their close third-party competitors (4,919.4 vs. 1,102.5). Thus—in the aggregate view—these descriptive statistics already preempt the self-preferencing tests’ results: Even though the first-party products are more attractive across all considered variables, they receive worse visibility than third-party products. Thus, we can expect our preceding analysis to identify self-depreferencing.
Results
Self-preferencing estimates by country
Table 6 presents the detailed estimation results of Equation 8. We visualize and compare the point estimates and associated 95% confidence intervals of the self-preferencing estimate
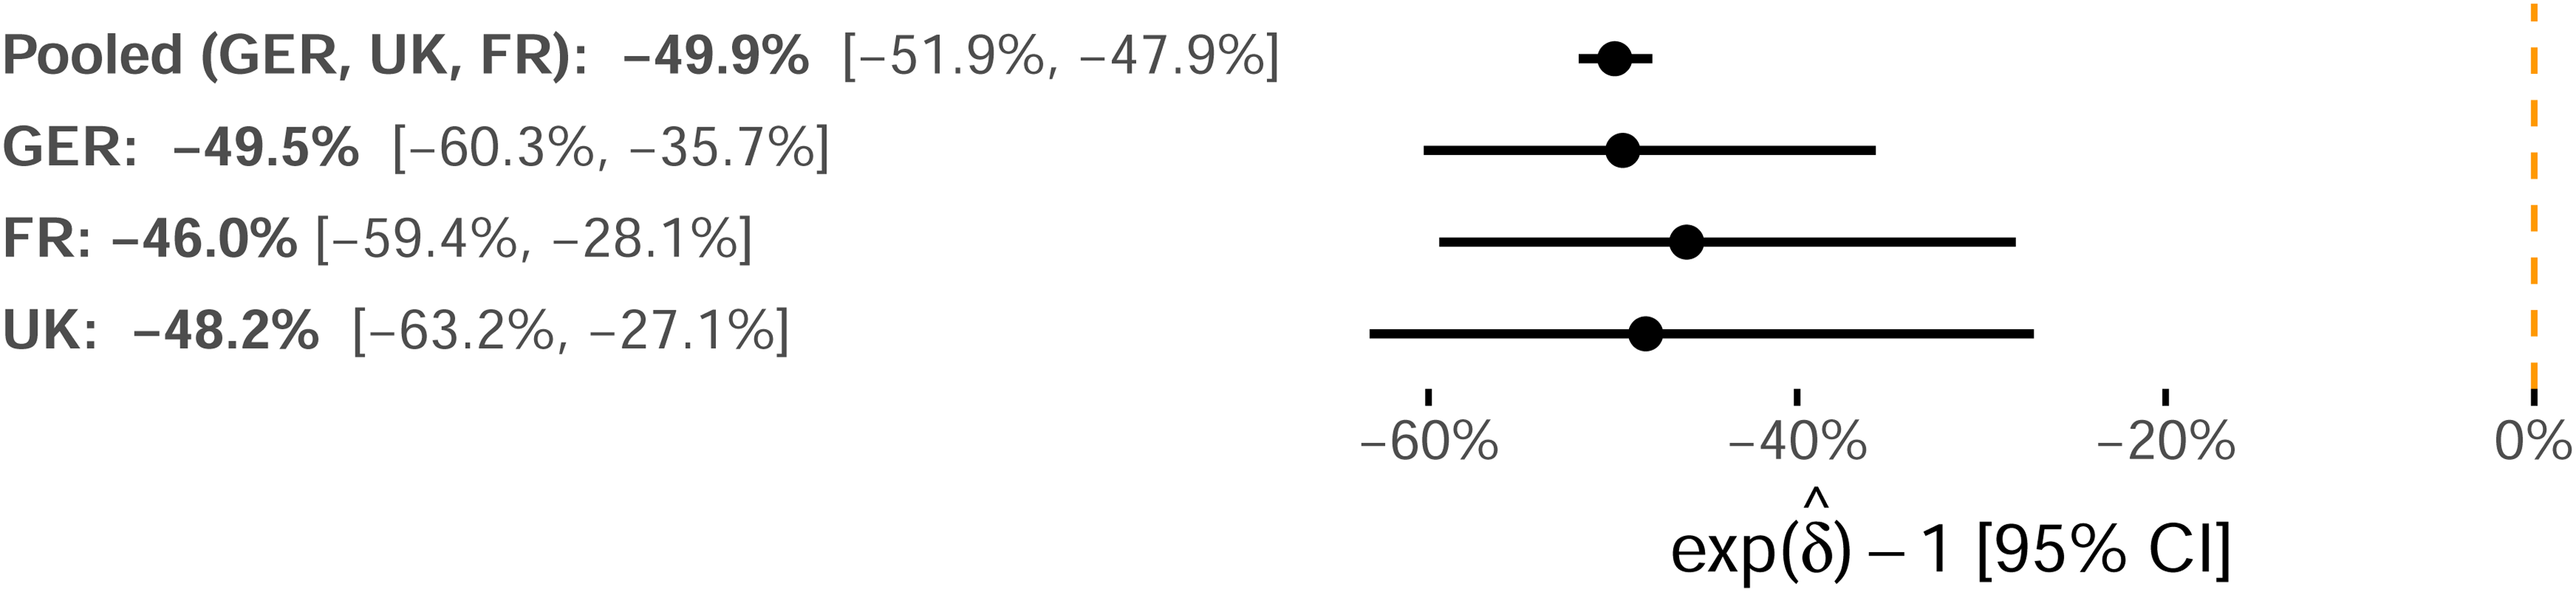
Study 2: Self-Preferencing Point Estimates for the Amazon Basics Indicator Variable and 95% Confidence Intervals.
Study 2: Generalized Linear Model with Log-Link—Estimation Results.
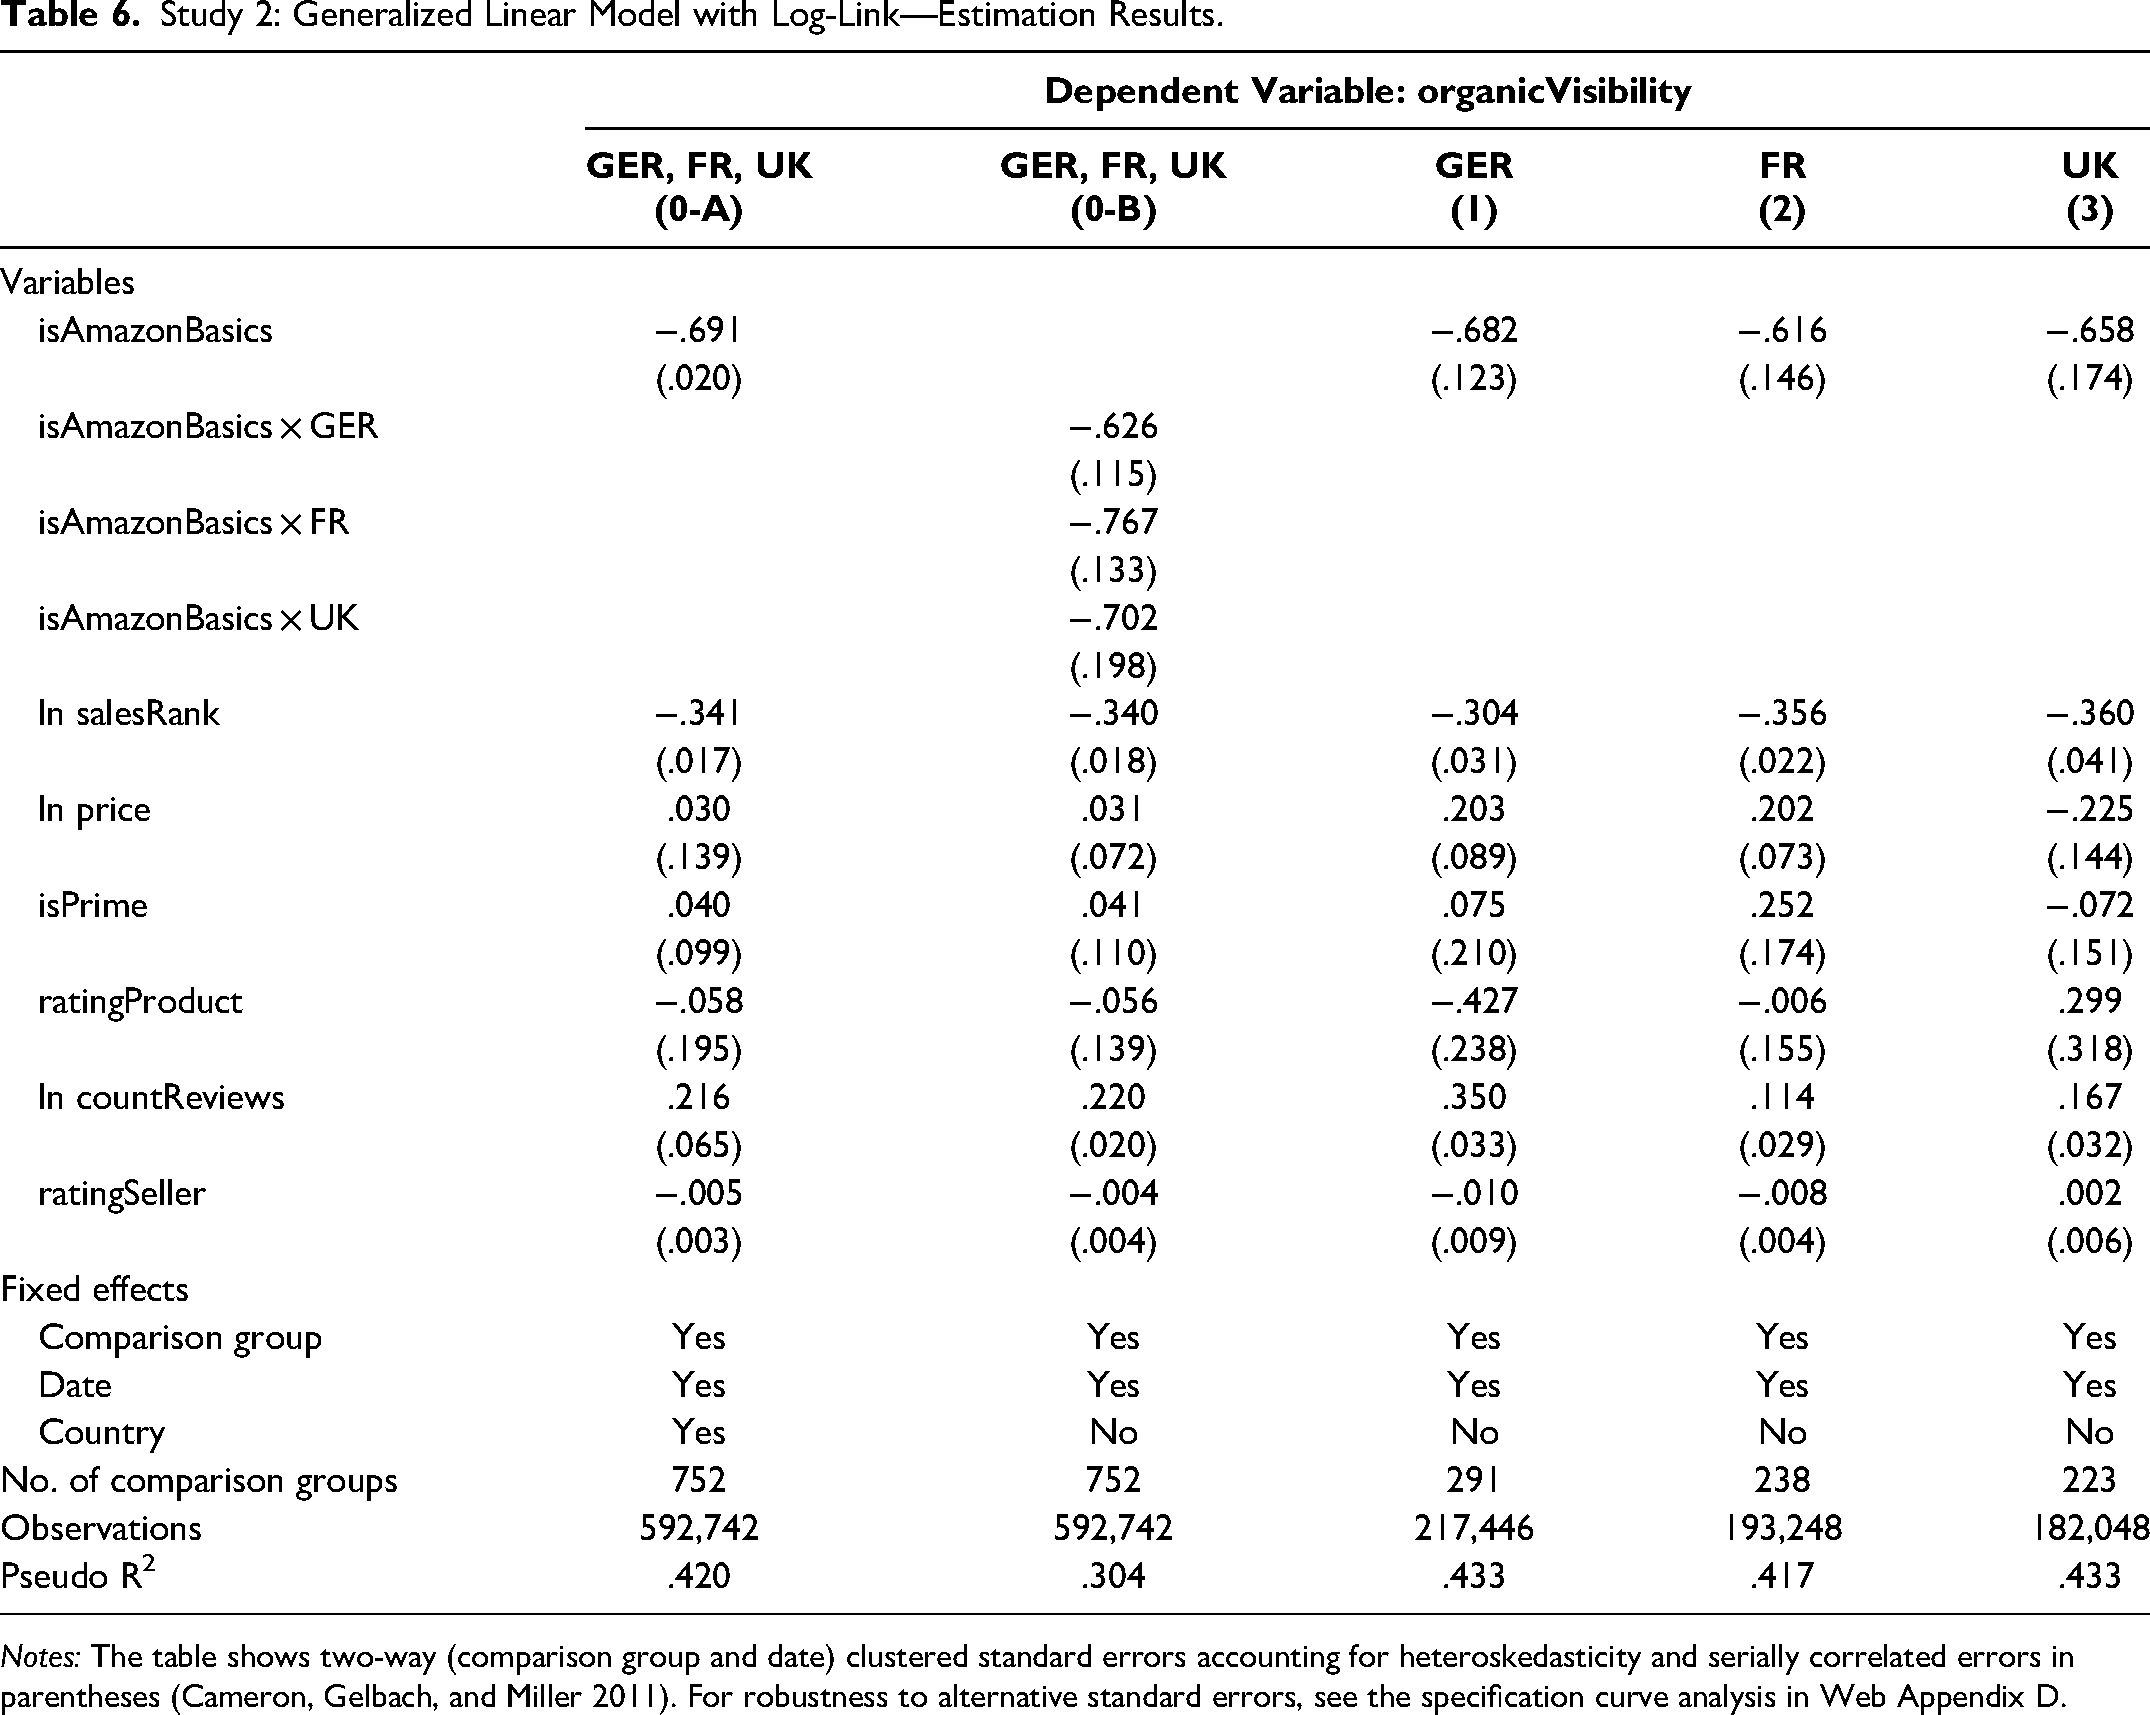
Notes: The table shows two-way (comparison group and date) clustered standard errors accounting for heteroskedasticity and serially correlated errors in parentheses (Cameron, Gelbach, and Miller 2011). For robustness to alternative standard errors, see the specification curve analysis in Web Appendix D.
Models 1–3 yield self-preferencing coefficient estimates for δ ranging from
The validity of Study 2 rests on the assumption that all the first-party and third-party products in a comparison group are indeed comparable. Stated differently, if we could estimate product fixed effects in addition to the observed attributes (e.g., product reviews, seller reviews, price), their values should be equal for all products in a category. Unfortunately, we cannot do so while also estimating the coefficient for isAmazonBasics.
What we can do, however, is vary the set of comparison groups to test if the results hold when excluding those comparison groups that could be suspected to differ in unobserved attributes. We do so in Web Appendix E, where we exclude comparison groups for which the first-party product's mean organic visibility differs to a varying degree from the mean of the respective third-party competitors’ products. The results remain consistent for all possible thresholds, providing reassurance that the products in the comparison groups are reasonably similar or that any potential difference does not affect the study's conclusions.
Heterogeneity analysis: self-preferencing estimates by product category
Similarly to the heterogeneity analysis in Study 1, we proceed by testing for self-preferencing in the individual categories for Study 2. Thus, we adapt the model from Study 2's main analysis by replacing the isAmazonBasics indicator with the isAmazonBasics × Category interaction term. Figure 5 summarizes the results for each country-category combination. The results from this heterogeneity analysis mirror the main results: In most country-category combinations, we estimate self-depreferencing, and we cannot identify self-preferencing in a single case. In the remaining cases, we cannot identify statistically significant preferencing (p > .05).
Heterogeneity Analysis: Self-Preferencing Estimate by Country and Category.
Robustness of the Results
Robustness to Omitted Variable Bias
Our COO-based approach to detecting self-preferencing requires that we account for all attributes that influence visibility and correlate with the first-party indicator. In our two studies on Amazon Marketplace, we used two strategies to avoid missing an attribute. First, we matched our observable attributes to Amazon's own disclosure of attributes influencing the search results, disclosed in response to the European Union's platform-to-business regulation (Amazon 2022; European Parliament 2019). Second, we used a consumer survey to identify product attributes influencing consumer choice and considered these attributes in our analysis.
Despite these efforts, there remains a possibility that we have overlooked a relevant attribute. Therefore, we adopt two strategies to support the robustness of our conclusions. First, we compare the results of our COO analysis with those obtained with the alternative OB test for self-preferencing (Reimers and Waldfogel 2023), which relies on different assumptions and is less sensitive to omitted variable bias (Web Appendix E). The results of this alternative test provide no evidence of self-preferencing, thus supporting our main result.
Second, in Web Appendix F we assess under which conditions an omitted variable could change our conclusions from “finding no evidence for self-preferencing” to “finding evidence for self-preferencing.” The results indicate that only an omitted variable representing an “Amazon disadvantage,” that is, a variable that is worse for Amazon's products but positively influences visibility, could threaten our conclusion because it would positively bias our self-preferencing estimate. However, because of Amazon's reputation for high-quality customer service and logistics, such an omitted variable is unlikely. In contrast, omitting a variable representing an “Amazon advantage” would bias our self-preferencing estimate negatively. Because we estimate insignificant (Study 1) or negative (Study 2) self-preferencing coefficients, an additional negative bias would not change our conclusion of finding little evidence for self-preferencing.
Robustness to Alternative Model Specifications
Beyond suffering from omitted variable bias, the choice of model specifications might affect the conclusion of our analysis. We assess the robustness of our findings to these choices by implementing a specification curve analysis (Simonsohn, Simmons, and Nelson 2020). Specifically, we estimate all model specifications resulting from the following alternatives:
The self-preferencing test (COO or OB test), The model and transformation of the dependent variable (ordinary least squares [OLS] and level, OLS and log(y), Poisson and level), The fixed effects (for Study 1: date, product, or date and product; for Study 2: date, comparison group, or date and comparison group), The assumed seller rating of Amazon (0, 20, 40, 60, 80, 100), The solution to having to take the natural logarithm of zero (+ .1, + 1, drop observations with 0), and The calculation of the standard errors (clustered by product in Study 1 and by comparison group in Study 2), heteroskedasticity-robust, or two-way clustered by product/comparison group and date).
All combinations of these alternatives yield 2 × 3 × 3 × 6 × 3 × 3 = 972 model specifications.
We present the detailed specification curve for the pooled best-selling sample of Study 1 in Figure 6. The upper panel plots the self-preferencing estimates resulting from each of the 972 models. It compares this distribution of estimates to the point estimate from the main specification (marked by the triangle and the horizontal bar). The lower panel indicates the model specification that led to the estimate in the upper panel. All estimates and choices are shaded to indicate the conclusion this model yields: a statistically significant (p < .05) self-preferencing estimate, a statistically significant (p < .05) self-depreferencing estimate, or an estimate statistically insignificantly different from zero (p > .05).
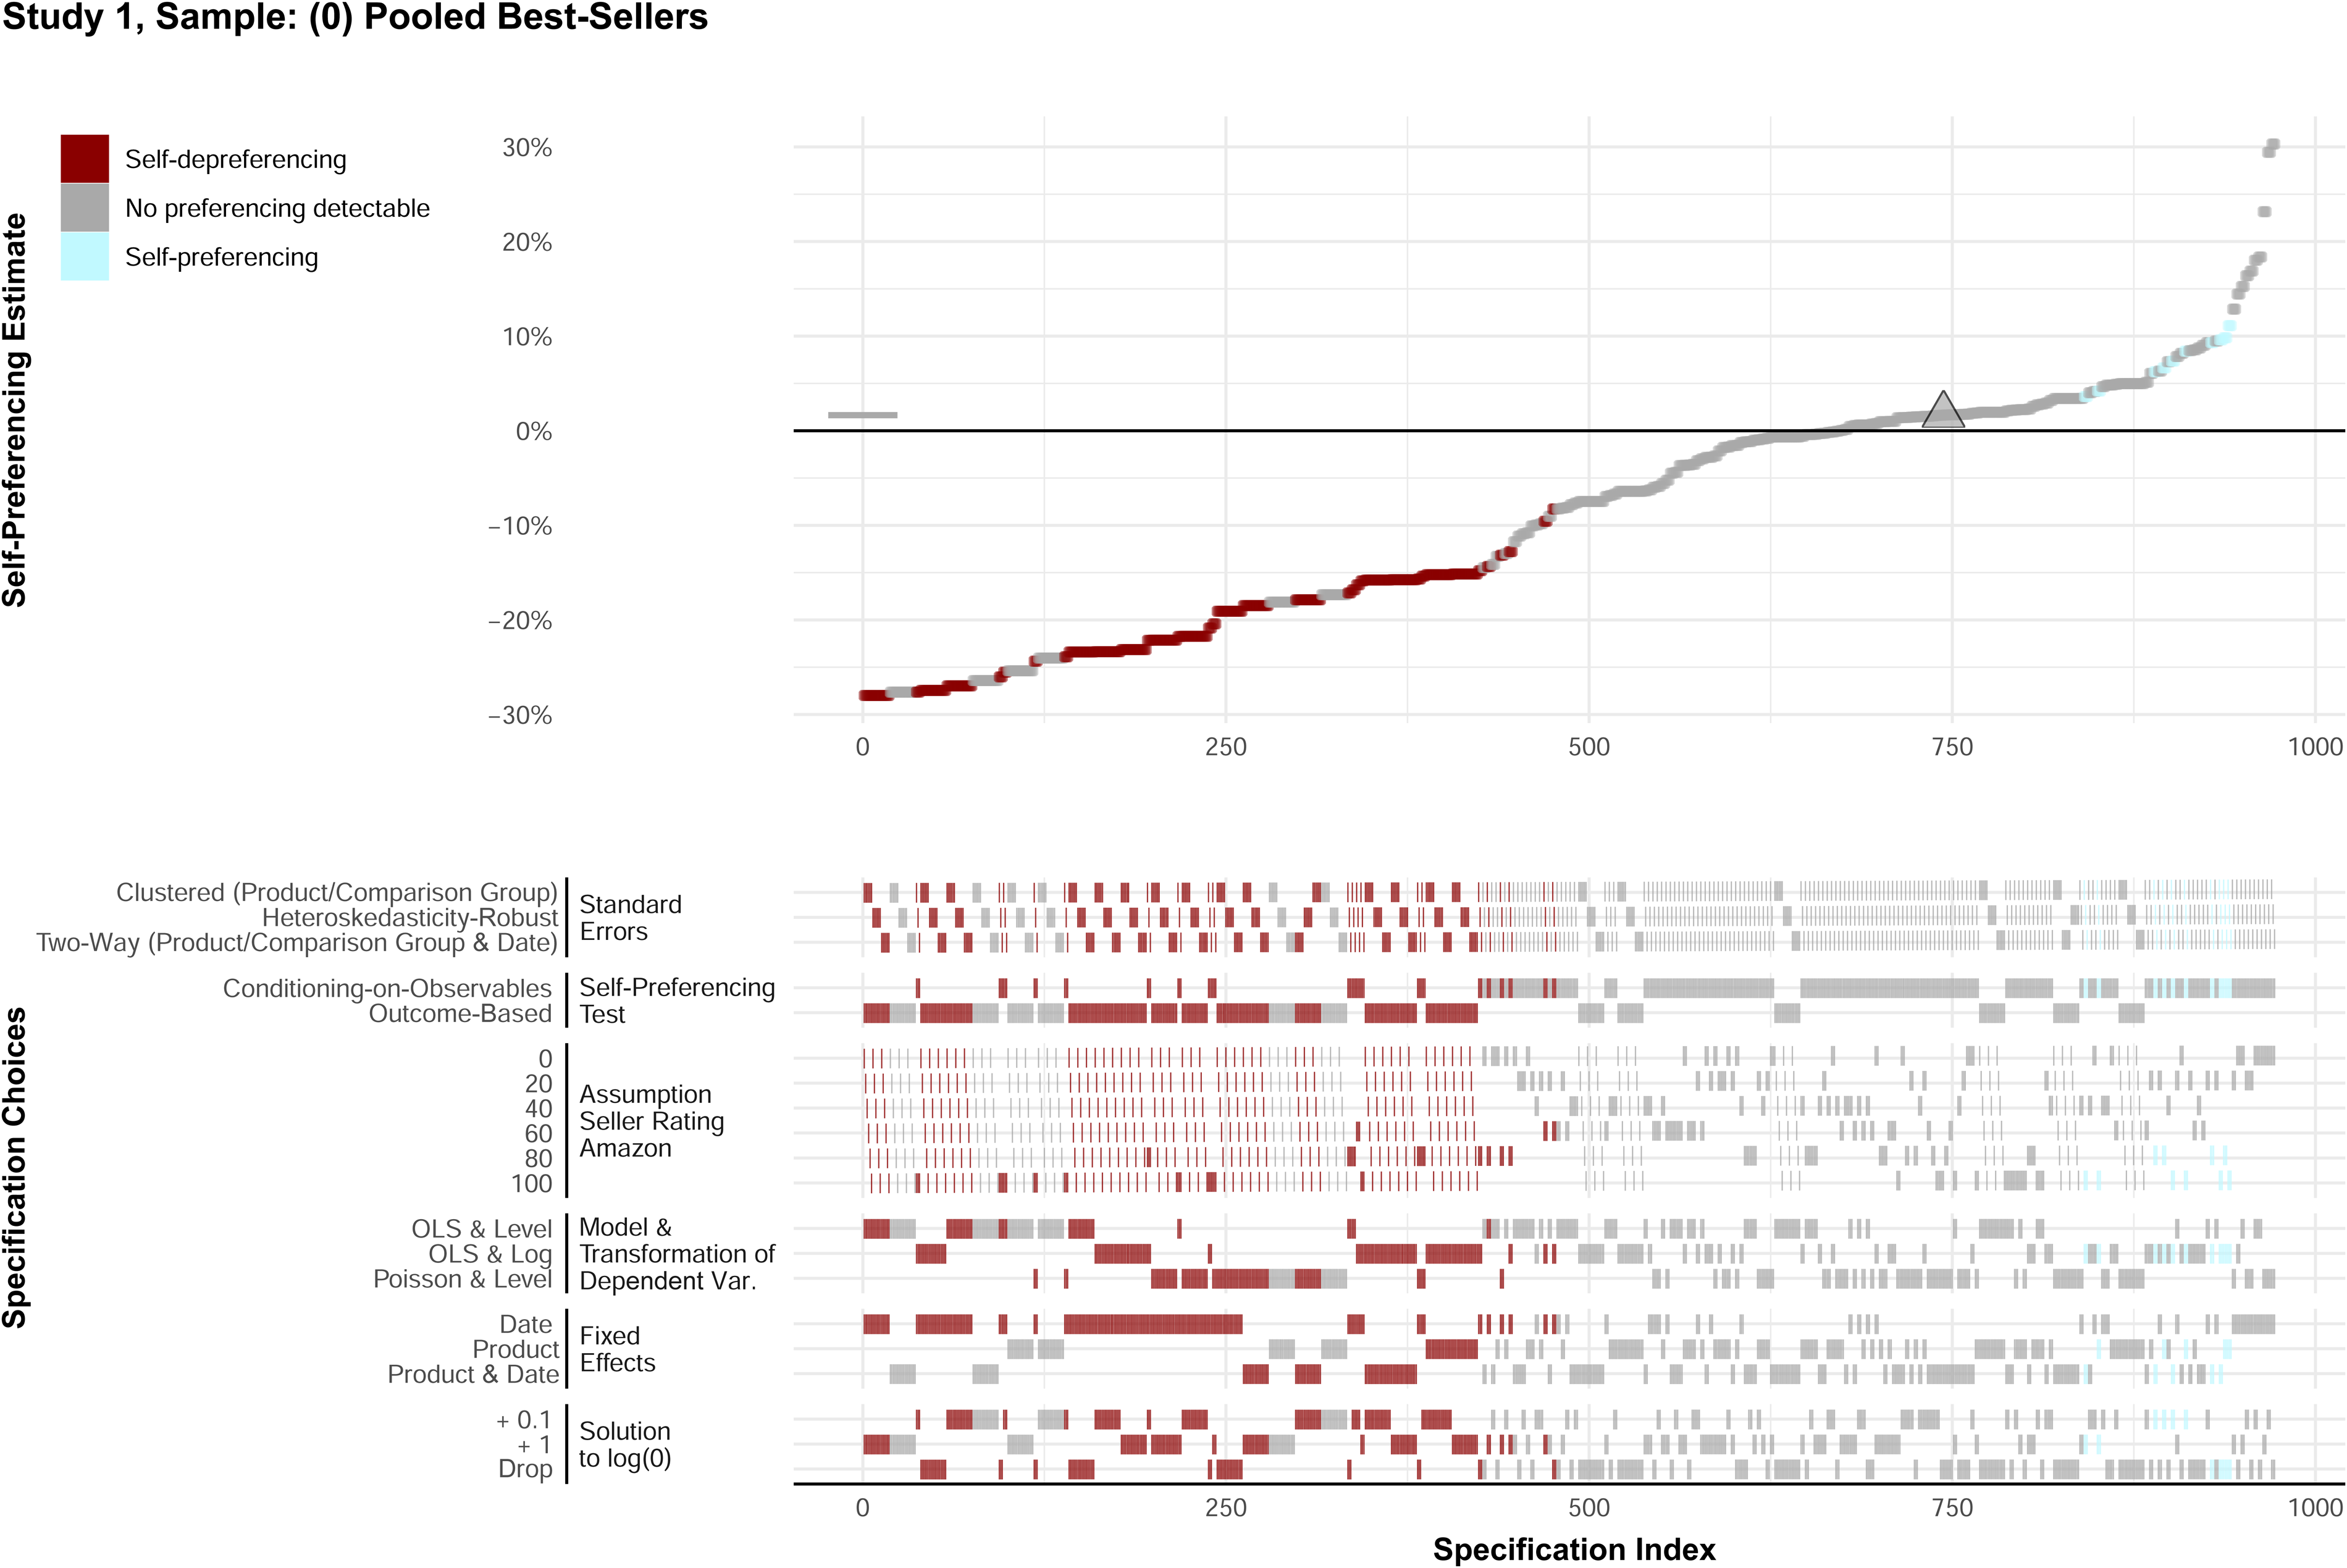
Study 1: Specification Curve for Pooled Best-Seller Sample.
The results highlight that more than 60% of the model specifications arrive at the same conclusion as our main specification: a self-preferencing estimate insignificantly different from zero. Additionally, very few model specifications (less than 5%) lead to statistically significant self-preferencing estimates, while the remainder of the models identify self-depreferencing. Hence, this distribution of self-preferencing estimates shows that the conclusion of our main analysis is in line with the distribution of self-preferencing estimates under alternative model specifications. This result increases the confidence in our main results.
We proceed by summarizing the results of the specification curve analysis in Figure 7 and Figure 8 for all other samples from Studies 1 and 2, respectively. (Web Appendix D displays the underlying distributions of self-preferencing estimates by model specification.) Each of the figures displays the share of model specifications that produce one of three types of self-preferencing estimates: statistically significantly negative or positive (p < .05) or statistically indistinguishable from zero (p > .05). Additionally, the triangle indicates the category to which the self-preferencing estimate from our main specification belongs.
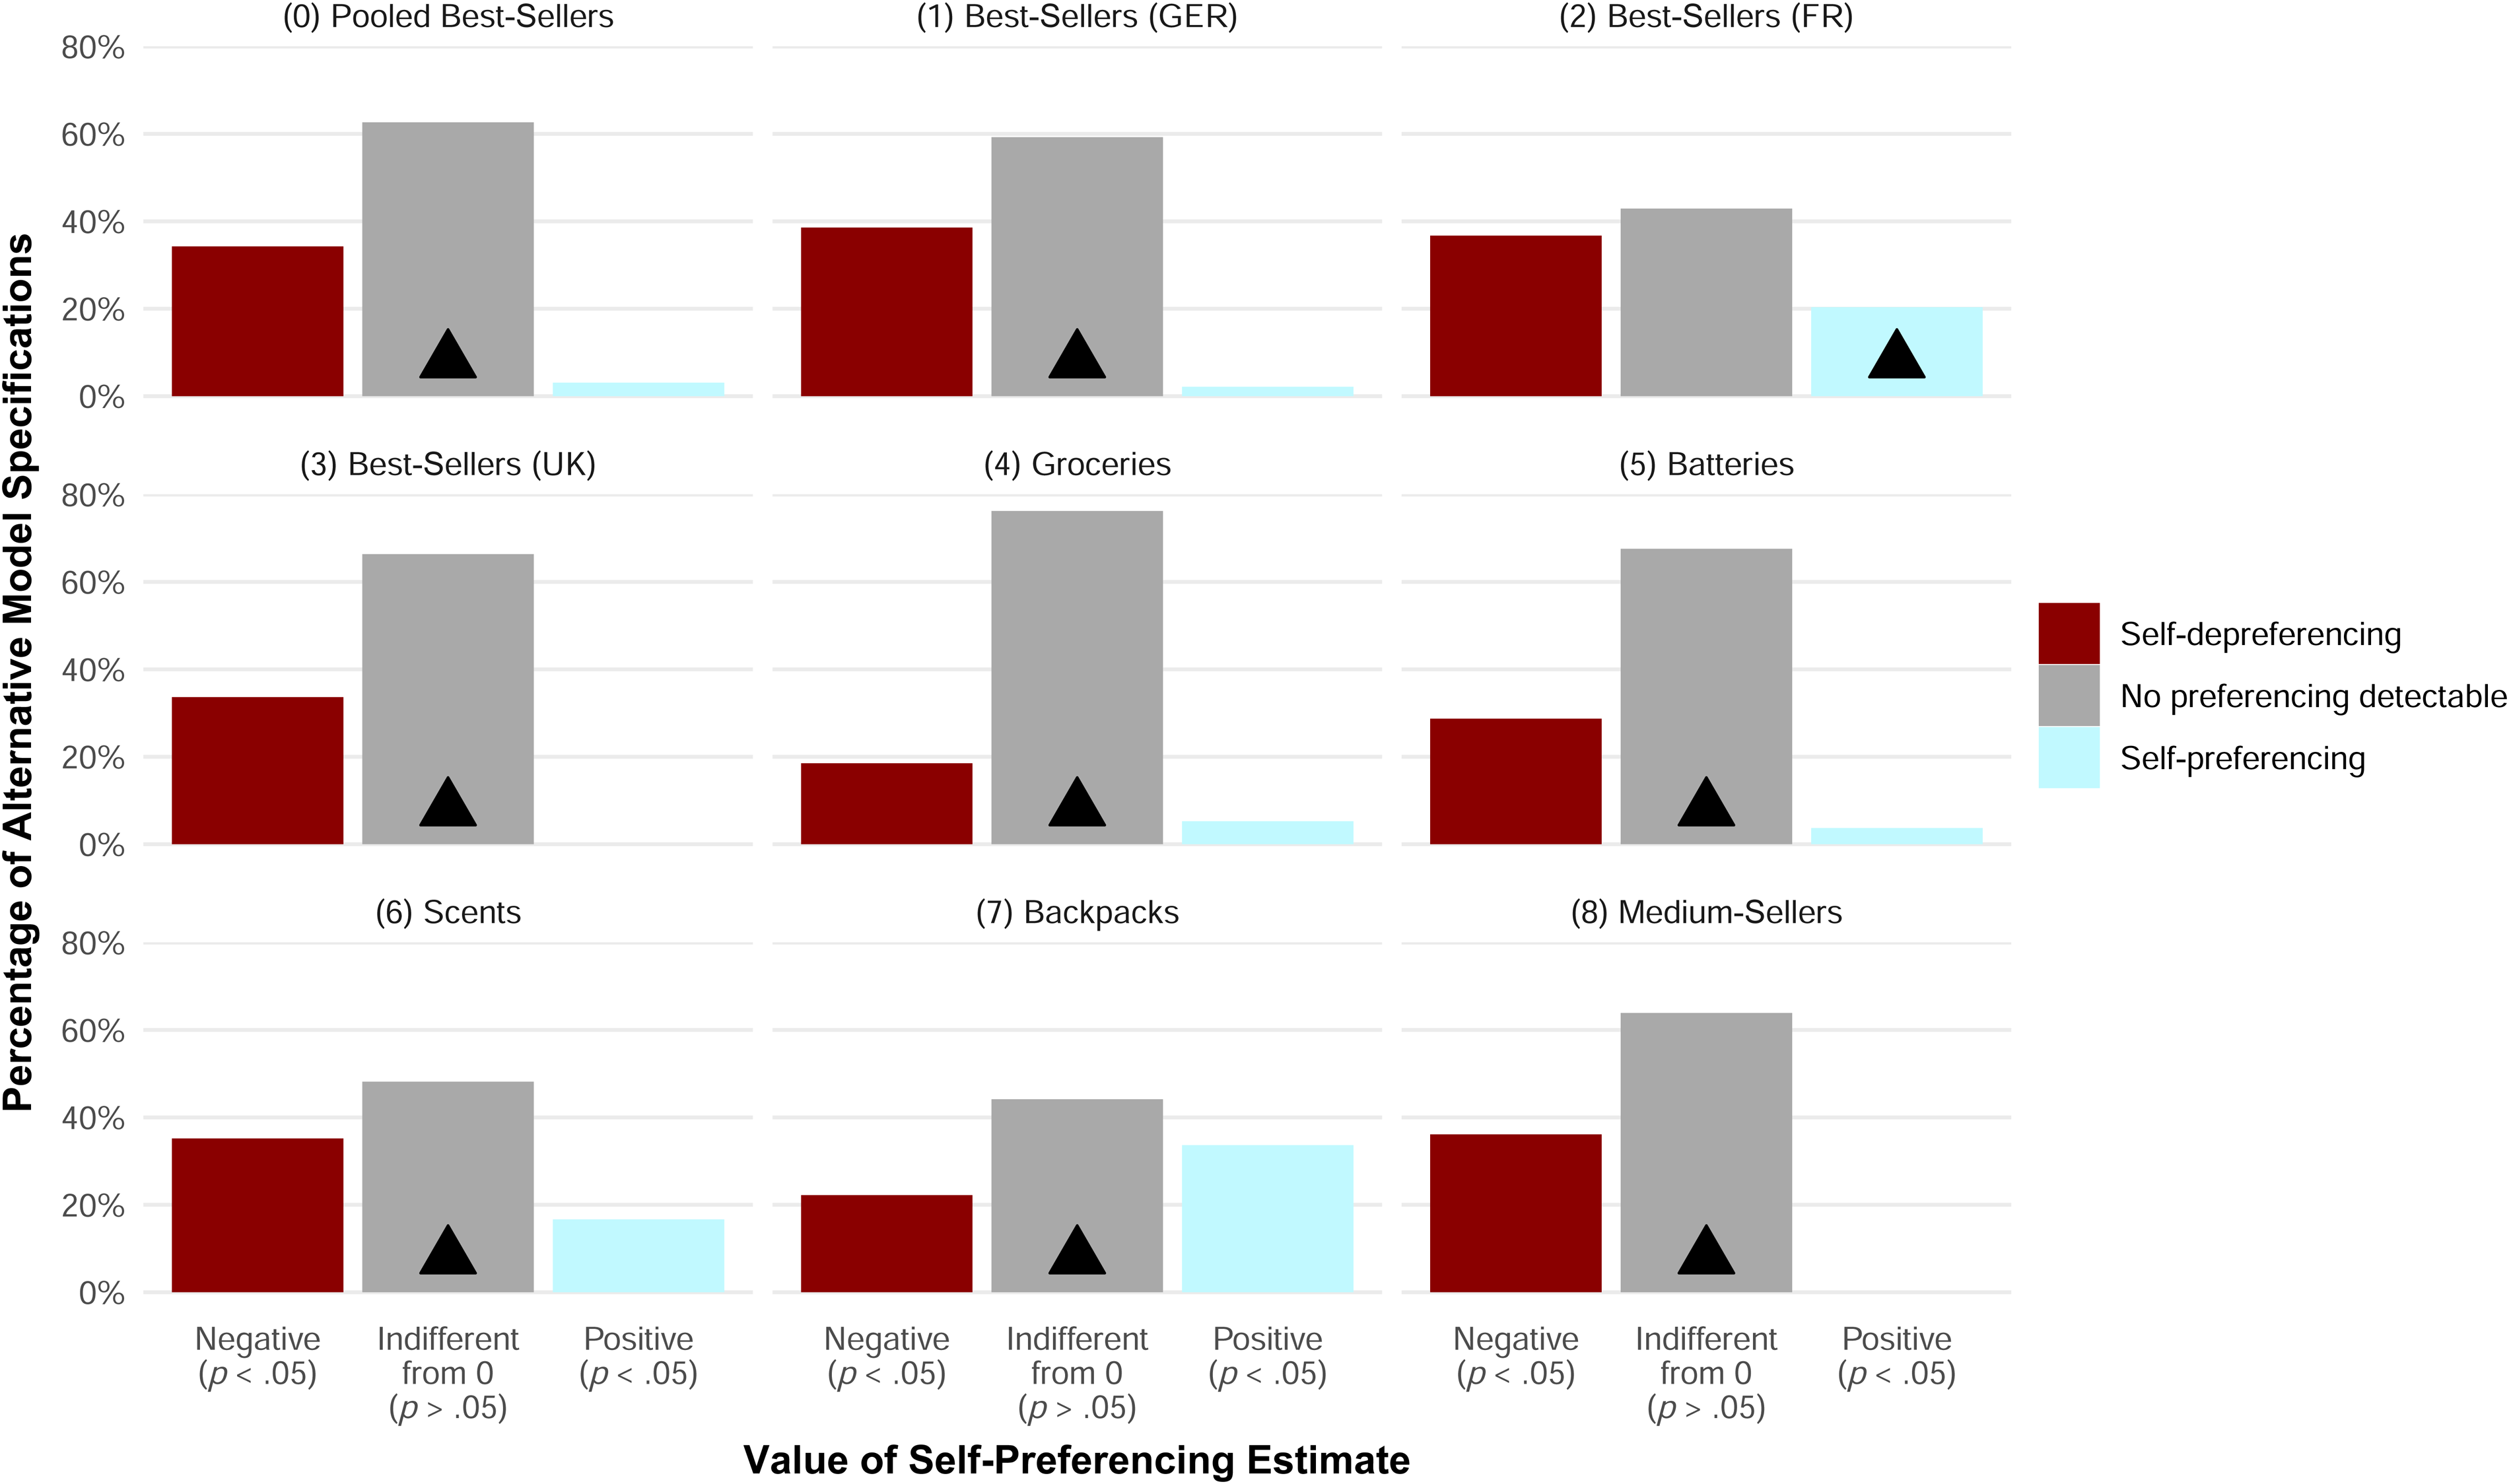
Study 1: Conclusions of Alternative Model Specifications in Comparison to Result of Main Model Specification by Sample.
Study 2: Conclusions of Alternative Model Specifications in Comparison to Result of Main Model Specification by Sample.
For Study 1, Figure 7 shows that the most common result for each sample is obtaining a self-preferencing estimate statistically indistinguishable from zero. All but one estimate from our main specification also falls into this category. This overlap in eight out of nine samples indicates that the conclusions derived from our main model specification correspond to the results found in most alternative model specifications.
The only exception to this pattern is the best-selling sample from France (2), where we obtain a statistically significant positive self-preferencing estimate. However, only 20% of the alternative model specifications align with this conclusion. The confidence in this positive self-preferencing estimate is low because approximately 80% of alternative specifications lead to a different conclusion.
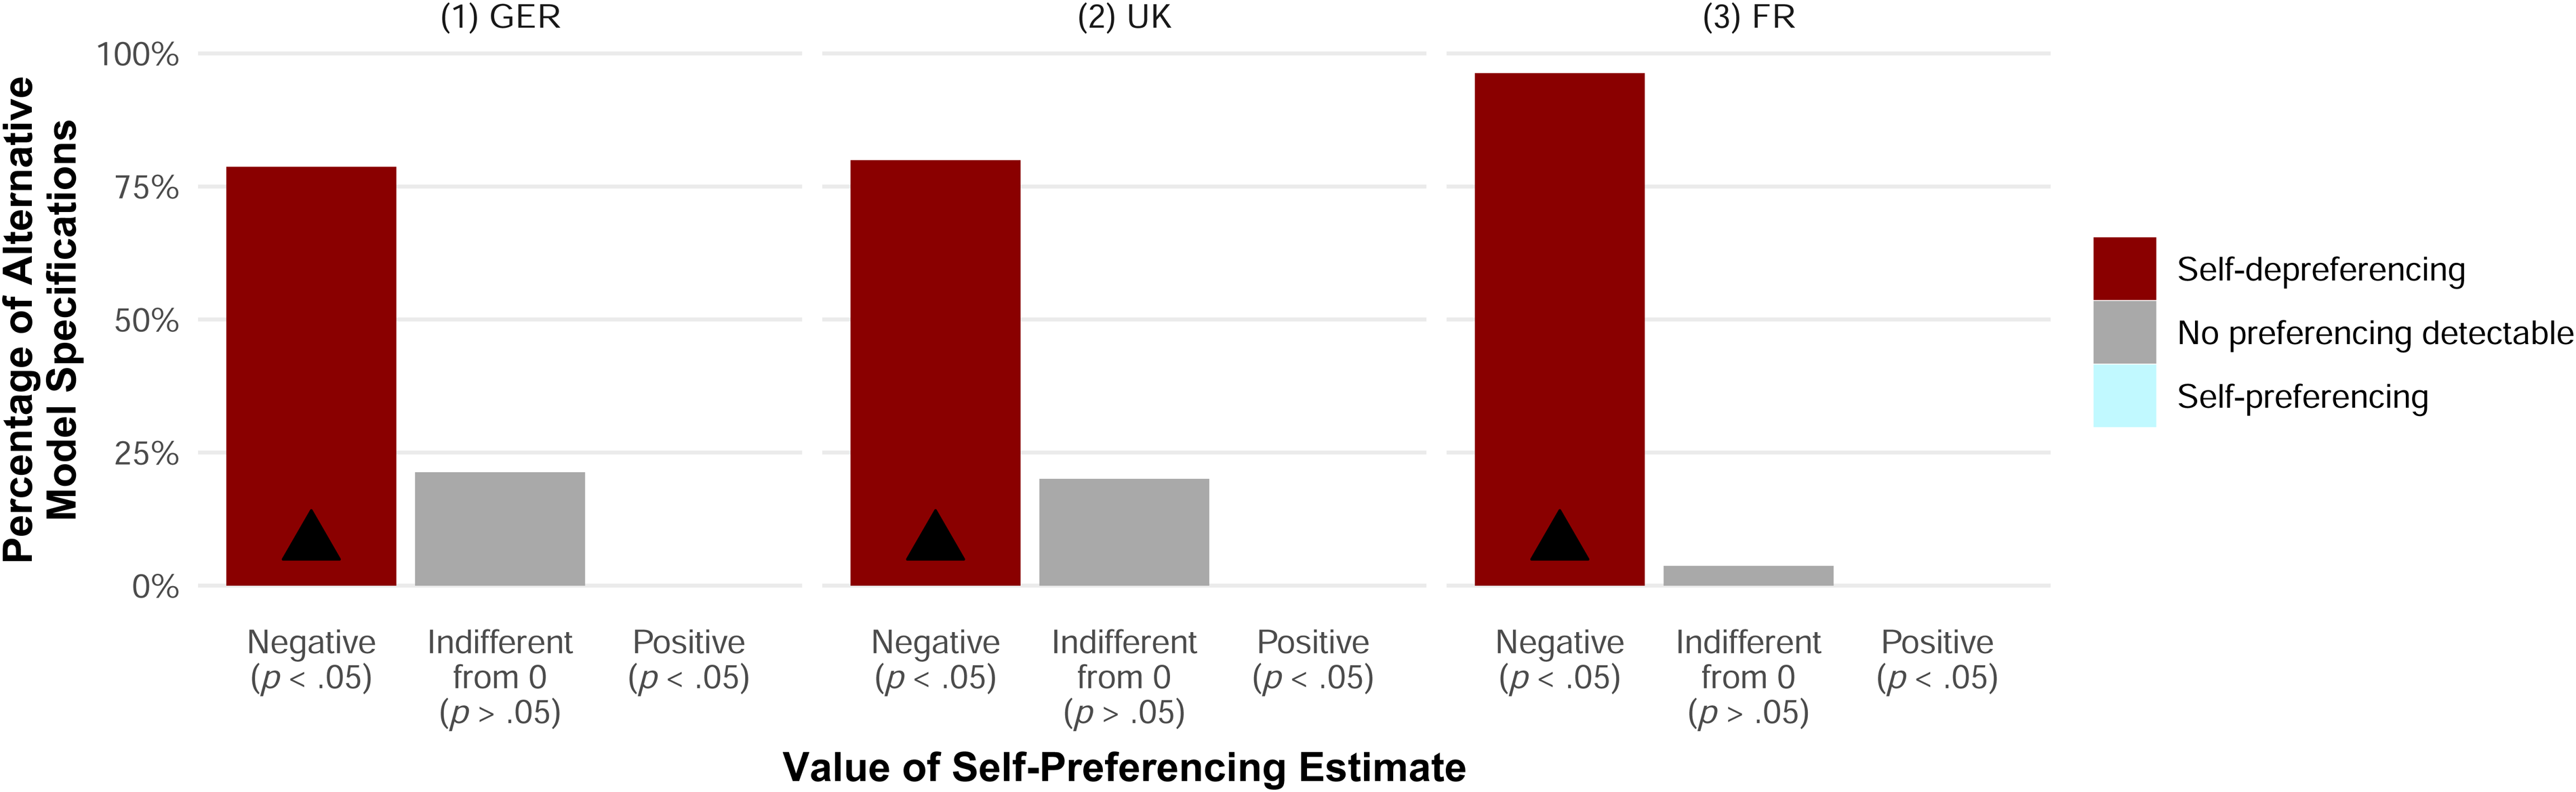
The results of the specification curve analysis for Study 2, summarized in Figure 8, similarly instill confidence in our results from the main specification. In all three samples, more than three-fourths of all alternative specifications yield a statistically significantly negative self-preferencing estimate—which we also obtain in the main specification. We do not observe any statistically significant positive estimate that indicates self-preferencing.
In addition to evaluating the likelihood that alternative model specifications arrive at similar conclusions, we assess which of the two self-preferencing tests—COO or OB—tends to arrive at which conclusion. Figure 9 compares the results of the two tests for each study. For Study 1, this comparison shows that both tests infrequently yield positive self-preferencing estimates. While for both tests the most frequent conclusion is to find a nonsignificant difference from zero, the distribution of estimates from the OB test tends more toward self-depreferencing than the distribution from the COO test. For Study 2, a visual assessment of the self-preferencing estimates suggests that the distribution of estimates does not differ much between the two tests. Specifically, the alternative specifications of the COO and OB tests arrive at statistically significant self-depreferencing in most cases. Indeed, for Study 2, not a single alternative model specification yields self-preferencing.
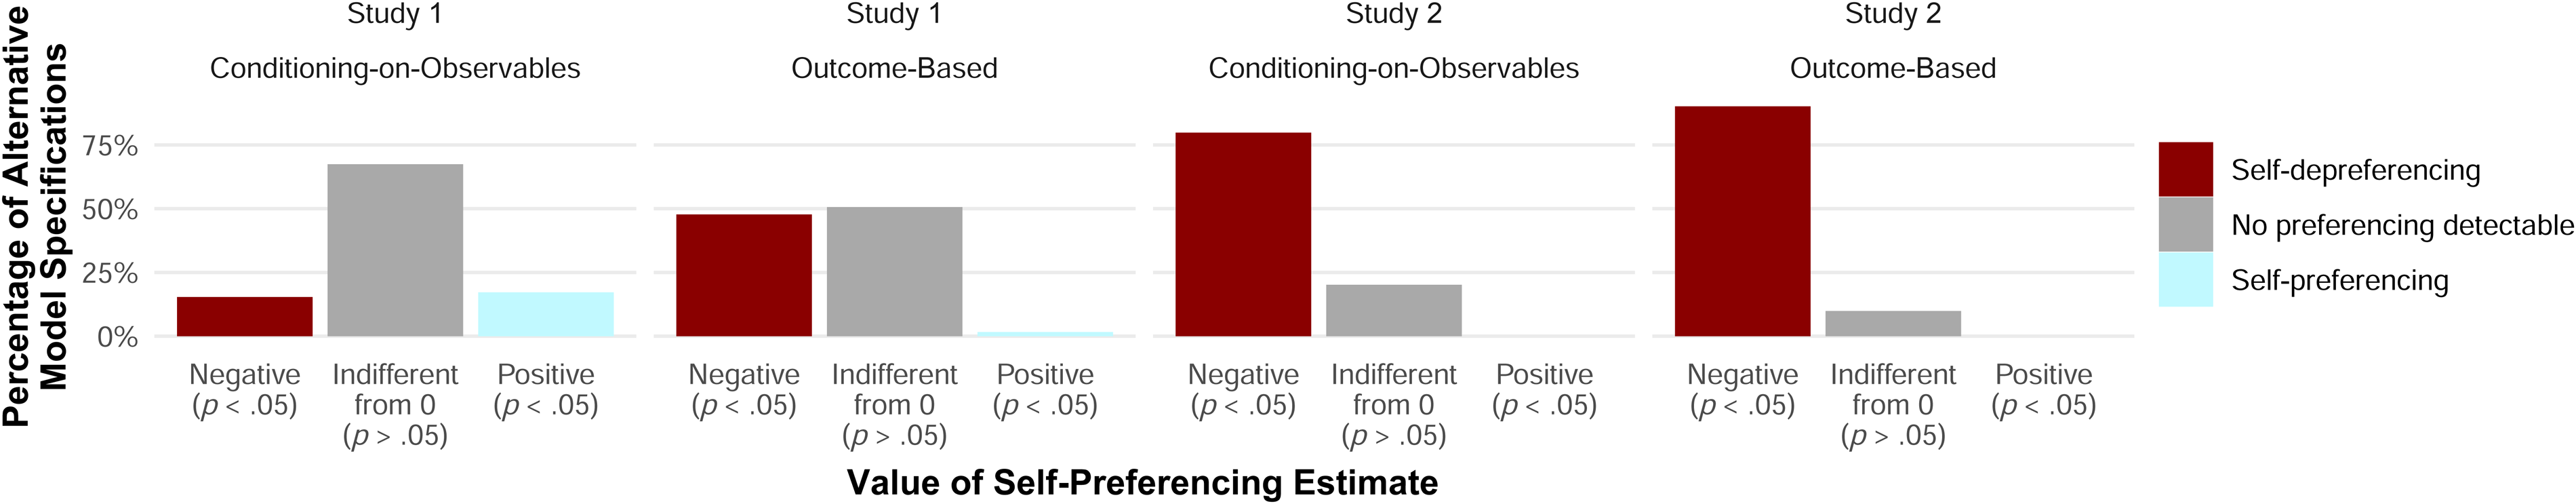
Value of Self-Preferencing Estimates by Self-Preferencing Test Under Alternative Model Specifications by Study.
Summary of Contributions, Limitations, and Suggestions for Future Research
We conclude this article with a summary and discussion of this article's five major contributions, highlight remaining limitations, and outline paths for further research.
Conceptual Framework for Measuring Self-Preferencing
Our first contribution is the conceptual framework for measuring discriminatory behavior, yielding three kinds of results: (1) no discriminatory treatment, (2) self-preferencing, or (3) self-depreferencing. Our framework highlights the fact that it is misleading to refer to self-preferencing as the sole form of discriminatory behavior while ignoring the possibility of self-depreferencing. As discussed previously, though self-depreferencing might not obviously constitute noncompetitive behavior, it could indicate other, more subtle phenomena that warrant consideration and even raise concerns.
Our conceptual framework also describes how two tests for examining self-preferencing (or discriminatory behavior), namely the COO and OB tests, build on two complementary principles of discrimination. The COO test builds on the principle that similar offerings should not receive dissimilar treatment. In contrast, the OB test builds on the principle that dissimilar offerings should not receive similar treatment.
Thus, our conceptual framework guides platform stakeholders on how to test for self-preferencing. In the European Union, regulators can use this approach to test for compliance with the Digital Markets Act, which bans self-preferencing. At the same time, platforms can use our framework to assess whether they comply with regulations. However, the framework might also help other stakeholders. Third-party actors, in particular, can test for self-preferencing on the platforms where they compete or plan to compete. Thus, third parties can better assess whether and on which platform or part of the platform they should compete.
Novel Measure for Visibility
Our second contribution is a novel measure for visibility in nonpersonalized search results, namely, reliance on product visibility instead of product-keyword visibility, a prevalent measure in prior studies. The reliability of product-keyword visibility is limited by the fact that the order of search results varies substantially across specific keywords, even if those keywords are very similar; product visibility circumvents this challenge by summarizing the product-keyword visibility across one million keywords, yielding more stable results. Additionally, we capture the fact that consumers search through very diverse keywords. Thus, product visibility ensures that we do not misattribute (random) differences in the ranks of individual keywords to self-preferencing. While these characteristics are relevant for correctly measuring self-preferencing, our metric of product visibility comes with the additional benefit of being interpretable as a product's visibility market share—a valuable property for descriptive analyses.
An advantage of considering only nonpersonalized searches is that it does not require us to disentangle a platform's (unjustified) self-preferencing from (justifiably) reflecting consumer preferences for first-party offerings in the search results. Appropriately capturing individual consumer preferences is extremely challenging because access to first-party data on individual consumers (e.g., their search behavior and past purchasing choices) is hardly available. Thus, studies using personalized search results risk conflating individual consumer preferences with self-preferencing.
This joint reflection of consumers’ preferences and occurrence of self-preferencing in the search results could explain why other studies find self-preferencing for Amazon Basics products while our study finds self-depreferencing. For example, Farronato, Fradkin, and MacKay (2023) only consider search results recorded from Amazon customers with at least two monthly purchases. Such frequent Amazon customers might prefer the brand Amazon more than the average Amazon customer. Suppose that Amazon justifiably incorporates these consumers’ higher preference for first-party products into the personalized search results by treating first-party products better than third-party products. Then, focusing on these consumers might conflate their higher-than-average preference for Amazon with self-preferencing. Using nonpersonalized search results avoids this challenge.
We nevertheless acknowledge that our data would not enable us to detect self-preferencing if it only occurred in personalized search results. However, we argue that, conditional on a platform conducting self-preferencing, we could expect more self-preferencing in nonpersonalized searches than in personalized searches. The reason is that, on average, treating a particular offering better should increase its sales. Consequently, on average, a platform engaging in self-preferencing by preferring first-party over third-party offerings in nonpersonalized search results should increase first-party sales. Thus, we expect that a platform would self-preference in all nonpersonalized searches. However, a platform might personalize search results if it knows more about the searching consumer to better tailor the search results to the consumer's preferences. Such data would also likely reveal how strongly each consumer reacts to self-preferencing. Most likely, this reaction is positive across consumers overall, but it also varies and may even be negative for some consumers. The platform would refrain from self-preferencing for negatively reacting consumers because the outcome is less profitable. Therefore, it seems plausible that self-preferencing is more prevalent in nonpersonalized searches than in personalized searches.
Implementation of Specification Curve Analysis
Our third contribution is the implementation of a specification curve analysis (Simonsohn, Simmons, and Nelson 2020). By comparing our main models’ estimates with the distribution of estimates obtained in alternative models, we can assess whether the main results correspond to what most alternative models would have found or whether the main results are outliers. We, as analysts, must make assumptions and live with empirical compromises, especially when implementing self-preferencing tests without access to a platform's proprietary data. Thus, such systematic robustness checks can help identify whether conclusions drawn from a single model specification correspond to the conclusions from alternative specifications.
While other self-preferencing studies compare a few alternative model specifications, we are the first to implement such specification curve analysis in this context. We show that such an implementation is feasible and that the results of the 972 alternative models support the insights of our main model. Thus, it is unlikely that specific modeling choices, for example, the choice of the self-preferencing test (COO or OB test), the functional form of the model, the choice of fixed effects, or the method to compute standard errors, are the primary drivers of our results.
Results Regarding the Occurrence of Self-Preferencing on Amazon Marketplace
Our fourth contribution is a substantive one and outlines that most of our considered samples on Amazon Marketplace do not exhibit self-preferencing through the search results. Only one of our two studies (Study 1) identified weakly self-preferenced search results in a single sample out of eight samples from three countries. In all other samples, we found an effect statistically indistinguishable from zero. Our category- and country-level heterogeneity analysis mirrors these results, on average, but identifies several categories with self-preferencing and self-depreferencing. However, these differences are not explainable by the varying commission rates that Amazon charges for these categories—which could be an incentive to vary the degree of self-preferencing by category. There are other plausible reasons why the platform could selectively employ self-(de)preferencing by category and country, such as consumers only reacting positively (from the platform's perspective) to self-preferencing in some categories and countries, which, however, we cannot test with our available data. Further investigation of the reasons for such category differences could be a promising avenue for further research.
Still, our overall results show only a few cases of self-preferencing. A potential reason for this lack of self-preferencing is that Amazon increasingly relies on third-party sellers to generate advertising revenue. At U.S. $13.92 billion in the first quarter of 2025, Amazon's advertising revenues were 56% higher than YouTube's at U.S. $8.93 billion (Vanian 2025). These advertising revenues have much higher margins than retail revenues, so Amazon might focus on generating advertising revenues instead of increasing retail revenues via self-preferencing.
In Study 2, we revealed statistically significant negative self-preferencing coefficients, indicating self-depreferencing—meaning that third-party products are more prominent in the search results than their attributes would justify. We are not the first to find the latter result. Aguiar, Waldfogel, and Waldfogel (2021) identify self-depreferencing on Spotify for songs stemming from major record labels (which partly own Spotify).
We suggest several possible explanations for the finding of self-depreferencing in Study 2 versus the absence of discriminatory behavior in Study 1. First, consumers instantly understand that Amazon Basics products belong to Amazon. If self-preferencing occurred for Amazon Basics, it would be easy to recognize. In contrast, consumers understand the role of the buy box less well. Some consumers may even think that they always buy from (the retailer) Amazon when in fact they are buying from other sellers. If self-preferencing occurred through the buy box, recognizing it would be much more challenging. If Amazon purposely wanted to avoid the impression of favoring its own products in the search results, it could assign a lower visibility to its Amazon Basics products such that casual observers do not get the impression that those products are favored. However, such “cautionary” lower visibility would be less necessary for products that Amazon currently supplies via the buy box, since consumers and regulators cannot easily identify and compare the current buy box seller through the search results, but only observe this attribute after clicking on each listing.
Second, Amazon still has a strong incentive to sell third-party products via its platform because it earns a commission of 8%–15% for third-party sales. Hence, Amazon could earn comparable or even higher profits when selling third-party products versus first-party products on its platform. Additionally, compared with bearing the entire risk of manufacturing, supplying, and retailing its own (private label) products, Amazon could face less risk when only serving as the intermediary for sales of third-party products while still earning a sizable commission. Thus, self-preferencing its own private label products might be profit-decreasing.
Third, for Amazon Basics products, the platform provider Amazon might compensate for the apparent lack of organic visibility through higher sponsored visibility. In Study 2's samples, the sponsored visibility of Amazon Basics products is, on average, 2.9 times greater than that of comparable third-party products. Eventually, this difference might compensate for the lower organic visibility because Amazon Basics products are still visible, though labeled as “sponsored” results. It is unclear if Amazon's retail arm “pays” a market price to the platform provider Amazon for sponsored search results or if Amazon retail should be required to do so. For a detailed discussion of self-preferencing in sponsored search, we refer to Long and Amaldoss (2024), who show under which conditions a platform might want to engage in self-preferencing in sponsored search results.
Structuring Self-Preferencing Tests in a Six-Step Approach
Our final contribution is structuring empirical self-preferencing tests through a six-step procedure (see Table 1), which helps implement our conceptual framework through both the COO and OB tests. Crucially, this formal procedure forces the analyst to be transparent about the choices and assumptions required for implementing a self-preferencing test. Thus, future research could apply it to other settings. However, not all platforms might provide the conditions for outside researchers to implement credible self-preferencing tests. For example, in our analysis of Amazon Marketplace, we had to rely on data from providers such as Keepa and Sistrix. Thus, our six-step approach enables examination of whether studies on self-preferencing in other settings can produce credible results.
Limitations and Suggestions for Future Research
Amazon might self-preference through other practices outside this study's scope. Thus, we must emphasize that our empirical illustration applies our approach to two forms of competition, albeit on a single platform and with a single type of recommendation (organic search engine visibility). Even though we find almost no evidence for self-preferencing through organic search engine visibility in the main analyses, we identify categories in specific marketplaces where self-preferencing occurs, and others where self-depreferencing seems to occur. Our data did not enable us to reliably identify the drivers of the differences across marketplaces and product categories; future research could delve deeper into isolating characteristics of domains in which self-preferencing or depreferencing is particularly likely to occur.
Moreover, platforms have several other opportunities for self-preferencing, which are more challenging to evaluate as an outside researcher. For example, platforms might preference their own offerings through recommendations other than the search results or leverage their access to their proprietary data to identify which offerings are most attractive—an insight not available to third-party actors. Thus, our results should not be mistaken as proof that the platform complies with self-preferencing bans.
Furthermore, empirical limitations might influence the ability of our self-preferencing tests to identify self-preferencing correctly. Although we have provided empirical evidence suggesting that common threats—omitted variable bias, measurement error, and alternative model specifications—do not substantively change the conclusions of our tests, there might be additional data limitations. For instance, we measure products’ visibility through anonymous browsing sessions without the platform being able to infer consumers’ characteristics. These characteristics might be available for most real-world search requests. Thus, our empirical conclusions only apply to nonpersonalized search results. As elaborated previously, we reason that self-preferencing is unlikely to be more prevalent in personalized searches than in nonpersonalized searches; nevertheless, future research should substantiate this claim.
For a complete assessment of self-preferencing on Amazon, future studies could investigate the difference between our results (suggesting self-depreferencing for Amazon Basics products in Study 2) and those of Farronato, Fradkin, and MacKay (2023), who find that Amazon displays its brands more prominently in search results for personalized search results. As outlined previously, we hypothesize that our results could differ from those of Farronato, Fradkin, and MacKay (2023) because the latter study relies on personalized search results from a small sample of frequent Amazon consumers. Given these consumers’ frequent Amazon purchases, that study might have only selected consumers with strong preferences for Amazon's offerings, yielding personalized search results that justifiably reflect these preferences. Thus, it would be illuminating to conduct self-preferencing tests on a set of identical products for two different types of search results: personalized search results with a product-keyword-level visibility measure (as in Farronato, Fradkin, and MacKay 2023) and nonpersonalized search results with our product-level visibility metric. Such a comparison could test whether personalization and the visibility metric affect the degree of self-preferencing.
Additionally, future studies could examine, for example, whether Amazon self-preferences by labeling certain offerings as “Amazon's Choice.” To this end, analysts could replace the product visibility variable in our models with an appropriate indicator variable (e.g., isAmazonChoice). In particular, our approach could estimate whether Amazon's own products are more or less likely than third-party products to be labeled “Amazon's Choice” after accounting for attributes that influence such a recommendation. Future research could also test for self-preferencing by applying our approach to platforms outside Amazon Marketplace that supply their own first-party offerings, provide search engine results or other recommendations, and compete with third-party offerings.
Supplemental Material
sj-pdf-1-jmx-10.1177_00222429251360772 - Supplemental material for Measuring Self-Preferencing on Digital Platforms
Supplemental material, sj-pdf-1-jmx-10.1177_00222429251360772 for Measuring Self-Preferencing on Digital Platforms by Lukas Jürgensmeier and Bernd Skiera in Journal of Marketing
Footnotes
Acknowledgments
The authors thank Rodrigo Belo, Chiara Farronato, Reinhold Kesler, Lennart Kraft, Ulrich Laitenberger, Filippo Lancieri, Jan Landwehr, Karen Marron, Julien Monardo, Thomas Otter, Devesh Raval, Imke Reimers, Joel Waldfogel, and Amit Zac for helpful comments. Additionally, we thank participants at the Seventeenth Symposium on Statistical Challenges in Electronic Commerce Research 2021, the Interactive Marketing Research Conference 2021, the Paris Conference on Digital Economics 2022, the European Marketing Academy Conference 2022, the Munich Summer Institute 2022, the ZEW Conference on the Economics of Information and Communication Technologies 2022, the ISMS Marketing Science Conference 2022, the SALTY Quantitative Marketing Conference 2022, the Workshop on Information Systems and Economics 2022, the seminar series at Deakin University, Monash University (Australia), and Goethe University Frankfurt (Germany) for valuable feedback on presentations.
Coeditor
Shrihari Sridhar
Associate Editor
S. Sriram
Declaration of Conflicting Interests
The author(s) declared the following potential conflicts of interest with respect to the research, authorship, and/or publication of this article: Lukas Jürgensmeier did most of his work for this article as a doctoral student at Goethe University. He now works at the European Central Bank. The views expressed in this research do not necessarily represent the views of the European Central Bank.
Funding
The author(s) disclosed receipt of the following financial support for the research, authorship, and/or publication of this article: The authors gratefully acknowledge financial support from the German Research Foundation (DFG) through grant number SK 66/8-1 and the INFORMS Society for Marketing Science (ISMS) through the Doctoral Dissertation Award 2023.