
Abstract
Prior research on advertising media mixes has mostly focused on single channels (e.g., television), pairwise cross-elasticities, or budget optimization within single campaigns. This is detached from practice where (1) marketers decide between an increasingly large number of media channels, (2) media plans involve complex combinations of channels, and (3) marketers manage complementarities among many channels. The authors use latent class analysis to uncover tendencies in media allocations. Latent classes account for nonrandom selection of channels into campaigns, capture pairwise and higher-order interactions between channels, and allow for meaningful interpretation. The authors describe the most common media channel archetypes and estimate their relationship to the effectiveness of a set advertising campaigns on common brand-related performance metrics. They use a dataset of 1,083 advertising campaigns from around the world run between 2008 and 2019. While they find no single media mix that consistently correlates with high performance across all metrics, clear high-performing patterns emerge for specific metrics. The authors find that traditional channels (TV, outdoor) often appear together with digital channels (Facebook, YouTube) in high-performing campaigns. Additionally, current marketing practices appear suboptimal, with simple strategies predicted to improve lifts by 50% or more.
As global advertising spend exceeded $1 trillion (Statista 2024) in 2023, marketing academics and practitioners need to understand effective media budget allocation approaches. Media selection is also important for recipients of media budgets in the vast and complex market for advertising. For instance, Google reported $224.47 billion in revenue from advertising sales in 2022 (Alphabet Inc. 2022), while the entire global print publisher ad revenue was $37.3 billion, just behind Amazon's advertising sales of $37.7 billion for that period (Tobitt 2023). Despite an often-discussed shift to digital channels, traditional advertising products are hardly abandoned, with $46.9 billion flowing to outdoor (MarketWatch 2023) and $37.2 billion to radio (IMARC 2023) advertising globally in 2022.
Unsurprisingly, a $1 trillion market attracts entrants, competition, and innovation. As a result, marketers are met with a proliferation of media channels (e.g., the rise of retailer-owned ad channels like sponsored listings on Amazon or Walmart), as well as an increase in channel-specific options to consider when developing media mixes. Marketers and media planners are faced with a complex resource allocation problem that is seemingly intractable with a vast number of possible media combinations from an expanding menu. The task is made more difficult by the fact that media planners cannot immediately evaluate the results of their choices, as “feedback” in the form of market results comes with both statistical noise and often a long delay. In addition, media planners must often decide on budget allocations in advance, and adapt to changing market conditions later. Practically, marketers must simplify media allocation. This simplification comes in the form of using heuristics, repeating previous patterns, imitating competitors, following industry trends, or outsourcing to the large support industry that offers help with media planning (e.g., marketing-mix modeling) or validation (e.g., attribution).
Simplification introduces errors that, from the perspective of a manager, are hard to detect due to limited data relative to the high dimensionality of the problem. Unlike adjustments to individual ads, A/B testing budget allocations on entire campaigns carry a high ratio of cost to information yield. It is worth recognizing that large firms are not in the habit of running experiments with multimillion-dollar campaign investments against their major brands and tend to avoid risky experimentation. Furthermore, information about channel-specific return on ad spend usually comes from channel owners, and is often analyzed in isolation from concurrent channel spend decisions, which reduces its value for questions of channel interaction. In some ways, the overwhelming uncertainty provides “cover” for managers to justify approaches that are favorable to them for reasons other than performance. If two strategies plausibly produce similar results, managers are likely to prefer the one that is simpler to execute and explain. For example, buying ads based primarily on reach is one strategy that may appeal to managers facing very high uncertainty, particularly as it aligns with industry lay beliefs on reach sufficiency (all results flow from achieving high reach) and the ease of measuring reach. Regardless of the criteria used, managers are likely to view the media allocation task holistically and intuitively. This contrasts with the notion of managers methodically simulating all possible channel combinations for every campaign and goal. The combinatorial nature of the problem makes such exhaustive testing time and cost prohibitive.
From a researcher’s perspective, managers’ differing budget allocation approaches create variation in media-mix tendencies across firms and industries, which could potentially be exploited to uncover patterns in channel allocations and outcomes. We take advantage of the variation in campaign construction (channel usage and spend shares) using a unique dataset that includes 1,083 large multichannel campaigns that ran between 2008 to 2019. These campaigns were undertaken by 557 global brands and covered 23 major industries in 51 countries. The dataset is broad enough that it could be used, in principle, to detect patterns in campaign construction and to estimate the relationship between different patterns and advertising outcomes. However, the data alone are insufficient because patterns do not make themselves readily available in the raw data. To see this, consider two campaigns with similar spend from similar brands. The first allocates 60% to TV and 40% to YouTube, and the second allocates 60% to TV, 30% to YouTube, and 10% to cinema ads. These campaigns are very similar, but not exactly the same. To succeed in extracting patterns from the data, we need a model that can represent these two campaigns as “close” but not identical. We should avoid any model that would treat the two as totally distinct entities. At the same time, we should also avoid a model that reduces them to simply the sum of their parts, because that would fail to capture complementarities between the channels.
Our model relies on the concept of archetypes. An archetype is like a Platonic ideal of a campaign style. For example, a manager might imagine a campaign using digital channels with algorithmic targeting (e.g., YouTube). However, in practice, the manager might deviate slightly from the envisioned approach and include some spend on radio (neither digital nor algorithmically targeted). We could say the campaign turned out to be close to the “algorithmic digital” archetype, though not a perfect realization of it. From this perspective, archetypes are landmarks on a map of media allocation styles, and individual campaigns are characterized by their coordinates on the map, and thus their relative distances to different archetypes. Campaigns can be concisely described by projecting them into archetype space, and “close” campaigns can be treated as similar but not identical. Previous research on media complementarity has been limited to main effects of channels plus pairwise interactions. This ignores interactions between more than two channels and lacks parsimony. The lack of parsimony is a serious concern when there are more than three or four channels. For example, with 11 channels, there are 2,047 possible channel combinations. Representing each of these combinations as an additional term in a regression is hopelessly infeasible.
To apply this approach we must be able to estimate archetypes from data, which requires that patterns in media allocation actually exist and that we have a feasible estimation procedure for recovering them. Whether the patterns exist is an empirical question that we address in this work, using Bayesian latent class analysis as an estimation procedure. We combine the archetypes from the latent class analysis with a model predicting brand lifts to understand the relationship between archetypes and outcomes. The breadth of our dataset is critical for estimating archetypes with high external validity. To make archetypes interpretable, we build an empirical archetype map, similar to the conceptual one described above, and display it in two dimensions. A given campaign on this map can be thought of as a mixture of the different “pure” archetypes, and the empirical archetypes are given as landmarks.
We make three contributions. First, our dataset and archetype model enable us to come closer than prior research to addressing the critical practical question of how to best combine media channels for high performance against different advertising goals. By going beyond simple pairwise combinations of media channels, we are able to see how more complex combinations of channels have tended to perform, which is new to the marketing literature.
Second, our empirical study is, to the best of our knowledge, the largest academic study of advertising performance and media mixes. Our unique dataset includes 1,083 large multichannel campaigns that took place during 2008 to 2019. These campaigns were undertaken by 557 global brands, covered 23 major industries, and ran in 51 countries. Finally, our dataset allows us to consider several brand-related outcomes that are of strategic interest to marketers (e.g., brand awareness, associations, purchase intent). While the existing literature has been able to examine the implications of a few media channels, we focus on many simultaneous media channels.
Third, we produce several descriptive findings that strongly suggest the existence of media allocation tendencies among managers. We find that reach, which is relatively easy to understand and measure, is optimized to a greater degree than lift (i.e., improvement on brand metrics). We find seven media allocation archetypes that each relate differently to brand outcomes, implying that managers cannot simply apply a single archetype without respect to campaign goals. The archetypes have different risk profiles, with some archetypes displaying strong patterns of high average lifts but with high variation, and others associated with lower average lifts but much better worst-case outcomes. We also find that budget concentration (how unevenly managers allocate) relates favorably to lifts in aided awareness but unfavorably to association lifts. All of our substantive results are new to the literature.
Literature Review and Conceptualization
Deighton (1996, p. 243) ponders, “Why would one not integrate a communications campaign? Integration is surely the natural condition, the simple and obvious way of doing things. Most marketing problems are solved with a combination of tools, even if the blending is no more complex than synchronizing advertising with trade promotion schedules. Unintegrated communication campaigns are aberrations.” This perspective highlights that the combination of marketing tools is a longstanding part of marketing thinking, captured in both the concept of the marketing mix (Borden 1964; Culliton et al. 1948) and the concept of marketing itself (Houston 1986). Therefore, it is unsurprising that the combinatorial aspect of integration is connected to critical facets of marketing, such as budget allocation (Fischer et al. 2011; Venkatesan and Kumar 2004), marketing mix and media planning (Wedel and Kannan 2016), attribution (Berman 2018), advertising effectiveness (Danaher et al. 2020), and the financial impacts of marketing (McAlister et al. 2016). Since marketing in practice has combinatorial or “mixing” principles at its core, it is also unsurprising that much of the literature on media effectiveness and related decisions has considered how different combinations of activities work. The integrated marketing communications (IMC) literature has focused extensively on this (see reviews by Naik and Peters [2009] and Batra and Keller [2016]). These works lay out a framework of components for successful marketing communication integration: (1) consistency, (2) cross-effects, and (3) complementarity.
Interestingly, the concept of consistency of communication across media channels is deemed a “solved problem” on the basis of numerous studies supporting its advantage (Batra and Keller 2016; Duncan and Moriarty 1998), or placing it as a tactical part of integration (Naik and Peters 2009), thus requiring no further investigation. However, these perspectives also mark a significant distinction between the three components of IMC. While the complementarity and cross-effects of channels relate to their inclusion in a media plan, the consistency of communications relates to content development and management that occurs alongside media channel selection and planning. Therefore, it is in the interplay of complementarity and cross-channel effects, or what Naik and Peters (2009) term strategic synergy, where combinatorial aspects of media planning are most relevant.
The questions in this type of research are relatively straightforward, such as seeking to understand how different media channels operate together to see if and when they “play nicely together” (i.e., are synergistic). However, conflating cross-effects and complementarity of media channels, or collapsing both into a single construct (synergy), is not always ideal. Indeed, we argue that in doing so, prior research on media selection and integration has been overly concerned with simple media channel combinations (e.g., pairwise combinations that can be captured with cross-effects) at the expense of considering more realistic mixtures of media channels that go beyond what can be empirically specified with pairwise cross-effects in advertising response models.
The importance of this distinction comes from Batra and Keller's (2016) observation that, while the literature has provided a significant amount of empirical evidence on the existence and importance of media interactions and cross-effects, “it has not yet clearly explicated the relative strengths and weaknesses of different media in influencing different communication outcomes” (p. 123). The reason for this gap might be more apparent from the body of literature on media complementarity and cross-effects, a selection of which is shown in the Web Appendix). It highlights a strong dedication to explaining advertising impact on sales (Danaher and Dagger 2013; Gopalakrishna and Chatterjee 1992; Kolsarici and Vakratsas 2018; Naik and Raman 2003; Srinivasan, Rutz, and Pauwels 2016) or analogous metrics like conversion and recruitment (Gatignon and Hanssens 1987). However, not all media campaigns are designed for activation or sales. Brand-related outcomes are often important to practitioners. Yet the number of studies on brand outcomes is much smaller than those on sales outcomes (Chang and Thorson 2004; Dijkstra, Buijtels, and Van Raaij 2005; Edell and Keller 1989; Fischer 2019).
This focus reduces the question of media selection and combinatorial channel effects down to a single advertising outcome. This concentration on one outcome creates a potentially false equivalence between channels, as they are all measured as better or worse delivery mechanisms for one metric, effectively creating a literature-level environment where it is difficult to identify complementarity (hence the reasonable simplification to synergy). If the construct requires “difference” and “differentially useful” as Batra and Keller (2016) suggested, then the second component is only observable when conditions vary (outcomes).
Much of this equivalence is observed in studies concerned with within media plan budget allocation and reallocation toward an optimal position (Fischer 2019), where the trade-off toward one specific goal is justified. However, it translates into a concerning industry practice where media planning and purchase is similarly simplified to the bases of reach and frequency (gross rating points [GRPs]), rather than a combination of GRPs and the functionality or purpose of the channel. Practitioner guidance encourages this behavior by focusing on campaign reach measures (Binet and Field 2013). In a way, it is similar to treating an ad exposure as equal across channels, or perfectly fungible, such that an ad exposure on Facebook is identical to an ad view on television or in a newspaper. This assumption goes against the notion of differentiation of media channel exposures (Batra and Keller 2016) as well as findings showing differential consumer behaviors and the resulting importance in respecting resulting channel differences (Schweidel and Moe 2014).
Further, prior literature has tended to leverage fairly limited datasets in terms of scale and scope. The majority of prior studies rely on case studies, focusing on a single brand and single campaign. Notable exceptions to this are Joo et al. (2014) and work by Kolsarici and Vakratsas (2018). Similarly, studies have strongly focused on simple dyadic relationships between channels, such as the interaction between sales force and advertising (Gatignon and Hanssens 1987), television and radio (Edell and Keller 1989), television and print (Naik and Raman 2003), television and search (Joo et al. 2014), or television and social (Fossen and Schweidel 2019). Even those fewer studies that consider more than two channels simultaneously are restricted to the pairwise interactions (Danaher and Dagger 2013; Fischer 2019; Kolsarici and Vakratsas 2018; Srinivasan, Rutz, and Pauwels 2016) or have aggregated data on multiple channels of the same category (e.g., traditional media and social media) to allow for pairwise cross-effects estimations (Stephen and Galak 2012). In fact, Danaher and Dagger (2013, p. 530) specifically describe the inability to demonstrate synergies among the channels in their study, as the pairwise interactions among all ten channels became an econometric problem. And in that vein, Batra and Keller's (2016) observed lack in guidance on the appropriate selection and complementarity in media channels for a diverse set of outcomes is not necessarily due to a lack of interest or motivation but rather from a simple lack of opportunity to observe a sufficient amount of brands, campaigns, and outcomes in order to make meaningful statements.
Data
Our dataset was provided by Kantar. All campaigns in our dataset were generated by Kantar's Insights Division in its CrossMedia Research practice, which is dedicated to global market research on media campaign performance, advertising effectiveness, and brand impact. The dataset includes measures captured in brand lift and advertising effectiveness studies for 1,083 large multimedia advertising campaigns. The earliest campaign in the dataset ran in 2008, and the most recent was in 2019. A total of 557 global brands are represented in these campaigns, with 23 different industries covered (e.g., automotive, financial services, retail). Campaigns come from 51 countries, capturing all major markets and regions (e.g., North America, Latin America, Europe, Asia Pacific). A noteworthy feature of this dataset is that all campaigns are significant in their budgets and size, meaning that our sample is focused on large, professional advertising campaigns. For instance, the average media-only spend (i.e., ignoring production, management, and ancillary costs) of the U.S. campaigns in our dataset is 12 million USD. 1 Kantar, on behalf of its global brand clients, measured media budget allocation for each campaign across 11 types of advertising channels: (1) cinema, (2) Facebook, (3) magazines, (4) newspapers, (5) online display (banners), (6) online video, (7) outdoor, (8) point of sale, (9) radio, (10) television, and (11) YouTube.
Each observation in the dataset is an advertising campaign and an associated Kantar study. As the studies were conducted in real time against live campaigns across a varied number of media channels, true random-assigned control was impossible. The approach Kantar used is standard industry practice for multichannel campaigns across digital and nondigital channels. In this situation, true exposure (or nonexposure) to a given campaign cannot be fully controlled in channels such as television and outdoor like it can be in digital channels such as YouTube and Facebook. In each campaign, Kantar controlled for background variation by surveying nonexposed people both before the campaign begins and throughout the campaign. Nonexposure during the time of a campaign is estimated by Kantar using media consumption self-reports from survey respondents. This is a typical “opportunity to see” approach in the industry. For example, if a respondent reports that she does not use Facebook, she is eligible to be in the control group for a Facebook advertising campaign. Kantar also directly asked respondents about seeing each campaign. Kantar additionally accounted for the “predisposition” of a respondent toward each brand with information about exposure to previous campaigns, use or awareness of the brand by family members, brand equity in the survey region, and similar measures to determine a lift attributable to the specific campaign alone.
Our dataset illustrates the complexity of the media allocation task. There are a total of 332 unique combinations of channels used in the dataset. The most common six combinations together only account for around 16% of all campaigns. The complexity of the media allocation landscape is such that simply enumerating the most common combinations is not a feasible way to discover generalizable patterns in the data. Figure 1 plots each unique channel combination in the data, ordered by frequency of usage, with the y-axis showing the percentage of all campaigns each accounts for.

Prevalence of Unique Channel Combinations.
In terms of campaign performance metrics, all of these campaigns had brand-related objectives, and therefore the studies that Kantar ran for its clients were all “brand lift” studies. Four brand-related outcomes were measured for each campaign: (1) unaided awareness, (2) aided awareness, (3) association, and (4) motivation. The dataset does not include sales performance data, since the measurement work Kantar did on behalf of its clients focused solely on brand outcomes. Of course, it is entirely possible that advertisers had a desire to impact sales as well as brand outcomes. Sales data, however, is not part of this proprietary Kantar dataset and therefore is not available. We have four dependent variables, which are all lifts (differences between proportions). Each question used to measure the dependent variables is coded so that a value of 1 indicates a desirable response for the brand. Lift is then a proportion and lies between 0 and 1. A lift of 1, the maximum, means that every respondent in the exposed group answered affirmatively and all control respondents answered negatively. Table 1 summarizes key features of the dataset. Figure 2 shows histograms of our four outcomes. Note that each is greater than or equal to zero, with the exception of one observation, which we drop. The histograms make clear two modeling challenges. First, there is a large mass of observations at zero, for three of the four outcomes. We must account for this zero-inflation. Second, the data distributions have relatively long right tails.

Outcome Distributions Are Positive and Right-Skewed.
Advertising Campaign Dataset Overview.

Notes: Standard deviations in parentheses.
Figure 3 shows that after a mild decrease in the number of channels per campaign from 2008 to 2013, the number of channels began increasing to reach a high in 2019. As more new media channels and formats appear, complexity is likely to continue increasing.
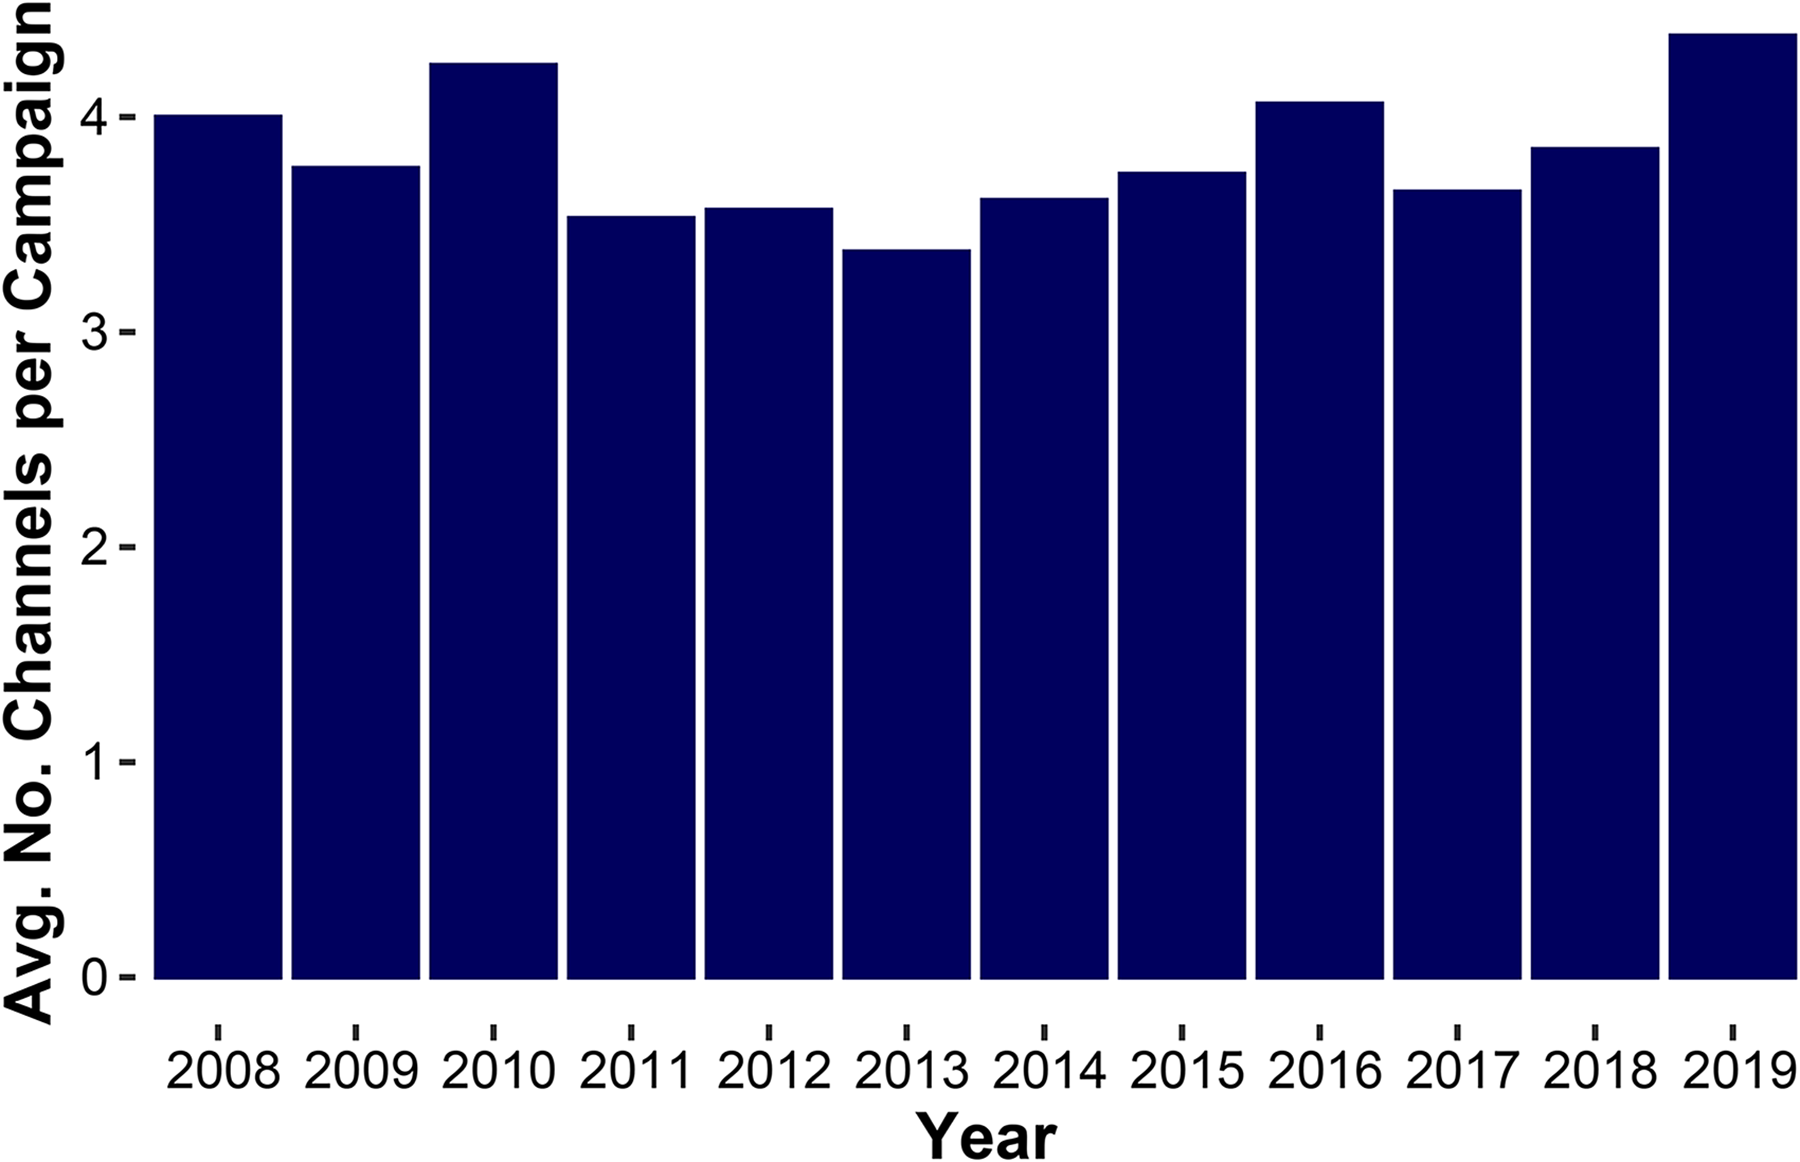
Channel Consolidation, Then Expansion.
Finally, we provide some model-free evidence that brands have idiosyncratic tendencies in media selection, which suggests we should be able to identify archetypes in the dataset. For the 11 brands most commonly appearing in our dataset, we plot the average share allocated to each channel, as well as the usage probability of each channel, in Figures 4 and 5. It is evident that whereas brands exhibit some idiosyncrasies in share of spend across channels, there is much more variation when looking at campaigns in terms of usage (a binary indicator of zero vs. nonzero spend). This supports our choice of usage as the input into the archetype model, as discussed next.
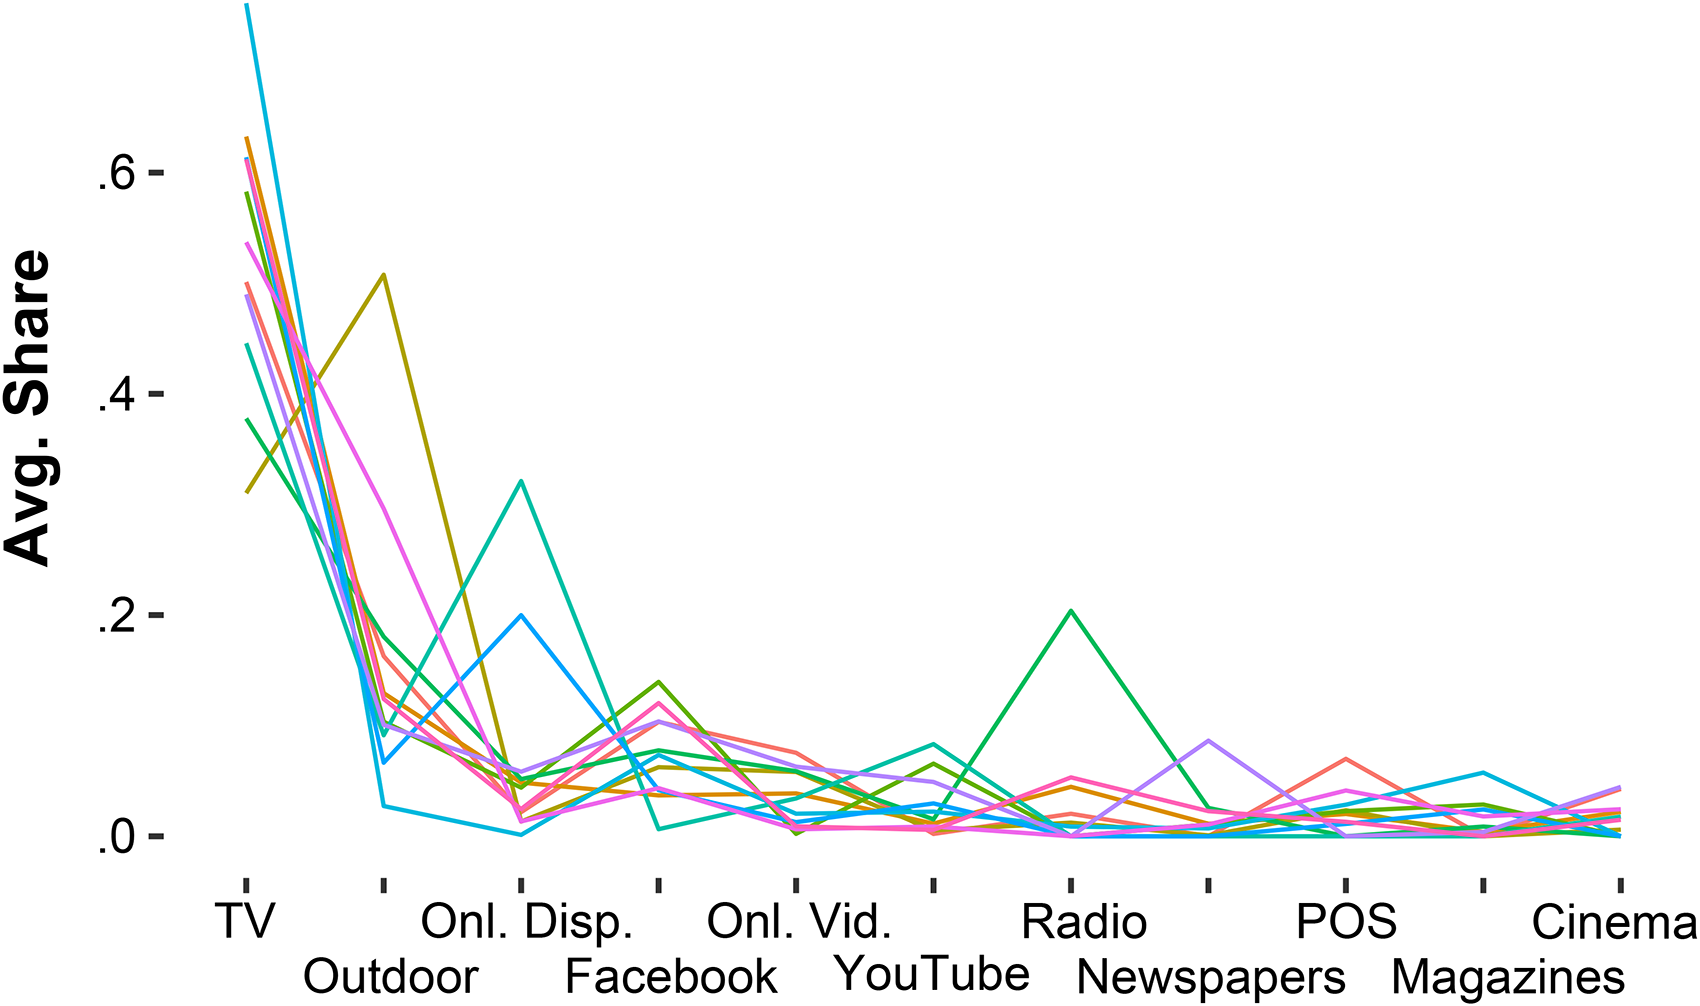
Patterns in Share.

Patterns in Usage.
Measures
Keller (1993) suggests that marketers should track changes to different dimensions of brand knowledge over time and, importantly, how these changes might be related to different marketing-mix choices. The dependent variables in our study follow this pattern, and in a structure consistent with Keller's brand equity framework. Each of the following four outcome measures is described in terms of its campaign lift, or the (Kantar-estimated) campaign-only attributable change in the metric as measured by the differences between the response of precampaign and during-campaign consumers in exposed versus nonexposed matched control groups. These campaign lifts can theoretically take values between −1 and 1, but in practice are almost exclusively nonnegative. Lastly, as all brand outcomes are measured for all campaigns, regardless of goal, and then passed through a significance filter, the resulting data include a number of exact zeros (i.e., nonsignificant quasi-experimental lifts). We must appropriately handle these exact zeros in the modeling, and we do so with a hurdle model. We define our four outcome measures next.
Unaided awareness measures knowledge and memory of the brand without direct cues or prompts. While we are not permitted to list the exact questions used on the Kantar survey, we can say that the question used by Kantar is very similar to many used across the industry. The question usually takes the form “Which brands in [category] are you familiar with?”
Aided awareness measures recognition of the brand with the aid of a prompt or a direct cue. Like the question used to measure unaided awareness, Kantar follows typical industry practices. Most questions in the industry are of the form “Which of the following brands in [category] are you familiar with?,” followed by a list of brands to select from, where respondents are allowed to indicate multiple brands.
Association is related to the second dimension of the Keller (1993) brand knowledge framework, the brand image. Association captures the presence and strength of associative connections to the brand, regardless of favorability. Explicitly, it considers whether respondents can connect a particular message, positioning statement, slogan, or other stimuli used in advertisements to the focal brand. The questions used to measure this are often dependent on the category or even the specific brand. Some very general associations, such as “high quality” or “trustworthiness,” can be measured for a wide variety of brands and categories. Two examples of this type of question have the form “Which of these brands is the most [association]?” or “Which of these brands has the slogan: [slogan]?”
Motivation is an index of brand metrics meant to proxy for near-term sales. The construction of the exact metric is proprietary, but it is highly correlated with purchase intent (which is one of its constituent metrics), so we interpret findings as if motivation is essentially purchase intent. Of the four metrics, motivation is the most like a sales measure, thus providing the closest (or at times identical) measure to the existing body of work on cross-media effects described in Table 1. We then make use of both the subset of the 11 channels selected (binary indicators of positive spend) as well as the share of campaign budget spent on each channel as the focal point of our analysis, and in the empirical study of archetypes (or clusters) that we describe next. We also control for time (year) and spend concentration (defined below), and we use the brand and category (industry) as control variables in a random intercepts specification.
Methods
Descriptive Stochastic Frontier Analysis
In our initial discussion, we highlighted that practitioners are concerned with mindset metrics consistent with theory and empirics (Srinivasan, Vanhuele, and Pauwels 2010; Vakratsas and Ambler 1999). As such, it would be logical to assume that managers are therefore optimizing their media selection toward this declared goal. However, we also described a practitioner focus and guidance on “reach maximization and sufficiency,” which carries with it the implication that channel complementarities are inconsequential, and ad exposures are at least somewhat fungible across media channels in the construction of an effective media campaign seeking to achieve these declared intermediate brand goals (e.g., awareness, associations).
Conversely, we put forward that firms (and academics) are missing the complementarity aspect of planning and focusing on coarse audience maximization strategies, rather than goal- and outcome-oriented approaches. So, to interrogate these assumptions, we rely on a “model-light” description of our data via stochastic frontier analysis (SFA). This approach is used to describe the efficiency of resource allocation for the creation of a given output. It estimates an efficient frontier and ranks the inefficiency of observed resource allocation decisions according to their proximity to this estimated theoretical line (see Krasnikov, Jayachandran, and Kumar [2009] for a detailed description of the approach). In our case, we consider channels as inputs and lifts in any of the aforementioned brand mindset metrics as the outcome. If the assumption holds that managers’ strategic choices are correct and aligned with their stated and demonstrated intent, then campaigns should be efficient in delivering brand outcomes, with an expected large mass of campaigns relatively close to the most efficient observed campaigns. Columns 2 and 3 of Table 2 show the distribution of campaigns under the efficient frontier by distance, along with their associated mean observed lifts (outcome).
SFA Mindset Metric Lift.
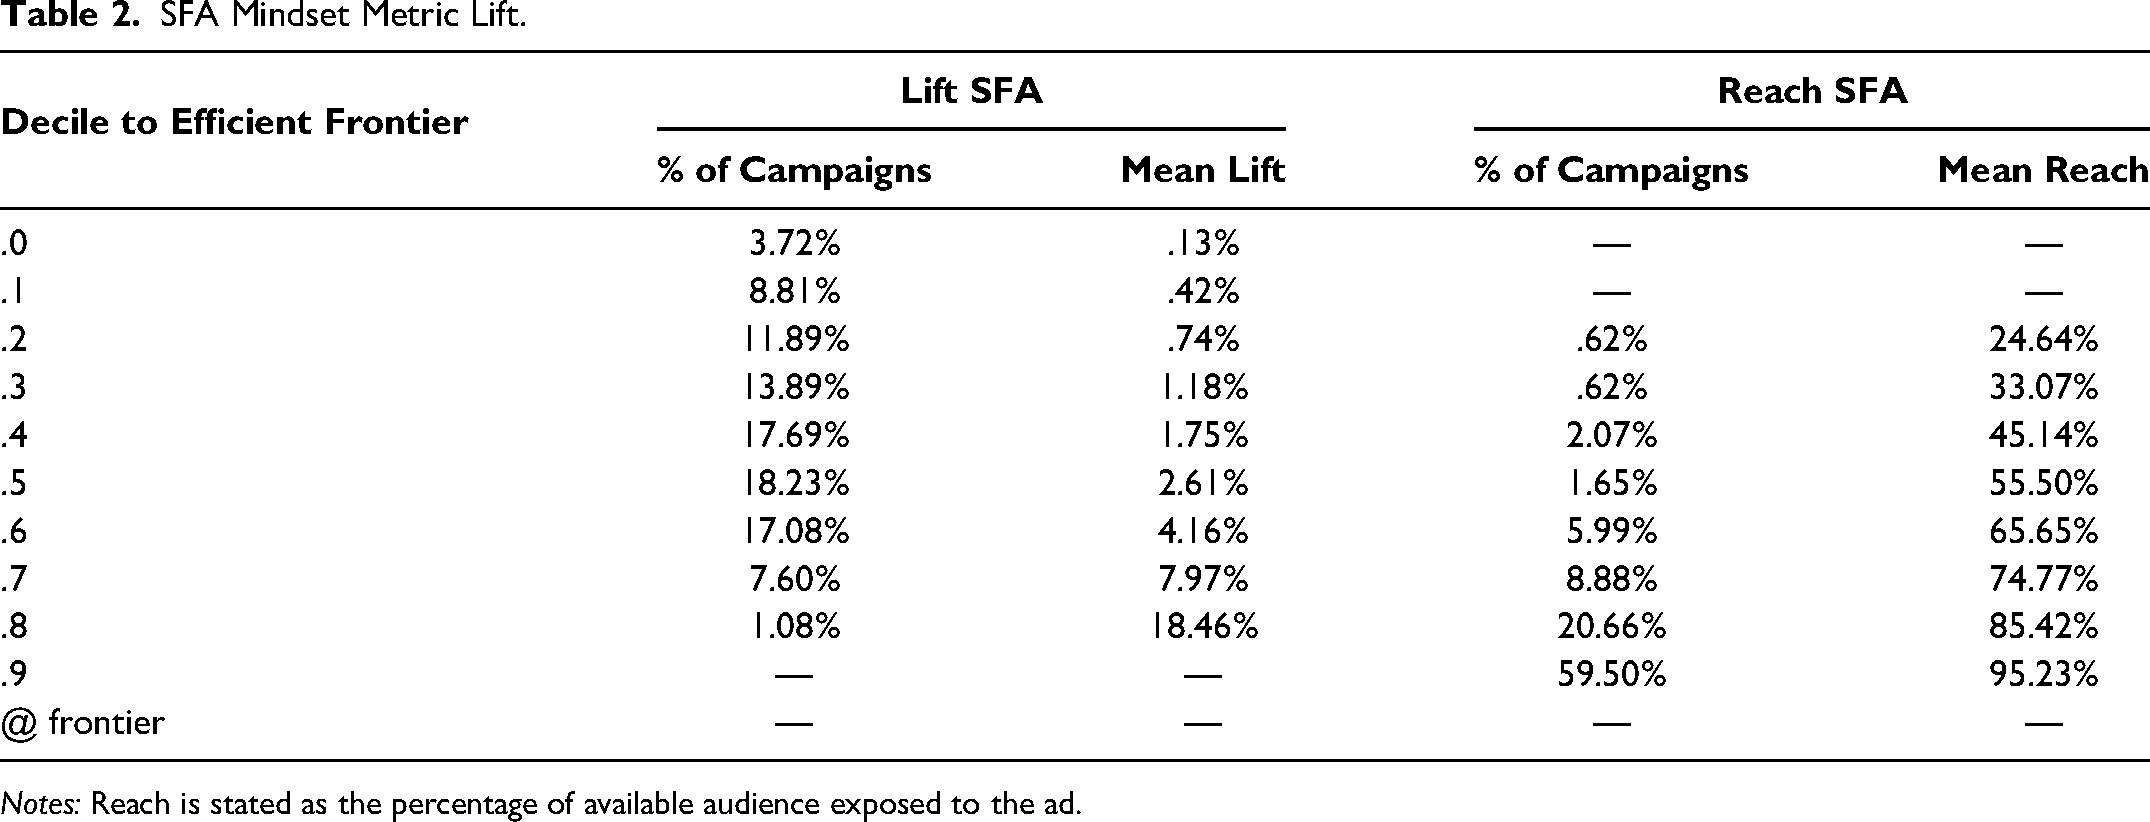
Notes: Reach is stated as the percentage of available audience exposed to the ad.
First, we must recognize that there is no ex ante expectation that campaigns would reach the efficient frontier, but the best performers do highlight what is practically achievable. However, it is rather surprising that so few campaigns exist at the top of the effectiveness ladder, and that the disparity of average outcomes is so large. Furthermore, efficiency/inefficiency with respect to brand metrics appears to be approximately normally distributed around the midefficiency point. This result provides some evidence against the assumption that managers and media planners are already making optimal choices, despite the practical guidance that 60% of their advertising should move these metrics. 2
Next, we consider a different construction of the stochastic frontier where the intended outcome is campaign reach. As noted previously, practitioners are also given the guidance to maximize reach, which carries the risk of downgrading or entirely dismissing complementarities, as planners can opt for channels with larger audiences and continuously pay more to reach increasingly greater proportions of them, with no consideration for any mechanical or functional differences between channels and their consequences for the campaign goal. Columns 4 and 5 of Table 2 show these results.
This second frontier shows a markedly different pattern. With respect to reach, 80% of campaigns fall near the two highest reach-efficiency scores. This is compared with 8% of campaigns in the two highest efficiency bands for lift. It is clear that optimization is happening against reach, but not campaign goal. Managers are indeed following industry practice and guidance by organizing campaigns around achieving highest reach. Yet, the disconnect between both frontiers suggests that managers’ belief of reach sufficiency is incorrect, otherwise brand metrics would similarly improve with reach. Lastly, as the reach sufficiency (and channel/impression fungibility) argument stood in direct opposition to the concept of complementarities, we take this as some initial evidence supporting our argument that complementarity is a crucial component of planning media mixes. We next we turn to the main analysis of complementarity effects.
Main Analysis
Our modeling approach must account for several important features of the dataset. These features are (1) complex interactions between channels through campaign types, (2) the skewed and bounded shape of the outcome distributions, and (3) the presence of a group of exact zeros on each of the outcome variables. We handle the first using a Bayesian latent class approach, and the second two with a gamma hurdle regression model.
Campaign Types and Channel Interactions
Including higher-order interactions comes with a combinatorial challenge. With 11 media channels in our data, specifying every possible pair of channels, triple of channels, and so on, up to all 11, would require 211 − 1 = 2,047 interaction terms. In the cross-effects research tradition, a typical solution to this combinatorial explosion is to limit the analysis to pairwise interactions between media channels. Limiting interactions to pairs would reduce the number of combinations to 55. However, even this number of combinations is intractable for modeling and interpretation and would result in the same issues previously documented by Danaher and Dagger (2013). For the sake of illustration, we report our attempt at this approach using a regression approach similar to what is found in much of the media cross-effects literature in the Web Appendix.
Instead of blindly or exhaustively including interaction terms, which is doomed to fail, we took a practical approach. We are interested in how different campaign types compare across the outcome measures. This means that we should only be concerned with the combinations of channels that actually appear in data (i.e., a vast number of the theoretically possible combinations in fact are never observed). Further, we are interested in comparing the effectiveness among “typical” media plans. This type of comparison is distinct from trying to statistically estimate interactions between individual channels to ascertain the extent to which they operate in synergy.
Taking this logic into account, our modeling approach empirically finds common media plan “archetypes” across all of the campaigns in our data. These archetypes embody different media channel combinations. We used Bayesian latent class analysis to find the archetypes, which allows us to determine the most typical and therefore practically relevant combinations. Latent class analysis finds campaign archetypes, and each individual campaign is assumed to be some mixture of the archetypes. The degree of each archetype is given by membership probabilities that are estimated for each campaign. Latent classes can then be used for clustering by assigning each campaign to the archetype for which it has the highest membership probability. Using latent classes, we limit the number of combinations to consider, and the archetypes are interpretable and relate to theory. Finally, by estimating the archetypes from actual campaign spends, we ensure that the combinations we study are substantially present in the data. At the same time, latent classes exhibit channel combinations of more than two, so that we are not confined to dyadic relationships.
One alternative to latent class analysis is a neural network. This would allow us to handle a high degree of complexity and determine combinations empirically, but neural networks are notoriously difficult to interpret. Latent classes or archetypes, in contrast, are easily interpretable, and not only do they aid in the main task of understanding effectiveness, the patterns of channel usage they uncover are findings in their own right.
Bayesian Latent Class Model
We estimate the latent class model twice, once as an exploratory exercise to determine the best number of latent classes, and a second time in a joint estimation with the regression. The outcomes or dependent variables in the latent class model are indicators of which channels were used on a given campaign, which will later become independent variables in the gamma hurdle model. In the exploratory latent class model—estimated by itself—membership probabilities and class parameters are estimated. In the second latent class model—integrated with the regression—the membership probabilities and class parameters are estimated, just as before. However, in the integrated version, the membership probabilities for each campaign are included as covariates in the regression. These parameters will reflect the differential performance associated with each archetype.
To explain the latent class model, we start with the likelihood contribution for a single observation. A single observation is a vector of channel usage indicators. Let 


Exploratory Latent Class Analysis
To determine the number of classes, we estimated an exploratory latent class model seven times, with the number of classes varying from two to eight. Each time we computed the approximate leave-one-out cross-validation for Bayesian models using Pareto smoothed importance sampling (PSIS-LOO CV; Vehtari, Gelman, and Gabry 2017; Vehtari et al. 2022). This allows for model comparisons using the pointwise expected log predictive density (ELPD). The best ELPD is reached at seven classes. The ELPD values are in the Web Appendix.
The likelihood function in Equation 3 is invariant to permutations of the class labels. When running separate chains, convergence for class-specific parameters can fail because of this, since separate chains often explore relative to different orderings, which has the effect of reordering the columns of
Outcome Model: Bayesian Gamma Hurdle Regression
We have four dependent variables, which are all lifts expressed as decimals (differences between proportions). The outcome (lift) distributions are positively skewed. In principle, a lift could be negative, but we observe this only once in the entire dataset. 3 Thus, in practical terms, lifts are bounded at 0 and 1. There are some exact zeros, however, which represent campaigns that had no detectable lift for a given outcome. To appropriately model each of these aspects, we use a hurdle model with a gamma density for the response distribution.
We selected a gamma regression by visual posterior predictive checks using only shares as variables. Candidate distributions were normal, log-normal, exponential, exponentially modified Gaussian, Laplace, and gamma. The gamma best fit the lift distributions above zero. We then add the hurdle component to account for the mass at zero. 4
Gamma regression is a generalized linear model (GLM) that assumes a gamma distribution for the conditional distribution of the response. GLMs use a link function to transform the conditional mean of the response, which in our case can only take nonnegative values, to the same space as the linear predictor (xnβ). We pair this with a hurdle component paramaterized by δ0n. If yn is an observation of an outcome, and xn contains covariates, then the generative model for yn is
Intuitively, the outcome model has two components. The first component accounts for whether a lift value is exactly zero or positive. The second component models the magnitude of the outcome conditional on the outcome being positive. The first component, the hurdle, has a simple specification with random intercepts that vary according to category. Letting a index categories and letting an stand for the category of campaign n,
The second component, the gamma GLM, models the values of the outcomes conditional on those values being positive. The intercept β0n has a random intercepts specification. Recalling that a indexes categories and letting j index brands:


Variables
The gamma hurdle regression includes a random intercept by category for the hurdle as shown in Equation 5, and a random intercept for the outcome regression by category and brand as shown in Equation 6. In addition, the gamma regression includes archetype membership probabilities for each campaign, the concentration of spend for the campaign, a time trend, and the spend shares for each channel.
The membership probabilities link the latent class model to the gamma hurdle model. At each iteration of the sampler, membership probabilities for each campaign are calculated conditional on the current latent class parameter draws and included in the gamma hurdle as covariates. We leave Archetype 2 out as the reference class. 5
We define
We include a time trend, ranging from 2008 to 2019. Finally, we include the shares {snc} for each campaign and channel. We leave online video out as the reference channel. 6 Table 3 summarizes the variables used and which models they enter.
Variable Definitions.

Results
There are two sets of results to explore. The first set is descriptive and details different campaign archetypes. These results show which groups of media channels are commonly used together as well as typical spend concentrations. These descriptive results are shown next.
The second set shows the estimates of the regression coefficients relating archetypes, campaign concentrations, and allocation shares to the four outcomes. These results show which clusters and individual channels are associated with better advertising performance on each of the outcomes. We call this the outcome model and present the results subsequently.
Descriptive Results
Table 4 gives the archetype profiles numerically, and the same results are plotted in Figure 6. The archetype prevalence is the parameter estimate of (νc), which empirically is almost the same as the percent of campaigns assigned to each archetype. 7 For each archetype, we also include in Table 4 the probability of usage for each channel, as well as the average concentration of spend among campaigns assigned to each archetype.

Archetype Profiles.
Archetype Profiles.

TV is the most commonly used channel, and cinema the least. Three channels see usage less than half the time for any archetype: cinema, magazines, and point of sale. Archetype 2 is the most prevalent (23%). To ease interpretation, we also provide Figure 7.
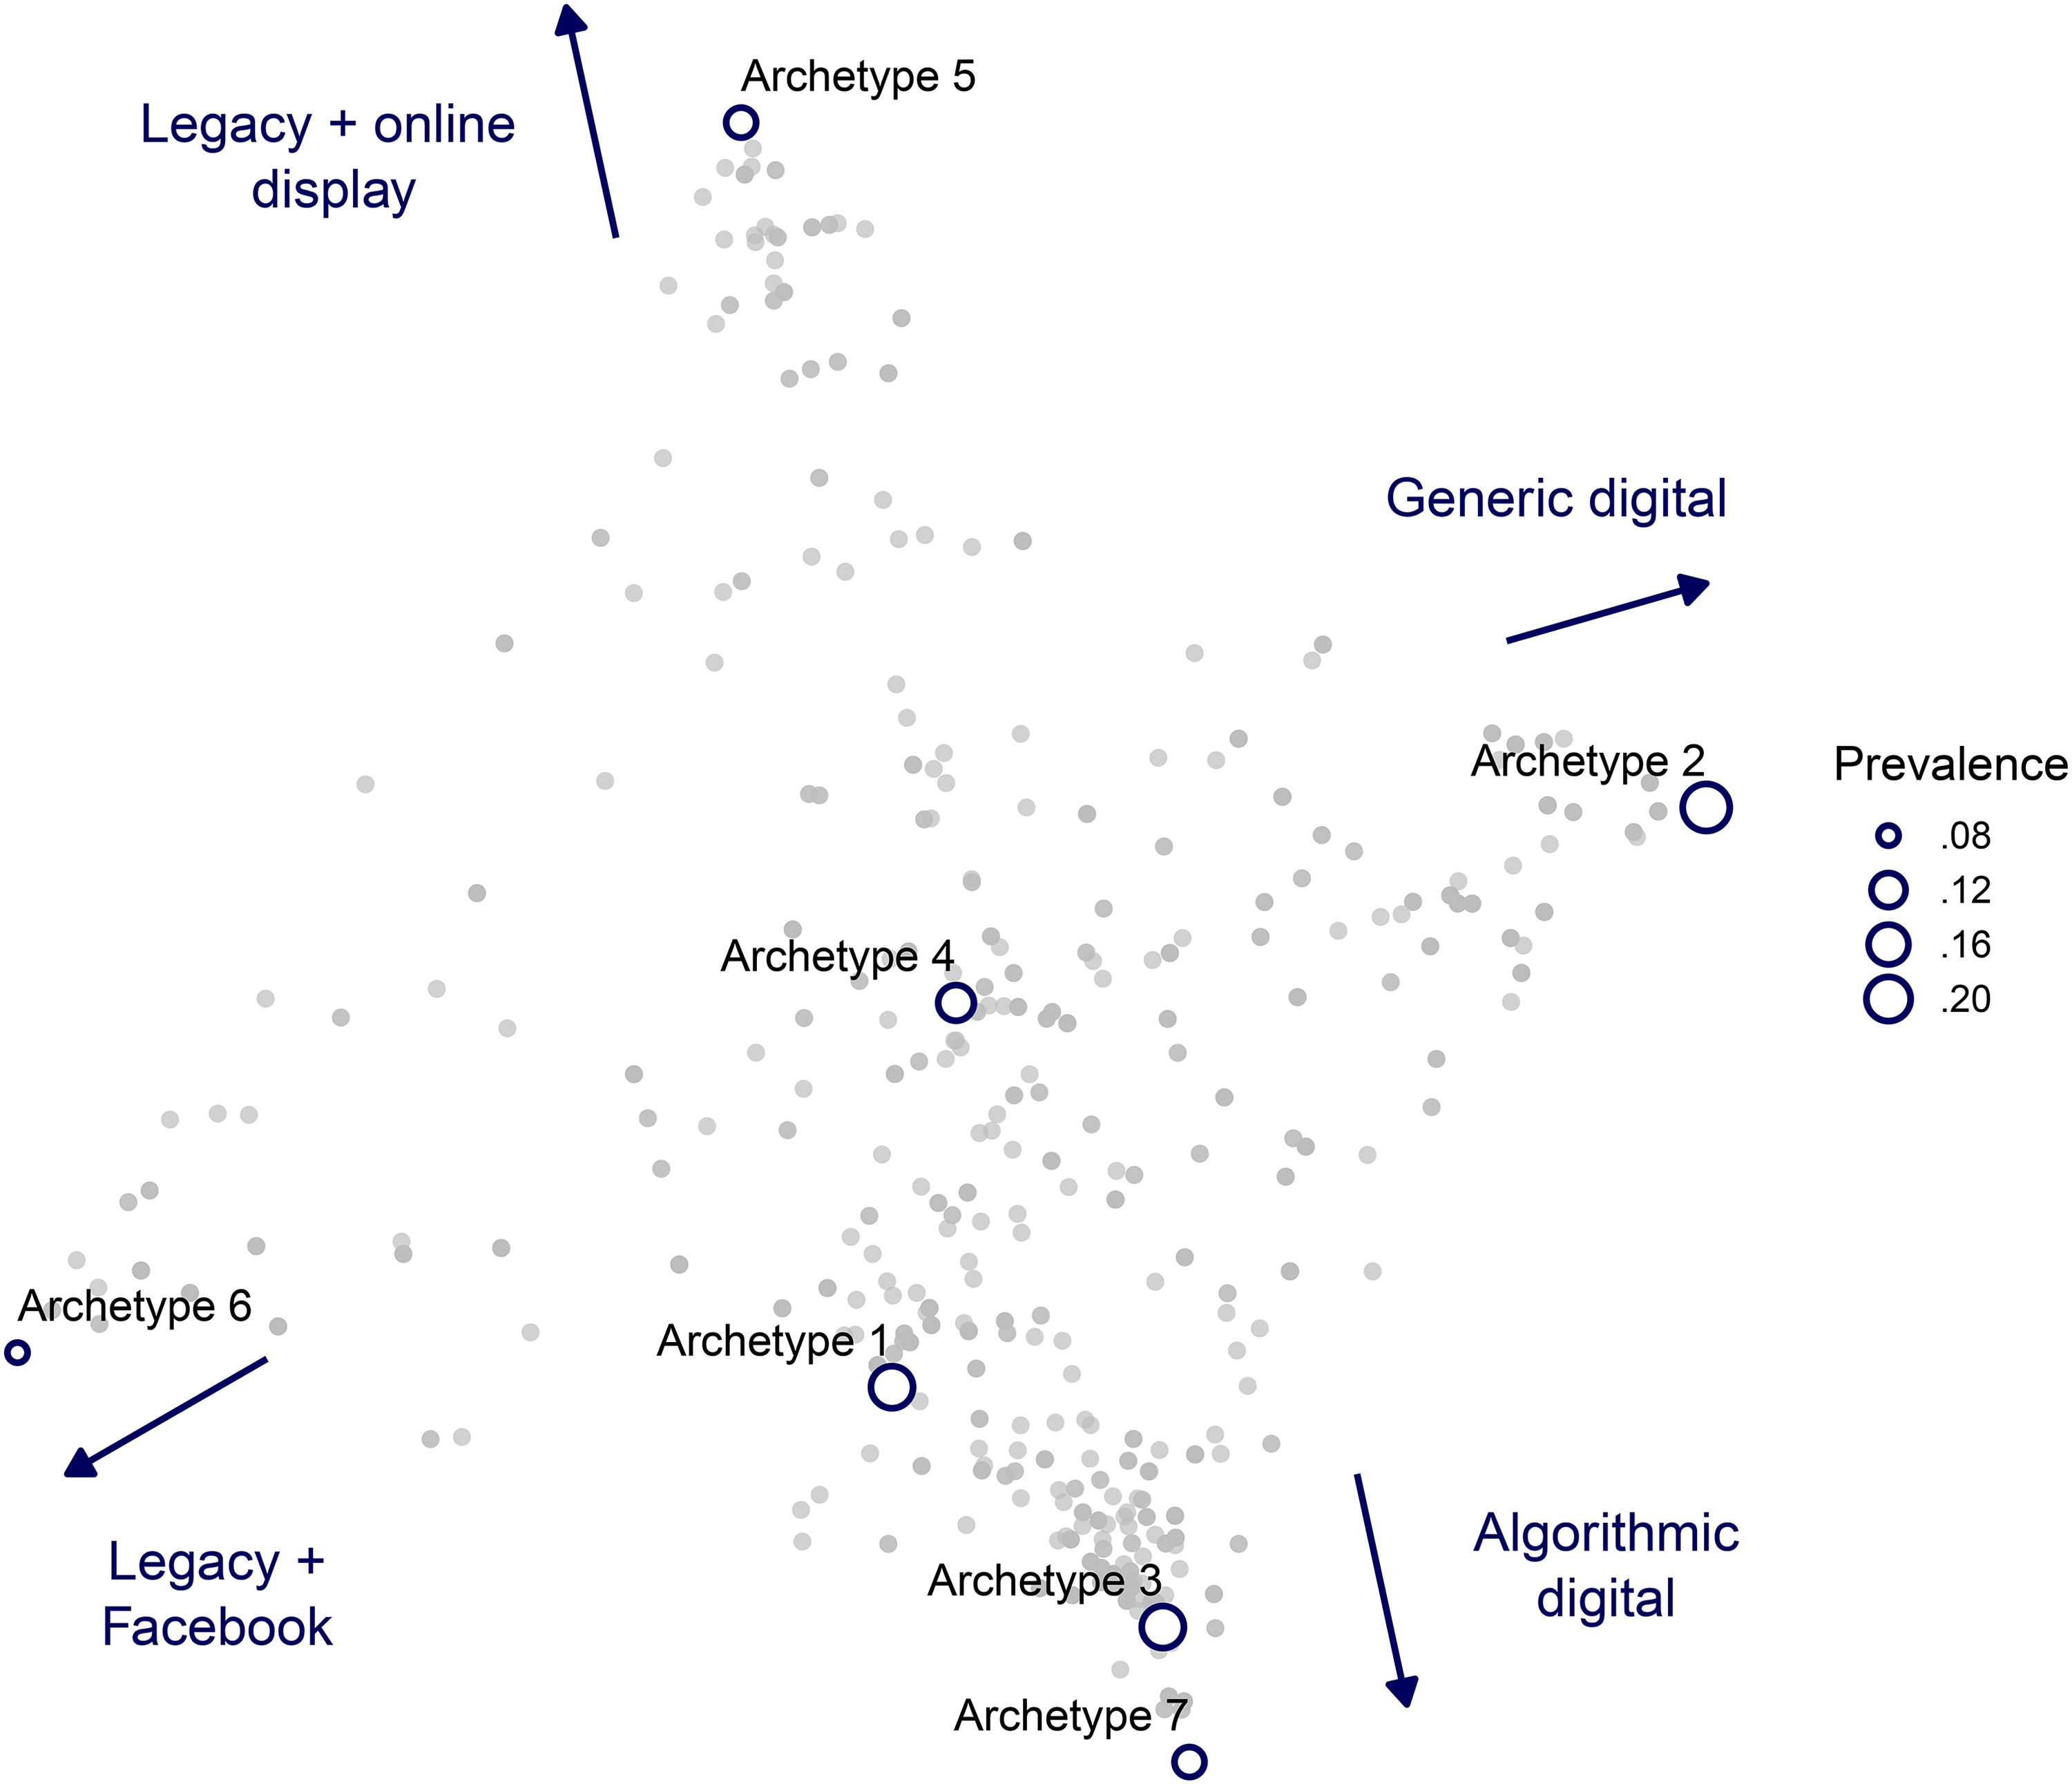
Archetype Map.
The map was created by multidimensional scaling with the L1 norm for measuring distance (also known as city block or Manhattan distance). The campaigns are plotted by weighting the archetype coordinates by the campaign membership probabilities. An important takeaway from the archetype map is that campaigns are not easy to organize in terms of a few dimensions such as legacy versus digital or broad versus narrow. Archetype 5 is mostly legacy channels, but with a high tendency to use online display. Archetype 6 is similarly reliant on legacy channels but with a heavy use of Facebook.
The map is drawn and labeled according to what best discriminates archetypes. This does not mean that archetypes toward the extremes are “pure play” but rather that they are distinctive for using some channels more or less. For example, Archetypes 7, 3, and 1 make high use of channels with algorithmic targeting (e.g., YouTube) but vary in degree of legacy channel usage. Archetype 7 uses outdoor 73% of the time, while Archetype 1 uses outdoor 6% of the time. Despite this, they are still close because of the high tendency to include algorithmic digital channels.
Integrated Model Results
In Table 5, we present the results of the integrated latent class and Bayesian regression. As a reminder, the link between the two models is that the archetype membership probabilities for each campaign are included as covariates in the regression. Also recall that the regression incorporates a hurdle for zero versus nonzero response, and fits a gamma density to the positive portion of the response distribution. The results in the table are conditional on clearing the hurdle. Each coefficient should be viewed as the estimated effect on a campaign outcome given that the campaign has any detectable impact at all. Since we use a Bayesian approach, the results take the form of probability distributions for each parameter. For the coefficient tables in Table 5, we report the posterior means and 95% credible intervals.
Outcome Model Results.

Notes: CI:L is the 2.75th percentile and CI:U is the 97.5th percentile, which together form the 95% credible interval. Boldface indicates statistical significance.
Interpreting the coefficients here is not as straightforward as in conventional linear regression. As explained previously, in order to model an outcome with a gamma distribution, a link function is necessary to bridge between the right-hand-side variables and the responses. This is because the right-hand-side variables can often take negative values, which are not in the support of the gamma density. The link function we use is the natural logarithm. The inverse link—the exponential, in our case—is applied to the linear predictor (xn
Archetype membership probability coefficients are relative to Archetype 2, the reference level (which therefore has no coefficient). Each coefficient shown is the factor of improvement over Archetype 2. Similarly, spend share coefficients are relative to online video.
Starting in Column A of Table 5, we have the results for motivation. Archetype 4 has the largest significant coefficient. However, the share of spend on cinema has a larger coefficient, and share spent on YouTube has a coefficient nearly as large, on average. Also note that the lower bound of the credible interval for Archetype 3 is higher than for Archetype 4. This suggests the possibility that different channel selections come with different risk profiles, which highlights a reality where the concept of “best strategy” is more nuanced, with the potential to at least consider the risk appetite of brands. In fact, scanning across the four dependent variables in Table 5, this relationship between Archetypes 3 and 4 holds in all but one case. Note that concentration is not significantly different from 1 (multiplicative identity) for motivation.
Coefficients for association are in Table 5, Column B. We see that again Archetype 4 has the largest coefficient among the archetypes, but four main effects (spend shares) are at least as large: cinema, YouTube, newspapers, and point of sale. Concentration has a significant coefficient below 1, meaning more concentrated spend relates to reduced lifts for association. This may be due to the fact that higher concentrations tend to be common among campaigns that spend more on TV, outdoor, or other “legacy” media, whereas lower concentration reflects experimentation and adoption of new channels. Heavy use of TV and other legacy media may in turn constrain or dampen brands’ ability to create changes in association, whereas more diverse and newer channels may afford more variability in exposure, new means of communication, and new signaling mechanisms. All conditions and consequences that are consistent with Keller's (1993) theory and practical implications, as well as some early empirical evidence on advertising variance (Haugtvedt et al. 1994).
See coefficients for unaided awareness in Table 5, Column C. The largest archetype coefficient is for 4, but by a very small margin. If the reference class were changed from 2 to 5, it is likely that Archetypes 3, 4, 5, and 7 would not be significantly different from one another. For unaided awareness, the coefficients on archetypes are generally larger than the coefficients on spend shares (with the exception of cinema). In fact, several of the share coefficients are below 1, with magazines having an especially low coefficient.
Table 5, Column D, shows coefficients for aided awareness. As shown in Table 1, aided awareness has a lower average lift and a higher standard deviation than the others. Aided awareness also has more zeroes, consistent with a ceiling effect for large brands (Srinivasan, Vanhuele, and Pauwels 2010). The larger variation and reduced signal in the aided awareness lift data manifests in much larger credible intervals for the coefficients. However, relative effects still reveal interpretable results, such as the fact that Archetype 4 and share of spend on cinema have distinctly larger impacts on aided awareness than the other variables.
While the raw coefficients are very informative, model simulations can show the relationships between outcomes and more holistic changes to campaign structure, encompassing channel selection, spend shares, and concentration. We show these holistic relationships in Figures 8 and 9. The x-axis of each figure starts on the left with the posterior predictive median for a campaign of Archetype 2: membership probability of 1 for Archetype 2, and the average channel selection, spend, and concentration of Archetype 2 campaigns in the data. Then we move the membership probability, average spends, and average concentration values progressively toward different clusters, and plot the predicted outcome. In Figure 8 we plot the median value of the posterior predictive distribution, and for Figure 9 we plot the 2.75th percentile. The differences indicate that sometimes an approach optimized for a median result would not be the same as more risk-averse “maximin” approach. For example, Archetype 4 delivers by far the best median result on aided awareness, but by far the worst 2.75th percentile result—it is a high-risk, high-reward campaign structure for aided awareness.

Archetype Outcome Profiles: Median.
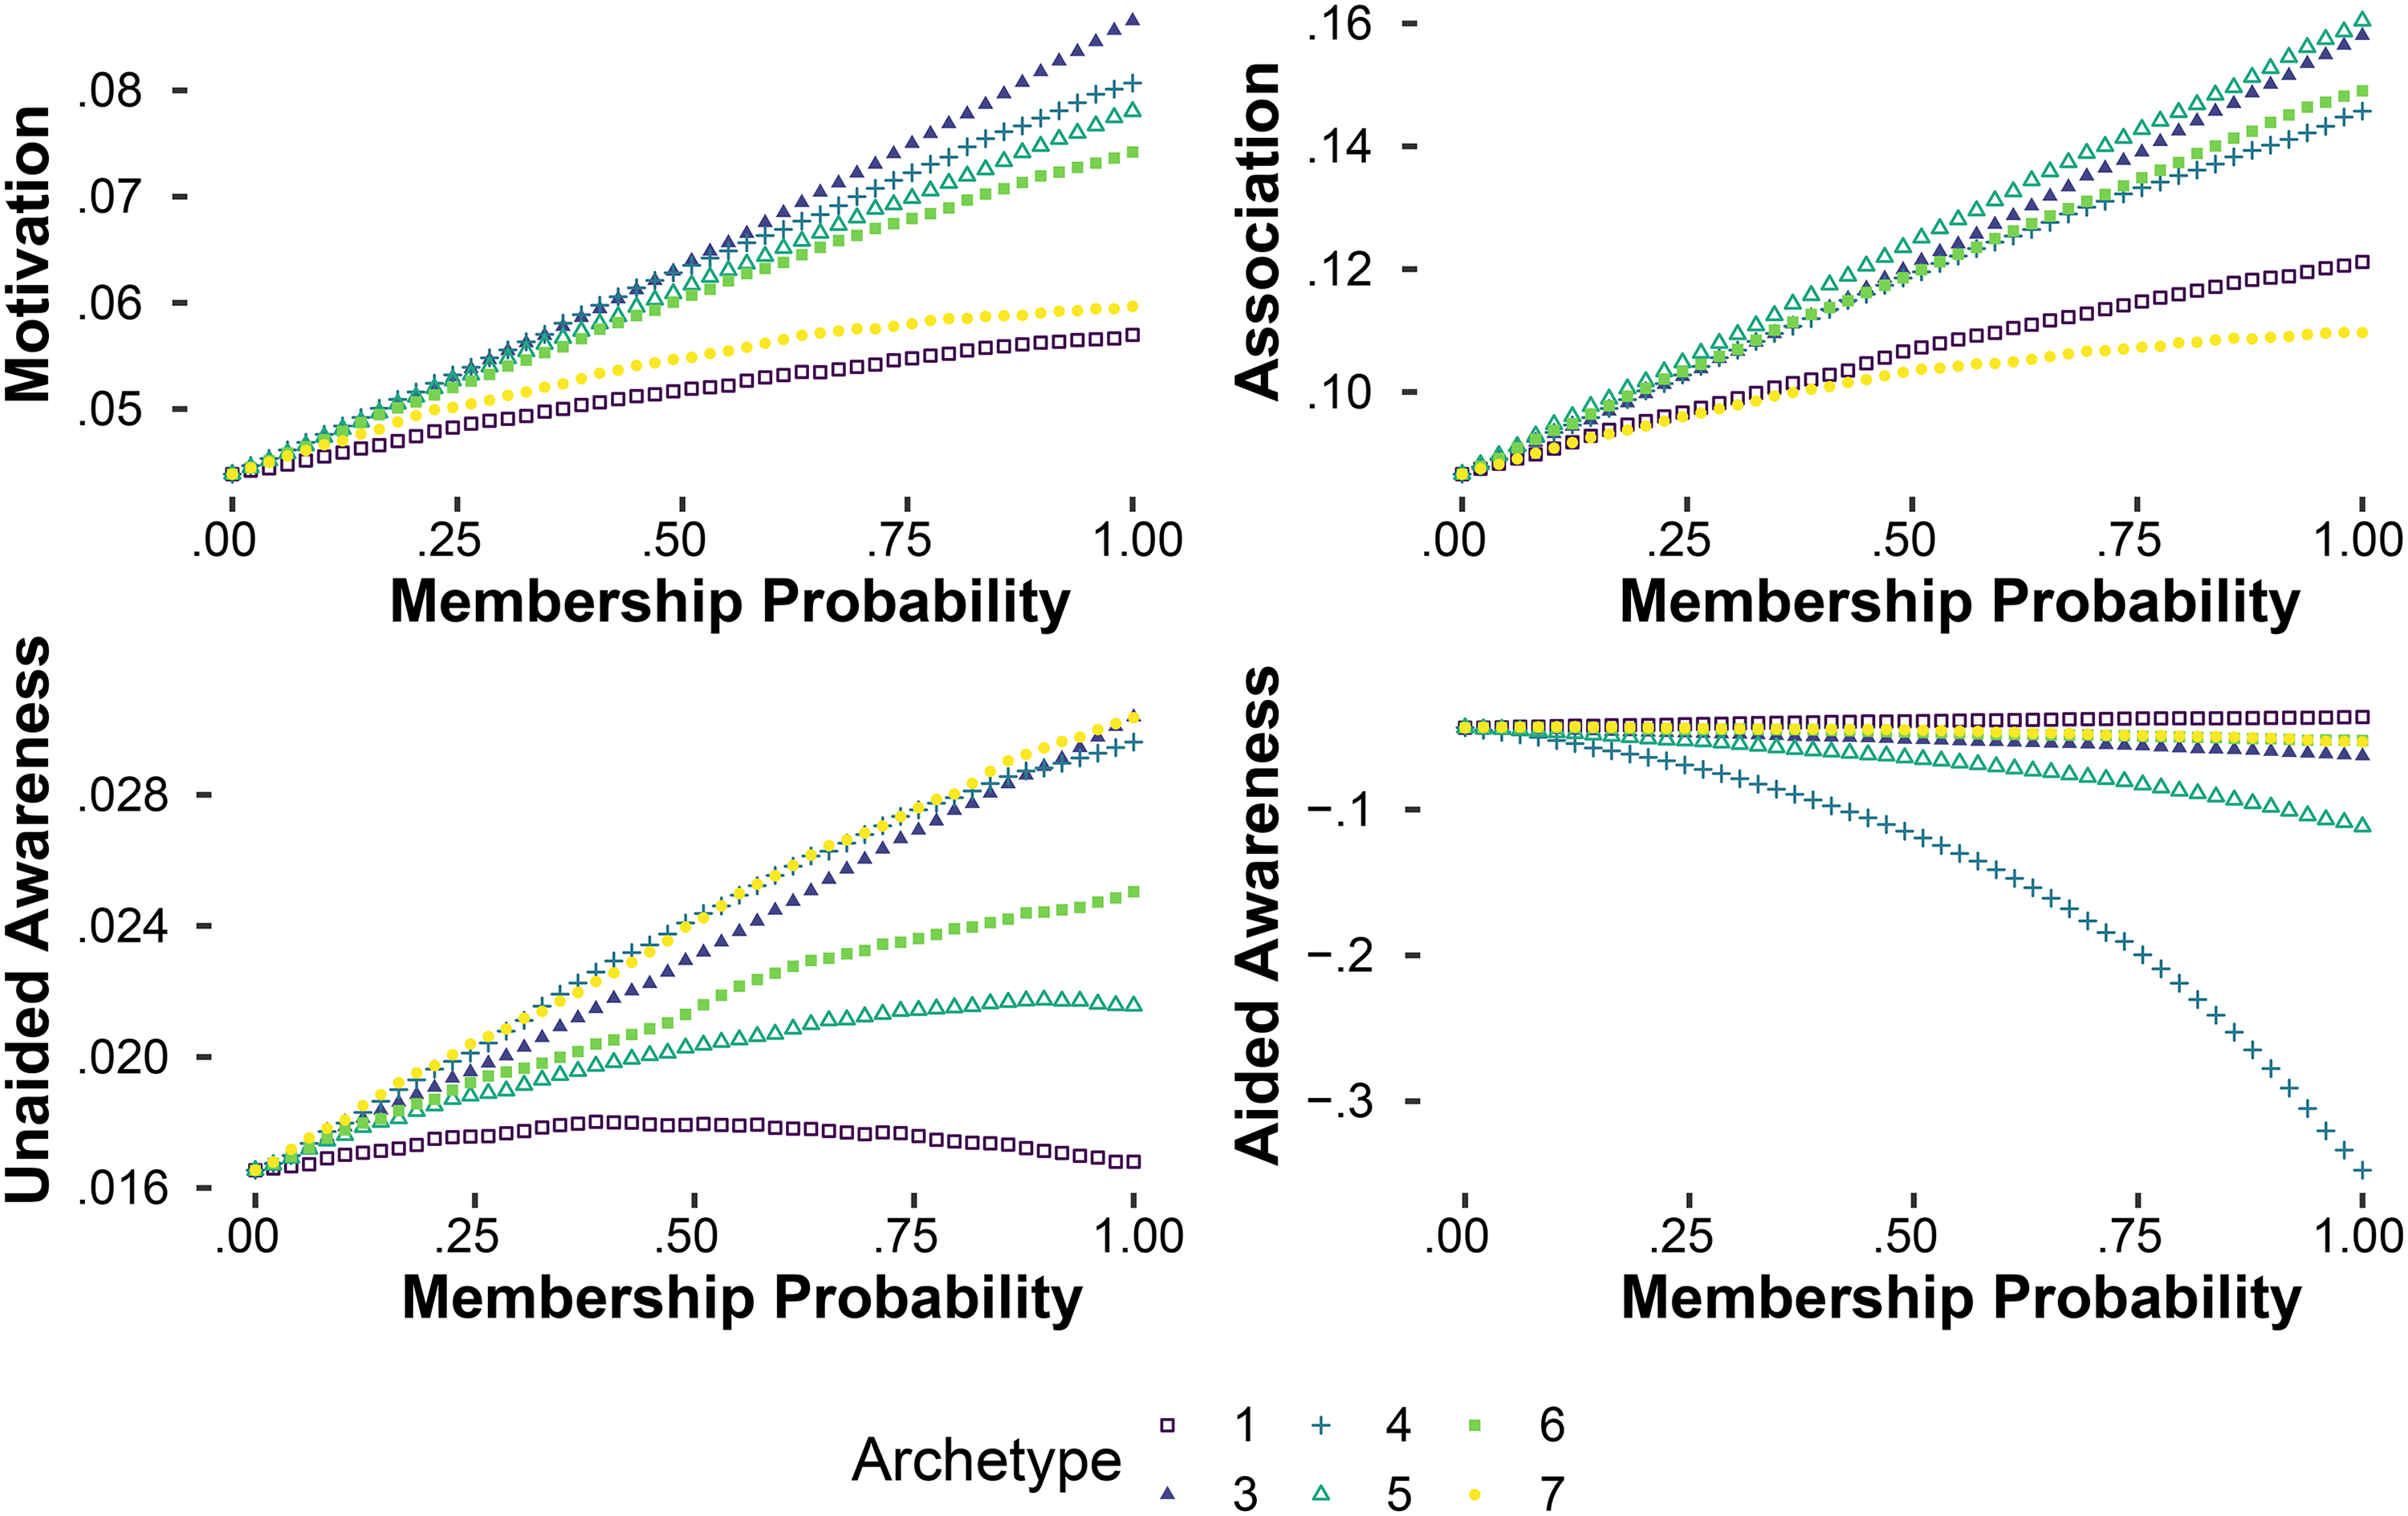
Archetype Outcome Profiles: 2.75th Percentiles.
To give a sense for how the best archetype differs by industry or category, we show in Table 6 the best archetype coefficient when the model is estimated on subsamples of the data. While some aggregation is necessary to maintain reasonably large sample sizes, we are able to provide results for three mega-category subsamples: consumer packaged goods (CPG), services, and technology and durables. Notably, different categories have distinctly different profiles. Archetype 6 is best for all four outcomes in CPG, but for none of the outcomes in the other categories. Archetype 4, though best in the overall dataset, is only best in one case (unaided awareness in the services category) for the subsamples. Archetype 6 is notable for having a very high probability of combining TV, outdoor, and Facebook. That this triple performs extremely well for CPG calls into question the common conceptual division between traditional and digital media. It appears traditional and digital media can be highly complementary.
Archetypes with Highest Coefficient by Industry.
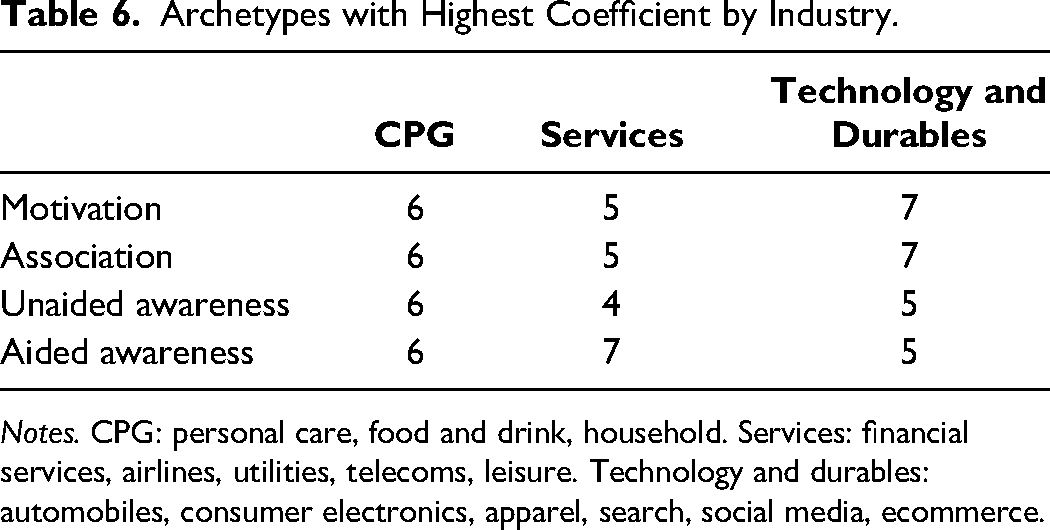
Notes. CPG: personal care, food and drink, household. Services: financial services, airlines, utilities, telecoms, leisure. Technology and durables: automobiles, consumer electronics, apparel, search, social media, ecommerce.
The technology and durables category shows a clear division between awareness (“top of funnel”) and motivation and association (“lower funnel”). Archetype 7, notably high in Facebook and YouTube, unsurprisingly is associated with lower-funnel metrics, while Archetype 5, which is distinctly lower in YouTube and Facebook, associates with upper-funnel awareness metrics.
Prescriptive Results
The model can be used to simulate the impact of possible changes to marketing media planning. For each of the four dependent variables (motivation, association, unaided awareness, and aided awareness) we consider the predicted impact of a change in the planning mix. These predictions are not intended to be causal estimates, but instead they indicate potential opportunities for improving lifts based on typical campaign performance in our data. The possible changes we consider all take the form of “acting like” a particular archetype. In concrete terms, “acting like” an archetype means selecting channels with the same probabilities as that archetype (i.e., to act like Archetype d, choose channel c with probability wcd), and then conditional on channels selected, allocate spend like the average member of that archetype in the dataset.
To implement the simulation, we first use the model estimates for channel usage probabilities by archetype (shown in Table 4). We next compute the average spend in the dataset by archetype, after each campaign is assigned to the likelihood for which it has highest membership probability. The spend shares by archetype are shown in Table 7.
Average Spend Shares by Archetype.

Notes: Shares below .01 have been rounded to zero.
To generate a campaign profile that approximates an archetype, we follow the steps below. We use S to stand for simulated quantities. Consider Archetype d:
Draw channel usage indicators. For each c, draw From mean spend shares shown in Table 7 select values To ensure that the shares sum to one, normalize:
We then simulate from the posterior predictive distribution of the model to obtain expected lifts. We run the above steps for each archetype. Finally, we compare the expected lifts with average observed lifts. Table 8 shows the expected lift, in absolute terms and as a percentage improvement, for the best archetype for each outcome.
Model Recommendations.

Notes: Absolute improvement is the mean simulated lift minus the mean observed lift in the dataset. Percentage improvement is absolute improvement divided by mean observed lift in the dataset. Channel to upweight is the channel which had the largest increase in probability of usage, as a percentage of average observed usage probabilities.
Given the large amounts of money to achieve lifts, these results appear to be extremely economically meaningful. One note is in order about the improvement in aided awareness: Figures 8 and 9 show that while Archetype 4 performs much better on average, it also comes with very large risk. There is also a very high likelihood of zero lifts in the data (see the hurdle intercept in Table 5), which suggests a relatively lower amount of informative data and thus noisier estimates, but also suggests a very low baseline level of aided awareness in the dataset on which to improve. Together, these factors suggest that the improvement is credible but should be interpreted with some caution and with proper context.
Rough Financial Impact Figures
A dataset comparable to ours in richness and scope, but which also includes measurements of sales outcomes, is very unlikely to exist. Given this dataset’s ability to allow us to answer questions on relationships between media usage and brand metric lifts, the lack of financial outcomes seems a more-than-acceptable trade-off. However, despite lacking sales data linked to each campaign, we can still produce some rough back-of-the-envelope estimates of financial impact from the prescriptions in Table 8 by relying on previous research. The best match for this purpose is Srinivasan, Vanhuele, and Pauwels (2010), wherein the authors produce sales elasticities with respect to mindset metrics similar to those in our data.
The metric from our dataset which best matches the metrics from Srinivasan, Vanhuele, and Pauwels (2010) is motivation, which is a combination of consideration, purchase intent, and brand liking. The corresponding metrics reported in Srinivasan, Vanhuele, and Pauwels are brand liking and consideration. We note that purchase intent was also in Srinivasan, Vanhuele, and Pauwels’s dataset but was not used according to that paper because it was so highly correlated with consideration. Our approach for the purposes of this thought experiment are to use the elasticity of sales with respect to consideration as a lower estimate and the elasticity with respect to liking as a higher estimate. The rationale is that our metric is some combination of the two things, and so the elasticity would naturally fall somewhere between them. The reference unit we use is millions of dollars, meaning our goal is to calculate the incremental revenue per $1 million dollars of revenue that could be expected by increasing the motivation metric by .018 (first row of Table 8). Because the results from Srinivasan, Vanhuele, and Pauwels (2010) are elasticities, we need to assume a starting level of motivation. In our dataset, motivation is measured on a scale between 0 and 1, as discussed, where 1 represents 100% of respondents giving answers indicating favorable attitudes toward the brand. To produce rough figures for financial impact, we use a set of equally spaced grid points between .1 and .9, which represent different starting levels of motivation. For each grid point, we use the following formula to get estimates for incremental revenue on $1 million (ΔR):
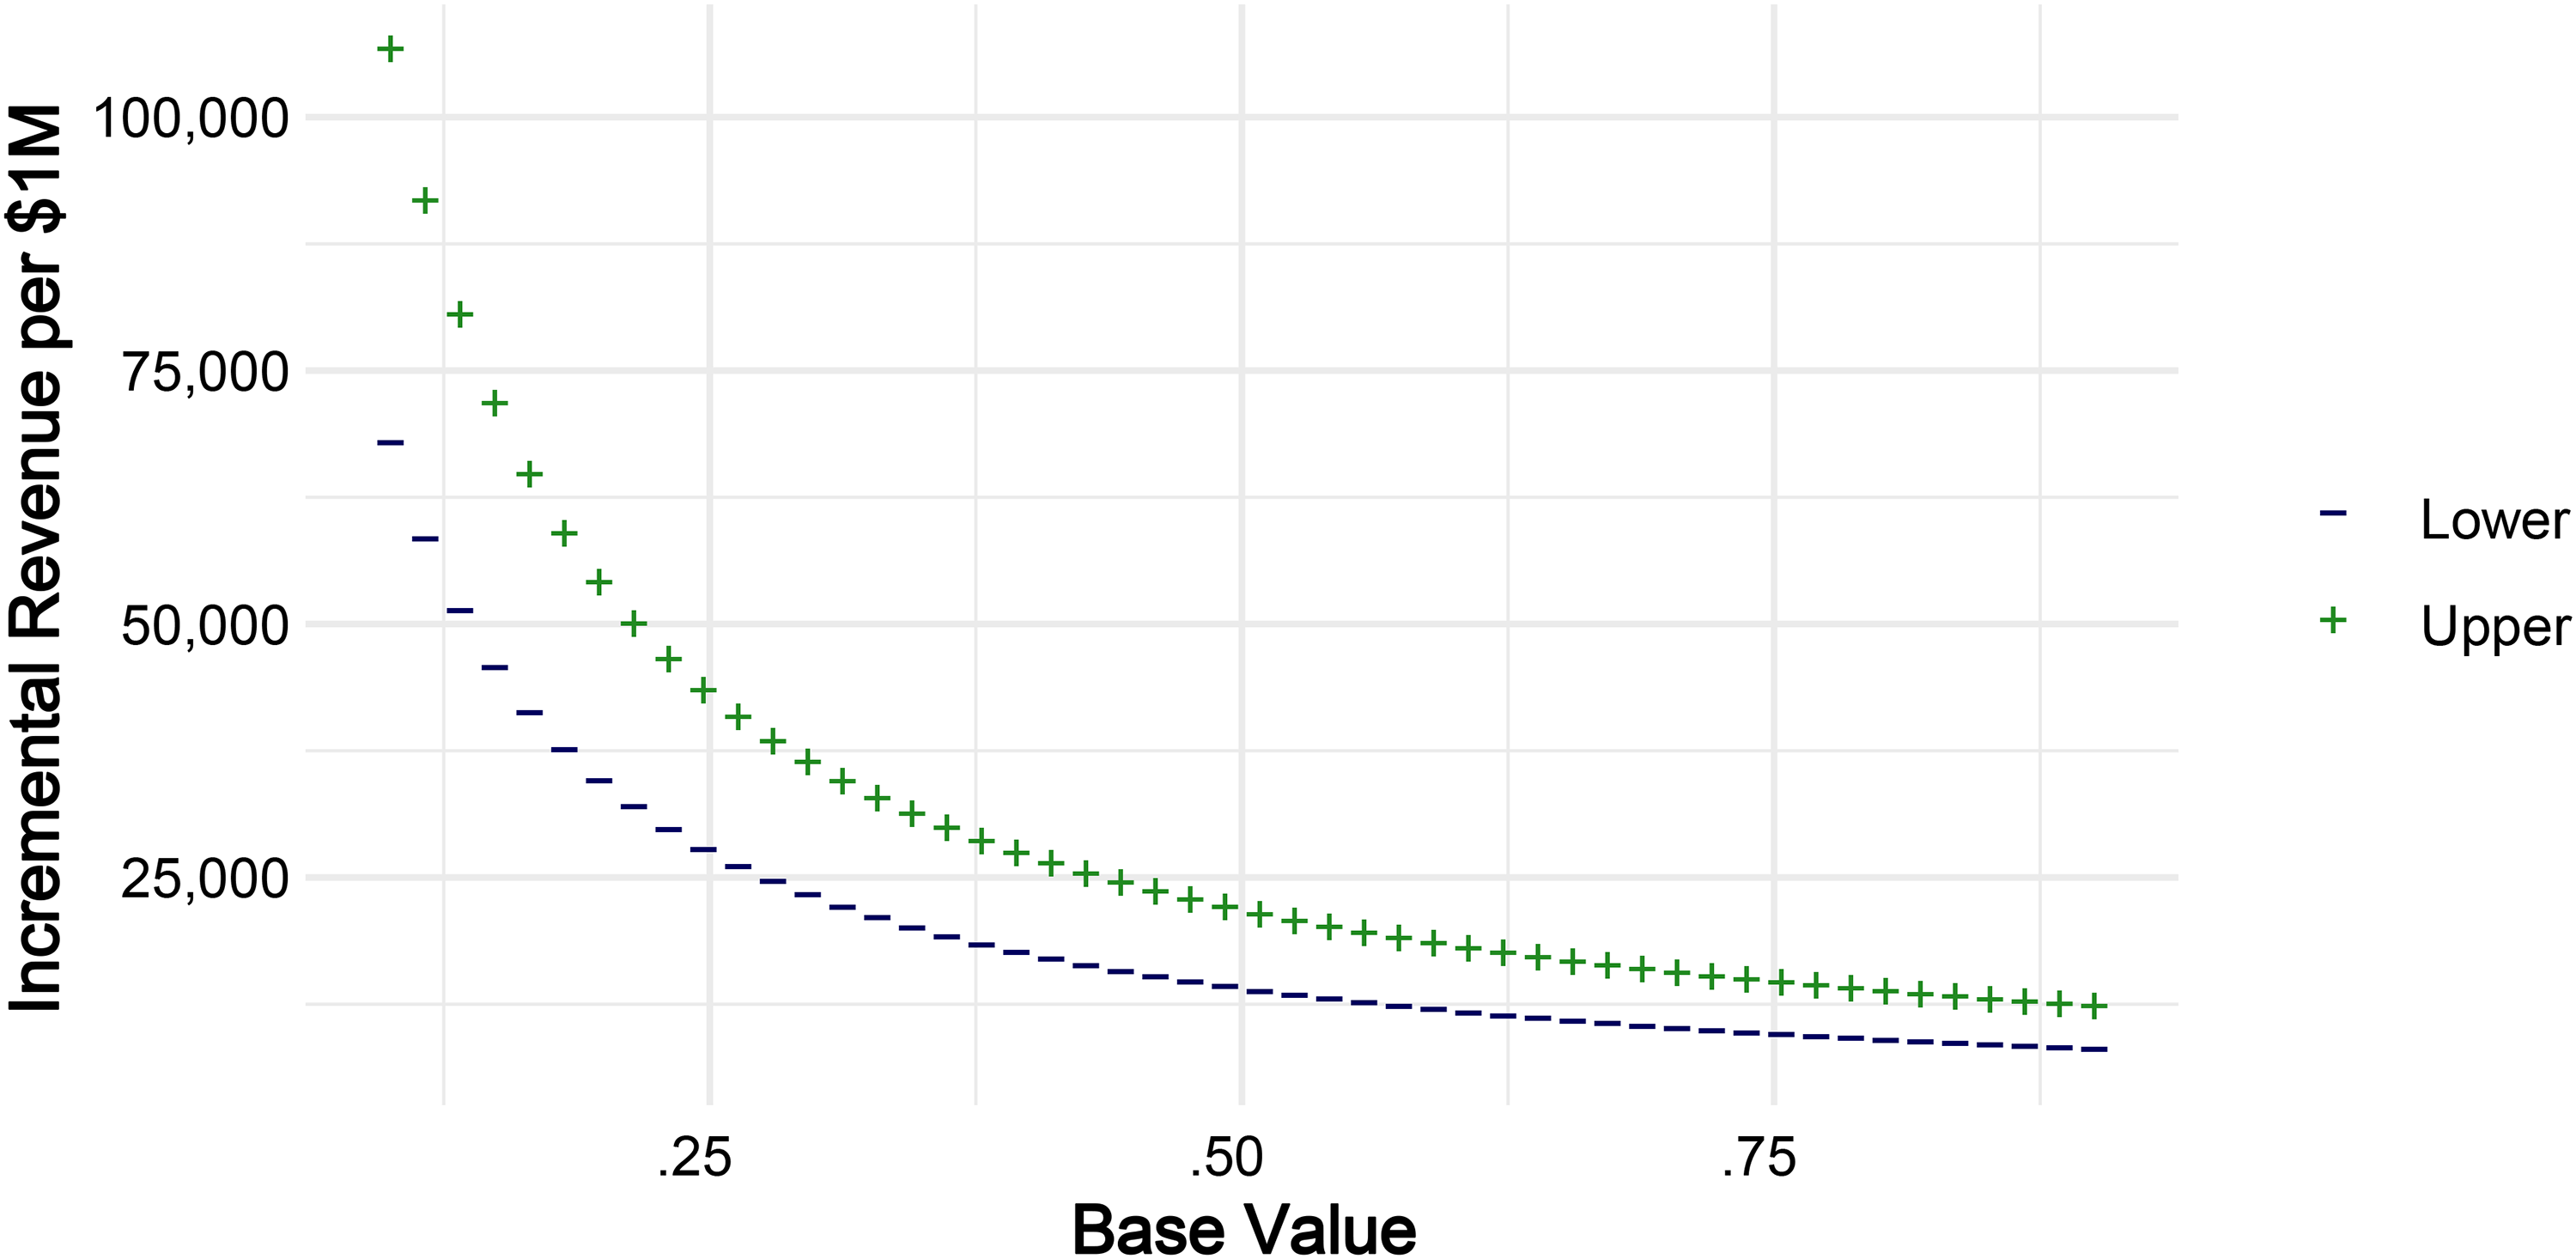
Financial Impact Through Motivation.
Pairwise Interaction Models
To help see why modeling channel complementarity is useful, as well as to understand the benefit of using latent class as a first stage, we can compare our results with the most common alternative: pairwise effects, without applying latent class first. The results for our data are shown in the Web Appendix.
Pairwise interaction models for planning ten channels show 56 rows of data, including estimates of interaction terms. However, this output has severe limitations. First, the coefficients are mostly untrustworthy due to the number of parameters relative to the number of data points. Second, there is no principled way to determine which, if any, coefficients to focus attention on for managerial insights. Third, even accepting the complications arising from this model, it still only captures pairwise interactions. Lastly, by construction, this model collapses the channel selection problem into either a narrower cross-effects individual efficiency construct, or a coarser and less informative “synergy” construct (and all channels in the “on” position), risking an analysis that optimizes to individual channel effectiveness rather than campaign-level outcome. Altogether, this comparison demonstrates why our approach is more statistically and practically tractable and valid. More significantly, the comparisons show that our approach is both uniquely able to address the conceptual question of channel selection and complementarity, while also being more insightful to managers.
Moving IMC from Concept to Theory
While we do not test a specific theory, our results are useful in the context of the original constructs within the IMC concept. Furthermore, we see our results as a motivation for a more comprehensive theory of IMC that provides testable hypotheses, predictive power, and valuable mechanic explanation for the behavior and interplay of media.
First, we were able to identify and demonstrate the existence of a significant and problematic managerial lay theory. Consistent with broad managerial guidance, we find that managers seek to optimize the reach of their campaigns—or, in other words, they seek to maximize the size and exposure of the audience (given their brand targeting parameters). Furthermore, the argument arising from this theory is that audience reach is sufficient, such that all other outcomes for the brand should naturally arise (reach efficiency leading to awareness, consideration, and ultimately purchase). To be clear, by construction, this lay theory posits that all channels are undifferentiated outside of their audience composition and ability to deliver against this audience.
However, we find the opposite outcome with respect to brand consequences. Empirically, this optimization in reach has failed to translate into optimized brand outcomes. Therefore, we can point to a two-dimensional (at minimum) heterogeneity of channels: (1) audience composition, and the channel's ability to deliver messages to this audience, and (2) a channel-specific functional advantage, effect, or impact it has on its audience that arises from the channel itself and not from creative or content choices.
Second, we find that different brand outcome goals (aided awareness, unaided awareness, association, and motivation) yield different best archetypes, or combinations of selected channels. This highlights that not only does the functional-level heterogeneity exist, but that channel function carries different relevance or value for different goals. And, as this differential combinatorial value of channels by outcome is the suggested required element of complementarity, our results are a strong indication that complementarity is an important and separate construct, which should be maintained as separate component inside of the IMC concept.
What is complementarity, and how might it arise? For exposition, let's consider a stylized construction of a single objective, such as brand salience. We can then imagine that building salience requires two subprocesses. We can leave them unnamed and assume they are latent, but maintain that they are distinct and necessary components of creating salience. In this stylized discrete world, let's assume that radio advertising acts on Subprocess 1 exclusively, while television and outdoor advertising both act on Subprocess 2 alone. If this were the case, radio and television would be complementary investments. This tiny campaign with two channels would address each subprocess of salience, and together they would perfectly make up for each other’s deficiency (no channel handles all subprocesses alone). Similarly, and alternatively, radio and outdoor would also form complementary investments, with radio handling Subprocess 1 and outdoor handling Subprocess 2. However, television and outdoor are not complementary channels with respect to salience, as each would be acting on Subprocess 2, and this campaign construction would leave Subprocess 1 devoid of activity. Complementarity deals directly with the question of which channels should be used, based on their function with respect to an objective.
What then of cross-effects? Still in our stylized world described previously, both radio + television and radio + outdoor represent complementary selections. However, we might imagine that—for whatever reason—the joint presence of television ads actually improves the effectiveness with which radio acts on Subprocess 1. Alternatively, we might imagine that the combination with outdoor actually harms the effectiveness of radio acting on its own separate subprocess. These positive or negative effectiveness gains are the channel cross-effect. They do not alter where the channel is active, but the strength with which it acts. As such, cross-effects will impact spend, inasmuch as we can reduce spend given gains in effectiveness and efficiency due to a supporting channel, or we can compensate from loss of efficiency from a negative cross-effect by pumping ever more money into a channel. However, there is no amount of investment that will cause a channel to switch functionality and create complementarity. These are likely emergent characteristics from channel design interacting with consumer utilization behaviors and patterns.
Therefore, complementarity addresses the channel selection problem, while cross-effects, on their own, provide an understanding of the effectiveness of a channel in the context of a group of channels working together. This is not to undermine the value of cross-effects within the IMC concept, but rather to flag the importance for all constructs, and the need to understand where and how they act.
Further toward our understanding of marketing integration, we identify a fascinating boundary condition in product category. As noted previously, of the three IMC constructs, one (consistency) exists at a content level, while the other two (complementarity and cross-effects) exist at the channel level. However, we were able to identify one product category (CPG) where complementarity—“a channel-level effect”—collapses and a singular combinatorial archetype becomes a dominant strategy (Archetype 6), regardless of brand advertising goal.
Critically, this points toward important and nuanced considerations when explaining the interaction of media strategies, brand contexts, and brand goals, particularly given desires to simplify the IMC concept. Whereas, given the explosion of media options and the critical dynamic multidimensionality of media value (audience, function, and interactions), we might instead benefit from an opposite move toward a homegrown IMC theory, providing a complete set and defined constructs, their compositions, relational structure, and applicable boundary conditions. Ultimately, this shift would yield us much great explanatory and predictive power for the complex media environment, as well as a course-correction and better guidance for practice.
Discussion
Our study demonstrates that there is significant value in considering the complementarity of media channels in campaigns, beyond pairwise interactions. The analysis takes some initial steps in safeguarding the necessity of complementarity inside IMC theory and literature and in answering Batra and Keller’s (2016) call for better managerial guidance on the usage and combination of media channels.
One major implication is that there is no universal silver-bullet campaign strategy. Across all campaign archetypes identified and possible outcomes, no single combination of channels offers the best possible result. We show that the concept of “best” can even differ by risk appetite, such that some might aim for highest average outcome lifts, while others might prefer a more conservative lower downside risk option. Different campaign goals and industry contexts require different media combinations.
That does not mean all channel combinations have a “best” purpose. While we find no dominant strategies, we do find dominated ones. Archetype 2 (i.e., “generic digital”) might serve as the best example. As a reminder, this archetype combines TV with online video and display, likely pointing to a common practice of replicating the TV asset on online video and banners/display. Despite being the observed format of 23% of campaigns, it essentially never offers best performance, regardless of campaign goal, outperforming only Archetype 1 for aided awareness (but losing to 3, 4 and 5).
The complementarity of channels in this study raises another important consideration. Channels do in fact have channel-specific strengths and weaknesses that are mostly invisible if we are restricted to the consideration of a singular outcome or dimension of channel performance. This means there are reasons to use (or not use) a channel beyond reach, impressions, or frequency. The coverage of a target market (audience composition) is not the only contribution of a channel. One might excel in awareness, while others drive motivation. Channels are not perfectly fungible, and mangers should consider the unique individual functionality of channels relative to other available channels, along with the potential for complementarity in the media plan. The implication is that the value of a media channel is not a function of simple supply constraints (i.e., “how many views can I buy?”), but also of the channel's positioning and differentiation (i.e., “what do I accomplish with a view?”)
We demonstrate the importance of considering higher-order (i.e., more than pairwise) relationships in media planning and in research. Archetype 6 (television + Facebook + outdoor) provides a good example, as the performance of any subcomponent dyad suffers by the removal of the third component. Despite comprising only 8% of our observed campaigns, this archetype is the closest to a silver bullet, offering the best outcomes regardless of campaign goal, provided the brand was in the CPG category. However, for all other categories, Archetype 6 was never ideal. These results highlight that the division between traditional and digital channels may be a false dichotomy. While practice and academia might usually consider these to be in opposition, or two separate but internally cohesive groups (Naik and Peters 2009), the reality appears to be more nuanced, and consideration should be given to the functional complementarity of channels regardless of their categorization. Again, the triad of TV, Facebook, and outdoor as a high-performance strategy necessitates the use of billboards; hardly fitting with the narrative that advertising might be strictly a digital focus in the future.
Table 8 highlights goal-specific characteristics. Across awareness (aided or unaided), association, and motivation, there are a variety of archetypes to follow, channels to invest in, and a range of resulting improvements. This indicates that there are natural differences in our ability to influence different aspects of the brand, or to comparatively call the customer to action successfully, which further reinforces the need to respect channel heterogeneity.
Implications for Practice
The present study provides new insights for practitioners who are concerned with multimedia campaign construction, demonstrable advertising effectiveness, and the balance between brand building versus consumer activation (Binet and Field 2013). We begin by showing common patterns in campaign structures via the latent class approach, as shown in Table 4. Current industry discussion on media selection centers on the immediate and growing investment in digital channels, which carries the risk of inflating expectations of digital channel performance and applicability. This increases the risk of overindexing on these channels, as Adidas claims to have done in late 2019 (Vizzard 2019). We then provide a view on how some of the largest global brands have executed their campaigns, providing a counterweight to that discussion and a reference based in recent historical evidence where traditional channels are still very much an important feature of integrated campaign design.
We show that the GRP-only paradigm of media selection and purchase is problematic in that it reduces media plan construction down to a too-simple market coverage problem. If the GRP-only hypothesis were true, we would be able to identify one single campaign structure to dominate all others (i.e., the combination of channels providing the single largest possible market coverage). This practice is unfortunately an increasingly dominant unspoken strategy for media planners and reinforced by the pricing structure of channels, as they are presented on the basis of GRPs, impressions, or opportunities to view, depending on the context. This is a supply dominant logic for platforms and channels that ignores the needs and motivations of brand owners. One might ask, for example, why buy into cinema advertising when I can have more impressions on Facebook? The answer is: Because they are functionally different, and a cinema exposure will elicit a different response when compared with a Facebook exposure. The reality of the dominance of reach-buying is clear from Table 2, as is the extent of potential for improvement on lifts.
The ease of falling into this framing of advertising is fairly straightforward to show if we consider the discussion around the health of channels. For example, in popular and industry press, Facebook has historically been evaluated primarily by the number of users and their demographics. As another example, the U.S. bill to ban TikTok elicited an immediate advertiser discussion on diversifying media portfolios in order to reach heavy TikTok users (Barnett 2024). In these and most other instances, the question of media allocation is reduced to audience construction and efficiency of reach, but the functional benefit of a channel-specific exposure is never addressed. As we have shown, there is a significant amount of additional advertising power available to brands if they consider channel function as well as audience.
Furthermore, we provide specific guidance on channel performance and channel complementarity for four possible brand campaign goals: unaided awareness, aided awareness, brand association, and motivation. This is particularly important, as our data shows that even among the largest firms and brands in our dataset, several campaigns are deploying strictly worse-performing combinations of channels. Instead, by following the goal-specific structures shown in our study, brands should be able to realize both greater and more consistent campaign lifts across the whole range of the purchasing funnel.
Implications for Research
This work provides a number of contributions to the literature on advertising and integrated marketing communications. First, by leveraging the largest and broadest view to date on campaign effectiveness, we produce evidence of channel-specific, as well as structure- and goal-dependent, campaign effectiveness. We provide an initial empirical response to Batra and Keller (2016), based on the meta-analytic view of over 1,000 campaign lift studies.
Our approach can also serve as a foundation for researchers to operationalize high-level constructs in IMC. Simultaneously, via better measurement and utilization of all high-level IMC constructs, we were able to generate predictions on advertising campaign construction and outcomes. However, this opportunity opens a set of valid questions around the nature of channel complementarity itself, designed-for versus emergent characteristics, dynamic as well as competitive contexts, and beyond. There is a need to connect micro (consumer level, processing) effects to macro (channel and firm level, econometric) effects (Batra and Keller 2016). As such, this study might be an impetus and the first step in transitioning IMC from a concept toward a formalized and structured theory, which would enable an increasingly cogent set of future analyses on the nature of media evolution and utilization, including cross-country variation and deeper competitive analysis.
Our results point to functional heterogeneity in channels, beyond audience composition and size. Not only does this bring to question the strict digital versus traditional media split we’ve already discussed, but it also highlights a significant risk by researchers assuming that all channels within a single domain are equivalent. For example, collapsing a variety of channels into a collective “social media” label should be done cautiously, as it would imply that Facebook, X, Instagram, Snapchat, TikTok, and so on are functionally equivalent. In broadest terms, our results suggest that assumption is wrong.
Relatedly, by showing that media channels are indeed functionally heterogeneous, immediate questions arise regarding the identification of divergent functions, as well as the causes for these differences. And while we cannot exhaustively provide channel functionality categorization here, we do propose that these differences should arise from an interplay of channel design (e.g., feed construction, velocity of content delivery, aspect ratio) and user behavior (e.g., navigation, rationale for use, usage occasion). Future research should be able to address precise channel function attribution, sharpening advice to advertisers as well as channel owners.
Lastly, we shed light on the underresearched area of brand building (unaided awareness, aided awareness, brand association, and motivation). While the call for sales as a critical outcome variable (Sethuraman, Tellis, and Briesch 2011) has been thoroughly accepted (see the Web Appendix for sales-focused studies), the exclusive dedication to sales leaves a significant gap in understanding brand building. This work helps fill this gap and supports the view that campaign effectiveness is best served by considering brand metrics in addition to sales.
Note that while our analysis covers many channels, it is not exhaustive. Due to lack of data, we are missing search advertising and some new and popular additions (e.g., TikTok). Thus, caution is warranted when it comes to making precise recommendations suggested from this study. Instead, we focus on the larger, more general findings, such as the fact that no single plan is best for all outcomes and contexts. These insights will almost certainly remain relevant with the addition of more channels, since the answers will grow more complex, not simpler. Furthermore, businesses can likely improve ROI at a broader level by examining their historical media-mix data and moving toward archetypes that are better for their contexts and goals.
Supplemental Material
sj-pdf-1-jmx-10.1177_00222429241302808 - Supplemental material for Beyond the Pair: Media Archetypes and Complex Channel Synergies in Advertising
Supplemental material, sj-pdf-1-jmx-10.1177_00222429241302808 for Beyond the Pair: Media Archetypes and Complex Channel Synergies in Advertising by J. Jason Bell, Felipe Thomaz and Andrew T. Stephen in Journal of Marketing
Footnotes
Coeditor
Shrihari Sridhar
Associate Editor
Koen Pauwels
Declaration of Conflicting Interests
The authors declared no potential conflicts of interest with respect to the research, authorship, and/or publication of this article.
Funding
The authors received no financial support for the research, authorship, and/or publication of this article.
Notes
References
Supplementary Material
Please find the following supplemental material available below.
For Open Access articles published under a Creative Commons License, all supplemental material carries the same license as the article it is associated with.
For non-Open Access articles published, all supplemental material carries a non-exclusive license, and permission requests for re-use of supplemental material or any part of supplemental material shall be sent directly to the copyright owner as specified in the copyright notice associated with the article.