
Abstract
This article assesses the extent to which consumers from the opposite poles of the socioeconomic distribution weigh three critical food attributes (healthiness, fillingness, and taste), how they perceive the associations among them, and how differences in weights and associations influence food preferences. The results of a series of eight preregistered studies in a highly unequal environment (Rio de Janeiro, Brazil) show that low- (vs. high-) socioeconomic-status consumers are more likely to (a) choose unhealthy items even when supply-side factors (e.g., affordability and accessibility) are controlled by design, (b) trade healthiness for fillingness (but not taste), and (c) display stronger negative associations between the attributes (“healthy = less filling” and “healthy = less tasty”). These findings highlight the importance of a deeper understanding of the psychological differences in food preferences and perceptions and the use of such insights to design interventions aimed at mitigating nutritional inequality. In line with this rationale, the final set of studies shows that, albeit not a trivial task, it is possible to increase healthy food choices among disadvantaged consumers by enhancing the perceived fillingness of the healthy options available. Managerial and policy implications are discussed.
In general, low-socioeconomic-status (SES) consumers display unhealthier food habits 1 than their high-SES peers (Appelhans et al. 2012; Pechey et al. 2013). Part of the reason for this discrepancy is that healthier foods are, on average, more expensive (Drewnowski 2010) and not as readily available to low-SES consumers as they are to high-SES consumers (Larson, Story, and Nelson 2009). No wonder policy makers often try to mitigate the presence of food deserts by enacting laws to increase the availability and affordability of healthy foods and beverages in low-income neighborhoods (e.g., U.S. Department of Agriculture 2016; for more, see Block and Subramanian [2015]).
Although the impact of price and availability is undeniable, it is reasonable to speculate that SES also shapes consumers’ food preferences and perceptions. In the same way low- and high-SES consumers vary in their taste for music (Snibbe and Markus 2005; Van Eijck 2001), arts (Dimaggio and Useem 1978), products (Stephens, Markus, and Townsend 2007; Yan, Keh, and Chen 2021), and social causes (Vieites, Goldszmidt, and Andrade 2022), they may have also developed distinct dietary inclinations over the life course. Indeed, experimental evidence shows that SES discrepancies in food choices take place even in contrived settings, where supply-side barriers are controlled by design (Best and Papies 2019; Bratanova et al. 2016; Cardel et al. 2016; Cheon and Hong 2017; Laran and Salerno 2013; Thomas 2022; Van Rongen et al. 2022). Further, a recent investigation based on large secondary datasets finds that while 10% of the SES-based discrepancy in healthy eating in the United States can be attributed to differences in supply characteristics such as price and availability, the remaining 90% likely reflects differences in individual preferences (Allcott et al. 2019).
Research, however, has yet to systematically assess how exactly SES influences food preferences and perceptions. For instance, because high-calorie foods are not only unhealthier but also seen as more filling (Suher, Raghunathan, and Hoyer 2016) and tastier (Raghunathan, Naylor, and Hoyer 2006), the observed higher preference for energy-dense, nutrient-poor foods among lower- (vs. higher-) income consumers may result from weaker considerations about the nutritional value of the food, higher concern for its satiety, or greater sensitivity to its palatability. Further, SES may influence not only the relative weight given to such attributes but also the strength of the perceived associations among them (e.g., “healthier = less filling”). Both attribute weights (also referred to as attribute importance) and attribute associations (also referred to as heuristics) can, in turn, impact decisions.
In a series of eight preregistered studies, we investigate the extent to which low- and high-SES consumers vary on (1) their preference for healthier items over and above supply-side considerations, (2) the relative weight they give to three critical food attributes: healthiness, fillingness, and taste (Briers et al. 2020; Finkelstein and Fishbach 2010; Raghunathan, Naylor, and Hoyer 2006; Suher, Raghunathan, and Hoyer 2016), (3) the strength of the associations involving these attributes, and, finally, (4) how the lessons from these findings may help promote healthier food choices among low-SES consumers.
Our research offers critical contributions to the literature. Previous studies have shown that inducing subjective perceptions of scarcity (Laran and Salerno 2013), poverty (Bratanova et al. 2016), or lower SES (Cheon and Hong 2017) sways food preferences, such that those led to “feel poorer” (vs. wealthier) choose unhealthier foods. Yet, it is unclear whether this phenomenon results from a reduced weight of the healthiness dimension among those induced to “feel poorer” or from stronger importance given to fillingness and/or taste. We advance this research stream by documenting how the relative importance of healthiness, taste, and fillingness varies across the SES spectrum, investigating the phenomenon in a sample of impoverished and wealthy consumers.
Further, we extend the findings from the literature on heuristics in food consumption (Haws, Reczek, and Sample 2017; Raghunathan, Naylor, and Hoyer 2006; Suher, Raghunathan, and Hoyer 2016) by showing how SES differences influence the strength of the perceived association between food attributes. While heuristics involving healthy and unhealthy foods (“healthy = not tasty” and “healthy = not filling”) have proved to be widely used by consumers (Raghunathan, Naylor, and Hoyer 2006; Suher, Raghunathan, and Hoyer 2016; Turnwald et al. 2019; Turnwald and Crum 2019), the role of SES in shaping the strength of these associations deserves scrutiny.
Across studies, we also rely on lab-in-the-field investigations, often with consequential decisions (Studies 1 and 6), that help increase the external validity of our findings (Morales, Amir, and Lee 2017). This is particularly important in the domain of food consumption, as many results from laboratory investigations fail to replicate in the field (Haws et al. 2022). Relatedly, contrary to previous research (Darmon and Drewnowski 2015; Giskes et al. 2010), we examine a sample in which low-SES consumers experience significant levels of food insecurity, a reality shared by more than 25% of the world’s population (Food and Agriculture Organization of the United Nations et al. 2020) but relatively underappreciated in the literature. In doing so, we respond to recent appeals to broaden the unit of analysis within the discipline from the individual to larger groups (MacInnis et al. 2019) and more deeply investigate the psychology of low-SES consumers (Carey and Markus 2016; Pham 2016; Shavitt, Jiang, and Cho 2016).
Finally, our findings have important practical implications. This work adds to the growing area of research at the intersection of marketing and health policy (Dhar and Baylis 2011; Lim et al. 2020; Seiler, Tuchman, and Yao 2021; Tangari et al. 2019). Recent evidence shows that policy interventions that seek to improve the availability, accessibility, and convenience of healthy foods at the neighborhood level often have no meaningful impact on diet quality or diet-related outcomes (Bueno 2024; Elbel et al. 2015; Freedman et al. 2021; Ghosh-Dastidar et al. 2017; Ortega et al. 2016; Singleton et al. 2019; Sturm and Hattori 2015). Our results suggest that part of the explanation for the lack of success of such policies may lie in the lower-SES consumers’ unique attribute weights and associations, which create significant barriers to healthier food habits. Specifically, we shed light on the critical role of fillingness—an overlooked factor in governmental strategies that attempt to promote healthy diets—and provide insights on how regulators can incorporate this element into their guidelines. From a managerial perspective, we highlight how our findings can inform marketers by testing different interventions that aim to encourage healthy eating by increasing the perceived fillingness of healthy options, which is a practice often used to promote unhealthy foods but rarely employed to advertise healthy items. In doing so, we join an incipient body of work investigating the barriers and promising avenues in the design of food-related interventions (Bueno 2024; Cadario and Chandon 2020).
How SES Shapes Food Preferences and Perceptions
Nutritional inequality is a growing source of concern worldwide (Development Initiatives 2020; Food and Agriculture Organization of the United Nations et al. 2023; Nisbett et al. 2022). Given the multidisciplinary nature of the field, we conducted a systematic literature review to assess the mechanisms used to explain the widespread SES-based differences in consumers’ food preferences and perceptions.
Our original search covered 931 articles, with 70 meeting all inclusion criteria (for details about the search protocol and inclusion criteria, see Web Appendix A). Table W1 provides detailed information on all selected articles. Among the studies testing nutritional inequalities across the socioeconomic spectrum, the overwhelming majority (87%) find a positive association between SES and healthy diets, with only 13% finding either a null or the opposite pattern. Less than half (47%) of the studies control for supply-side barriers (e.g., price and convenience) in their design. Psychological explanations for the phenomenon are varied, but systematic empirical testing of the underlying mechanisms is relatively infrequent (24%). Critically, none of the studies systematically assess the differences in (1) the weight individuals from the opposite poles of the socioeconomic spectrum give to healthiness, fillingness, and taste and (2) the strength of the perceived associations among these attributes.
Some of the articles focus on the role of stress and impulsivity. They show that stress produces physiological and psychological responses that compromise people's abilities to resist temptation and increase the drive for hyperpalatable foods (Yau and Potenza 2013). Along these lines, increased stress (Langer et al. 2018; Swaffield and Guo 2022; Thomas 2022), anxiety (Bratanova et al. 2016), and impulsivity (Best and Papies 2019) have proved to be associated with unhealthier food preferences among low- (vs. high-) SES individuals.
A second set of related articles focuses on hedonism. This explanation is centered around the idea of pleasure-seeking or hedonic hunger (Lowe and Butryn 2007). Similar concepts—such as the perceived hedonic value of foods (Godsell et al. 2019), food craving (Thomas, Ma, and Gauri 2024), the desire to consume foods (Sim et al. 2018), and trait appetite (Swaffield and Guo 2022)—fall within the hedonism umbrella and have helped explain the effect of SES on food preferences. According to this account, because low-SES consumers have fewer available resources (Banerjee and Duflo 2007) and experience reduced enjoyment in consumption activities (Schofield and Venkataramani 2021), they actively seek to indulge when deciding what to eat. Broadly speaking, this body of knowledge implies that the weight given to taste is the dominant differentiator across the SES spectrum, with low-SES individuals giving priority to taste when compared to their high-SES peers.
Another stream focuses on value consciousness. With limited disposable income and the need to ensure access to their basic needs, low-SES consumers prioritize affordability in many of their purchase decisions. Because unhealthy foods are on average cheaper (Drewnowski 2010), low-SES consumers may choose unhealthier foods simply because they provide more calories per monetary unit (Drewnowski and Specter 2004). While plausible, empirical evidence for this account is limited, with a recent study finding that value for price does not mediate the relationship between SES and food consumption (Thomas, Ma, and Gauri 2024). Further, as one of our studies directly assesses, the stronger preference for fillingness among low-SES goes beyond deliberate price-per-unit considerations.
Finally, several studies show that prompting contexts of food insecurity and environmental harshness induce unhealthier eating patterns (Bratanova et al. 2016; Cheon and Hong 2017; Laran and Salerno 2013). Insecurities in these cases can be understood as a general antecedent, often being used to motivate other psychological mechanisms (Anselme and Güntürkün 2019; Laraia et al. 2017; Nettle, Andrews, and Bateson 2017). For example, harsh and unpredictable environments are associated with increased levels of stress (Haushofer and Fehr 2014), which limits one's ability to inhibit impulse (Mani et al. 2013; Shah, Mullainathan, and Shafir 2012) and induce pleasure-seeking tendencies such as eating energy-dense hyperpalatable foods (Carvalho, Meier, and Wang 2016; Watts, Duncan, and Quan 2018). In this research, we follow the same logic and propose that insecurities guide food perceptions and preferences but do so in two main ways that have not been systematically examined in the literature: by varying (1) the attribute importance of three critical food attributes and (2) the perceived associations among them.
SES and Attribute Importance
Healthiness, fillingness, and taste reflect core intrinsic food attributes (Enneking, Neumann, and Henneberg 2007; Rusmevichientong, Jaynes, and Kazemi 2020; Yamim, Mai, and Werle 2020). Thus, understanding how SES shapes food preferences requires a systematic empirical investigation of how poverty and wealth influence the relative weights consumers assign to these critical food attributes.
Humans and other animal species tend to increase energy intake above their level of energy expenditure in the presence of environmental cues that imply that access to food is insecure and reduce their energy intake when they receive cues that access to food is secure (Nettle, Andrews, and Bateson 2017). Given that low-SES consumers are more likely to suffer from food insecurity and malnutrition (Fitchen 1987; Gundersen, Kreider, and Pepper 2011) and high-SES consumers live in a world of food safety and abundance, it is reasonable to expect that low-SES consumers will give more weight to fillingness when choosing from different food options. Further, as several prominent decision-making models reveal (Bettman, Luce, and Payne 1998; Payne, Bettman, and Johnson 1993; Simonson 1989; Simonson and Tversky 1992; Tversky, Sattath, and Slovic 1988), determining attribute weights entails trade-offs. Giving more importance to one attribute usually means giving a lower weight to another. If low-SES consumers are expected to be particularly sensitive to fillingness, it will likely make them less sensitive to other key relevant food attributes (e.g., healthiness and taste).
Previous research suggests that taste is a central attribute in food decision-making (Furst et al. 1996; Glanz et al. 1998; Kourouniotis et al. 2016). People display a generalized tendency to favor taste over other food attributes, and this tendency seems rather persistent across the SES continuum (Aggarwal et al. 2016; Glanz et al. 1998). Along the same lines, studies directly comparing the importance of taste and healthiness in food choices suggest that consumers might be particularly attached to taste (Verbeke 2006). Research has also shown that labels emphasizing taste are more effective in increasing the choice of healthy foods than labels focused on nutritional benefits (Turnwald and Crum 2019).
Thus, two general inferences can be drawn. First, given that poverty (wealth) is associated with food insecurity (safety), one can expect low-SES consumers to put more weight on fillingness than high-SES consumers. Second, assuming that taste is an attribute few are willing to give up on, the increased importance given to fillingness among low-SES consumers should come at the expense of healthiness rather than taste. Formally:
Incipient work has hinted at the idea that food priorities differ across the SES spectrum (Bratanova et al. 2016; Hwang and Choe 2016; Kershaw et al. 2019). Evidence suggests that fillingness bears particular importance among low-SES consumers who choose foods by their perceived filling capacity (Laran and Salerno 2013), display an increased ability to discriminate foods based on their energy density (Cheon et al. 2018; Sim et al. 2018), and believe that larger portions are more appropriate (Best and Papies 2019). However, no research has explicitly and systematically examined how fillingness interacts with other relevant food attributes such as taste and healthiness. Further, the literature often implies or explicitly suggests a trade-off between healthiness and taste but not fillingness (Kershaw et al. 2019; Thomas, Ma, and Gauri 2024). In this research, we fill this gap. It is important to note that while taste and fillingness tend to be positively correlated, examples of unhealthy products that are arguably perceived as tasty but not filling abound (e.g., M&M’s, popcorn, and candy in general), allowing for an analysis of the trade-offs among these attributes. Finally, research is typically limited in terms of the types of foods and the attribute elicitation methods used. In this research, we offer evidence for the primacy of fillingness in low-SES consumers’ minds across qualitative and quantitative studies and directly examine attribute trade-offs via explicit rankings and inferences drawn from conjoint experiments.
SES and Attribute Associations
High- and low-SES consumers may differ not only in the importance they give to intrinsic food attributes but also in the perceived strength of the associations between attributes. Whereas heuristics linking different food attributes (e.g., “healthier = less tasty” and “healthier = less filling”) have proved to be widely used by consumers (Raghunathan, Naylor, and Hoyer 2006; Suher, Raghunathan, and Hoyer 2016) and consequential to food choices (Briers et al. 2020; Paakki et al. 2022; Turnwald and Crum 2019; Turnwald et al. 2019), the role of SES in shaping the strength of these associations has not yet been systematically investigated. However, it is plausible to expect that these widely held beliefs may be particularly strong among low-SES consumers and possibly in ways that hinder healthier eating.
Due to limited resources, low-SES consumers are less likely to experiment with cooking or try new food types (Beagan, Power, and Chapman 2015), and they tend to value more familiarity than their high-SES peers when making food decisions (Baumann, Szabo, and Johnston 2019; Daniel 2016; Steptoe, Pollard, and Wardle 1995). Further, they are, in general, exposed to a narrower range of food options than their high-SES counterparts (Bardin, Washburn, and Gearan 2020; Story et al. 2008). This discrepancy in food knowledge, exposure, and inclination to try new possibilities can have important consequences for the associations made by low- and high-SES individuals. Research has shown that a weaker propensity to experience new aspects of life (including new food items) can exacerbate prior heuristics (Haws, Reczek, and Sample 2017; Jung and Kellaris 2004). The less one learns from new experiences, whether for lack of motivation or opportunity, the less likely they are to challenge preconceived associations (Caputo 2014; Flynn 2005). Thus, many well-established beliefs and generalizations with respect to the correlation between food attributes are plausibly stronger and/or more widely accepted among low- versus high-SES consumers. Based on these arguments, we hypothesize that:
One may wonder why we predict no SES differences in the importance of taste in H1b but a stronger reliance of low-SES consumers on the “healthy = not tasty” intuition in H2. It is worth clarifying that while H1 focuses on attribute weights, H2 deals with attribute associations. This is a critical distinction because two groups can attribute similar importance to taste (i.e., via weights [H1b]) and still differ in their perception of how tasty healthy and unhealthy foods are (i.e., via associations or heuristics [H2]), which help explain disparities in choice among members of these groups.
Consistent with our prediction, Pivecka, Kunz, and Florack (2023) find that low- (vs. high-) SES consumers display a stronger “healthy = less tasty” association. Further, Thomas, Ma, and Gauri (2024) show that stronger food cravings reduce the unhealthiness perceptions of hedonic foods. We contribute to this incipient body of work on two fronts. First, we offer a methodological contribution by testing the robustness of the phenomenon with other stimuli, using samples of deprived and affluent residents of a developing country. Second, and most critically, we extend these results by generalizing heuristics to another critical food association (i.e., “healthier = less filling”).
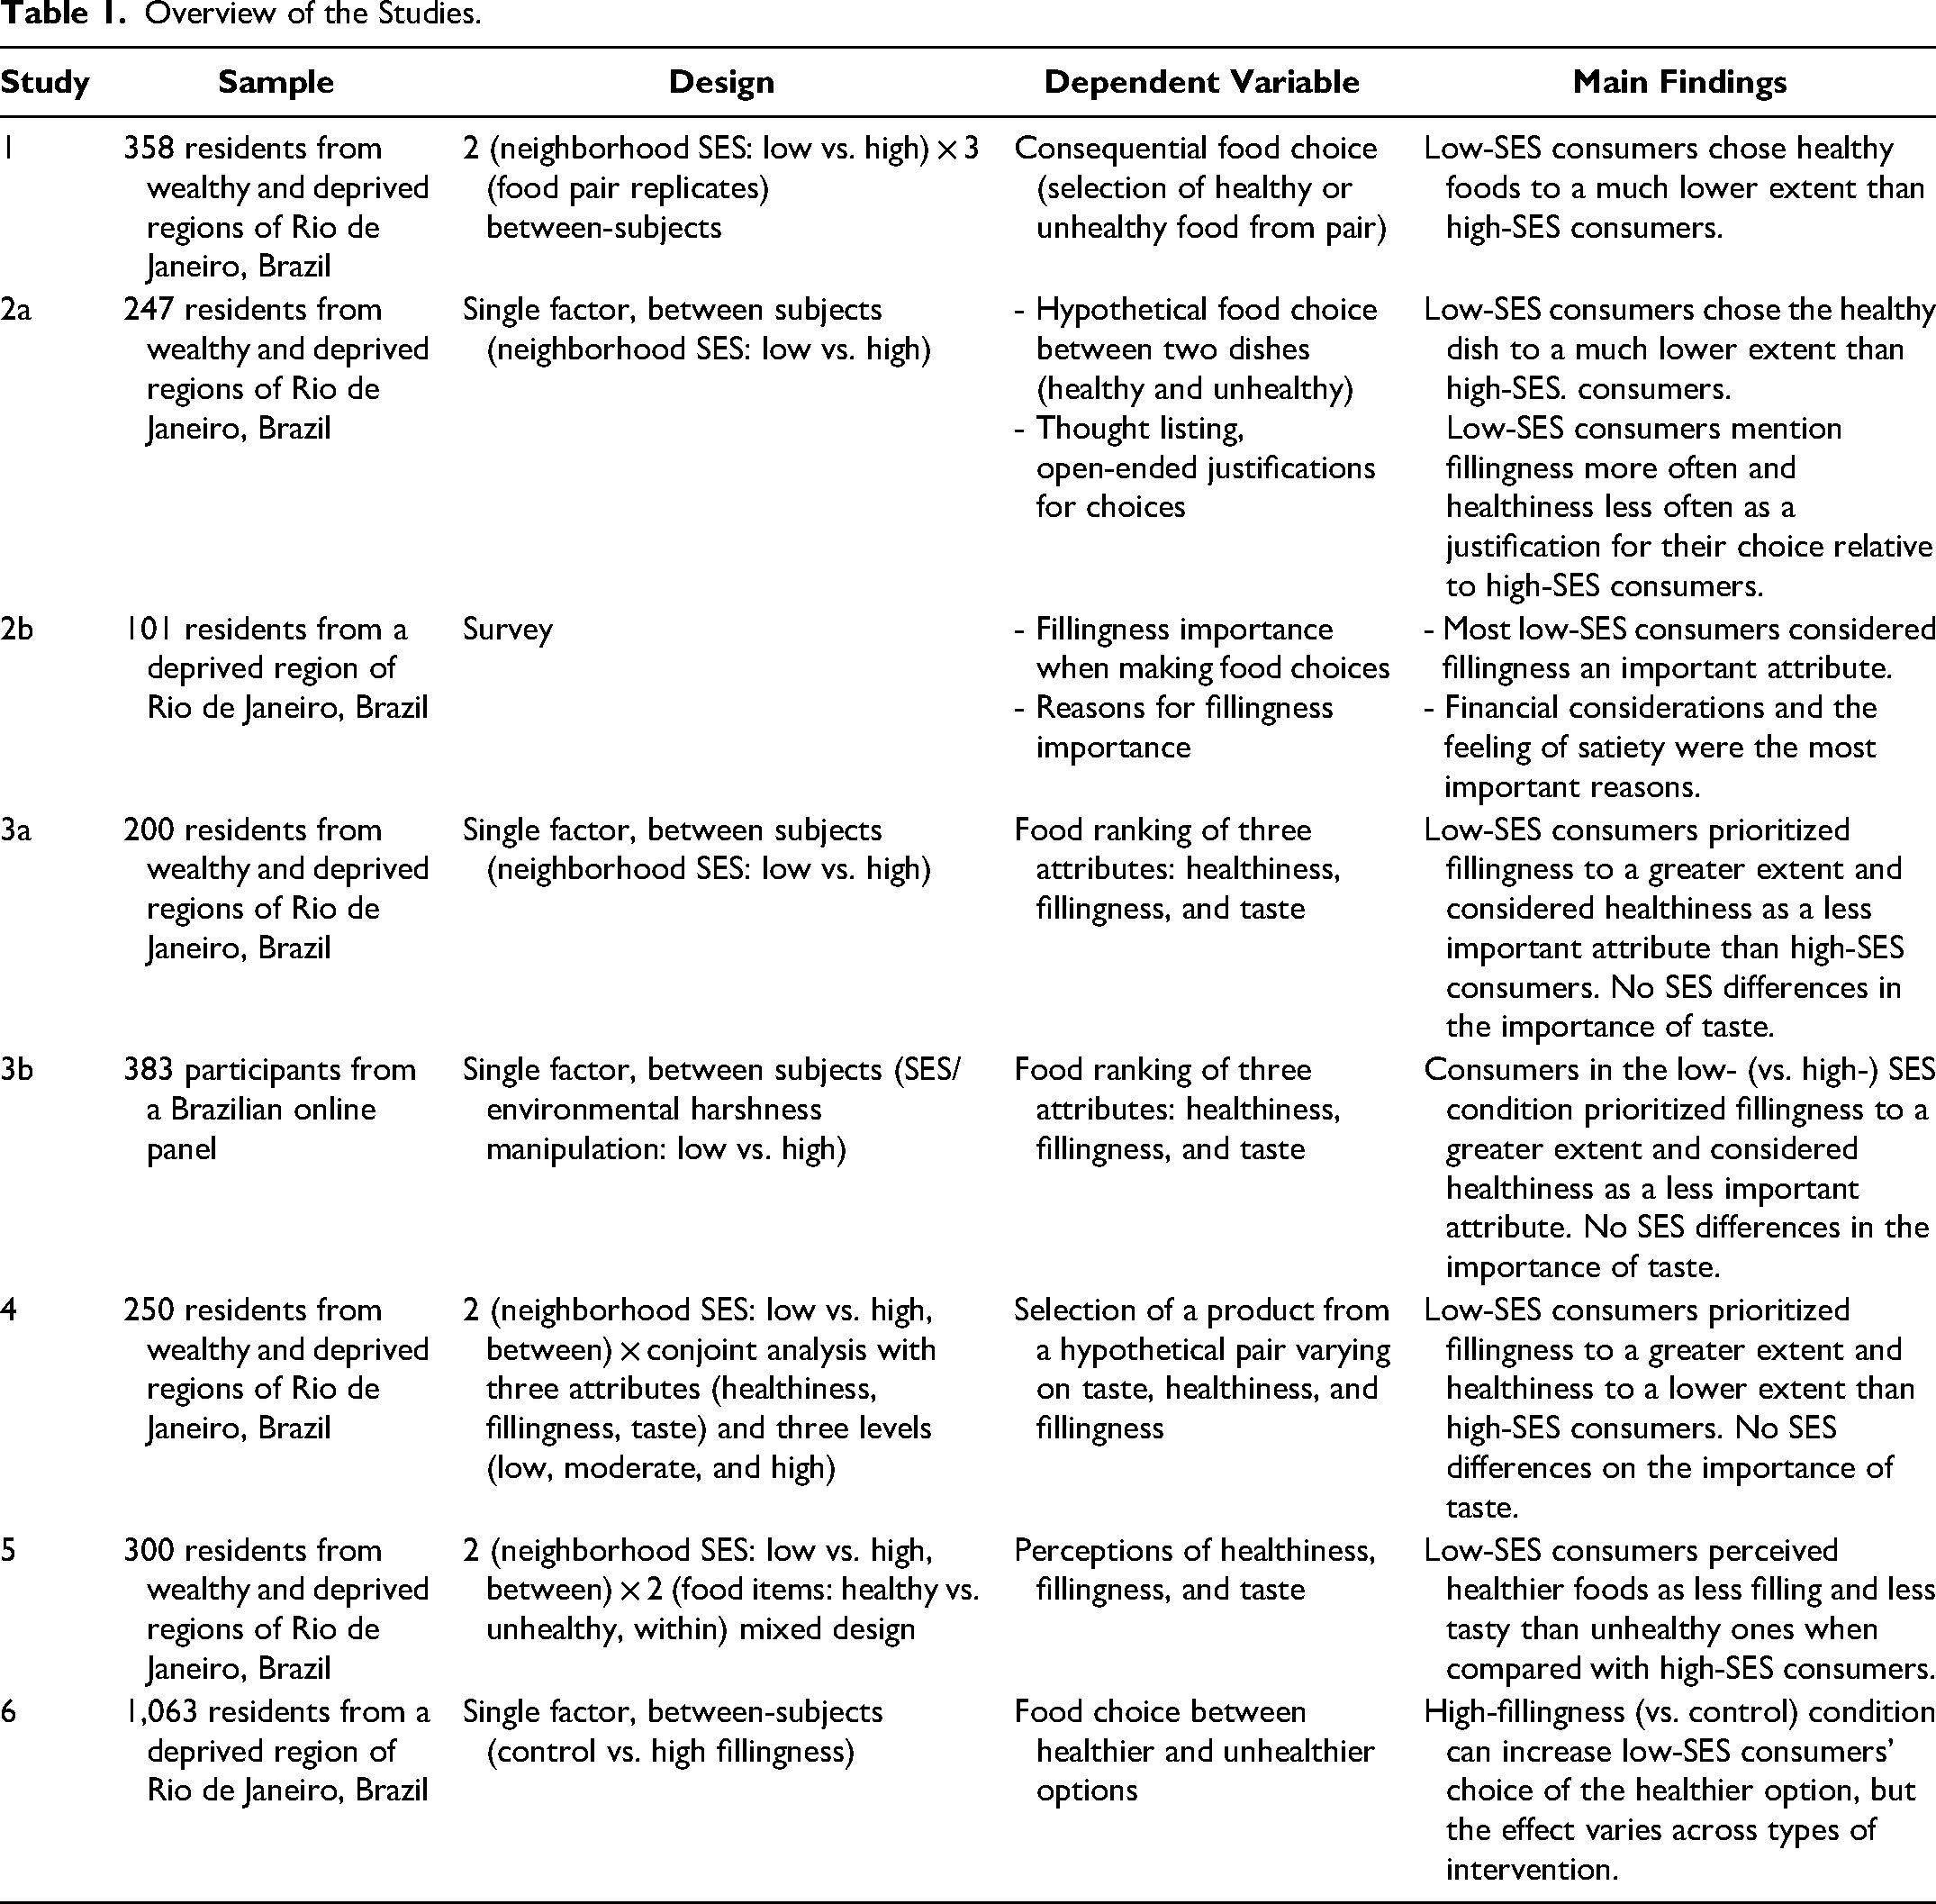
We preregistered all studies. The preregistration protocol, data, code, and materials are available on OSF (https://osf.io/8st4u/). Table 1 displays an overview of the studies.
Overview of the Studies.
Study 1
While the bulk of studies found that high-SES consumers display healthier diets than their low-SES peers, our systematic literature review reveals that most studies were conducted in Western, educated, industrialized, rich, and democratic (WEIRD) countries (59.5%), and within these regions, most investigations did not contrast populations marked by poverty and wealth (93.3%). Methodological limitations such as the absence of cross-category comparisons across healthy and unhealthy items (82.4%), the exclusive reliance on self-reported decisions (75.7%), and the presence of supply-side explanations (55.4%) also prevailed (see Table W2 in Web Appendix A). Study 1 attempts to conceptually replicate the presence of nutritional inequality with a sample marked by extreme SES inequality, using a consequential food choice measure and relying on a context where key supply-side considerations (price, availability, and product awareness) are controlled by design.
Method
Participants
Three hundred fifty-eight participants took part in this study (Mage = 37.76 years, SD = 14.65; 53% female, 47% male). Half of them were residents of a wealthy region of Rio de Janeiro (i.e., South Zone), and the other half lived in a deprived area of town (i.e., Favela da Maré). Whereas the South Zone of Rio de Janeiro features the city's most famous landscapes with affluent beach neighborhoods (e.g., Leblon, Copacabana), Favela da Maré is composed of a set of 16 slums (for a similar sampling strategy, see Jacob et al. [2022] and Vieites, Goldszmidt, and Andrade [2022]). Table W3 in Web Appendix B summarizes the socioeconomic disparities across samples from these two areas, as revealed by objective and subjective SES indices and food insecurity scores.
Procedure
In-group research assistants unaware of the study’s hypothesis approached passersby on the streets of wealthy and deprived neighborhoods of Rio de Janeiro and asked whether they were willing to participate in a short survey. Research assistants presented those who agreed to participate with a pair of food items and offered the chance to choose one of the two products as a token of appreciation for their participation. Although research assistants completed the study using tablets, participants received a sheet displaying an image and descriptive tag for each food item. For the sake of generalizability, we used three food pairs across participants. Each pair consisted of a healthy and an unhealthy food option: (1) unbranded cereal bar versus unbranded potato chips, (2) unbranded sour starch biscuits versus unbranded sandwich cookies, or (3) branded sour starch biscuits versus branded crunchy puff snack (Web Appendix C). A pretest confirmed that the healthy options were perceived as healthier than the unhealthy options and that both products were equally known to high- and low-SES consumers (for a summary of the pretest results, details about the data, and procedure, see Web Appendix C). Unbeknownst to participants, their choice served as our main dependent variable. Upon making their decision, they received the selected item and proceeded to a brief study. In this partly unrelated survey, they filled out a sociodemographic questionnaire, completed a food insecurity measure, and were thanked and dismissed.
Sociodemographic, food insecurity, and dietary information
Participants indicated their age, gender, race, marital status, monthly household income (1 = “less than R$500,” 18 = “more than R$60,000,” and “don’t know”), number of dependents in the household, education (1 = “no formal education,” and 11 = “graduate degree”), and subjective SES rank in terms of relative income (1 = “well below average,” and 5 = “well above average”). Food insecurity was assessed using a four-item measure (Vieites, Goldszmidt, and Andrade 2022). Participants also informed their height and weight (used to compute body mass index [BMI]) and level of hunger at the time of data collection (1 = “not hungry at all,” and 5 = “very hungry”).
Across all studies, we control for BMI and level of hunger at the time of data collection, as well as relevant sociodemographic variables that are not intrinsic to the SES construct, including age, gender, and marital status. All covariate coefficients are reported in the Web Appendix. Because race is highly correlated with SES in general (Bailey, Loveman, and Muniz 2013) and particularly so in our samples (r ranging from .41 to .67), we did not include it as a covariate in our models. Across all studies, robustness analyses with alternative specifications are displayed in the Web Appendix.
Measure of SES
As preregistered, participants’ SES was inferred from the region where data collection occurred. Participants recruited in a deprived region were considered low SES, whereas participants recruited in a wealthy region were considered high SES. The underlying reasoning is that residents from these two regions present discrepant objective SES, as reflected by their income and education levels, and subjective SES, as reflected by their perceptions of rank vis-à-vis others in society. We provide robustness checks using alternative SES operationalizations in Web Appendix C, Table W5.
Results
Assumption checks on the neighborhood
We assumed that the participants recruited in Favela da Maré (low SES) had lower incomes, lower education levels, lower perceived socioeconomic standing, and exposure to much higher levels of food insecurity than participants recruited in the South Zone of Rio de Janeiro (high SES). These assumptions were supported. Low- (vs. high-) SES consumers reported significantly lower levels of monthly household income (MLowSES = 503.91, SDLowSES = 302.23; MHighSES = 6,891.16, SDHighSES = 5,207.56; t(356) = 16.33, p < .001) and educational attainment (MLowSES = 5.29, SDLowSES = 1.76; MHighSES = 8.77, SDHighSES = 1.23; t(356) = 21.64, p < .001). An objective composite created by standardizing and averaging these two measures (MLowSES = −.71, SDLowSES = .39; MHighSES = .70, SDHighSES = .79; t(356) = 23.34, p < .001) and the subjective SES measure also revealed significant differences between groups (MLowSES = 2.04, SDLowSES = .88; MHighSES = 3.56, SDHighSES = .61; t(356) = 19.06, p < .001). Finally, low-SES consumers also reported much higher levels of food insecurity (α = .92; MLowSES = 3.75, SDLowSES = 1.33) than high-SES consumers, who have essentially lived in a world of food safety (MHighSES = 1.14, SDHighSES = .38; t(356) = −25.26, p < .001). Table W3 summarizes sociodemographic and food insecurity measures across regions and studies.
Food choices
To assess how high- and low-SES individuals differed in their food preferences, we conducted logistic regressions including SES as an independent variable (1 = low SES, 0 = high SES) and food choice (1 = healthy food, 0 = unhealthy food) as the dependent variable, controlling for age, gender (1 = female, 0 = other), marital status (1 = married, 0 = other), BMI, and current level of hunger. We ran this model considering all three pairs as our focal analysis and, as a robustness check, we exploratorily examined each pair separately (Figure 1).
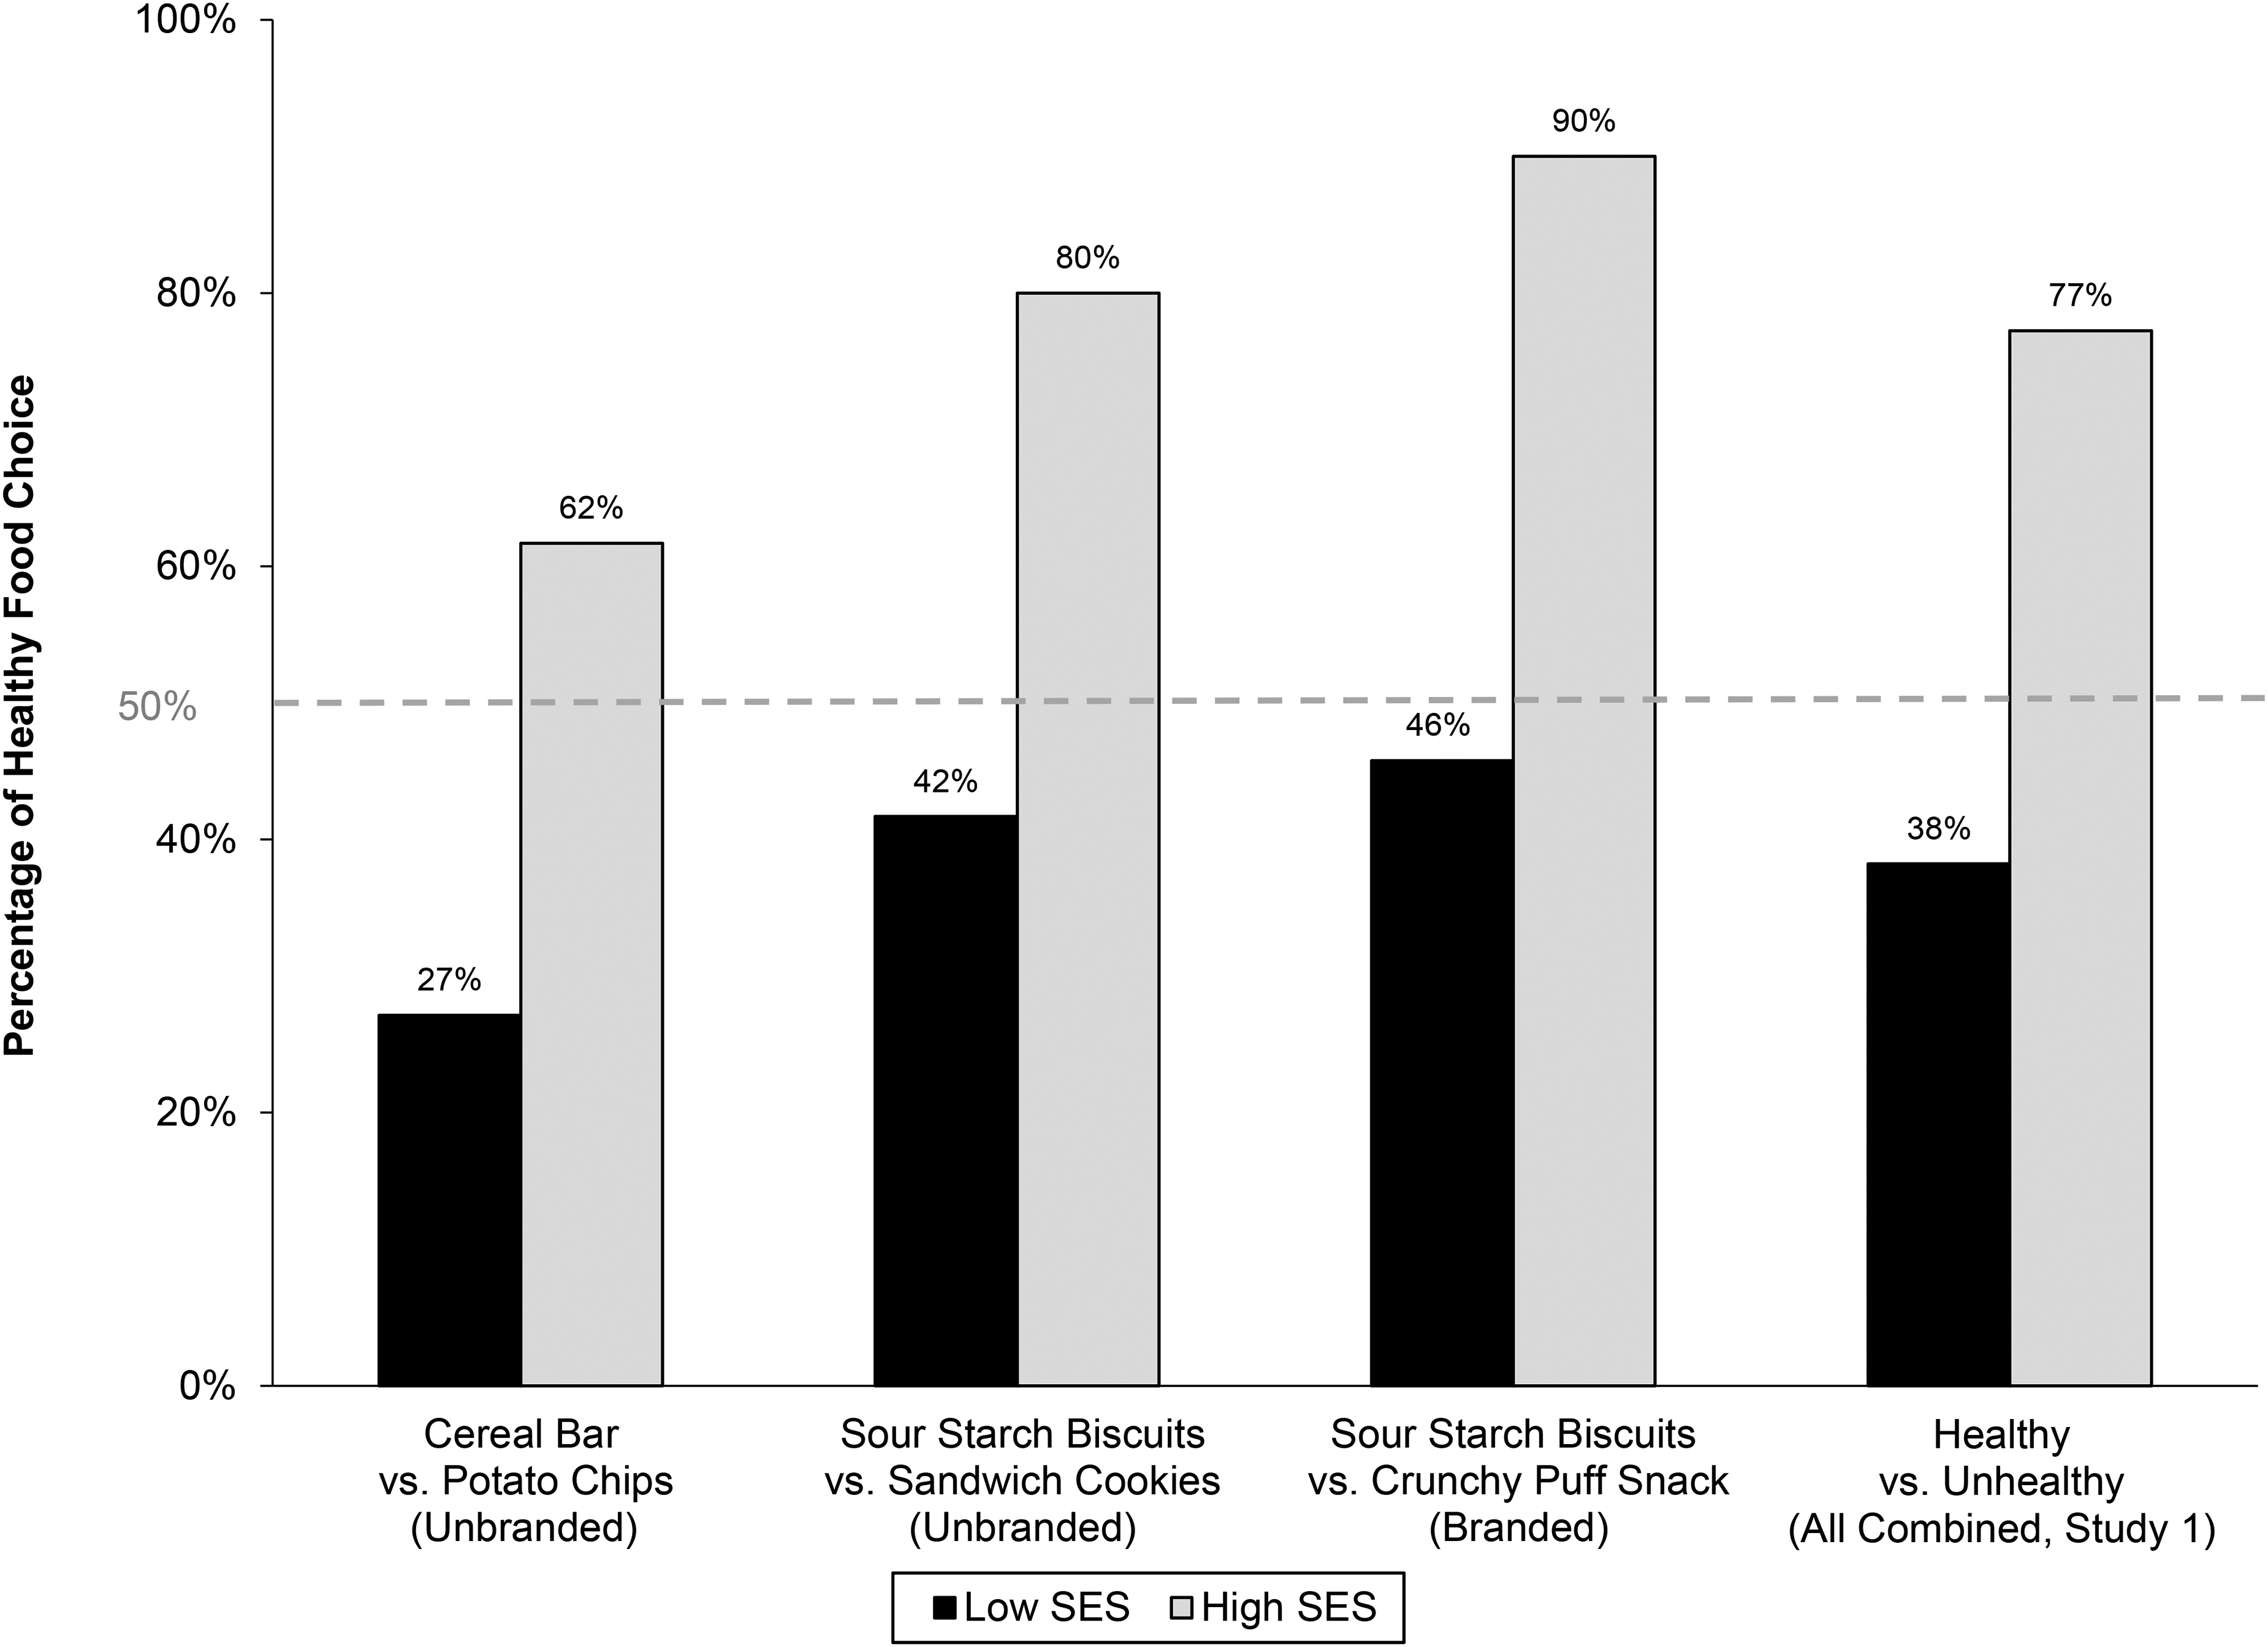
Food Choices Across SES (Study 1).
Low-SES consumers chose the healthy food items to a much lower extent than high-SES consumers (β = −1.78, SE = .24; 95% CI = [−2.26, −1.30], p < .001, OR = .17; Table W5). Exploratory analyses revealed similar results irrespective of product pair (Web Appendix C) and showed that when comparing the proportion of healthy versus unhealthy choices within each group, low-SES consumers preferred the unhealthy options (61.80%) over the healthy ones (38.20%, p < .001), whereas high-SES consumers displayed the opposite preference (22.78% vs. 77.22%, p < .001).
Discussion
Study 1 shows that, over and above differences in supply, differences in preferences may also influence the dietary choices of high- and low-SES consumers. Low-SES participants chose unhealthy foods to a much greater extent than their high-SES peers. This occurred for different pairs of foods, including branded and unbranded items. Although the current study provides evidence for the importance of demand-side considerations in nutritional inequality, it does not shed any light on the psychological reasons underlying these differences.
Study 2a
As our review of the literature suggests, food decisions are complex and multiply determined. Thought-listing protocols are especially well-suited for this context, as they allow for a bottom-up understanding of the forces guiding food choice across the SES spectrum. Study 2a aimed to provide qualitative evidence into the motives behind the SES-based discrepancy in food choices (Study 1). Our theoretical arguments suggest that fillingness, rather than taste, is a key SES differentiator, explaining why low-income individuals are less attracted to healthy food items (H1), which are often perceived as less filling.
To assess this possibility, residents from affluent and deprived regions of Rio de Janeiro made a hypothetical choice between a healthy and an unhealthy meal and then completed a thought-listing procedure (Cacioppo, Von Hippel, and Ernst 1997) wherein they indicated any thoughts that came across their minds while they were choosing what to eat. We expected thoughts involving fillingness to be more prevalent among low- versus high-SES consumers, but the opposite to be true for health considerations.
Method
Participants
Two hundred forty-seven participants took part in this study. About half of them (N = 122) were residents of the South Zone of Rio de Janeiro (high SES; Mage = 22.31 years, SD = 2.84; 50% female, 50% male), and the other half (N = 125) lived in Favela da Maré (low SES; Mage = 21.74 years, SD = 2.14; 54% female, 46% male). To ensure greater comparability across samples, research assistants were instructed to recruit participants aged 18–25 years and to balance gender. No participants were removed.
Procedure
Research assistants unaware of the study’s hypothesis approached passersby on the street and asked whether they were willing to participate in a short survey. Those who agreed were presented with a pair of healthy (grilled chicken, salad, and orange juice) and unhealthy meals (cheeseburger, fries, and soda) and made a hypothetical choice between them (for details on the stimuli, see Web Appendix D). The research assistants immediately asked participants to provide the reasons behind their choice in a thought-listing task: Now, we would like to ask you to elaborate on all the thoughts that crossed your mind while you were deciding between the two meals. Please list any thoughts that occurred to you. We’ve left 10 text boxes with enough space for each thought, but you don’t have to fill out all of them. There are no right or wrong answers; we just want you to be as candid as possible.
Then, participants completed a sociodemographic questionnaire and a food insecurity measure before being thanked and dismissed.
Coding of thought listing
Two research assistants unaware of the study’s hypothesis independently coded the participant responses using the following attributes: fillingness, healthiness, taste, price/value consciousness, hedonism, familiarity, convenience, and limited opportunity (details on the coding instructions and agreement rates are presented in Web Appendix D).
Sociodemographic, food insecurity, and dietary information
Participants completed the same sociodemographic, food insecurity, and diet-related questions used in Study 1.
Measure of SES
As in Study 1, we inferred the SES of participants from the region where data collection took place (Web Appendix B, Table W3).
Results
Hypothetical food choices
To assess how high- and low-SES individuals differed in their food preferences, we conducted logistic regressions including SES as an independent variable (1 = low SES, 0 = high SES) and food choice (1 = healthy food, 0 = unhealthy food) as the dependent variable, controlling for the same covariates as in Study 1. As in the first study, low-SES consumers chose the healthy meal to a much lower extent than high-SES consumers (16.80% vs. 81.15%; β = −2.80, SE = .41; 95% CI = [−3.61, −1.99], p < .001, OR = .06).
Thought-listing protocol
To assess how high- and low-SES individuals’ justifications for food choices differed, we conducted logistic regressions with SES as an independent variable and each of the coded justifications as dependent variables, using the same covariates. Overall, low- (vs. high-) SES consumers cited healthiness to a much lower extent (19.20% vs. 80.33%; β = −2.50, SE = .39; 95% CI = [−3.27, −1.73], p < .001, OR = .08; Figure 2). Critically, fillingness justifications were overwhelmingly present among low-SES consumers (79.20%), but none of the high-SES consumers mentioned it. Given the absence of variability in the dependent variable among the affluent, we were unable to run a logistic regression, but a proportions test revealed that low-SES consumers considered fillingness to a much greater extent (p < .001). Exploratory results showed that low-SES participants cited taste more often, but spontaneous considerations of this attribute were relatively high for both groups (85.60% vs. 59.02%, p < .001), which resonates with the hypothesis that consumers, in general, are unwilling to give up on taste. Although differences appeared, the other aspects were considered to a much lesser extent (Figure 2).
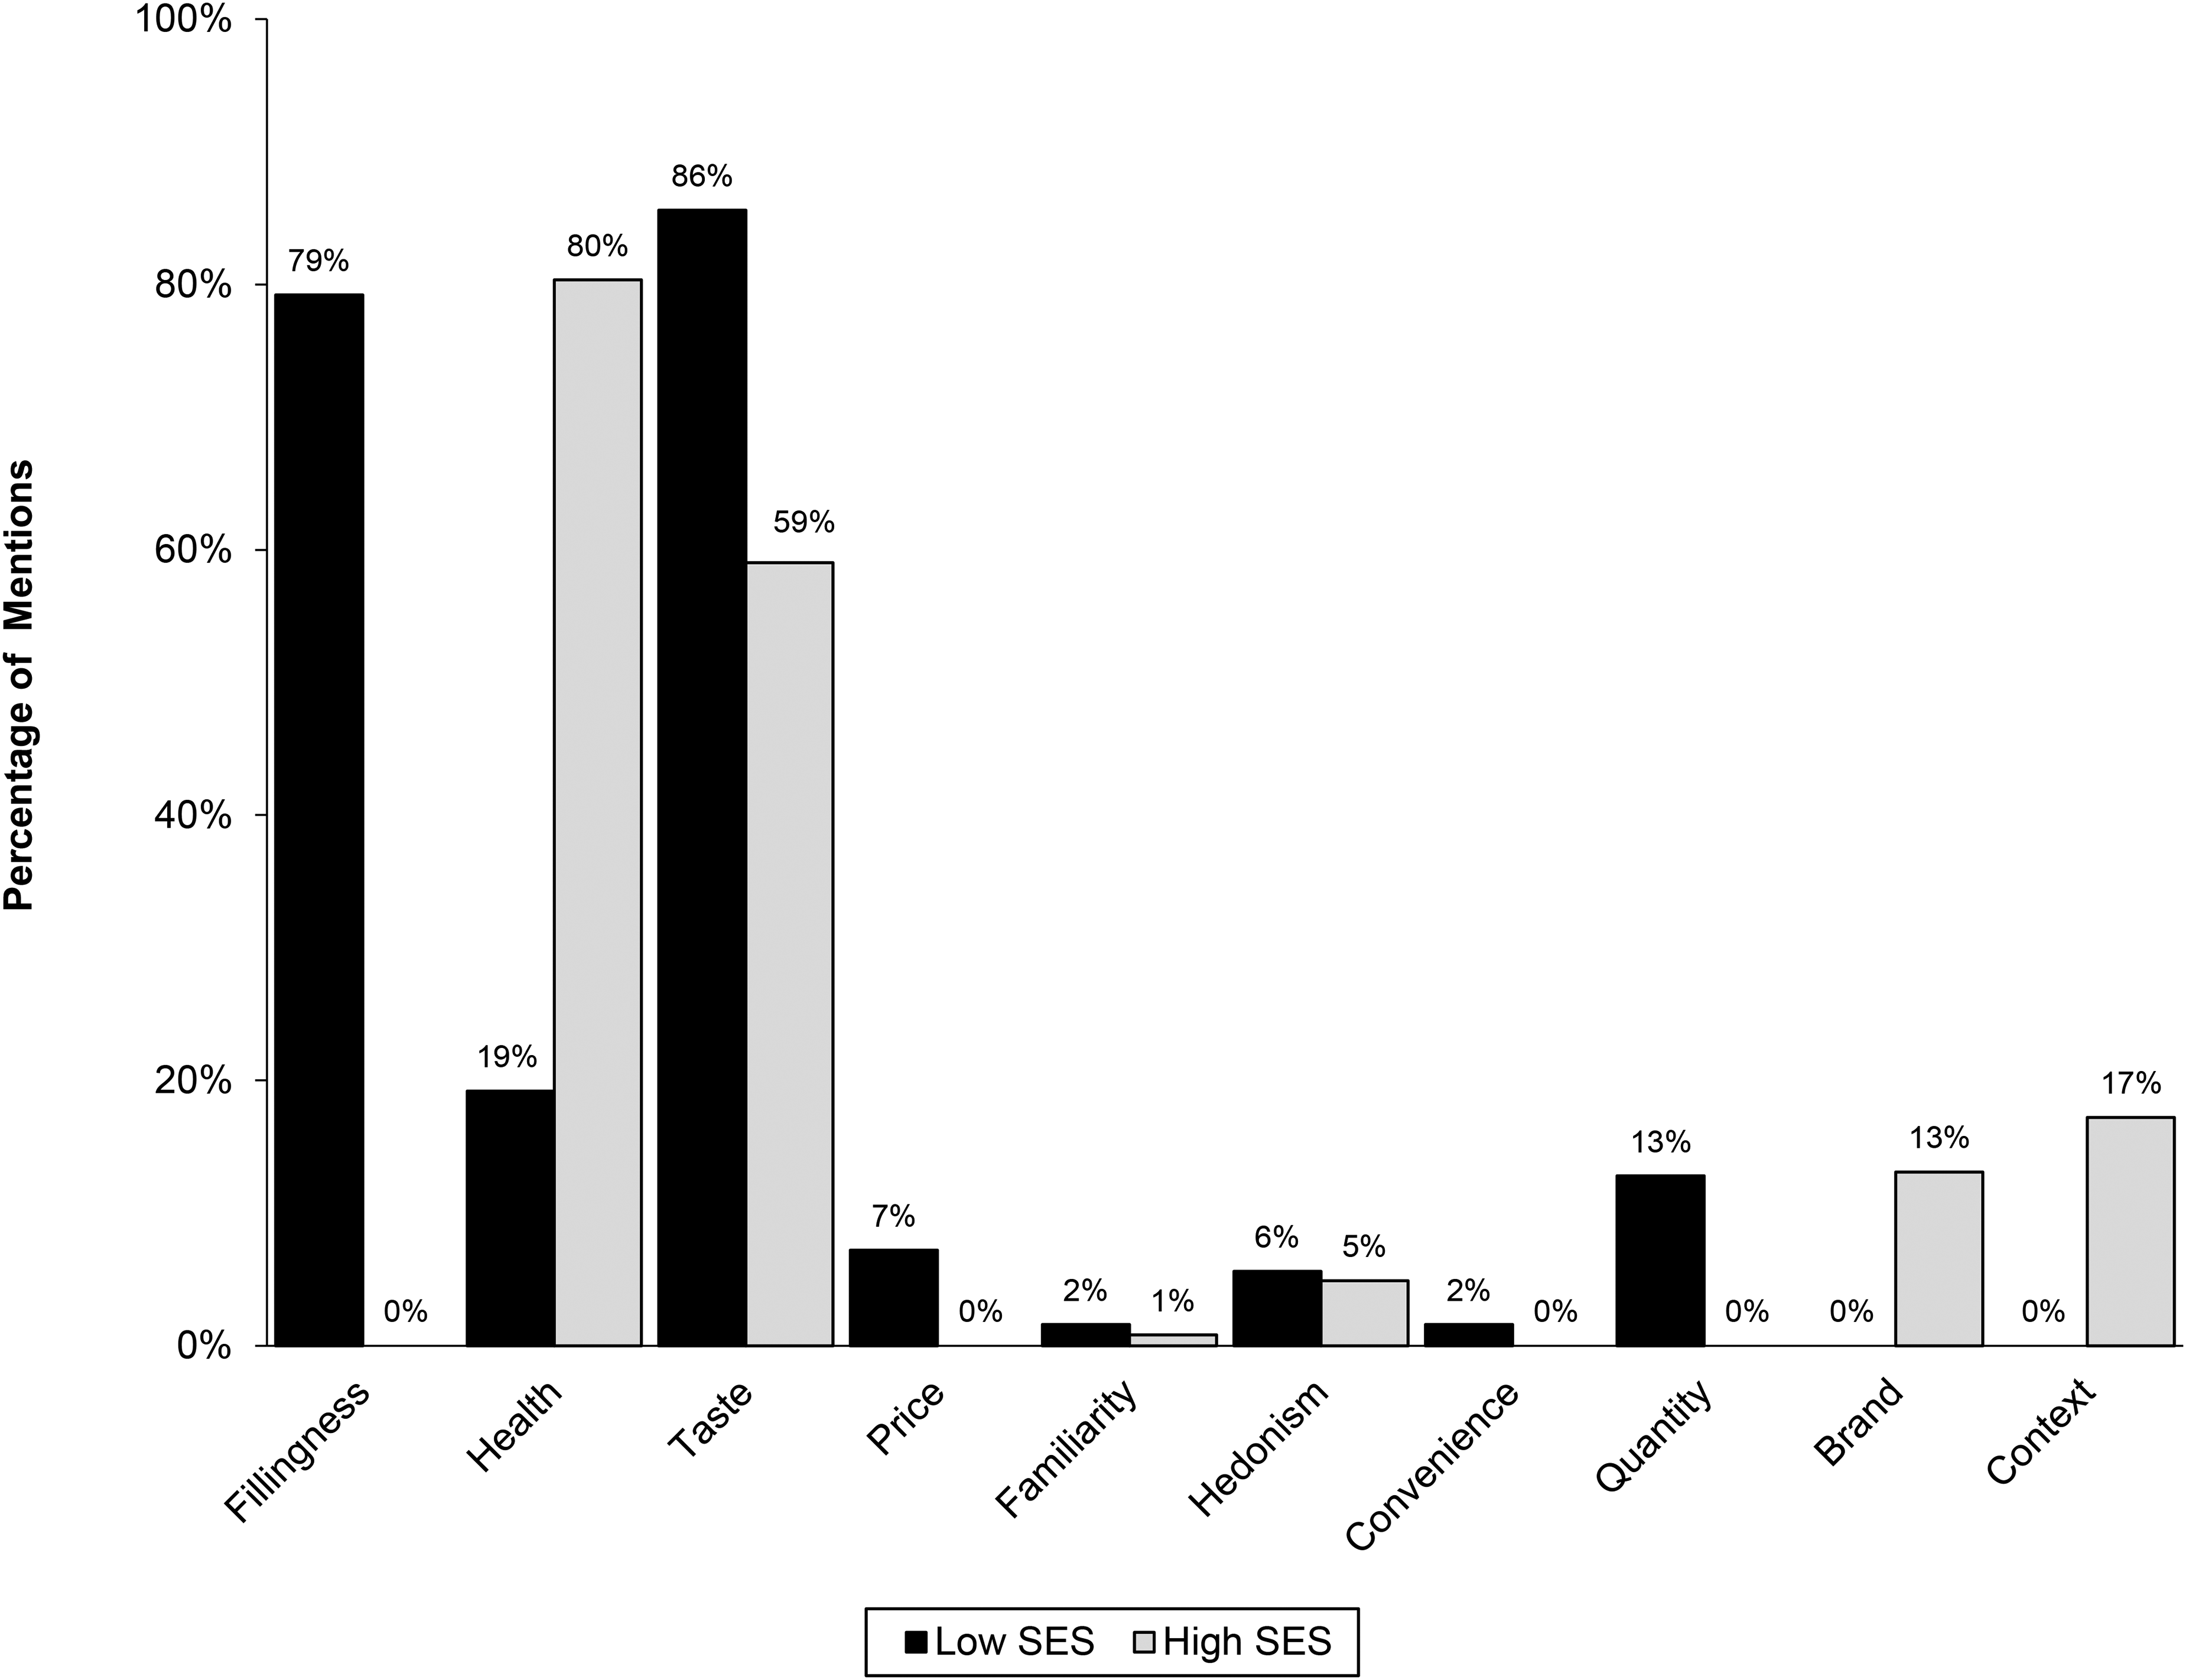
The Influence of SES on Aspects Considered in a Thought-Listing Task (Study 2a).
Mediation analysis
We exploratorily assessed the mediation roles of fillingness, healthiness, taste, and price (to account for explanations based on financial consideration) on the relationship between SES and hypothetical food choice using a bootstrapped parallel mediation model with 5,000 replications. Our results show that low- (vs. high-) SES consumers were more likely to mention fillingness (β = .79, SE = .04; 95% CI = [.72, .86], p < .001), which in turn reduced their likelihood of choosing the healthy food item (β = −.11, SE = .03; 95% CI = [−.18, −.05], p < .001; indirect effect: β = −.09, SE = .04; 95% CI = [−.17, −.01], p = .026). The opposite, however, was observed for health. Low-SES consumers were less likely to mention health (β = −.61, SE = .05; 95% CI = [−.71, −.51], p < .001), which in turn increased the likelihood of choosing the healthy food item (β = .85, SE = .02; 95% CI = [.80, .90], p < .001; indirect effect: β = −.52, SE = .06; 95% CI = [−.64, −.40], p < .001). Indirect effects of taste (β = −.01, SE = .01; 95% CI = [−.02, .00], p = .102) and price (β = .00, SE = .00; 95% CI = [−.00, .00], p = .098) were not significant. See Figure W3 in Web Appendix D.
Discussion
Study 2a replicates the finding that low-SES consumers choose unhealthy foods to a much greater extent than their high-SES counterparts using a meal rather than a single product choice. Further, it shows the importance of healthiness, fillingness, and taste in food decision-making (the three most mentioned attributes). Critically, it reveals that thoughts of fillingness and health, more so than taste, represent the main differentiators between the two SES groups. Thus, this study offers initial evidence that the primacy of fillingness among low- (vs. high-) SES consumers may help explain differences in food preferences.
Study 2b
Study 2b dives deeper into the fillingness attribute. Specifically, it examines the reasons why fillingness might be particularly important for low-SES consumers. We assessed if, though important, the relevance of the fillingness attribute goes beyond sheer financial considerations of calories per monetary unit. Given the high levels of food insecurity within this segment, we suspect there is intrinsic value in the feeling of satiety (i.e., the sensation of fullness). These two explanations—financial considerations and feeling of satiety—should be more critical than other plausible reasons for the primacy of fillingness, including familiarity, health concerns, and social signaling.
Method
Participants
One hundred one low-SES consumers who lived in a deprived area of Rio de Janeiro took part in this study (Mage = 30.30 years, SD = 8.39; 49% female, 51% male).
Procedure
Research assistants unaware of the study’s hypothesis approached passersby on the street and asked whether they were willing to participate in a short survey. Those who agreed first indicated whether fillingness/satiety was an important attribute to them when making food choices (“important” or “not important”). Then, those who indicated that fillingness/satiety was an important attribute also reported their level of agreement or disagreement with a series of reasons why they considered fillingness/satiety important (1 = “completely disagree,” and 7 = “completely agree”). The items tapped into financial considerations (“I choose filling foods purely for financial reasons”), feeling of satiety (“I choose filling foods because the feeling of satiety/full stomach gives me pleasure”), familiarity (“I choose filling foods because I am more familiar with them”), health concerns (“I choose filling foods because they are the healthiest options”), and social signaling (“I choose filling foods because I think they would be well-regarded by others”).
Sociodemographic, food insecurity, and dietary information
Participants completed the same sociodemographic, food insecurity, and diet-related questions used in Study 1.
Results
Not surprisingly, and in line with Study 2a, fillingness was considered important by 89 out of 101 low-SES consumers (88.12%; p < .001; against 60%).
To assess the importance of each potential reason why fillingness is a relevant attribute, we conducted one-sample t-tests contrasting the mean score of financial considerations and feeling of satiety against both the scale midpoint (4) and the other three reasons (familiarity, health concerns, and social signaling; Figure 3). As expected, feeling of satiety (Msatiety = 6.82, SDsatiety = .95) was significantly higher than the scale midpoint (i.e., 4, p < .001), and familiarity (Mfamiliarity = 4.22, SDfamiliarity = 2.86), health (Mhealth = 3.32, SDhealth = 2.79), and social signaling reasonings (Msignaling = 1.97, SDsignaling = 1.77). Likewise, the same pattern was observed for financial considerations (Mfinancial = 6.91, SDfinancial = .65; all p's < .001). An exploratory analysis contrasting the feeling of satiety with financial considerations shows that both were equally highly valued (p = .39).
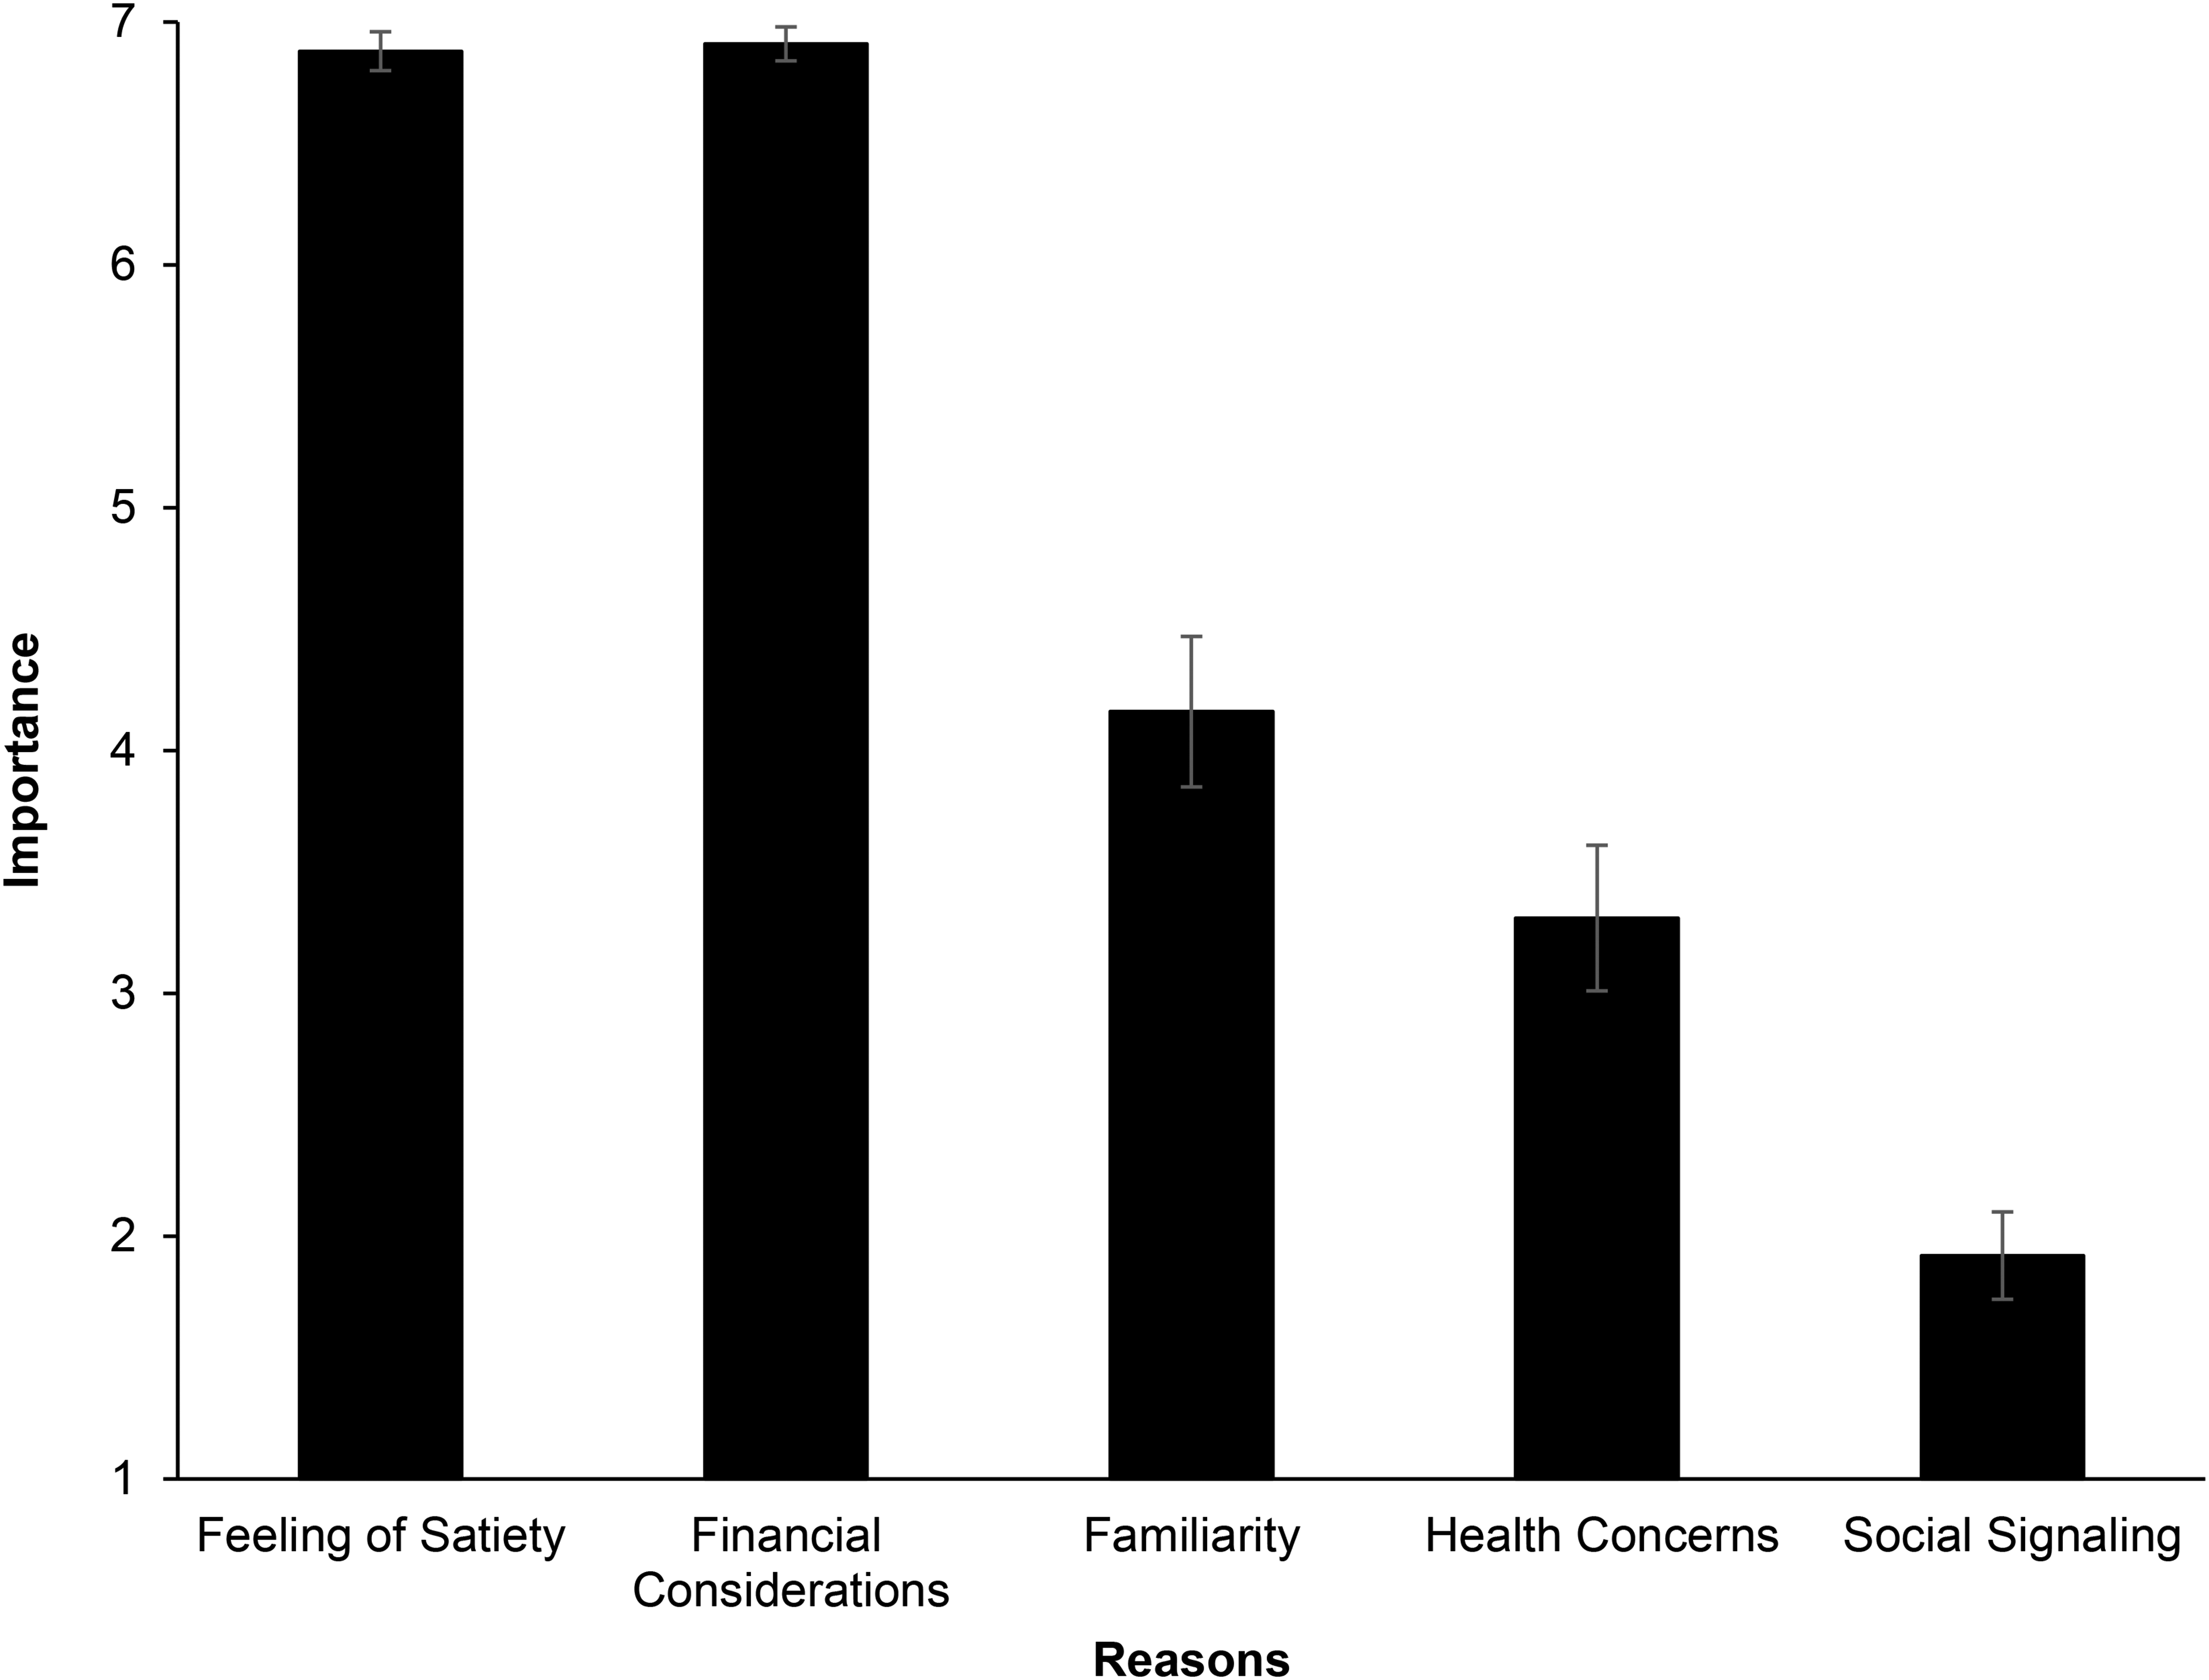
Reasons Fillingness Is Important Among Low-SES Consumers (Study 2b).
Discussion
Study 2b shows that low-SES consumers largely value filling foods not only for financial reasons but also because they highly value feelings of satiety/a full stomach. These factors take precedence over other plausible possibilities, such as familiarity, health considerations, and social signaling. Our next studies demonstrate how fillingness considerations shape food choices by shedding light on the roles of attribute importance and associations.
Studies 3a and 3b
Studies 3a and 3b investigate how consumers of contrasting socioeconomic levels weigh different food attributes when making dietary choices. Participants were asked to rank the relevance of fillingness, healthiness, and taste in their food-related decisions. We reasoned that low-SES consumers would give a higher weight to fillingness than high-SES consumers (H1a). Further, given the importance of taste in food decision-making, we also expected low- (vs. high-) SES consumers to prioritize fillingness at the expense of healthiness but not taste (H1b). Study 3a relies on a neighborhood-inferred SES measure with participants recruited in deprived and wealthy regions of Rio de Janeiro. Study 3b uses a web-based study in which we experimentally prompt contexts characteristic of low and high SES to establish causality.
Study 3a
Participants and Procedure
Two hundred participants took part in this study (Mage = 41.90 years, SD = 18.75; 45% female, 55% male). Half of them were residents of the South Zone of Rio de Janeiro, and the other half lived in Favela da Maré. Research assistants unaware of the study’s hypothesis approached passersby in the street and asked whether they were willing to take part in a short survey. The research assistants provided those who agreed with a general context (food purchase) and brief explanations about three different food attributes, presented in random order: healthiness (“how healthy is a food item, that is, how good it is for the health of the person eating it”), fillingness (“how filling is a food item, that is, how much it satiates hunger for a good chunk of time”), and taste (“how tasty is a food item, that is, how appetizing it is to eat it”). Then, participants ranked the items in order of importance: When purchasing food items, what importance do you generally attribute to each of these three aspects? Please indicate (1) for the most important, (2) for the second most important, and (3) for the least important. • How healthy the food item is. • How filling the food item is. • How tasty the food item is.
Sociodemographic, food insecurity, and dietary information
Participants completed the same sociodemographic, food insecurity, and diet-related questions shown in Study 1.
Measure of SES
As in Study 1, we inferred the SES of participants from the region where data collection took place (Web Appendix B, Table W3).
Results
We conducted separate ordered logistic regressions to assess how SES shapes the weight given to the three food attributes (i.e., healthiness, fillingness, and taste). The models included SES as the independent variable (1 = low SES [deprived neighborhood], 0 = high SES [wealthy neighborhood]), BMI, current level of hunger, gender (1 = male, 0 = female/other), marital status (1 = married, 0 = not married), and age as control variables, and the ranking measure for the attribute under consideration as the dependent variable. For ease of interpretation, we reversed the ranking measure so that higher scores indicate greater relative importance.
In line with H1a, low-SES consumers prioritized fillingness to a greater extent than high-SES consumers (β = 1.00, SE = .48; 95% CI = [.05, 1.95], p = .038, OR = 2.72) but considered healthiness as a less important attribute (β = −1.22, SE = .51; 95% CI = [−2.22, −.21], p = .017, OR = .29). Consistent with H1b, there were no SES differences on the relative importance of taste. Both high- and low-SES consumers reported weighing heavily on this attribute (β = .07, SE = .43; 95% CI = [−.77, .91], p = .872, OR = 1.07; see Figure 4, Panel A). For analyses with alternative model specifications and interactions, see Web Appendix E.
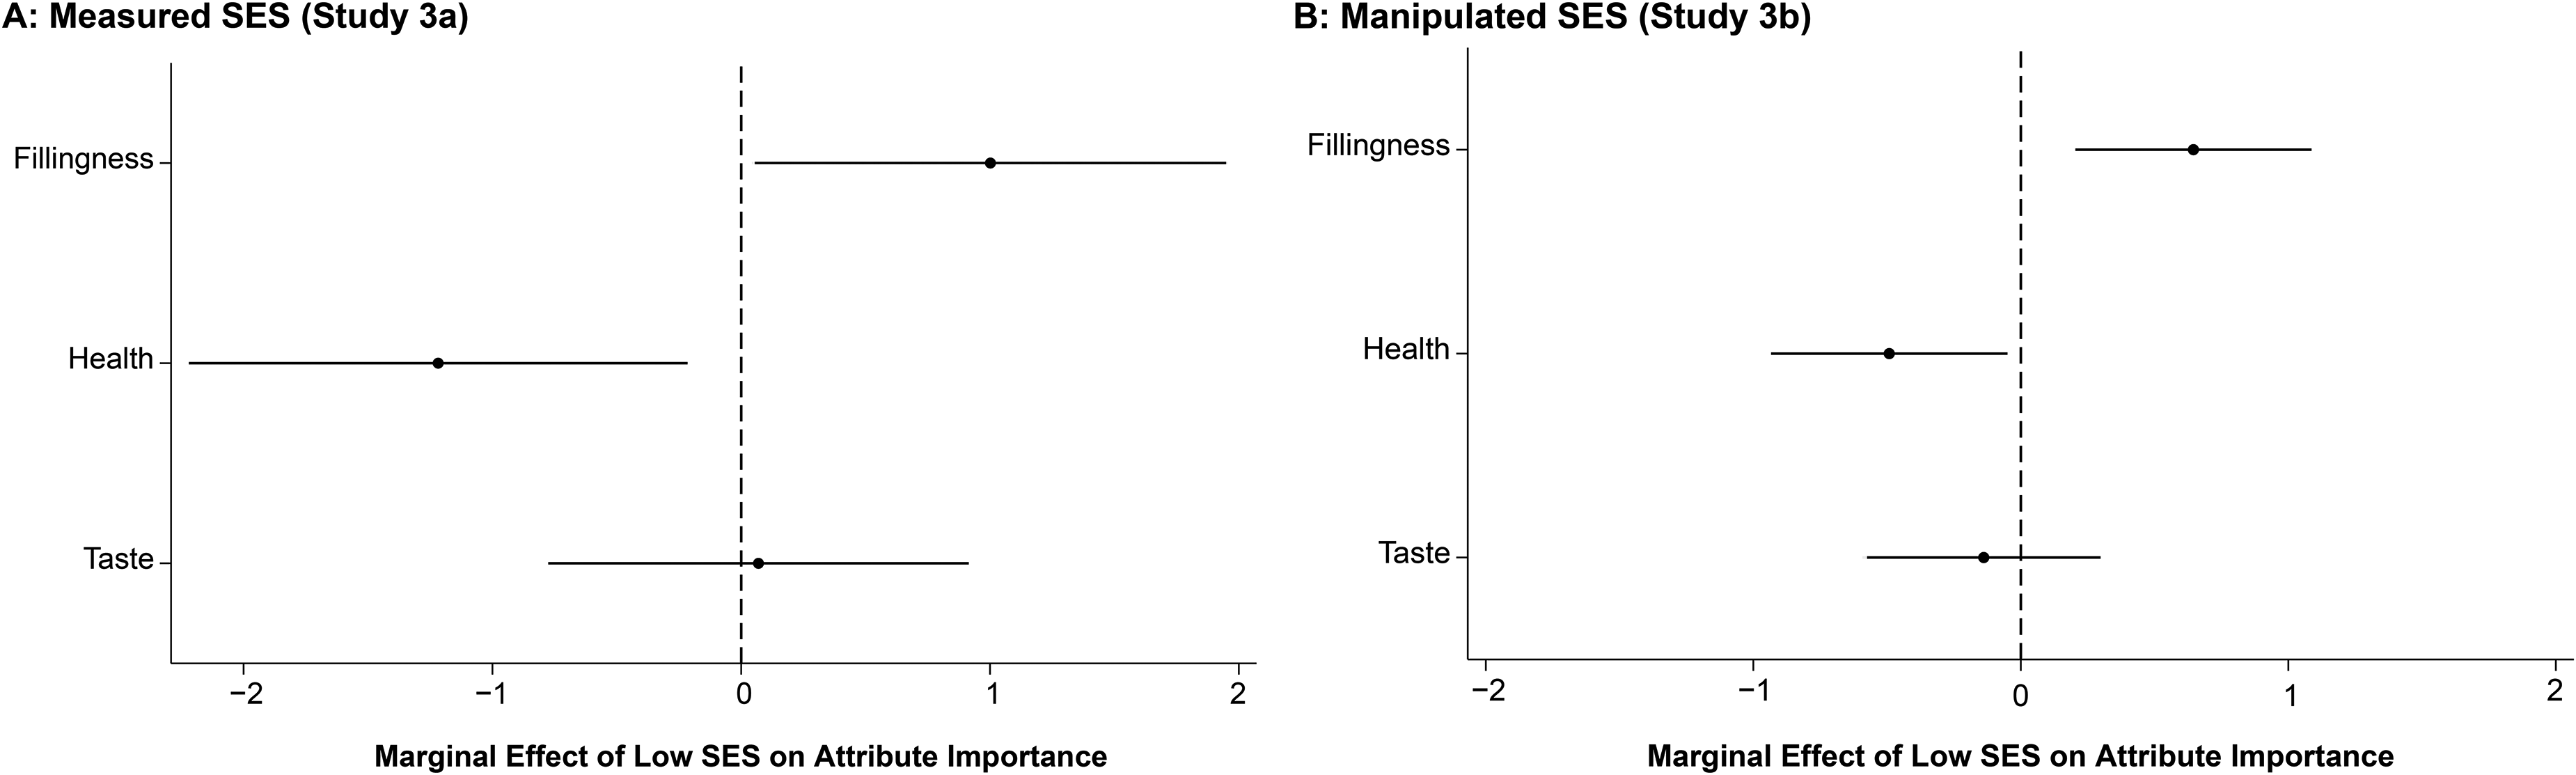
The Influence of Measured and Manipulated SES on Attribute Importance/Weights (Studies 3a and 3b).
Study 3b
Participants and Procedure
Two hundred seventy-three participants took part in this online study. We recruited participants from Netquest, a large online panel. We targeted participants with household incomes below R$4,000 (about four minimum wages) to ensure our manipulation would be arguably credible for all respondents. Following the preregistration protocol, we excluded 19 participants who did not consent to participate and 71 participants because they reported a household income above the target level. Our final sample thus includes 283 participants (Mage = 39.38 years, SD = 12.73; 65% female, 35% male). The survey procedure was the same as in Study 3a, and participants also ranked the attributes in order of importance as the main dependent variable.
Sociodemographic, food insecurity, and dietary information
Participants completed the same sociodemographic, food insecurity, and diet-related questions as in Study 1.
Manipulation of SES
In this study, we experimentally manipulated SES circumstances. Participants filled out three four-item scales (1 = “completely disagree,” and 5 = “completely agree”). Two of the scales were held constant across experimental conditions (flu-related questions [e.g., “People close to me or I have caught the flu this year”] and work-related questions [“People close to me or I prefer to work from home”). These questions served as fillers to mask the purpose of the study. The third scale was manipulated between subjects. Participants assigned to the low-SES circumstance condition answered questions involving experienced or witnessed food insecurity extracted from Vieites, Goldszmidt, and Andrade (2022): “People close to me or I have already suffered or still suffer from the lack of food,” “People close to me or I have already skipped or still skip meals due to the lack of money to buy food,” “People close to me or I have already run or still run out of money to assure a healthy and balanced diet,” and “running out of food is a genuine concern in my life or the life of those close to me” (1 = “strongly disagree,” and 5 = “strongly agree”). To reinforce the manipulation, participants then described a situation in which they or someone close to them lacked food or had great concerns about having enough to eat in an open-ended question (for a complete description, see Web Appendix F and for a similar approach, see Piff et al. [2010]). Conversely, participants assigned to the control condition completed four questions about the weather (e.g., “People close to me or I have had bad experiences living in cold places”) and then described a situation in which they had a negative experience with cold weather or working from home or flu (between subjects) in an open-ended question. Across all scales, participants indicated their agreement using a five-point measure (1 = “completely disagree,” and 5 = “completely agree”).
Results
We conducted the same analysis as in Study 3a. In line with H1a, low-SES consumers prioritized fillingness to a greater extent than high-SES consumers (β = .65, SE = .22; 95% CI = [.20, 1.09], p = .004, OR = 1.91) and considered healthiness as a less important attribute (β = −.49, SE = .22; 95% CI = [−.93, −.05], p = .029, OR = .61). Consistent with H1b, there were no SES differences on the relative importance of taste. Both high- and low-SES consumers reported weighing heavily on this attribute (β = −.13, SE = .22; 95% CI = [−.57, .30], p = .541, OR = .87; see Figure 4, Panel B).
Discussion
Studies 3a and 3b show that low- and high-SES consumers report weighing food attributes differently when choosing what to eat, regardless of whether SES is measured or manipulated. Relative to high-SES consumers (or those prompted to feel high SES), low-SES consumers (or those prompted to feel low SES) report giving more importance to fillingness, less importance to healthiness, and equally high importance to taste (consistent with H1). Our results thus indicate that, by prioritizing satiety, low-SES consumers tend to give up on nutritional value rather than palate.
The measurement of attribute importance often asks for a multimethod examination (Van Ittersum et al. 2007). Although direct rating and ranking approaches are simple and easy, they assume respondents are willing to and capable of properly assessing attribute weights and trade-offs. Another common approach is to indirectly infer attribute weights from choices (Ben-Akiva, McFadden, and Train 2019). Thus, in Study 4, we rely on a choice-based conjoint analysis to assess the robustness of the results obtained in Studies 3a and 3b.
Study 4
Study 4 further examines how SES shapes the relative importance of food attributes in dietary choices. We recruited participants from wealthy and deprived regions of Rio de Janeiro. Participants indicated their preferred option across different pairs of food items varying on levels of fillingness, healthiness, and taste. We reasoned that low- (vs. high-) SES consumers would be more likely to choose particularly filling foods (H1a). Further, they would choose healthy foods to a lower extent while displaying a similarly high inclination toward tasty foods when compared with high-SES consumers (H1b).
Method
Participants
Two hundred fifty participants took part in the study (Mage = 30.68 years, SD = 11.24; 56% female, 44% male). Half of them lived in a wealthy region (i.e., South Zone), and the other half lived in a deprived neighborhood of Rio de Janeiro (i.e., Favela da Maré).
Procedure
Participants recruited on the streets of high- and low-SES areas of Rio de Janeiro made hypothetical choices across six pairs of food items varying on three attributes. Specifically, each product was described in terms of its degree of fillingness, healthiness, and taste. Each of these attributes had three levels: low, medium, and high. Because previous research recommended the use of visual cues in conjoint studies targeting samples with low levels of formal education (Meyer and Rosenzweig 2016), we described each attribute level using different colors (low = red, medium = yellow, high = blue; see Web Appendix G, Figure W4). Similar strategies have also been widely used in food labeling policy and research (Balcombe, Fraser, and Falco 2010; Roberto et al. 2012; Thorndike et al. 2014). Finally, to avoid the unwanted influence of prior beliefs about specific food products (e.g., “banana is filling”), we did not identify the foods, only the attribute levels were made explicit.
Choice sets
We generated an orthogonal array (Addelman 1962; Green 1974) that reduced the number of food items to be explored from 27 potential combinations to 9 food items (Bloch, Brunel, and Arnold 2003; Iyengar, Jedidi, and Kohli 2008; Sokolova and Krishna 2021; Tavares et al. 2018). These food items formed 36 possible pairwise combinations, which were randomized across participants. Each participant was randomly assigned to 6 of the 36 choice sets available (see Web Appendix G, Table W12) and sequentially indicated the food item they would choose in each pair. Importantly, we randomized the order of attributes across subjects and a priori randomized the order the food items would be displayed within each choice set.
Sociodemographic, food insecurity, and dietary information
Participants provided the same food insecurity, sociodemographic, and dietary information as in Study 1.
Results
We performed three separate logistic regressions for each food attribute to test our hypotheses. The models included food choice as the dependent variable (1 = chosen, 0 = not chosen) and SES (1 = low SES, 0 = high SES), dummies for moderate and high levels of the attribute under analysis (the lower level served as the baseline), and the two-way interactions between SES and attribute dummies as independent variables. We also controlled for choice set and attribute order effects, sociodemographic characteristics, and diet-related information, and we clustered the standard errors at the individual level. Although we report the results of separate regression models for ease of interpretation, Tables W13–16 in Web Appendix G present the results of a single model containing all six two-way interactions.
In line with H1a, low-SES consumers chose filling foods to a greater extent than high-SES consumers (Figure 5, Panel A). The significant interaction between SES and the medium-fillingness dummy (β = .96, SE = .18; 95% CI = [.60, 1.32], p < .001, OR = 2.62) and the even stronger effect for the high-fillingness dummy (β = 1.21, SE = .21; 95% CI = [.81, 1.62], p < .001, OR = 3.37) corroborate our hypothesis. Simple slopes analyses show that low-SES consumers chose low-fillingness foods less than high-SES consumers (β = −.72, SE = .11; 95% CI = [−.95, −.50], p < .001, OR = .48), but this effect reverses for medium-fillingness foods (β = .24, SE = .10; 95% CI = [.04, .44], p = .019, OR = 1.27) and becomes even more positive for high-fillingness foods (β = .49, SE = .13; 95% CI = [.24, .74], p < .001, OR = 1.63).
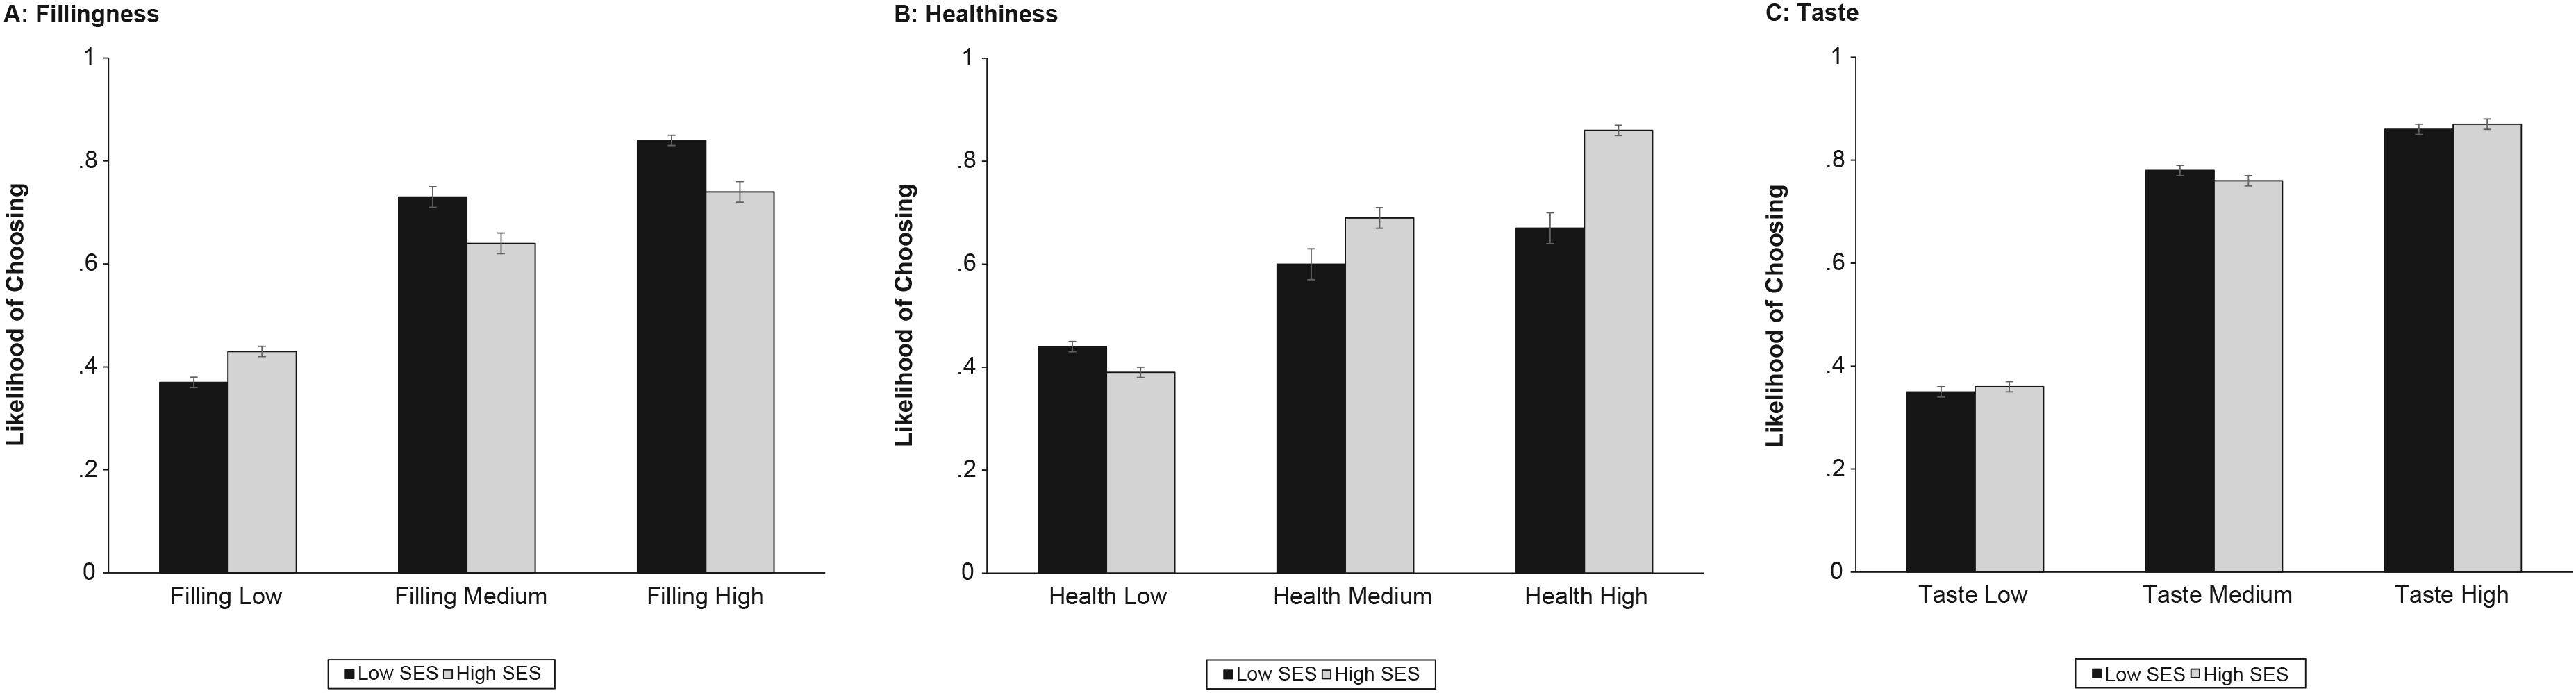
Attribute Importance Inferred from Food Choices Across the SES Continuum (Study 4).
Further, as anticipated in H1b, low-SES consumers were less likely to choose healthier food items than high-SES consumers, as revealed by the negative and significant interaction between SES and the medium-health dummy (β = −1.02, SE = .21; 95% CI = [−1.44, −.61], p < .001, OR = .36) and the even stronger interaction effect for the high-health dummy (β = −2.02, SE = .22; 95% CI = [−2.46, −1.59], p < .001, OR = .13; Figure 5, Panel B). Again, simple slopes analyses support our predictions by showing that low-SES consumers chose low-health foods more than high-SES consumers (β = 1.01, SE = .13; 95% CI = [.75, 1.26], p < .001, OR = 2.74), but this effect reverses for highly healthy foods (β = −1.02, SE = .12; 95% CI = [−1.26, −.77], p < .001, OR = .36). No significant differences were found for moderately healthy foods (β = −.02, SE = .11; 95% CI = [−.24, .20], p = .873, OR = .98). Finally, again in line with H1b, taste did not differentially influence choices across social classes (Figure 5, Panel C). Neither the interaction between SES and medium-taste dummy (β = .20, SE = .20; 95% CI = [−.19, .60], p = .312, OR = 1.23) nor the interaction effect for the high-taste dummy reached significance (β = −.11, SE = .21; 95% CI = [−.54, .31], p = .593, OR = .89).
Discussion
In a choice-based context, Study 4 provides further evidence that SES shapes the relative importance of food attributes and does so in a systematic manner. Relative to their high-SES counterparts, low-SES consumers in our sample were more likely to give weight to fillingness (H1a), less likely to care about healthiness, and as highly concerned about taste (H1b) when making food choices. Study 5 takes a step further to explore whether high- and low-SES consumers also vary in the strength of the perceived associations between these attributes.
Study 5
Although research has shown that healthy foods are often seen as less tasty and less filling than unhealthy foods (Beydoun and Wang 2008; Suher, Raghunathan, and Hoyer 2016), we examine whether these heuristics vary in strength across the SES spectrum. Given their weaker inclination to try new possibilities and their exposure to a narrower range of food options (Baumann, Szabo, and Johnston 2019), the heuristics about the correlation between food attributes are plausibly stronger and/or more widely accepted among low-SES consumers. Thus, we expected low-SES consumers to display stronger intuitive attribute associations (“healthier = less filling” and “healthier = less tasty”) than their high-SES counterparts (H2).
Method
Participants
Three hundred participants took part in the study (Mage = 33.79 years, SD = 13.75; 58% female, 42% male). Half of them lived in a wealthy region (i.e., South Zone), and the other half lived in a deprived neighborhood of Rio de Janeiro (i.e., Favela da Maré).
Procedure
Participants recruited on the streets of both neighborhoods were presented with eight food images displayed in random order and indicated the extent to which each food item was healthy, filling, and tasty on a seven-point scale (1 = “not at all,” and 7 = “extremely”). These scores served as our main dependent variables. The food images, retrieved from Charbonnier et al. (2016), were also accompanied by tags with the name of the food displayed (Web Appendix H). The images and corresponding tags portrayed four presumably healthy foods (salad, strawberry, grapes, and mix of nuts) and four presumably unhealthy foods (ice cream, croissant, chocolate cake, and cheeseburger). In short, high- and low-SES participants indicated their perceptions about eight different types of food (healthy and unhealthy) on healthiness, fillingness, and taste.
Afterward, participants proceeded to an unrelated study, filled out the same food insecurity measure, dietary status, and sociodemographic questionnaire as in the previous studies. They were then thanked and dismissed.
Results
Assumption checks for the type of food
We conducted t-tests to assess whether the presumably healthy and unhealthy foods were indeed perceived as such. A paired samples t-test revealed that participants perceived healthy foods as much healthier than unhealthy foods (MHealthy = 6.26, SD = 1.19; MUnhealthy = 2.12, SD = 1.11; t(299) = 35.66, p < .001). This effect was observed for both low- (MLowSES Healthy = 5.62, SD = 1.38; MLowSES Unhealthy = 2.93, SD = .96; t(149) = 17.39, p < .001) and high-SES participants (MHighSES Healthy = 6.90, SD = .30; MHighSES Unhealthy = 1.31, SD = .47; t(149) = 124.56, p < .001). In addition, the scores were significantly higher than the midpoint (i.e., 4) for healthy foods (t(299) = 32.02, p < .001) but significantly lower than the midpoint for unhealthy foods (t(299) = 29.38, p < .001).
Strength of attribute associations: healthier = less filling
We regressed fillingness perceptions on SES (1 = low SES, 0 = high SES), type of food (1 = healthy, 0 = unhealthy), and the interaction between them using a linear regression model with diet and sociodemographic controls and standard errors clustered at the individual level. The interaction reached significance (β = −1.79, SE = .14; 95% CI = [−2.06, −1.52], p < .001, r = .60). As Panel A of Figure 6 shows, low-SES consumers perceived healthier foods as significantly less filling than unhealthy foods (MLowSES Healthy = 3.53, SD = 1.34; MLowSES Unhealthy = 4.77, SD = .81; β = −1.23, SE = .12; 95% CI = [−1.47, −.99], p = <.001, r = .64). This effect was not only weaker but also reversed among high-SES consumers; that is, they perceived healthy foods as significantly more filling than unhealthy ones (MHighSES Healthy = 5.97, SD = .74; MHighSES Unhealthy = 5.41, SD = .42; β = .55, SE = .06; 95% CI = [.43, .68], p = <.001, r = .58). Although the interaction is consistent with H2, the reversal (rather than attenuation) among high-SES consumers was unexpected (see Web Appendix H for a summary of individual scores across socioeconomic groups and a justification of the reversal and the role of ice cream in explaining it).
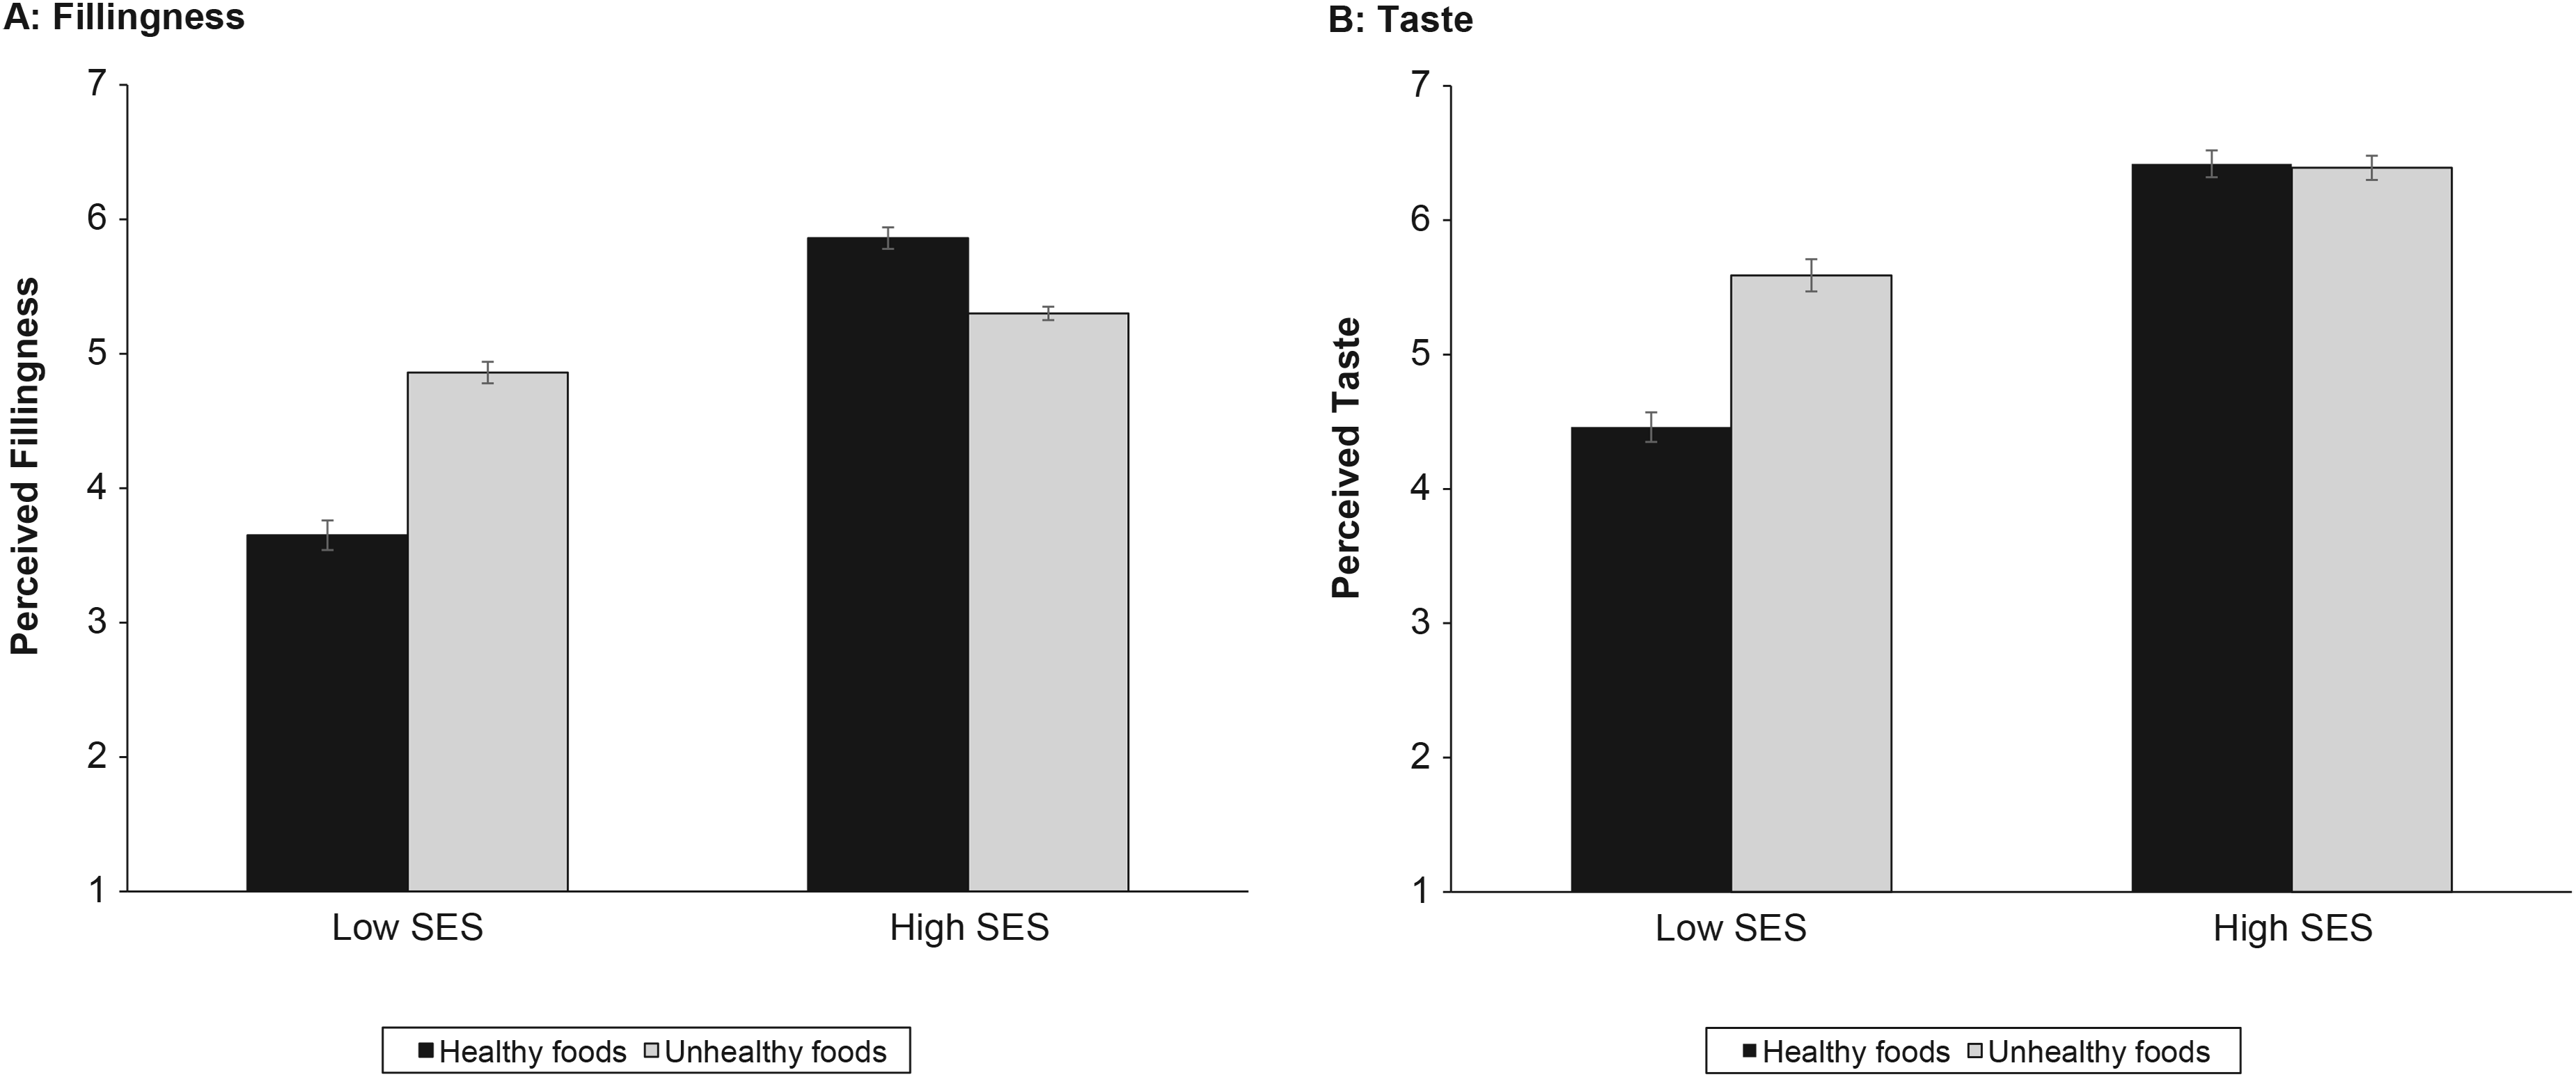
The Influence of SES and Type of Food on Perceived Fillingness and Taste (Study 5).
Strength of attribute associations: healthier = less tasty
To assess whether SES influenced the perceived strength of the expected negative association between healthiness and taste, we relied on the same model described in the previous analysis but changed the dependent variable to reflect taste rather than fillingness. The interaction was also consistent with H2 (β = −1.17, SE = .16; 95% CI = [−1.48, −.86], p < .001, r = .39; Figure 6, Panel B). While low-SES consumers perceived healthier products as significantly less tasty than unhealthy ones (MLowSES Healthy = 4.32, SD = 1.16; MLowSES Unhealthy = 5.45, SD = 1.31; β = −1.13, SE = .11; 95% CI = [−1.35, −.91], p = <.001, r = .64), high-SES consumers considered both types of food as equally tasty (MHighSES Unhealthy = 6.56, SD = .92; MHighSES Unhealthy = 6.53, SD = .95; β = .03, SE = .11; 95% CI = [−.19, .26], p = .760, r = .02).
Discussion
Study 5 provides evidence that SES systematically shapes food attribute heuristics. Low- and high-SES consumers vary in the strength with which they associate different food attributes, with low-SES consumers strongly perceiving healthy food items as particularly not filling and not tasty compared with high-SES consumers (H2).
Study 6
If low-SES consumers care deeply about fillingness and have a strong belief that healthy items are unsatiating, then, in theory, one could increase healthier choices among low-SES consumers by presenting healthy items as particularly filling. Indeed, previous research has shown that highlighting the nourishing aspects of healthy foods attenuates the healthy = not filling heuristic and leads to the choice of smaller portion sizes (Suher, Raghunathan, and Hoyer 2016). We build on this research to propose that emphasizing the fillingness of healthy foods may affect not only consumption levels within a food category but also choice among different categories (i.e., increased choice of healthy vs. unhealthy foods). In doing so, we also address the phenomenon within a segment of society in which strong, thus harder to change, heuristics are expected (i.e., low-SES consumers).
The challenge, of course, lies in the extent to which a given intervention is sufficient to convince a consumer of the fillingness associated with a healthy item and do so to the point that it will change previously established preferences. Given the multifaceted nature of food interventions and their meaningful variability in fostering healthy eating behaviors (Cadario and Chandon 2020), we tested the effectiveness of four different strategies aimed at promoting healthier food choices. As important, the developed interventions were meant to be not only theory driven but also managerially feasible.
Method
All four intervention studies were preregistered and tested how increasing the fillingness of healthy options influenced subsequent food choices. However, not all interventions shared the same design (e.g., in Intervention 1, baseline preferences were assessed in wealthy and deprived regions, whereas Intervention 4 focused on the deprived region only). For the sake of parsimony, the procedures and results reported here emphasize the comparison between intervention and control conditions within the deprived region, Favela da Maré, where the problem of unhealthy eating is prominent. Specifics about the stimuli and designs used in each study, the preregistered analyses, and the supplementary statistical details are described in Web Appendix I.
Intervention 1 (portion size)
One hundred eighty-two participants (Mage = 42.37 years, SD = 13.58; 60% female, 40% male) were asked to imagine they were deciding what to eat and had two options to choose from: an unhealthy option (breaded fried chicken, rice, beans, and fries) and a healthy option (grilled chicken with broccoli rice). Both options represent traditional Brazilian dishes offered in upscale and humble settings. The options were accompanied by images and descriptive tags, had the same price, and were sold in nearby restaurants. Importantly, while the unhealthy dish was kept constant across participants, the healthy dish varied depending on the experimental condition. In the control condition, the healthy option was described as “grilled chicken with salad” and contained one slice of grilled chicken breast with broccoli rice. Although we used the same description in the high-fillingness condition, the healthy dish contained not only the grilled chicken with rice but also a variety of other vegetables (carrots, green beans, broccoli, and potatoes). The inclusion of these vegetables was intended to increase the perceived fillingness of the healthier alternative. The image was photoshopped to preserve all features of the dish and its ingredients (e.g., dish size, color, and perceived taste). Participants indicated the dish they would choose using a four-point scale (1 = “certainly the breaded fried chicken with fries,” and 4 = “certainly the grilled chicken with broccoli rice”). Because only two participants did not choose values at the extremes of the response scale, we dichotomized the dependent variable.
Intervention 2 (description via message claim on the package)
Three hundred twenty-eight participants (Mage = 31.57 years, SD = 12.35; 55% female, 45% male) were invited to take part in a short survey and had the opportunity to choose one of two cookies, purportedly as a token of appreciation for their participation. The options were an Oreo cookie (the unhealthier option) and a Lev cookie (a whole wheat cookie with coconut and cereals; the healthier option). Although the options were kept constant across conditions, the healthy option was labeled “the healthy cookie” in the control condition and “the cookie that satisfies hunger for a long time” in the high-fillingness condition. Unbeknownst to participants, their decision served as our main dependent variable. The selected cookie was given to the participant upon choice.
Intervention 3 (description via advertisement)
Three hundred one participants (Mage = 31.88 years, SD = 11.69; 51% female, 49% male) were exposed to a purported food advertisement and informed they would enter a lottery to potentially receive the selected item. In the control condition, participants read a traditional advertisement depicting a healthy cookie simply as healthy: “Why not try Lev? The real healthy cookie!” Conversely, participants in the high-fillingness condition were exposed to an advertisement that highlighted the degree of healthiness of healthy foods and their fillingness. The ad did so by prompting favorable comparisons between healthy and unhealthy foods (e.g., “What is more filling: a popsicle or a fruit salad?”) and encouraging participants to try the filling and healthy option: “Why not try Lev? The healthy cookie that fills the stomach for real!” Participants then rated the ad and were offered the chance to choose one of two cookies: a healthy (Lev) or an unhealthy one (a sandwich cookie called Trakinas). Participants entered a lottery to receive a voucher for the selected item. Their decision served as our main dependent variable.
Intervention 4 (food swap)
Two hundred fifty-two participants (Mage = 34.75 years, SD = 14.56; 44% female, 56% male) were invited to take part in a short survey and had the opportunity to choose between two unhealthy cookies. They were informed they would enter a lottery to potentially receive the selected item. Then, participants were offered, in a face-to-face setting, the chance to swap their selected item for a healthier alternative (Lev cookie). Participants in the control condition were exposed to a food swap depicting the healthy cookie simply as healthy: “The healthy swap! Why not swap [Fandangos/Trakinas] for the Lev cookie, your healthy option?” Conversely, the high-fillingness condition depicts the healthy cookie as healthy and filling: “The healthy swap that fills your stomach! With less fat and more nutrients, why not swap Fandangos/Trakinas for the Lev cookie, your healthy option that fills your stomach for real?” Participants then indicated whether they would like to swap their chosen product (one of the two unhealthy options) for the Lev cookie (the healthy option). Participants entered a lottery to receive a voucher for the selected item. The main dependent variable is whether they keep their original (unhealthy) choice or swap for the healthier option.
Thus, our analysis is based on four different interventions (N = 1,063). These interventions represent different types of approaches used in previous research seeking to promote healthier diets among the population at large. rather than among only low-SES consumers. Building on Cadario and Chandon's (2020) typology, Intervention 1 relies on a behaviorally oriented strategy (portion size enhancements), Interventions 2 and 3 use a cognitively oriented nudge (descriptive claims and labeling), and Intervention 4 bundles together cognitive and affective nudges (descriptive labeling and healthy eating calls). Although the interventions are not perfectly comparable, the current approach helps us identify the nuances in the effectiveness of the different strategies.
Results
To assess the effectiveness of the high-fillingness interventions, we conducted a series of logistic regressions including experimental condition as an independent variable (1 = high fillingness, 0 = control) and food choice (1 = choice of healthy food, 0 = choice of unhealthy food) as the dependent variable. We also conducted a one-tailed Bayes factor (BF10) analysis to evaluate the evidence for our intervention results.
The results are described in Figure 7. Relative to its respective control condition, the portion size intervention (Intervention 1) proved to be effective in promoting healthy eating among low-SES consumers (β = 3.36, SE = 1.03; 95% CI = [1.33, 5.38], p < .001, OR = 28.69, BF10 = 1,942.75). The description via message claim on the package intervention (Intervention 2) was marginally significant (β = .43, SE = .26; 95% CI = [−.07, .94], p = .091, OR = 1.54, BF10 = .97), pushing low-SES consumers into healthier dietary choices. Finally, neither the description via advertisement intervention (Intervention 3, β = .06, SE = .36; 95% CI = [−.65, .76], p = .874, OR = 1.06, BF10 = .14) nor the food swap intervention (Intervention 4, β = .01, SE = .27; 95% CI = [−.52, .54], p = .972, OR = 1.01, BF10 = .14) reached significance. The Bayes factor analysis highlights that the portion size intervention (Intervention 1) had a substantial effect, as indicated by a high BF₁₀ value. The description via message claims and advertisement showed either an inconclusive result with a BF₁₀ value close to 1 (Intervention 2) or strong evidence for the null hypothesis (Intervention 3). Finally, the food swap intervention (Intervention 4) had low BF₁₀ values, suggesting strong evidence for the null hypothesis.
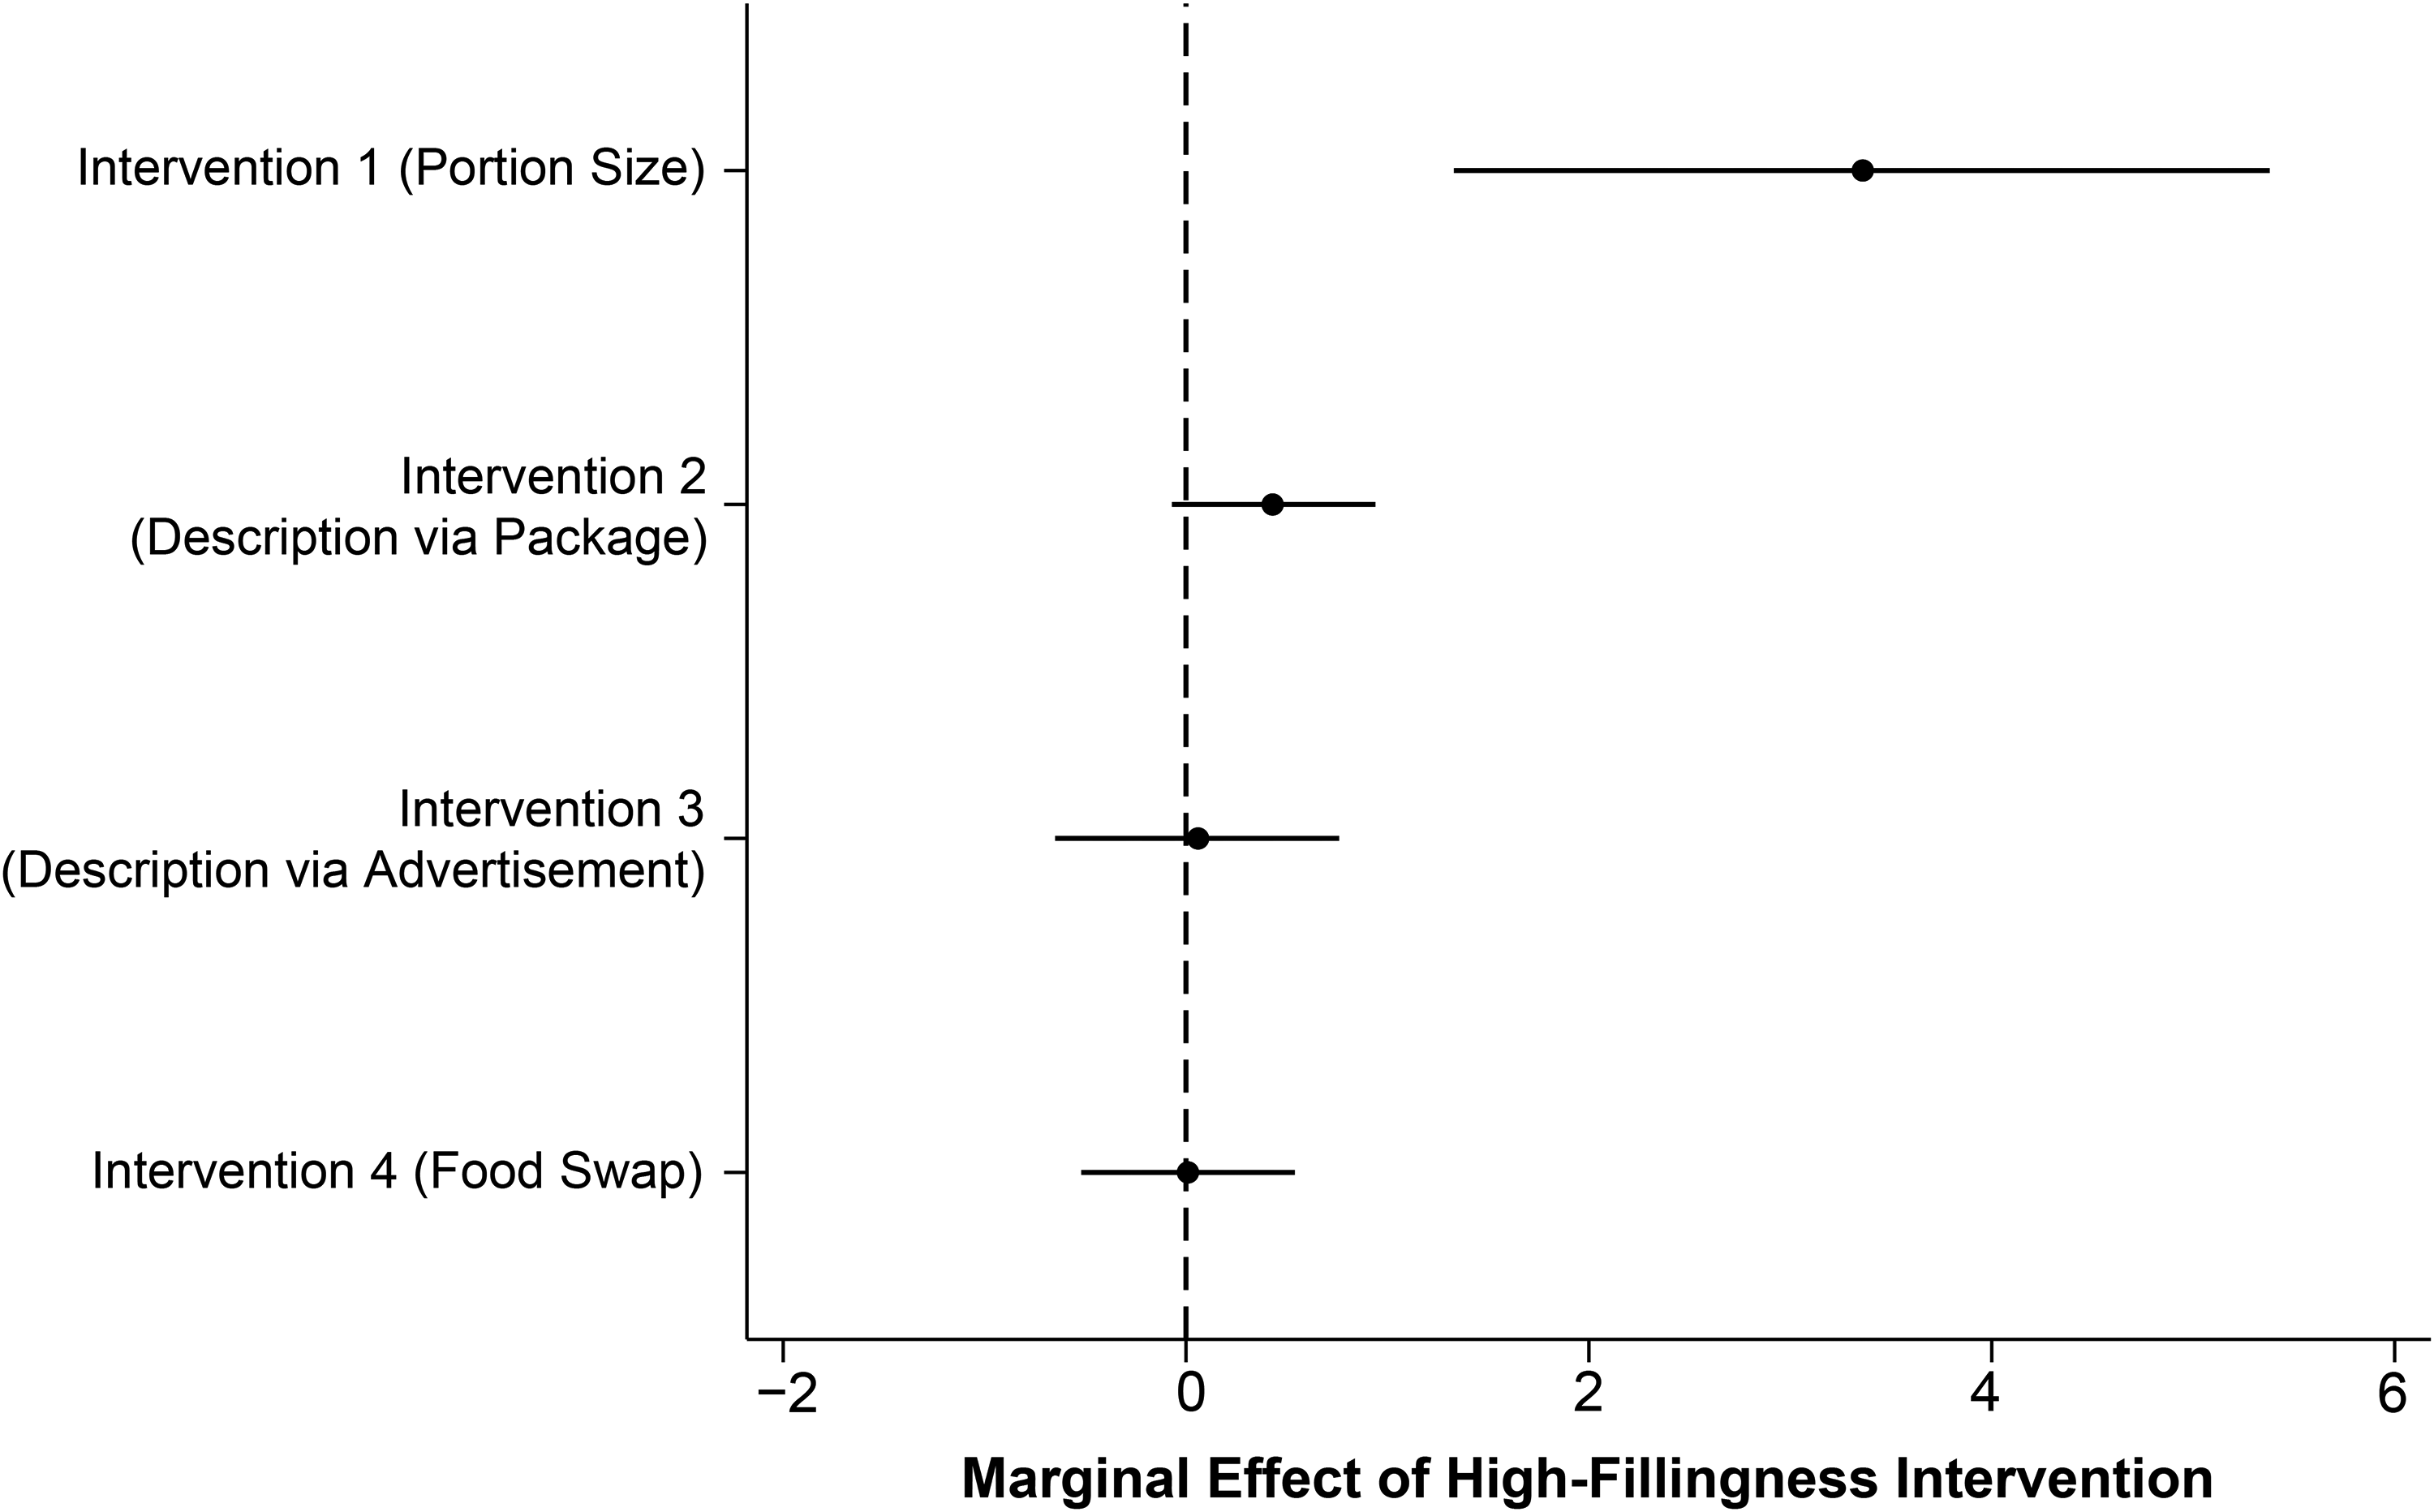
Effectiveness of High-Fillingness Interventions Among Low-SES Consumers (Study 6).
Discussion
Study 6 shows that the effectiveness of fillingness-focused interventions varies depending on the specific strategy used. In line with findings from Cadario and Chandon (2020), behaviorally oriented interventions in the form of portion size enhancements are particularly promising (Intervention 1). None of the other interventions seemed particularly promising, as reflected in the Bayes factor analysis.
General Discussion
Why do low-SES individuals have unhealthier diets than high-SES individuals? This question has puzzled scholars from several disciplines over the past decades. Explanations for such disparities in healthy eating have generally been attributed to supply-side factors, such as price and availability. Joining a fast-growing body of work, the current research reveals that differences in food preferences and perceptions may also contribute to this gap. Across eight preregistered studies conducted in a highly unequal environment, we show that high- and low-SES consumers (1) vary in food preference over and above supply-side considerations, (2) give different weights to critical food attributes (fillingness, healthiness, and taste) and (3) perceive the association among these attributes differently. Specifically, in Study 1, we show that lower-SES consumers choose unhealthier foods when compared with higher-SES peers, even in a context where price, availability, and convenience are accounted for by design. In Studies 2a and 2b, we provide initial evidence that the weight given to fillingness and its psychological benefits, over and above financial considerations, help distinguish the haves from have-nots. Further supporting these results, Studies 3a, 3b, and 4 find that low-SES consumers give greater importance to fillingness, less importance to healthiness, and equally high importance to taste in food decision-making (H1), revealing different priorities when deciding what to eat. Study 5 shows that, relative to high-SES consumers, low-SES consumers are more inclined to believe that healthy foods are less filling and less tasty than unhealthy foods (H2)—two associations that discourage healthy eating among low-SES consumers. Our final study tests a variety of interventions and shows that, albeit challenging, it is possible to increase healthy food choices among low-SES consumers by enhancing the perceived fillingness of the healthy options available.
Theoretical Contributions
Although emerging research has uncovered the important and often overlooked role of demand in guiding SES differences in dietary choices (Allcott et al. 2019; Bratanova et al. 2016; Cheon and Hong 2017; Laran and Salerno 2013; Thomas, Ma, and Gauri 2024), no study to date has systematically assessed how exactly poverty helps shape food preferences and perceptions. Our results provide evidence that poverty influences not only the relative importance of specific food attributes but also the perceived strength of the associations between these attributes. By showing that relative to high-SES consumers, low-SES consumers care more about fillingness (but not taste) than healthiness and are particularly prone to believe that healthy items are neither filling nor tasty, our findings help explain why low-SES consumers display unhealthier diets than high-SES consumers. In addition, we contribute to the literature on food heuristics. While previous research shows that consumers rely on food heuristics when deciding what to eat (Raghunathan, Naylor, and Hoyer 2006; Suher, Raghunathan, and Hoyer 2016), we demonstrate that negative attribute associations involving healthy foods (e.g., healthy = not filling) are not homogeneous across consumer segments. Relative to high-SES consumers, low-SES consumers tend to believe that healthy items are neither tasty nor satiating. Lastly, we address recent appeals for (1) further research on the psychology of low-SES consumers (Carey and Markus 2016; Pham 2016; Shavitt, Jiang, and Cho 2016), (2) deeper examination of the food insecurity agenda (Food and Agriculture Organization of the United Nations et al. 2020), and (3) investigation of food decisions in more naturalistic contexts (Haws et al. 2022). Although food insecurity affects about 25% of the world's population (Food and Agriculture Organization of the United Nations et al. 2020), research on the food decisions of high- and low-SES consumers has not yet systematically examined this group. Most of the research in the area investigates how induced states of scarcity or subordinate rank (Bratanova et al. 2016; Cheon and Hong 2017; Laran and Salerno 2013) influence decision-making. We instead investigate how chronic and extreme experiences with scarcity and abundance help shape food-related decisions.
Societal and Marketing Implications
Our findings show that even in environments where opportunities and resources are similar, low-SES individuals still prefer unhealthier food options than high-SES individuals. This is consistent with recent studies showing that the influence of food cost and availability on nutritional inequality may have been overstated (Cummins, Flint, and Matthews 2014; Handbury, Rahkovsky, and Schnell 2016; Pechey and Monsivais 2016) and that much of the variance across the socioeconomic spectrum seems to result from differences in preferences for (un)healthier foods (Allcott et al. 2019). Policy makers, however, have primarily focused on aspects related to the supply of healthy foods (Bitler and Haider 2010; Handbury, Rahkovsky, and Schnell 2016). For instance, in the United States between 2010 and 2019, policies such as the Healthy Food Financing Initiative, which provides resources to improve access to and affordability of healthy foods in underserved communities, have leveraged more than $1 billion (Allcott et al. 2019). Likewise, the Biden–Harris Administration’s national strategy on hunger, nutrition, and health (White House 2022) disproportionally focused on promoting access to and affordability of healthy foods. More broadly, the Food and Agriculture Organization of the United Nations et al. (2023) suggests restricting the marketing of unhealthy foods and beverages and enforcing health taxes. Thus, while most policy interventions are tailored to make healthy foods cheaper and conveniently available to low-SES consumers, which are important and valuable goals, our findings suggest that combining supply and demand forces is critical. Specifically, even though making healthy foods more accessible and affordable or restricting access to unhealthy foods may influence the dietary behaviors of low-SES consumers, increasing the availability of healthy items that are convincingly filling may be an equally promising avenue for promoting healthier diets. Along these lines, one key policy implemented by Brazil’s national government is the creation of a food basket that contains healthy, affordable, and nutritious food staples that are especially filling (e.g., rice and beans). Recently, taxes for these products were reduced to 0% to encourage their consumption among lower-income consumers. While this strategy resonates with the findings from our studies, governments and marketers could also explicitly highlight the fillingness of the healthy items in this basket.
The food industry has long used fillingness in its communication strategies. This approach, however, has been primarily implemented to promote unhealthy items. For instance, Burger King has used strategies such as “Aren’t you hungry?,” “Hungry yet?,” and “Are you hungry or starving? Starving!!” to advertise its hamburgers. Likewise, the frozen food brand Hungry Man often advertises its fried chicken as “Filling, no bones about it,” and mentions that “Hunger, this town ain’t big enough for the two of us.” Snickers chocolates are often marketed via statements such as “You’re not you when you’re hungry! Snickers satisfies,” and questions such as “How whiny does hunger make you?” Based on our findings, however, marketers could also rely on similar communication strategies to advertise healthy foods.
Study 6 tested a set of exclusively demand-side interventions. This study shows that although it is possible to increase the choice of healthier foods among low-SES consumers if these options are perceived as filling, food preferences are difficult to shift, and interventions vary in effectiveness. These results dovetail with recent meta-analytic findings on the success of different nudges in promoting healthier diets. In line with Cadario and Chandon (2020), we found that behaviorally oriented nudges such as portion size enhancements are particularly effective in inducing healthy eating. Cognitively oriented strategies in the form of descriptive labels offered mixed findings, with results pointing to either a small positive or a null effect. Finally, increasingly used by marketers and policy makers (IGD 2023), the food swap intervention did not lead to significant differences between the control and high-fillingness conditions. However, it is worth noting that across conditions, a nontrivial percentage (31%) of our participants swapped their initial choice for a healthier version. We suspect that the social pressure due to the face-to-face setting of our studies likely washed away possible intrinsic differences in attribute weights. Consistent with this rationale is the finding that when effective in e-commerce or self-checkouts, food swaps tend to have relatively small effects and are often limited to a few product categories (IGD 2023; Koutoukidis et al. 2019; Schruff-Lim et al. 2024).
In testing the portion size enhancement intervention, we show that while healthy foods are not seen as particularly tasty or filling per se, introducing vegetables to a dish can increase its overall perceived fillingness and, as a result, push low-SES consumers to healthier diets. This intervention has theoretical and practical implications. Whereas previous studies examining portion size nudges focus on how increasing plate or serving size affects energy intake (Diliberti et al. 2004; DiSantis et al. 2013; Van Ittersum and Wansink 2012), the current study shows that adding healthy items to a dish that was already perceived as healthy can shift cross-class food preferences. In other words, portion size interventions can increase the willingness to consume healthy over unhealthy foods rather than simply their consumption within a given category. While one could argue that our intervention simply encouraged low-SES participants to choose the healthy option based on its value for money, Study 2b shows that the feeling of satiety is as important as financial considerations among low-SES consumers, and as such, high-fillingness interventions are likely to add value over and above price considerations. Another important aspect concerning this type of intervention refers to its actionability. Indeed, unlike sheer framing interventions, increasing portion size involves enhancing costs for marketers. To address potential cost barriers, marketers could search for high-margin products that are filling and healthy (such as the basic food basket in Brazil outlined previously), and, most critically, governments could subsidize (or reduce the tax of) nutritious and satiable foods.
Limitations and Future Research
The results of this work can help develop several other food-related research inquiries. While our investigation is focused on the demand side of dietary choices, it is also possible that other factors driven by supply-side barriers help shape demand for food items. For example, the lack of familiarity and previous experiences with healthy foods among low-SES consumers might be initially driven by their higher prices or lack of availability in low-SES neighborhoods. But as unfamiliarity leads to greater reliance on heuristics (Haws, Reczek, and Sample 2017), we reason and find that it also helps shape food preferences (i.e., the demand). Thus, future research might investigate how this cycle of external barriers, internal preferences, and food choices unfolds in a longitudinal study.
Further, the effectiveness of our interventions proved to be widely dependent on the strategy used. Although the portion enhancement study seemed particularly promising, one could also raise a few potential alternative explanations. For example, since the high-fillingness healthy option also included more ingredients, variety seeking could explain our results. However, because healthy foods are not perceived as palatable by low-SES consumers, it is unlikely that the inclusion of healthy items in a dish influences their decisions via the increased variety of not-as-palatable ingredients rather than the fillingness increment that such inclusion provides. Further, one could also argue that our results are a sheer consequence of the fact that, after the inclusion of more ingredients, the dish offers a more attractive value for money. While reasonable, the results from Study 2b show that fillingness is relevant to low-SES consumers not only due to financial considerations but also—and to the same extent—because these consumers value the feeling of satiety. Notwithstanding these caveats, we encourage future research to devise and test new interventions to promote healthier diets. Following Cadario and Chandon (2020) meta-analytical results, future research could focus on promising strategies and test other behaviorally oriented interventions.
Along these lines, despite favoring taste similarly, low-SES individuals are predicted to hold particularly negative perceptions about the taste of healthy items relative to high-SES individuals. Thus, we should expect low-SES consumers to increase their choices of healthy foods when these items are also perceived as tasty. In other words, successfully increasing the perceived palatability of a healthy food item should increase its attractiveness among low-SES consumers. Although previous studies have shown that labeling healthy food items with taste-focused messages not only increases their consumption (Turnwald et al. 2019; Turnwald and Crum 2019) but also enhances expectations of taste experience (Turnwald et al. 2019), this corollary hypothesis has not yet been tested within the SES context. If supported, taste-focused labeling on healthy food options could also help policy makers design interventions to reduce nutritional inequality.
In summary, although often neglected in relevant food policies, the role of SES differences in food preference and perceptions of nutritional inequality cannot be understated. As the current research shows, intrinsic preferences for fillingness and perceptions about healthy foods among low-SES consumers are consequential to food choice and, potentially, to a plethora of health outcomes (Darmon and Drewnowski 2015). As such, learning more about how SES-based differences in preferences and perceptions shape decision-making may help researchers more deeply understand the phenomenon and policy makers develop more effective interventions that will ultimately reduce pervasive nutritional inequality.
Supplemental Material
sj-pdf-1-jmx-10.1177_00222429241296048 - Supplemental material for How Socioeconomic Status Shapes Food Preferences and Perceptions
Supplemental material, sj-pdf-1-jmx-10.1177_00222429241296048 for How Socioeconomic Status Shapes Food Preferences and Perceptions by Bernardo Andretti, Yan Vieites, Larissa Elmor and Eduardo B. Andrade in Journal of Marketing
Footnotes
Acknowledgments
The authors thank the JM review team for their insightful and constructive feedback throughout the review process. The authors also thank research assistants responsible for lab-in-the-field data collection for the Center of Behavioral Research (CBR): Cristielle Rodrigues, Alice Bandeira, Thamires Maria, and Daiane Marcolino.
Coeditor
Vanitha Swaminathan
Associate Editor
Christoph Fuchs
Author Contributions
BA, YV, and EBA contributed to the research conceptualization. BA and LE led the systematic literature review. All authors drafted the initial manuscript. All authors designed the methodology, and BA and LE conducted the data analysis. BA, YV and EBA collaborated on writing and revising the manuscript. All authors approved the final version, and are responsible for the integrity of the research. BA and YV contributed equally to this work.
Author Note
This article is based on the first author’s doctoral dissertation.
Declaration of Conflicting Interests
The authors declared no potential conflicts of interest with respect to the research, authorship, and/or publication of this article.
Funding
The authors received no financial support for the research, authorship, and/or publication of this article.
Notes
References
Supplementary Material
Please find the following supplemental material available below.
For Open Access articles published under a Creative Commons License, all supplemental material carries the same license as the article it is associated with.
For non-Open Access articles published, all supplemental material carries a non-exclusive license, and permission requests for re-use of supplemental material or any part of supplemental material shall be sent directly to the copyright owner as specified in the copyright notice associated with the article.