
Abstract
Marketing scholars have extensively studied marketing's effect on firm value and have developed metrics and dashboards to help establish marketing accountability. However, empirical evidence of marketing accountability's specific outcomes is scarce and mainly derived from surveys. It also lacks consideration of outcomes beyond the marketing function's standing in the firm, thus overlooking possible downsides and outcomes with regard to external stakeholders such as investors. Using a natural experiment—Australia's change from a nonrestrictive to a restrictive accounting regime—this study investigates how accountability for the financial value of marketing assets (marketing asset accountability) affects a firm's marketing management focus on short-term vis-à-vis long-term marketing efficiency, its cost of capital, and the degree to which its stock price reflects actual future performance (i.e., stock price informativeness). The results show that marketing asset accountability improves long-term marketing efficiency, reduces cost of equity, and improves stock price informativeness, but does not consistently affect short-term marketing efficiency and cost of debt. Moreover, although marketing-intensive firms are commonly assumed to benefit most from marketing asset accountability, this is not the case. These results have implications for researchers, managers, and public policy decision makers.
Keywords
Marketing's credibility, standing, funding, and proper management in firms is at risk if it cannot be held accountable (Bendle and Wang 2017; Edeling, Srinivasan, and Hanssens 2021; Gaski 2021; Mizik and Nissim 2011; Rust et al. 2004; Verhoef and Leeflang 2009). Marketing accountability requires measurement, reporting, and justification of marketing's contribution to firm value creation, all of which can then be scrutinized by stakeholders. To help establish marketing accountability, marketing metrics dashboards and performance assessment processes have been proposed, and marketing actions, strategies, and assets have been linked to firm value (e.g., Edeling, Srinivasan, and Hanssens 2021; Farris et al. 2010; Morgan et al. 2022; Pauwels 2014; Srinivasan and Hanssens 2009).
Financial accountability for marketing assets (MAs), such as brands and customer relationships, through regular and systematic financial reports (MA accountability) has been suggested as an especially effective way to demonstrate marketing accountability (Bendle and Wang 2017). However, the actual consequences of MA accountability are unclear (Morgan et al. 2022). The few empirical studies that exist in the marketing literature have not considered marketing accountability based on the systematic financial reporting of MAs (Verhoef and Leeflang 2009). Moreover, the focus has been on internal outcomes such as marketing's influence within the firm. Outcomes that involve external stakeholders, especially investors, have yet to be examined. Investors play a key role in holding managers accountable, and the information regularly reported to them by means of financial reports is central to how firm performance is evaluated both within and outside firms (Bendle and Wang 2017; Mizik and Nissim 2011). For example, it is well known that financial statements record marketing spending as a current-period, short-term expense while the spending's longer-term economic value—the financial value of MAs—remains largely unrecorded (Sinclair 2016; Sinclair and Keller 2014, 2017). MA accountability therefore can be expected to help promote good MA governance in firms, as well as support investors’ evaluation and appreciation of lagged marketing returns from MAs.
Similar to the potential benefits of MA accountability, possible downsides are not well understood. In particular, reporting MA valuations is not without issue, as the valuations may not be fully reliable. Valuing MAs involves predictions of future financial outcomes, and such predictions can be subjective and imprecise. Externally reporting unreliable and, thus, uncertain asset values can be less useful and may actually obscure marketing accountability (Lambert 1998; Maines et al. 2003; Mizik and Nissim 2011).
Moreover, a firm's marketing intensity is a plausible, major factor that determines the outcomes of MA accountability. However, current assumptions about marketing intensity's specific role may be inaccurate. For example, discussions in the marketing literature suggest that MA accountability is particularly relevant for marketing-intensive firms because those firms tend to own substantial MAs (e.g., Sinclair and Keller 2017; Wiesel, Skiera, and Villanueva 2008). Yet, a larger-sized asset exacerbates concerns about valuation reliability, which could make MA accountability less convincing and effective. MAs that are more prominent are also more enticing for analysts and the media to discuss and evaluate, reducing the need for, and thus influence of, a firm's own MA accountability.
The purpose of this study is to shed light on the outcomes of MA accountability as well as on the contingency role of a firm's marketing intensity. To this end, we draw on a unique context present in Australia surrounding the introduction of International Financial Reporting Standards (IFRS). Whereas IFRS rules largely restrict the reporting of MA valuations, pre-IFRS accounting rules in Australia allowed a relatively unrestricted recording of such valuations on a firm's balance sheet. These valuations were based on the expected future cash flows from MAs (discounted cash flow approach) and hence represent MAs’ net present value. We define MA accountability as the continuous financial valuation and reporting of a firm's MAs to financial markets. Our research context enables us to study the effects of different MA accountability levels before and after the accounting rule change.
Regarding potential benefits of MA accountability, we examine the extent to which the reporting of MA valuations in external reports counteracts a short-term focus on the measurement of marketing performance, preventing management from emphasizing marketing's short-term efficiency over its long-term efficiency. Short-term efficiency is reflected in the direct top-line effects of marketing expenditure. Yet firms also strategically invest in the long term to enhance the value of their MAs through the development of targeted marketing programs. Against this backdrop, long-term efficiency is the value a firm adds to MAs through its marketing investments. MA accountability toward investors should improve the quality of managerial decision making involving marketing investments and reduce myopic marketing management (Mizik 2010). Moreover, transparency of the financial value of a firm's MAs can reduce investor risk and provide reassurance regarding proper MA management, all of which should improve a firm's cost of capital.
To shed light on the question of whether MA accountability is useful for investors to more accurately predict firms’ future earnings, or instead diminishes the accuracy owing to a lack of reliability, we investigate reporting firms’ stock price informativeness, which is the degree to which the stock price accurately reflects future performance (Durnev et al. 2003; Gelb and Zarowin 2002). 1 While it is difficult to identify the usefulness of financial information directly, it manifests itself indirectly in a firm's stock price informativeness, which indicates the extent to which market expectations match the firm's eventual financial performance. Finally, we examine the contingency role of a firm's marketing intensity (i.e., whether or not it is a major marketing spender) for the studied MA accountability outcomes.
We assessed the outcomes of MA accountability using a natural experiment in conjunction with a difference-in-differences (DID) approach and propensity score matching (PSM). The DID approach is popular in the accounting and finance literature and is becoming a preferred approach in the marketing literature due to its ability to estimate causal relationships, although its uptake is slowed by high data demands requiring relatively unique contexts (Edeling, Srinivasan, and Hanssens 2021). As noted, the context for our natural experiment is Australia's accounting change to IFRS, which effectively reduced MA accountability for certain firms. Data were predominantly hand-collected for the 500 largest firms listed on the Australian Stock Exchange (ASX) and cover a ten-year period from 2001 to 2010, with the accounting regime change coming into effect in 2006. Since the Australian accounting rules before the change had neither explicitly prohibited nor mandated firms’ reporting of MA valuations on the balance sheet, some firms recorded these assets comprehensively while others did not, providing us with a control group of firms. We used PSM to evaluate the effects of MA accountability based on a comparison with control firms that are similar to a focal firm.
In the following, we discuss MA accountability and its implications, followed by a set of hypotheses concerning the firm-internal and firm-external effects foreshadowed previously. Then we explain our methodology, data, and empirical results. We conclude with a discussion of theory and practice implications, research limitations, and future research directions.
Background and Hypotheses
Marketing Asset Accountability
MA accountability is the continuous valuation of a firm's MAs based on the expected future cash flows from those assets, and the reporting of the valuations to financial markets. MAs are the result of investments in, for example, advertising, sales channels, and physical capital including production facilities or servicescapes (e.g., Fischer 2016; Guenther and Guenther 2021). By means of these investments, a firm builds intellectual assets such as product-related knowledge and relational assets with external entities, namely customers and other important stakeholders such as channel partners (Srivastava, Shervani, and Fahey 1998). Typical MAs are brands (e.g., Mizik 2014), customer relationships (e.g., Kumar 2018), marketing licenses (e.g., Robinson, Tuli, and Kohli 2014), and channel relationships (e.g., Homburg, Vollmayr, and Hahn 2014). To derive the consequences of MA accountability, fundamental considerations need to be taken into account. We next discuss these considerations before presenting our conceptual framework.
Marketing asset accountability drives managerial attention
Firms’ top management is more likely to look after assets for which it is accountable, particularly if this accountability is toward external stakeholders. It is therefore not surprising that reporting systems in firms typically correspond with external reporting requirements (e.g., Gunther and Kreigbaum-Kling 2001; Weißenberger and Angelkort 2011). External reporting is, hence, a key driver of what is measured and managed in firms. Since MA valuations are currently not formally reported in firms’ financial statements due to restrictions under major accounting standards (Sinclair 2016; Sinclair and Keller 2014, 2017), 2 financial MA values tend to be underrepresented in firms’ internal reporting systems, especially in terms of their long-term value, which requires dedicated measurement (Bendle and Wang 2017). Instead, the marketing budget and expenses as well as short-term financial outcomes (e.g., revenues and profits) tend to dominate in internal reporting systems that inform top managers’ decision making and how they hold the marketing function accountable (Bendle and Wang 2017; Mintz et al. 2019).
Some managers are aware of the issue, especially those responsible for firms’ intellectual property (IP) such as brands and trademarks. For example, Zeeger Vink, president of the International Trademark Association, noted in an interview (Vink 2022): We early realized that there is a really big obstacle for good financial IP reporting and that is that current accounting standards, in many cases, don’t allow companies to give a value to their intangible assets. … We think that is something that really harms creating the insight that we want to have. If intangible assets, if intellectual property, does not have a recorded value, senior management will never look at it. They will neglect the case; they will not be so interested in it.
Marketing asset valuations are relevant for investors
Usually, MAs are valuable assets because they can help create a competitive advantage and improve future financial performance (e.g., Edeling, Srinivasan, and Hanssens 2021). Therefore, an account of the financial value of a firm's MAs is likely to provide information to investors that is relevant to assess the firm's performance (e.g., Bendle and Wang 2017). To draw a comparison, consider that publicly listed firms are required to provide updates about their income and certain assets (e.g., equipment) multiple times per year because capital providers need this information to evaluate their investments in firms. Considering the relative importance of MAs for many firms’ shareholder wealth creation, accountability for them is likely to be even more relevant for this evaluation.
This view is also reflected in a letter to the International Accounting Standards Board (IASB), which had invited comments about a potential formal recording of intangible assets, including MAs, in 2014 and 2021 (IFRS 2015, 2022a): The information derived [from fair value measurements of intangible assets] is relevant in that it can affirm a market participant's view on the reasonableness of the price paid for a business, or change a previous view …. We consider that the identification of intangibles … provides users with critical information on the underlying fundamental drivers of value in businesses that a management team is choosing to invest in. (Simon Jones, N. Santosh, and Fernando Ramirez de Verger, directors at American Appraisal; IFRS 2015)
The reliability of marketing asset valuations is a concern
MAs’ financial values need to be estimated, which requires assumptions, including about the level, timing, and risk of expected cash flows (e.g., Fischer 2007; Gupta et al. 2006; Kumar and George 2007). Consequently, MA valuations can be uncertain and subjective (Mizik and Nissim 2011). External reporting of such values harbors the risk that investors are misguided and harmed because the expected future benefits embodied in the valuations may not materialize as indicated.
Practitioners confirm that financial MA values can be unreliable, which means that MA accountability could be misleading despite best intentions. For example, a report by KPMG (2014) highlights several common inadvertent behavioral biases—including anchoring, confirmation bias, overconfidence, aversion to loss, excessive optimism, extrapolation bias, and groupthink—that can cause the inaccurate valuation of intangible assets such as MAs. Commentators noted: For most internally generated intangibles both cost and fair value are very difficult to determine. Also, the fair value of many purchased and internally generated intangibles can change rapidly and fluctuate from one reporting period to the next. (Sarah Dunn, senior manager of corporate reporting at ICAEW [Institute of Chartered Accountants in England and Wales]; IFRS 2022a) It is impossible for management to have an unbiased view. (Andrew Cuffe, former head of equity research at JP Morgan; KPMG 2014)
Marketing-intensive firms
Discussions in the literature indicate that MA accountability could have particularly strong effects on firms with high marketing spending and major MAs (Sinclair and Keller 2017; Wiesel, Skiera, and Villanueva 2008). However, the considerations discussed previously largely suggest the opposite. On the one hand, marketing intensity should naturally promote managerial asset attention and better firm-internal measurement since a marketing-intensive firm's strategy relies on the strength of its MAs. Moreover, additional information provided by external parties such as valuation firms (e.g., Interbrand)—which is more likely for high marketing spenders with major assets—increases the amount of relevant MA information available to investors. On the other hand, marketing intensity exacerbates reliability concerns about the measurement of MA values as these values are also larger and, therefore, their accurate measurement is of greater consequence. We thus propose that the extent to which the discussed considerations apply depends on whether a firm is marketing intensive.
Based on the preceding discussion, Figure 1 summarizes MA accountability's predicted specific consequences for a firm in terms of its management focus on short-term vis-à-vis long-term marketing efficiency, cost of capital, and stock price informativeness. Firm-internally, the required measurement of MAs should lead to greater managerial attention on long-term marketing outcomes. Firm-externally, MA accountability should affect how investors assess their risk and derive accurate predictions about a firm's future performance. Whether a firm is marketing intensive acts as a contingency factor on these effects. Next, we turn to our hypotheses.

Conceptual Model: Consequences of Marketing Asset Accountability.
Impact on Short-Term and Long-Term Marketing Efficiency
Marketing performance can be assessed on the basis of the extent to which marketing investments drive firms’ financial performance. In this regard, marketing efficiency is concerned with the return on marketing investment (Hanssens and Pauwels 2016). Importantly, marketing efficiency can be assessed using indicators of short-term and long-term business performance (e.g., revenue and shareholder value) (Rust et al. 2004). However, achievement of short- and long-term marketing efficiency can be competing goals, since a focus on short-term results can cause a certain neglect of long-term outcomes, and vice versa (Mizik 2010; Mizik and Jacobson 2007).
General impact
Whether firms are accountable for their MAs is likely to affect the degree to which management balances short- and long-term marketing efficiency goals for two main reasons. The first is related to what managers are effectively being held accountable for. MA reporting documents the lagged financial benefits of marketing spending manifested in MAs’ value. In contrast, with no such reporting, managers tend to be held accountable mainly for the short-term profitability effects of current-period marketing expenditure (Mizik 2010). Management then meets these demands by optimizing short-term marketing efficiency.
The second reason is related to information availability. Considering that external financial reporting shapes internal reporting systems (e.g., Gunther and Kreigbaum-Kling 2001; Weißenberger and Angelkort 2011), the measurement of marketing's firm value contribution (i.e., its longer-term efficiency) tends to be underdeveloped in firms due to current accounting rules (Bendle and Wang 2017). However, proper management requires proper measurement. A systematic and continuous MA valuation promotes a detailed managerial understanding of cash flow drivers related to MAs. This understanding can improve decision making related to the selection of strategic opportunities that have the greatest potential to improve MA value and, in turn, enhance long-term marketing efficiency (Rust, Lemon, and Zeithaml 2004).
In summary, we expect that MA accountability supports a more value-oriented management of marketing performance by lessening the focus on short-term efficiency goals that can arise in the absence of information about lagged marketing returns. Further, it necessitates the systematic measurement of marketing's firm value contribution, thereby improving the quality of strategic investment decisions and, therefore, long-term efficiency.
Marketing-intensive firms
Because marketing-intensive firms have substantial marketing spending, MA accountability could be expected to especially enhance these firms’ managerial focus on long-term marketing efficiency and reduce the focus on short-term efficiency goals. However, contrary to this expectation, the substantial spending position in itself and the centrality of MAs to firm strategy can lead to greater managerial attention and heightened demand for the creation of long-term value in these firms, irrespective of MA accountability toward external stakeholders.
Specifically, substantial marketing spending—especially if it is a firm's largest expense or among the largest expenses—is known to draw top management's attention to the marketing function, holding it accountable for the performance impact of the spending (Sheth, Sisodia, and Sharma 2000). Importantly, because marketing is core to marketing-intensive firms’ strategy, these firms typically use relatively sophisticated measurement systems (Pauwels et al. 2009), which reflect marketers’ understanding that some benefits of marketing spending may materialize in the short term whereas others take time to do so (Moorman and Rust 1999; Rust et al. 2004). An example is the Coca-Cola company's internal reporting system, which tracks both short-term marketing efficiency and long-term brand equity value (WARC 2022). Such systems are common in marketing-intensive firms and prevent internal reporting from being dominated by cost considerations and an overemphasis on short-term outcomes at the cost of the long-term health of MAs (Bendle and Wang 2017; Morgan et al. 2022). Thus:
Impact on Cost of Capital
Firms require external capital to fund their operations, including marketing activity. Firms’ cost of capital is investors’ charge for the funds they have provided (Grinblatt and Titman 2002). The cost of capital is consequential. It is the minimum return that investors expect on their capital, given the information available about a firm. A higher cost of capital constrains business activity since it reduces the set of projects and opportunities that firms can realize to only those with a return above the cost of capital (Himme and Fischer 2014). For the marketing function, specifically, a higher cost of capital can lead to underinvestment in MAs (Lev 2004; Srinivasan and Hanssens 2009).
General impact
MA valuations provide relevant information and thereby can decrease firms’ cost of capital due to two main dynamics. The first is related to direct uncertainty reduction effects. Specifically, the higher the uncertainty about a firm, the more investors charge for the allocated capital (i.e., the higher the expected return) to compensate for the associated risk. Investor uncertainty is already created if a firm does not specifically report its marketing investments (Moon, Tuli, and Mukherjee 2023). Then, even if a firm reports its marketing investments, investors are not necessarily marketing experts, creating more uncertainty around the effect of the investments on the firm's future cash flows (Srinivasan and Hanssens 2009). Reporting MA valuations effectively alleviates this uncertainty as it means that a firm systematically and transparently reports to investors estimates of the lagged financial benefits from marketing investments as reflected in MA values. This information is relevant because it provides a valuation benchmark and insight into managers’ expectations, enabling investors to compare this information with their own expectations about the firm's future performance, similar to what they can do for other financial results and assets that a firm reports to reduce information asymmetry. Furthermore, investors can then hold the firm accountable for changes in MA values and evaluate the management of these assets.
The second dynamic is related to indirect uncertainty reduction from signaling. Strong MAs safeguard a firm's financial value and reduce cash flow risks (e.g., Anderson, Fornell, and Mazvancheryl 2004; Bharadwaj, Tuli, and Bonfrer 2011; Gruca and Rego 2005). Thus, MA accountability can serve as a signal that a firm focuses on the health of its MAs, which essentially are risk-reducing assets that safeguard future performance (e.g., through strong customer relationships).
In summary, we expect that MA accountability addresses investors’ uncertainties about a firm's focus on MAs and marketing investments’ lagged effects. For firm financing, reduced uncertainties due to higher accountability mean lower cost of capital.
Marketing-intensive firms
It could be expected that MA accountability is even more important for marketing-intensive firms because investor uncertainty about the value and governance of more substantial MAs should increase the cost of capital more strongly. However, the importance of MAs creates an incentive for alternative sources (e.g., the media) to provide MA information and for investors to acquire such alternative information due to its enhanced strategic relevance for marketing-intensive firms. Such alternative information can also reduce investor uncertainty, thereby curtail the relevance of a firm's own reporting of MA valuations, and consequently lead to a weaker effect of MA accountability on a marketing-intensive firm's cost of capital.
Specifically, the media tend to publish commentary on marketing-intensive firms’ activities and assets since such firms are more prominent and hence of greater public interest. Take, for example, media reports on the Kraft Heinz brand's value loss, which was attributed to management's failure to invest and innovate (Geller and Naidu 2019). Similarly, independent companies that specialize in the valuation of MAs are more likely to offer MA information for marketing-intensive firms for reasons of greater public interest. Finally, financial market analysts tend to especially scrutinize and evaluate in their reports expense items that are substantial, such as the marketing spending of marketing-intensive firms, which are hence more consequential for the assessment of firms’ cost efficiency and future growth potential (Asquith, Mikhail, and Au 2005; Pignataro 2013). These information sources can provide investors with alternative MA information and establish accountability, which reduces investors’ uncertainties so that marketing-intensive firms’ MA accountability has less of an effect.
Impact on Stock Price Informativeness
A key objective of external accountability and reporting is to inform financial markets so that firms’ valuations are a fair representation of their future prospects (IASB 2004). Misvaluation is generally problematic for firms. Overvaluation means unrealistic expectations creating performance pressures, whereas undervaluation creates challenges to sell equity shares at a fair price and heightens the risk of hostile takeovers, among other consequences (Grinblatt and Titman 2002). MA accountability is likely to play an important role in addressing misvaluation given MAs’ importance for firms’ market value (e.g., Libai, Muller, and Peres 2009; Sinclair 2016). While misvaluation is difficult to observe directly, it can be seen indirectly in a stock price that is less predictive of, or less “informative” about, the future earnings that firms actually realize (Durnev et al. 2003; Gelb and Zarowin 2002).
General impact
As discussed previously, there are concerns about the reliability of MA valuations. As valuing MAs requires assumptions and prediction of future cash flows, there is the risk that a reported MA value could be inaccurate due to error, bias, or an unforeseen change in market conditions (e.g., Lambert 1998; Mizik and Nissim 2011). However, in the absence of MA accountability, investors may either make inaccurate assumptions or be reluctant to fully incorporate MAs into firms’ stock price due to incomplete information about those assets’ potential future earnings effect.
MA accountability is likely to improve firms’ stock price informativeness despite reliability concerns as it addresses an important information gap. Specifically, to add MA value, firms design and invest in marketing programs, the success of which is difficult for outsiders to predict. The interplay of various factors associated with customer and competitor responses to a marketing program is complex, and the resources (e.g., marketing capability) a firm employs when developing the program are often intangible and tacit, creating an information gap for investors. Investors then fill the gap, with two possible outcomes. On the one hand, expectations can be inflated as a result of excessively optimistic assumptions about the future earnings effects of marketing programs. For instance, research has shown that prelaunch advertising for movies can artificially inflate studios’ stock prices due to overoptimistic investor expectations (Joshi and Hanssens 2009). On the other hand, investors may undervalue assets with uncertain earnings effects (Chen, Gavious, and Lev 2017; Lev 2004). In either scenario (i.e., potential over- or undervaluation), an estimate based on management's expectations, as reflected in forward-looking MA valuations, can act as an anchor for investor expectations, contributing to stock prices that are more indicative of actual future earnings (i.e., more informative). Thus:
Marketing-intensive firms
Marketing-intensive firms’ MAs typically make up a substantial share of the firms’ total asset bases, which can significantly affect these firms’ financial values (e.g., Dutordoir, Verbeeten, and De Beijer 2015; Simon and Sullivan 1993). Consequently, investors are likely to have greater information needs with regard to the future earnings implications of large MAs. It could therefore be expected that MA accountability especially improves the stock price informativeness of marketing-intensive firms.
However, the effect is likely to be relatively weaker for marketing-intensive firms for two main reasons. First, marketing-intensive firms typically have a richer information environment, as discussed previously. Third-party information and analyses (e.g., by the media, analysts, or valuation companies) help address investors’ information needs independently of firms’ own reporting. For example, recent research shows that local newspaper coverage can address investors’ information gaps (Allee, Cating, and Rawson 2023). Second, given the substantial size of marketing-intensive firms’ MAs, prediction errors or bias pertaining to the valuation of MAs are likely to be more consequential when investors incorporate this information in the stock price, effectively weakening the positive effect of providing the estimates to investors. Thus:
Research Methodology
Natural Experiment
The accounting regime change in Australia provides a natural experiment for examining our hypothesized effects of MA accountability. Joining a global effort to harmonize accounting standards internationally, Australia transitioned from local generally accepted accounting principles (GAAP) to IFRS, with 2005 being the last year that publicly listed firms prepared their financial statements in accordance with local GAAP (see Web Appendix A for the accounting regime change's timeline and implications for the data analysis). As a result, firms that comprehensively listed their MAs on the balance sheet under Australian GAAP had to largely cease this reporting under IFRS, which effectively reduced these firms’ MA accountability.
As explained in the Appendix, Australian GAAP gave firms a choice to include MAs on the balance sheet. Some firms did not use this option, providing a control group of firms for which MA accountability was not reduced upon the change to IFRS while for other firms (the treatment group) it was. The general effects of the IFRS introduction are captured by the control group, and comparison with the treatment group allows for the identification of our hypothesized effects of MA accountability. To rule out alternative explanations, we identify effects based on a comparison of similar control and treatment firms using PSM.
Sample and Data
Our sampling frame comprised the 500 largest companies listed for at least five consecutive years on the ASX between 2001 and 2010, including during the change to IFRS. The multiyear study period ensures that, first, possible effects from reduced MA accountability have sufficient time to settle (e.g., investors could still work with prior valuations) and, second, multiple years form the basis for the effects’ identification so that the influence of individual year observations is reduced. We chose the 500 largest firms because together they account for around 95% of the equity market by market capitalization and, hence, are the most important firms in the Australian economy. Given their size, these firms are also most likely to own MAs, enabling us to investigate the effects of MA accountability.
We used Morningstar's DatAnalysis Premium database to obtain the data for the analyses. This database contains financial data of almost 100% of Australian publicly listed firms and scanned copies of annual reports. For the sample firms, we obtained all available annual reports and manually coded whether the balance sheets contained MAs, which we identified using established frameworks from the literature (e.g., Srivastava, Shervani, and Fahey 1998). We also recorded the MA type and who had valued the asset (i.e., whether an independent or internal valuation took place). The effects of these aspects are reported in our additional analyses.
Data availability and measurement requirements determined the final sample. We excluded banks and insurance companies because they are subject to different regulations and issue financial statements that fundamentally differ from those of nonfinancial firms (Malshe and Agarwal 2015). Our final sample contained 3,840 annual reports published by 475 firms. The sample firms operated in 19 different industries as defined by the Australian Stock Index industry classification system. The average firm in the sample had AUD 1,575 million in assets and AUD 1,096 million in sales revenues.
Of the annual reports, 1,306 contained MAs on the balance sheet; these were published by 153 firms. The most often reported MAs were brands (65% of balance sheets containing MAs), followed by marketing licenses (19%), customer relationships (19%), distribution agreements (15%), and miscellaneous (9%), such as product designs. 3 The most prominent industries in which firms with recorded MAs operated were media (10%), capital goods (9%), materials (9%), health care equipment (9%), software and services (8%), pharmaceuticals (8%), and retailing (7%), as well as food, beverages, and tobacco (7%). Table 1 lists the MAs’ composition and average recorded value per industry. Almost all firms with recorded MAs continued reporting in future periods until 2006, with the year-on-year correlation being greater than .90.
Industries and Examples of Firms Included in the Sample and Marketing Asset Reporting Under Australian GAAP.

Notes: MA = marketing asset; B = brands; C = customer relationships; L = marketing licenses; D = distribution agreements; O = other MAs; M = average value in million Australian dollars of recorded MAs per annual report containing recorded MA values on the balance sheet; MΔ = average absolute annual value change in million Australian dollars in recorded MAs per annual report containing recorded MA values on the balance sheet. The percentages for formal reporting of MA types can add up to more than 100% per industry since some firms recorded multiple MA types.
Measures
Short-term and long-term marketing efficiency
Our short-term marketing efficiency measure captures the short-term productivity of marketing spending by relating the annual change in a firm's revenue to its marketing expenses. We removed the effects of nonmarketing intangible assets (other intangibles and goodwill) and innovation spending (research and development [R&D] expenses) from the revenue change. 4 All variables are expressed as a percentage of assets to make them comparable across firms, and we used the standard log (log) of the resulting ratio—adjusted annual revenue change over marketing expenses—to address skewness that can occur in financial performance ratios. Marketing expenses include costs for advertising, merchandising materials, direct mailing, and promotions. Australian GAAP and IFRS required firms to separately report expense positions that are material (AASB 1031 [Australian Accounting Standards Board 2013]; IAS 1 [IFRS 2024a]).
Our long-term marketing efficiency measure follows a similar logic, while capturing the long-term productivity of marketing spending. Specifically, the measure relates marketing spending to a long-term outcome, which is a firm's customer equity value (CEV) as derived by Schulze, Skiera, and Wiesel (2012). 5
Cost of capital
We measured cost of equity, expressed in percentage terms, with the capital asset pricing model, which defines a firm's cost of equity as the sum of the risk-free rate and a firm-specific risk premium. The firm-specific risk premium, in turn, is determined by the excess return of the general stock market above the risk-free rate times the firm's market beta. The market beta considers that equity investors demand higher returns for riskier stocks (Bharadwaj, Tuli, and Bonfrer 2011). We used the Reserve Bank of Australia's annual cash rate to measure the risk-free rate and derived the market beta from the Fama–French five-factor model based on daily stock and factor returns over one year. 6 The cost of debt was measured using the ratio of a firm's interest expenses to long-term debt, expressed in percentage terms (Zou and Adams 2008).
Stock price informativeness
Our stock price informativeness measure captures the extent to which a firm's stock price reflects the firm's actual future earnings. The more future earnings are reflected in a firm's current stock returns, the more variance in the stock returns should be explained by future earnings. Based on this logic, we used the difference of the variance explained (R2) by two models. The first model regressed current stock returns on changes in current and future earnings; the second model only contained the change in current earnings as a regressor (Durnev et al. 2003). To measure future earnings, we used a firm's reported earnings up to three years ahead, considering Kothari and Sloan's (1992) finding that the average statistically detectable lead-lag is no longer than three years. We also added future stock returns as regressors to the models to control for changes in a firm's future performance that could not have been anticipated in the current period. The stock returns are total returns, including capital and dividend gains. The earnings are measured using EBITDA divided by market capitalization. We estimated the models separately for each industry in the data set to accommodate industry-specific differences. We verified that the results pattern did not change when we used the summed future earnings response coefficients instead of the incremental R2 as an alternative measure of stock price informativeness. 7
Marketing-intensive firms
We identified marketing-intensive firms by using a median split on firms’ marketing expense to total assets. This categorical grouping variable enabled us to compare results between marketing-intensive and non-marketing-intensive firms. Although a continuous variable could alternatively be generated, the categorical operationalization is more suitable in the context of our study. The DID approach, which we used in our natural experiment context and explain subsequently, works with a set of experimental conditions, similar to the conditions in an experiment's factorial design. Expressed as a factorial design, the conditions in our context are consistent with a full-factorial 2 × 2 × 2 design using three factors (treatment group, postintervention, and marketing-intensive firm) with two levels each (yes or no). Factors used in a factorial design must be categorical, not continuous, variables so that they generate a set of discrete experimental conditions. Moreover, from a conceptual viewpoint, discussions about external MA reporting have occurred in the context of marketing-intensive firms rather than the degree of marketing intensity. We therefore use the categorical operationalization logic.
Control variables
First, we included variables that indicate a firm's complexity and performance:
Firm size. Firm size accounts for both a firm's complexity and market power and was measured with total assets (log). Return on assets. A firm's profitability was controlled using the ratio of net profit to assets. Asset turnover. Sales performance was controlled using the ratio of revenue to assets. Market-to-book ratio. A firm's market value performance was accounted for using the ratio of market value to the book value of common equity. CEV. To account for market expectations, we controlled for a firm's customer equity value as defined by Schulze, Skiera, and Wiesel (2012) and discussed previously. Marketing spending. Expectations can also be affected by a firm's marketing investment level which was measured with the ratio of marketing expenses to assets. Goodwill. Recorded goodwill (log) was used to control for unidentified acquired MAs. Tone of narrative reports (positive/negative). Management's sentiment was controlled for, as reflected in the annual report's narrative sections. Specifically, we controlled for positive and negative tone, using the procedures of Loughran and McDonald (2011). Major auditor. Financial statements certified by a reputable auditing firm may be perceived as being more reliable. A binary variable was created, and a value of 1 was assigned when a globally leading accounting firm audited a firm's financial statements; otherwise a value of 0 was assigned. We considered the five auditing firms KPMG, EY, Deloitte, PwC, and Arthur Andersen to be global leaders. Our results were unaffected when Arthur Andersen, which surrendered its accounting license in 2002, was removed.
Second, we included variables that indicate market expectations about the value of a firm's MAs. In addition, we controlled effects from unidentified acquired MAs:
Finally, the following additional control variables were included:
Table 2 lists the descriptive statistics and correlations of the variables used for our estimations. All correlations are below the standard cutoff value (<.70), suggesting that multicollinearity is not a concern in our data (Cohen et al. 2003). In addition, Fisher-type augmented Dickey–Fuller unit-root tests for unbalanced panel data show no unit-root problems for any of our variables (Wooldridge 2010).
Descriptive Statistics and Correlations of Variables.
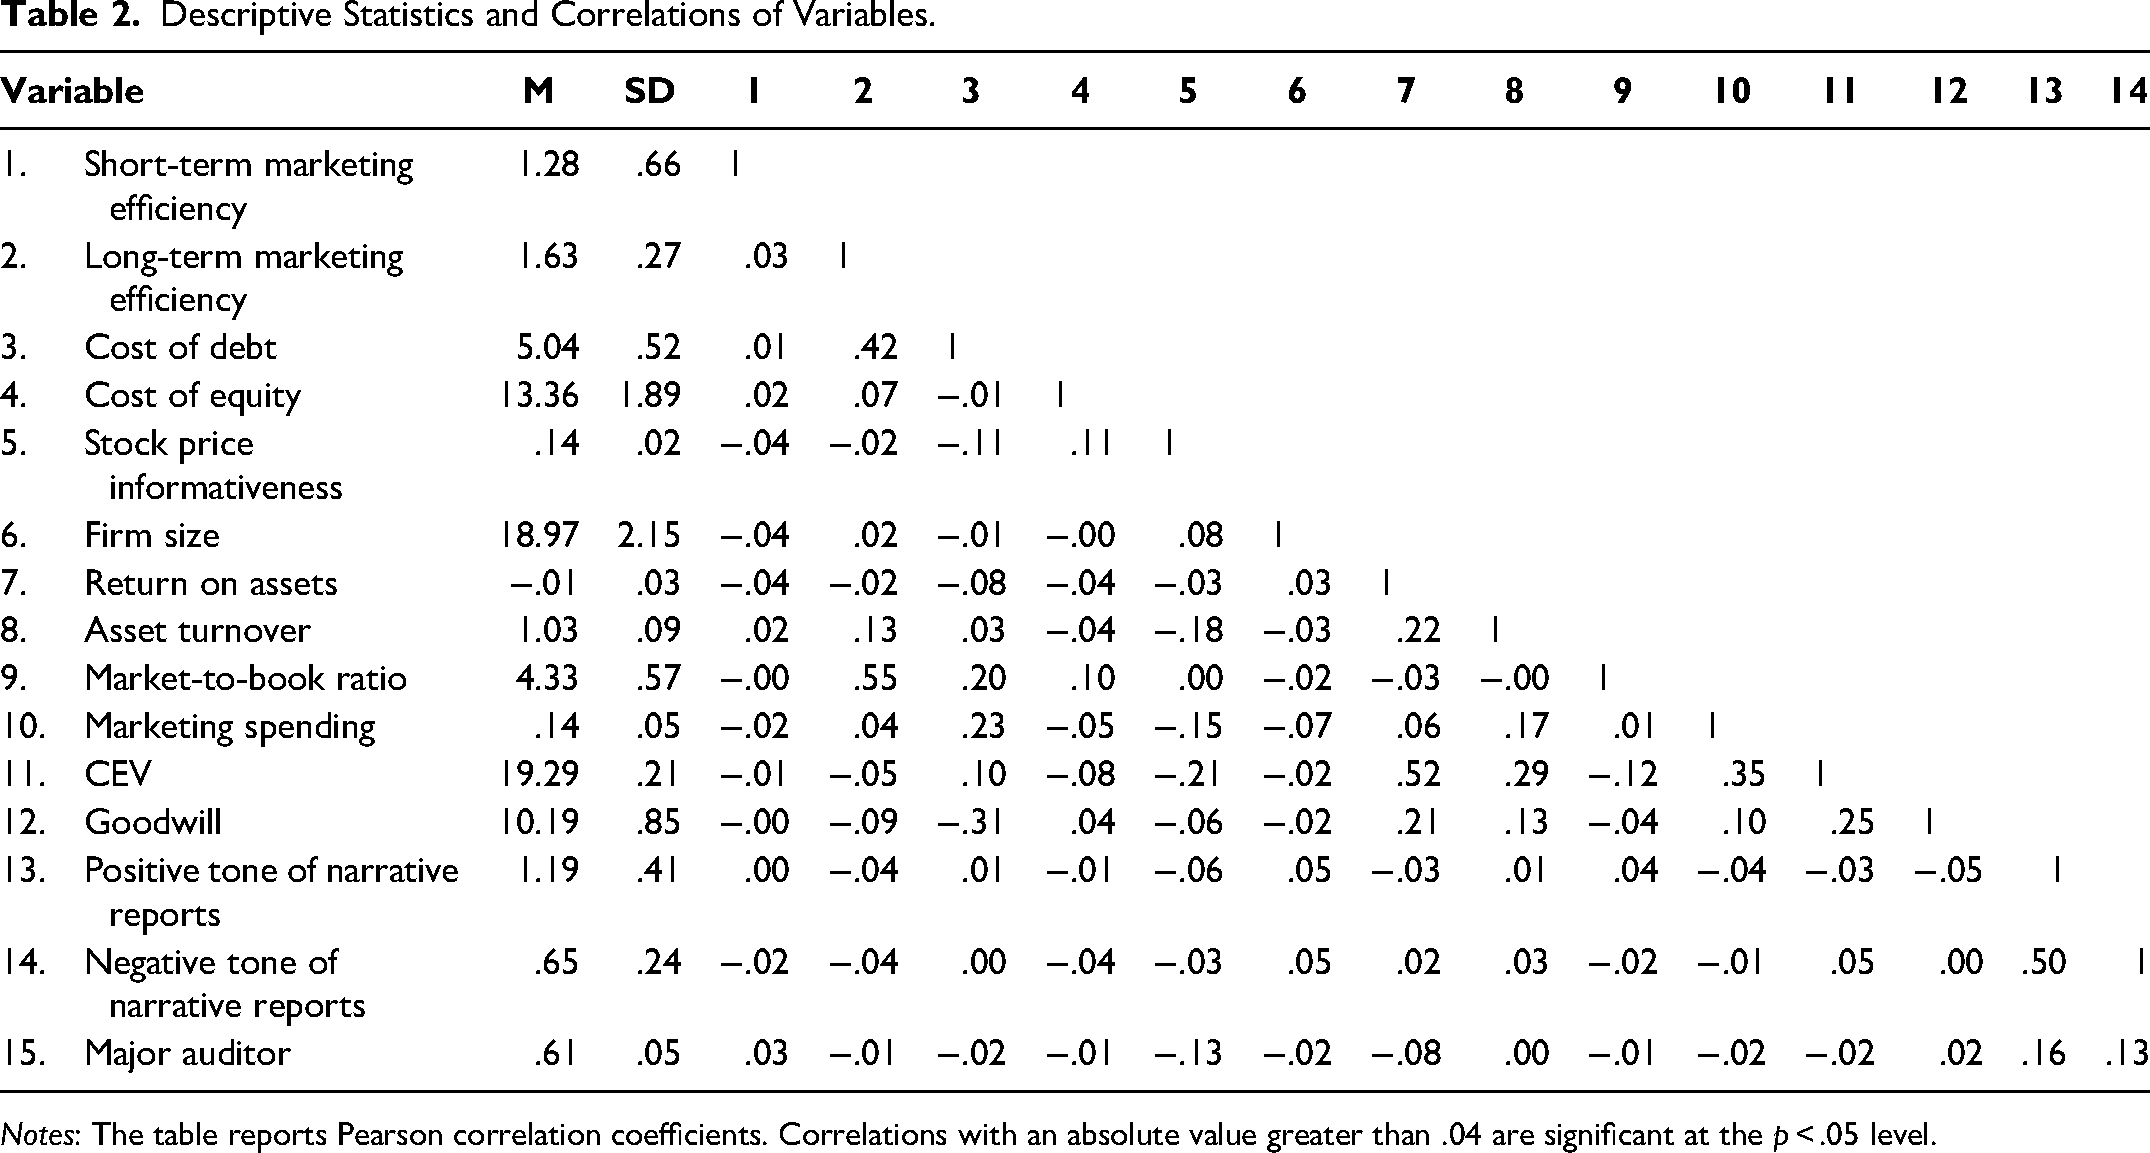
Notes: The table reports Pearson correlation coefficients. Correlations with an absolute value greater than .04 are significant at the p < .05 level.
Modeling Approach
DID approach
Our identification strategy is based on Australia's switch from Australian GAAP to IFRS, which serves as a natural experiment. This switch required certain firms listed on the ASX to reduce their reporting of MA valuations (treatment group; those that had chosen to report MAs at fair value under Australian GAAP), whereas other listed firms did not have to change their reporting of MAs (control group). To test our hypothesized effects, we used the DID method, which is one of the most rigorous approaches for identifying effects when the treatment (i.e., a reduction in MA accountability) is determined by an exogenous intervention (i.e., the switch to IFRS) (Edeling, Srinivasan, and Hanssens 2021; Ryan, Burgess, and Dimick 2015). The treatment effect can then be identified using the difference between the treatment group's pre–post difference on a certain outcome and the control group's pre–post difference on the outcome. In this regard, the latter difference accounts for general effects that differ in the preintervention and postintervention periods, including general effects of the IFRS introduction. These general effects are removed from the treatment group's outcomes so that any remaining pre–post difference in the treatment group can be attributed to the treatment instead of the general effects.
PSM approach
In combination with the DID method, we used PSM to compare each firm from the treatment group only with similar firms from the control group (Rosenbaum and Rubin 1983; Ryan, Burgess, and Dimick 2015), reducing concerns that any observable differences between the typical firms in the treatment and control groups drive the estimated treatment effects. Following standard protocol, we matched treatment firms with their nearest neighbors as determined by the full set of control variables described previously to ensure similarity regarding important firm characteristics such as complexity, performance, and market expectations of a firm's MAs. PSM reduces the multidimensional set of matching variables through a choice model (in this study, a probit model) that, in our case, uses the matching variables to model firms’ binary choice to formally report MA fair values before the IFRS introduction. The choice model generates a propensity score that captures a firm's likelihood to report MA valuations considering its characteristics. We then matched treatment and control firms with similar propensity scores to identify treatment effects using the DID method, effectively comparing differences between a treatment firm and its identical/similar counterfactual firm. Following recommendations in the DID literature, we matched multiple (five) control firms per treatment firm to reduce the impact of individual control observations (He and Tian 2013). We verified that the results pattern did not change when fewer (one or four) or more (six) control firms were matched. We matched control firms with replacements to ensure the best possible match and preserve sample size (e.g., He and Tian 2013).
Model specification
The DID estimator with PSM is specified as
The propensity score p(X) is derived from the probit model:
Identifying assumptions and settings
We ensured that key identifying assumptions of the DID method hold in our data. First, the common shocks assumption requires that treatment and control firms are similarly affected by phenomena, other than the treatment, that occurred together with, or after, the intervention. While this assumption cannot be tested directly (Ryan, Burgess, and Dimick 2015), the PSM approach that we used in combination with the DID method ensures a high similarity between treatment and matched control firms so that common shocks are likely to affect these firms in a similar manner. Second, the parallel trends assumption requires that treatment and control firms have similar trends, if any, in the outcome variables in the preintervention period so that any postintervention differences can be attributed to the treatment effect instead of diverging preexisting trends in the two groups of firms. As part of our additional analyses, we confirmed the robustness of this assumption using the multiple preintervention periods in our data set to model and statistically compare trends using the interrupted time series analysis (Linden and Adams 2011).
Moreover, we followed additional recommended settings from the DID and PSM literature (e.g., Ryan, Burgess, and Dimick 2015). First, we used a low caliper distance of .09 to ensure a satisfactory quality of matches. In addition, we verified the matching quality, which we report in the “Results” section. Second, we enforced common support, which means that treatment firms with propensity scores above and below the control firms’ maximum and minimum propensity scores were excluded from the estimation to ensure that the treatment effects are based on a comparison with suitable counterfactuals. Third, we used clustered standard errors at the industry level to account for heteroskedasticity.
Results
PSM Diagnostics
Probit model
Table 3 displays the results of the probit model estimated to derive the propensity score for PSM. As a group, the predictors significantly explain firms’ decisions to report, or not to report, MAs on the balance sheet (χ2 = 166.2, p < .01). The estimates show that firms were significantly (p < .05) more likely to engage in MA accountability when they were smaller, had a smaller market-to-book ratio, spent more on marketing, had a larger CEV, and recorded more goodwill. Insignificant predictors were return on assets, asset turnover, tone of the annual report, and whether a major auditor certified the financial statements.
PSM Results and Matching Quality.

*p < .05 (two-tailed).
**p < .01 (two-tailed).
Notes: The table reports unstandardized parameter estimates and standard errors in parentheses.
Matching quality
Since the intention of using PSM is to compare treatment and control firms that are similar, we verified the matching quality by comparing the treatment and control groups’ firm characteristics used for matching. As shown for PSM matching quality in Table 3, the treatment and matched control firms did not differ significantly in terms of their firm size, asset turnover, market-to-book ratio, marketing spending, CEV, recorded goodwill, and the tone of narrative reports. The matched control firms had a slightly (1%) lower average return on assets (p < .01) and were marginally (5.5%) more likely to use a major auditor (p < .05). Overall, the matching quality is high. In an additional analysis using a DID regression approach, we verified that the results pattern did not change when return on assets and the use of a major auditor were directly included as control variables in the outcome equations.
Hypothesis Tests and Discussion of Results
Table 4 shows the DID results for the different outcomes. We arranged the differences to facilitate a comparison between the treatment and control groups before and after the intervention instead of focusing on a preintervention–postintervention comparison within the groups. This representation allows for more interesting comparisons and does not affect the DID estimator. In the following text, we refer to the estimation results for the DID estimator as DID and those relating to the treatment versus control group differences in the pre- and postintervention period as Dpre and Dpost. To investigate effect differences related to marketing-intensive firms, we reestimated the DID models for two groups of firms: marketing-intensive and non-marketing-intensive firms. Table 5 shows the DID results per group and the difference between the two groups’ DID results. Due to the natural experiment context in which we observed outcomes for firms that had to discontinue their MA accountability, effects need to be interpreted in reverse to draw conclusions about MA accountability's hypothesized effects. For example, an estimated negative effect of discontinued MA accountability shows that MA accountability had a positive effect that has vanished. Subsequently, to enhance clarity, we directly discuss the estimated effects in reverse.
Results: Effects of Discontinued Marketing Asset Accountability (Main Models).

*p < .05 (two-tailed).
**p < .01 (two-tailed).
To assess the hypothesized effect, the estimated effect needs to be interpreted in reverse, as it pertains to discontinued MA accountability due to the natural experiment context, while the hypotheses focus on the effects of (establishing) MA accountability.
While the estimate is in the hypothesized direction, the treatment group's advantage in cost of debt before the intervention (before difference) is not statistically significant.
Notes: The table reports unstandardized parameter estimates and standard errors in parentheses.
Heterogeneity Related to Marketing-Intensive Firms.

*p < .05 (two-tailed).
**p < .01 (two-tailed).
Marketing-intensive compared with non-marketing-intensive firms.
To assess the hypothesized effect, the estimated effect needs to be interpreted in reverse, as it pertains to discontinued MA accountability due to the natural experiment context, while the hypotheses focus on the effects of establishing MA accountability.
Notes: The table reports unstandardized parameter estimates in summarized form. DID = difference-in-differences estimator result.
The estimation results show that MA accountability increases both short-term marketing efficiency (DID = −.070, p < .01; interpret effect in reverse as it pertains to discontinued MA accountability) and long-term marketing efficiency (DID = −.219, p < .05; interpret effect in reverse). This pattern of results does not confirm H1a, but confirms H2a. The individual preintervention–postintervention differences show that firms with MA accountability before the intervention (treatment group) have a significantly higher short-term marketing efficiency than firms in the control group (Dpre = .109, p < .01) and retain this marketing efficiency advantage after the intervention (Dpost = .039, p < .05), although the advantage's extent is reduced. With regard to long-term marketing efficiency, firms in the treatment group have an advantage before the intervention (Dpre = .176, p < .05), which completely disappears after the intervention (Dpost = −.043, p > .10). These results suggest that MA accountability is comparably more consequential for long-term than for short-term marketing efficiency. One reason could be that MA valuation improves managerial knowledge of both cash flow drivers from MAs and the timing of cash flows (i.e., the extent to which lagged effects occur) and, thereby, improves investment decisions.
In terms of the differential effects for marketing-intensive firms, the estimates indicate that MA accountability reduces short-term marketing efficiency comparably less strongly for marketing-intensive firms (DID difference = −.301, p < .01; interpret effect in reverse). This result confirms H1b, in which we proposed that marketing-intensive firms are less likely to develop a short-term focus irrespective of MA accountability. In fact, while MA accountability reduces short-term marketing efficiency for non-marketing-intensive firms (DID = .187, p < .01; interpret effect in reverse), the efficiency increases for marketing-intensive firms (DID = −.114, p < .01; interpret effect in reverse). Moreover, confirming H2b, marketing-intensive firms’ long-term marketing efficiency increases less strongly (DID difference = .277, p < .05; interpret effect in reverse). Taken together, these results show that MA accountability is effective in preventing a short-term focus especially in non-marketing-intensive firms.
With regard to cost of capital, the estimates show that MA accountability reduces both cost of debt (DID = .451, p < .01; interpret effect in reverse) and cost of equity (DID = .690, p < .01; interpret effect in reverse). These results confirm H3a. However, the individual pre–post differences indicate a certain asymmetry between the cost of debt and cost of equity effects. In terms of cost of debt, firms in the treatment group move from equal terms before the intervention (Dpre = −.050, p > .10) to being disadvantaged after the intervention (Dpost = .401, p < .01). For cost of equity, the treatment firms move from being advantaged before the intervention (Dpre = −.451, p < .01) to equal terms after the intervention (Dpost = .239, p > .10). This results pattern indicates that MA accountability creates larger cost-of-equity than cost-of-debt benefits. In terms of marketing-intensive firms’ differential effects, MA accountability reduces both cost of debt (DID difference = −.298, p < .05; interpret effect in reverse) and cost of equity (DID difference = −1.626, p < .01; interpret effect in reverse) less strongly for marketing-intensive firms, which supports H3b.
With regard to stock price informativeness, MA accountability increases this outcome (DID = −.047, p < .01; interpret effect in reverse). Therefore, H4a is supported by the data. The individual differences (Dpre = .008, p < .01; Dpost = −.039, p < .01) show that firms in the treatment group have a more (less) informative stock price than firms in the control group before (after) the intervention. Thus, although MA values are arguably uncertain since they require assumptions and prediction, their reporting appears to make stock prices more informative despite the valuation uncertainty. In terms of marketing-intensive firms’ differential effect, H4b is supported as MA accountability increases stock price informativeness less strongly for marketing-intensive firms (DID difference = .015, p < .05; interpret effect in reverse).
Additional Analyses
Parallel trends assumption
The key identifying assumption for the DID estimator is that the treatment and control groups do not have differing trends in the outcome variables in the preintervention period since any such trend difference would bias the postintervention differences between the groups (Angrist and Pischke 2009; Linden and Adams 2011). We used the interrupted time series analysis (ITSA) with PSM to statistically confirm that the parallel trends assumption holds in our data (Linden and Adams 2011). The ITSA specifies a DID regression model, which includes dummy variables for the treatment (TR), the postintervention period (PI), and the interaction term. This model is then augmented with a time variable (TI) and includes all possible interaction terms between TR, PI, and TI. The interaction term TR × TI measures the difference in trends between the treatment and control groups before the intervention. In our data, this interaction term was insignificant across the outcome variables (p > .13), confirming that the DID estimator is identified. Although not a prerequisite for identification, the estimates also did not indicate significant trend differences between the treatment and control groups after the intervention (TR × PI × TI; p > .41). Therefore, an impact of trends on the results can be ruled out. The results pattern was replicated when we used the ITSA. 8
Imperfectly matched variables as direct control variables
As noted previously, the PSM procedure ensures that similar firms are compared to identify effects, which means that the matching variables are held constant, similar to control variables in a regression model. We confirmed that the two matching variables with significant differences between the treatment and control groups—return on assets and use of a major auditor—did not change the pattern of results when directly included. Specifically, instead of using the standard DID estimator, we estimated DID regressions, allowing us to directly include each of the imperfectly matched variables as a control variable. The pattern of results was replicated. 9
Entropy balancing
Entropy balancing is an alternative to PSM that can improve the matching quality between treatment and control groups in observational studies with binary treatment (Hainmueller 2012). The approach reweights control group observations so that covariates, such as our matching variables related to important firm characteristics, are distributed as equally as possible in the treatment and control groups in terms of distributional moment conditions. We used entropy balancing with the first (mean) and second (variance) as well as the first, second, and third (skewness) distributional moments as moment conditions and a low tolerance level of .10 to ensure a high level of similarity between the groups (McMullin and Schonberger 2020). The pattern of results was replicated. 10
Synthetic control approach
A further alternative to PSM and entropy balancing is the synthetic control approach (Abadie, Diamond, and Hainmueller 2010). This approach has most often been used for scenarios in which an intervention affects a single entity while all other (control) entities are unaffected, although it can be extended to contexts with multiple affected entities (e.g., Xu 2017). The approach's key idea is that an optimally weighted combination of control entities usually approximates an affected entity's characteristics more closely than any single control entity alone or an equally weighted combination and, thereby, provides a more appropriate basis of comparison. The weights are determined so that the resulting synthetic control best resembles the affected entity's preintervention values on a set of predictor variables of the outcome, which may include preintervention values of the outcome itself (Abadie, Diamond, and Hainmueller 2010). We therefore used the preintervention values of the respective outcomes and the control variables (e.g., firm size, return on assets), specified previously, as predictors of the outcomes. We found that the results pattern was replicated. 11
Additional control variables to rule out alternative explanations
Changes in recorded MA valuations infrequently affected earnings, which then also influenced tax payments. To rule out the possibility that changes in tax payments affected the results, we added tax expenses to our model and found the results pattern to be robust. Moreover, changes in recorded MA valuations were usually booked to the reserves according to Australian GAAP. We therefore added the reserves to our model and found that the results were replicated. 12
Control for strategic selection
While firms in our sample had no influence on the accounting regime change, the change was known beforehand, and certain firms may have used their MA reporting and the future change strategically to achieve certain results on the outcome variables that we observe. In other words, unobserved characteristics and motives could affect our estimated effects. We controlled for this potential endogeneity concern with a selection model and estimation of the inverse Mills ratio, which captures the endogeneity of self-selected treatment (Wooldridge 2010). In the selection model, we used a firm's industry peer-weighted MA reporting as the covariate (Lim, Tuli, and Grewal 2020). 13 More similar peers are weighted more highly, and we operationalized peer similarity based on multidimensional scaling using firms’ market capitalization, total assets (log), age, and cost intensity (operating expenses/revenue) to consider firms’ success, market experience, and business model. The results were replicated. 14 The inverse Mills ratio's effect was nonsignificant for all of the outcomes, indicating no widespread strategic selection effect. A plausible explanation is that firms’ lead-up to the accounting regime change was effectively curtailed by Australia's late commitment to introduce IFRS, as discussed in Web Appendix A.
Measure modifications
We confirmed that the results were replicated when we measured short- and long-term marketing efficiency based on a stochastic frontier approach that models, per industry and year, firms’ revenue and CEV as a function of the installed customer base (lagged revenue), resources for the development of customer relationships (receivables), marketing expenses, and R&D expenses. 15 Furthermore, alternative measures of stock price informativeness are discussed in the accounting, finance, and economics literature. In our main analysis, we used the measure that best captures the essence of what we want to measure, which is the ability of stock prices to accurately predict a firm's future earnings. As an alternative measure, we used stock return variation, which captures the rate at which private information is incorporated into stock prices (Ferreira, Ferreira, and Raposo 2011). Our results were replicated for this alternative measure. 16 Moreover, we determined marketing-intensive firms at the industry level, which generated a similar results pattern to that reported in Table 5. 17
Correlations between outcomes
We directly modeled the correlations between outcome variables by using a seemingly unrelated regression model, which simultaneously estimates each outcome's DID regression equation and allows for correlated error terms between the equations. The results pattern was replicated. 18
Marketing asset information availability for marketing-intensive firms
In our conceptual discussion, we argued that MA accountability has weaker external effects for marketing-intensive firms as more MA information is available about these firms. We verified this assumption by assessing the amount of MA information that was publicly available for firms in our sample during the sampling period. Specifically, we downloaded from ProQuest all available articles published in newspapers, magazines, and trade journals that mentioned one of our sample firms in the period of 2001–2010. We analyzed the resulting sample of 98,923 news pieces with an automated text analysis based on a word list containing the marketing-created assets most frequently discussed in the literature. We measured the intensity of MA information with term frequencies (tf) and the term frequency–inverse document frequency (tf–idf) commonly used for information retrieval (Manning, Raghavan, and Schütze 2008). The results confirmed that significantly more MA information was available for marketing-intensive firms than for other firms. 19
Impact of marketing asset type
While not the focus of our study, we specified a DID regression model to explore the potential differences in the effects of reporting valuations of brands, customer relationships, marketing licenses, and distribution agreements. Overall, the effects of MA accountability were similar across MA types, with only a few significant (p < .05) differences. For brands, the effect on long-term marketing efficiency was almost twice as strong, and the effect on stock price informativeness was stronger by about a fifth. For customer relationships, the effect on long-term marketing efficiency was approximately three times as strong, whereas the effect on cost of debt was weaker by about a third. Marketing licenses showed no significant differences. For distribution agreements, the effect on short-term marketing efficiency was approximately twice as strong as was the effect on stock price informativeness.
Impact of valuer
Considerations concerning specific valuation approaches are beyond the scope of this study, and the balance sheets in our sample typically did not provide specific information beyond that a discounted cash flow approach had been used as per Australian GAAP. However, firms were required to state whether the valuation was performed by an independent third party or internally. We hence explored the comparative effects of an independent valuation and found that accountability for independently valued MAs was significantly (p < .05) more beneficial for stock price informativeness by about one-third, whereas differences on the other outcomes were nonsignificant.
Implications for Theory and Practice
Although the marketing literature has emphasized the importance of MA accountability, its benefits and downsides remained largely unclear, especially concerning firm-internal outcomes beyond the marketing function's standing in the firm and in terms of external stakeholder outcomes. With specific regard to accountability toward external stakeholders, it is well known that accounting standards, such as IFRS and U.S. GAAP, restrict the reporting of MA values in financial statements. Although such reporting is possible in annual reports—outside of the financial statements (Wiesel, Skiera, and Villanueva 2008)—it is not regularly provided at the moment. In many firms, external reporting requirements determine what is measured and reported, and chief marketing officers (CMOs) frequently are not involved in the communication of firm performance to external stakeholders such as analysts (Koo and Lee 2018). Naturally, managers will be cautious to expand their accountability for MAs’ financial value when the specific consequences are unknown and only the reporting's effort (e.g., for valuation) is certain. To that end, we developed a conceptual framework and empirically assessed MA accountability's effects on firms’ short- and long-term marketing efficiency, cost of capital, and stock price informativeness using a unique natural experiment.
Our results show economically significant effects related to MA accountability, generally, as well as an interaction with firms’ marketing intensity. In particular, when marketing-intensive firms engage in MA accountability, their short- and long-term marketing efficiency and their stock price informativeness are on average 8%, 10%, and 17% higher, respectively, while the firms’ cost of equity is 4% lower. Non-marketing-intensive firms that externally report MA values reduce their focus on short-term efficiency by 17%, accompanied by an increase in their long-term marketing efficiency of 22%, suggesting that MA reporting compels management to realign their focus toward long-term performance goals. Moreover, MA accountability reduces the cost of equity for non-marketing-intensive firms by 19%, while stock price informativeness increases by 23%. In contrast, our results indicate no clear effect pattern for firms’ cost of debt irrespective of marketing intensity. Overall, these results generate important insights for researchers, managers, and policy makers.
Theoretical Implications
Marketing asset accountability shapes internal marketing management
We show that the consequences of MA accountability are more wide-ranging than previously known. In particular, reporting MA valuations to external stakeholders prompts firms to better balance short- and long-term marketing efficiency, suggesting improved MA governance and effectively addressing myopic management to which marketing can fall victim when firms come under financial pressure (Mizik and Jacobson 2007). One explanation for this effect on marketing management is that top management typically focuses on optimizing metrics that are externally reported, as these tend to drive firms' stock price performance, which provides feedback to managers. Thus, our research underlines the important role of marketing accountability to external stakeholders. With the exception of Wiesel, Skiera, and Villanueva (2008), who illustrate how customer equity could be reported, there is little prior work on external marketing reporting. Our research supports Mizik and Nissim's (2011) notion not to view external reporting as “outside the scope of marketing” but instead to “recognize the importance of financial reporting as it pertains to marketing activities” (p. 4).
In addition, our research has important implications for the marketing performance assessment (MPA) literature (e.g., Katsikeas et al. 2016; Morgan et al. 2022). This stream of research is internally focused, including the dissemination of performance data it proposes. The external–internal accountability interdependency we find highlights the value for MPA research to expand existing frameworks to account for (1) the ability of proposed MPA systems to produce externally reportable information, and (2) the feedback loop that exists between external reporting and internal decision making.
Estimated marketing asset values are better than no values
A common theory-in-use is that possible biases and estimation difficulties surrounding the valuation of MAs are likely to lead to inaccurate values that distort firms’ stock prices, if reported. While our data do not allow us to directly evaluate how accurately the reported MA values were measured, our finding that MA reporting, on average, improves the accuracy of a firm's stock price instead of distorting it revises this theory. Hence, it appears that the valuations were sufficiently reliable to help investors make better predictions about reporting firms’ future performance. Not providing MA values seems to be more problematic than providing estimated MA values to investors, underlining the importance of informing investors about lagged marketing returns.
Overall, our research underscores the need for the development of standardized and reliable MA measurement approaches, as MA valuations that exhibit lower levels of uncertainty are arguably more useful to investors and help reduce the potential downside of reporting estimates (i.e., stock price distortions). Valuation approaches directly developed for external reporting are still scarce and focus on brands only (Fischer 2016). Such approaches need to ensure consistent, continuous, and potentially third-party-validated measurement and reporting to avoid selective and unreliable reporting, which has occurred for certain marketing metrics in the past (e.g., net promoter score; Safdar 2019) and undermined the credibility and value of the reports.
Beyond the usual suspects (marketing-intensive firms)
We find that the impact of MA accountability is not necessarily most pronounced for marketing-intensive firms. Previous work justifies the need for increased marketing accountability by citing examples of marketing-intensive firms such as Coca-Cola (Sinclair and Keller 2017), Netflix (Wiesel, Skiera, and Villanueva 2008), or Kraft Heinz (Sinclair and Keller 2014). Although our research demonstrates advantages of MA accountability for such firms, the benefits are especially substantial for firms with less dominant marketing spending—a segment that has been overlooked. For these firms in particular, MA accountability serves as a safeguard against detrimental management practice that trades off long-term for short-term marketing outcomes (e.g., Mizik and Jacobson 2007; Srinivasan and Ramani 2019). This harmful trade-off does not occur in marketing-intensive firms. A possible explanation is that marketing spending and assets are central to marketing-intensive firms’ business models, therefore creating an incentive for these firms to use sophisticated internal marketing reporting systems. Such systems typically place balanced emphasis on the short- and long-term outcomes of marketing activity. Yet, our results show that MA accountability can still create benefits for these firms, possibly because even in marketing-intensive firms measurement tends to focus on MAs’ current state (e.g., based on brand equity scores) instead of MAs’ financial value. Nevertheless, marketing without accountability is especially at risk of being mismanaged in non-marketing-intensive firms. Overall, our study encourages future research to look beyond marketing-intensive firms to consider the need for, and consequences of, marketing accountability more broadly.
Practical Implications
Drive improvements in external marketing accountability and claim credit
Our research makes a case for marketing executives to extend their focus beyond the consumers they serve in product markets and acknowledge the communication needs of their firms’ financial market “consumers.” Marketing is often a key driver of firms’ growth and performance. Therefore, MA accountability is important for investors to assess firms’ future performance prospects. Here, adopting a recognized MA valuation process and method, such as outlined in the ISO standard on monetary brand valuation (ISO 10668 [ISO 2010]), is likely to increase internal acceptance (Artz, Homburg, and Rajab 2012) and be preferred by investors, as the standard provides a template that ensures consistency and comparability of MA valuations across companies.
Crucially, the input of CMOs will be required for external reporting, which traditionally is led by the chief executive officer and chief financial officer (Koo and Lee 2018). However, neither the chief executive officer nor the chief financial officer should be assumed to have a detailed understanding of planned marketing activities, interdependencies, and outcomes—knowledge of which is required to justify MA valuations. Since arguably the language of compelling accountability is “finance” (i.e., based on predicted financial results), a translation of common marketing outcomes such as customer mindset metrics into financial metrics (e.g., expected income) will be required. Therefore, it is important for marketers to address the quantitative gap, given that many CMOs have a qualitative sense of marketing performance but do not currently quantify it (Sozuer et al. 2020).
After making a successful contribution, CMOs should take credit for outcomes that extend beyond the typical results attributed to marketing activity. Specifically, our findings demonstrate that, besides effects on marketing efficiency, MA accountability directly translates into improvements in firms’ equity financing costs and stock prices that more accurately reflect firm value. Claiming credit for these wider firm-level effects is likely to enhance marketing's standing in the firm.
Do it with maximum impact
Our results suggest multiple avenues for marketing executives to optimize the impact of the MA accountability that they champion. First, the MA values that a valuation company estimates improve stock-price-related outcomes more strongly than firms’ own estimates. Valuation companies usually have built their expertise over decades, and our results suggest that this expertise, on average, ensures more accurate MA valuations.
Second, marketing executives can choose to base their reporting on certain MA types, which can help optimize specific outcomes. For example, if the objective is to drive managerial attention toward long-term marketing efficiency, CMOs should preferably report the value of customer relationships, which have the strongest comparative effect of all asset types. Alternatively, reported brand values have a smaller, but still relatively strong, effect compared with other MA types. If the objective is to improve a firm's stock price informativeness (e.g., to address misvaluation in the firm's stock), CMOs achieve this target more effectively by reporting the value of distribution agreements, although brand value reports are also comparatively advantageous for achieving this objective. Separately reporting the value of license agreements does not offer a comparative advantage. Eventually, a firm's options will depend to a certain extent on its business model, although most firms will have multiple options, which they then want to optimize. For example, firms selling branded products should avoid attributing MA value to license agreements and, instead, consider this value a part of brand value. These firms could also consider separately valuing and reporting their distribution relationships, especially when selling new equity shares (i.e., when it is important that a firm's stock price accurately reflects the firm's performance potential).
Share with standard setters
The views of marketing executives are notably absent from the regular discussion roundtables and comment rounds organized by standard setters such as the IASB and the Financial Accounting Standards Board. Naturally, accounting professionals who prepare firms’ annual reports dominate in these exchanges, which inform the standard setters’ priorities and effectively determine regulations concerning external accountability. Investors point out that preparers often argue “that information is sufficient, with its collection and reporting being too costly and time consuming, as well as complicated and already adequately detailed,” whereas investors seek “increased clarity and detail” on firms’ intangible assets including MAs (Web Appendix B). Marketing executives possess valuable complementary insights about MA reporting and can contribute to raising awareness about external reporting's knock-on effects on internal decision making, which are currently overlooked in discussions with standard setters.
Preempt change
The time for marketing executives to help build their firms’ MA accountability capabilities is now, considering recent developments that are likely to encourage investor demand for enhanced MA accountability. For instance, the recent global adoption of a new ISO brand valuation standard (ISO 20671 [ISO 2021]) reinforces the issue of MA accountability to investors, generating demand for such valuations. This demand can also stem from investors’ comparison of accountability levels across jurisdictions. For example, as of January 2024, China requires firms to formally report on the balance sheet internally generated data resources, including data about customer relationships and marketing opportunities (Zhang 2023). Moreover, the IASB has recently added a new project titled “Intangible Assets” to its research project pipeline. The project “will aim comprehensively to review the accounting requirements for intangible assets” (IFRS 2024b) and directly acknowledges that “developing enhanced disclosure requirements (such as disclosures about unrecognised intangible assets) would help address user information needs … [and] reflect the increasing importance of intangible assets in today's business models” (IFRS 2022b, p. 11). Since capital markets are global markets, enhanced accountability requirements in one region can set a new benchmark globally for investors’ expectations of the appropriate level of accountability that firms should provide.
Limitations and Further Research
This study has limitations that create opportunities for further research. First, our study shows the effects of marketing accountability based on the reporting of MAs’ financial values, which are quantitative and forward-looking. While investors and other functions within a firm (e.g., finance) can easily interpret financial values, many standard marketing metrics are backward-looking and qualitative (e.g., customer referrals) or quantitative but nonfinancial (e.g., brand likes on social media). Future research could examine the relative effectiveness of these metrics in establishing marketing accountability. Furthermore, different MA measurement methods (e.g., relief from royalty) are available to derive MA values using a discounted cash flow approach (e.g., Fischer 2016). Our data did not allow us to investigate comparative effects because pre-IFRS standards did not mandate the disclosure of the measurement method that firms used to determine MA values. Further research is needed to answer the question of whether certain measurement methods are more suitable than others to establish marketing accountability.
Second, we focused on the annual report because it serves as the primary document through which firms demonstrate accountability to external stakeholders. Annual reports are relatively structured documents that are published regularly. This raises the question of whether marketing accountability that is provided through other communication channels has a role to play. For example, top managers may discuss and justify their firms’ marketing actions, strategies, and outcomes in media interviews. Moreover, executive managers of publicly listed firms provide accountability in calls with analysts or during investor days. It is unclear, however, whether these forums are similarly effective as the annual report in terms of establishing external marketing accountability as well as enhancing firm-internal marketing accountability and decision making.
Third, possible explanations for the positive effects of MA accountability on marketing efficiency include improved control, learning, or both (Morgan et al. 2022). For instance, MA accountability can improve control by providing an early indication of when progress deviates from plans, thus enhancing a firm's responsiveness. MA accountability can also improve learning by elucidating marketing-related drivers of financial value and associated contingency factors (e.g., the financial value of marketing activity during a recession), thus supporting decision making. Our data do not allow us to distinguish these mechanisms and their comparative effects, creating an opportunity for further research. Moreover, while internal MA accountability is capable of enhancing control and learning, the extent to which external MA accountability provides a more compelling incentive for managers to capitalize on identified opportunities remains not fully understood.
Fourth, the contingency perspective that our research introduces pertaining to marketing-intensive firms raises the question of what additional factors can explain differences in MA accountability outcomes across firms. Further research could assess differential effects for different configurations of potentially complementary assets or capabilities that firms may have in place. For example, firms with greater marketing capability or more marketing-focused top management teams may derive more advantages and fewer disadvantages from MA accountability. At the same time, these factors could imply that necessary conditions for proper management of MAs (e.g., MA awareness, measurement) are in place, effectively substituting MA accountability and thereby limiting its possible net benefits.
Finally, the audiences of marketing accountability that we focus on are a firm's management and external investors. Future research could examine effects on additional audiences, such as a firm's customers and employees. Some effects may arise unintentionally, including the inadvertent disclosure to customers of the potentially significant price premium that a firm intends to earn from them. Furthermore, a firm's possibly high MA value could instill a sense of pride and motivation among its employees. However, this value may also unintentionally engender conflicts by raising questions about the equitable distribution of the firm's financial success. Further research on such wider effects of marketing accountability is interesting from both a theoretical and managerial perspective.
Supplemental Material
sj-pdf-1-jmx-10.1177_00222429241236142 - Supplemental material for Consequences of Marketing Asset Accountability—A Natural Experiment
Supplemental material, sj-pdf-1-jmx-10.1177_00222429241236142 for Consequences of Marketing Asset Accountability—A Natural Experiment by Peter Guenther, Miriam Guenther, Bryan A. Lukas and Christian Homburg in Journal of Marketing
Footnotes
Appendix: Formal Marketing Asset Reporting Under Australian GAAP Versus IFRS
Australian GAAP had no separate accounting standard that mandated or precluded the recognition of MAs, effectively allowing firms to decide whether or not to recognize these assets on their balance sheets. Specifically, managers could classify MAs as either identifiable or unidentifiable assets. The former were “those assets which are capable of being both individually identified and specifically recognised” (AASB 1013 [Australian Accounting Standards Board 1996, p. 20]). When firms deemed MAs to be unidentifiable assets, acquired MAs were not separately recorded but were subsumed in goodwill, and internally generated MAs remained unrecorded. In contrast, when a firm deemed MAs to be identifiable assets, internally generated and acquired MAs were recorded on the balance sheet as noncurrent assets at their present financial value to the firm (AASB 1010 and 1041 [Australian Accounting Standards Board 1999, 2001]).
Firms used the following accounting practices for identified MAs: On initial recognition, firms recorded an internally generated MA at its estimated fair financial value using an income-based discounted cash flow (DCF) approach. The asset was added to a firm's noncurrent assets and its value credited to equity as part of the reserves (AASB 1041). An acquired MA was recorded at the price paid for the asset in the transaction. In subsequent periods, value changes were recorded such that financial statements presented a “true and fair view” (Section 269 of the Companies Act [1981]). Specifically, value increases of both acquired and internally created MAs were booked to the reserves as an asset revaluation surplus, whereas value declines were deducted from existing reserves (AASB 1041). Due to the use of the equity reserves for revaluations, effects from MAs on earnings were infrequent under Australian GAAP. 20
The main consequential difference from IFRS is that Australian GAAP accepted estimated asset values using a DCF approach, whereas IFRS mandate a market-based approach (i.e., observable asset market prices), which precludes self-created MAs and value increases from being recorded since no active market exists for these assets. Regarding our conceptual mechanisms, a DCF approach determines a fair financial asset value, which accounts for a firm's future benefits from the MA and can provide relevant, forward-looking information to investors. The approach necessitates measurement, which can promote firm-internal MA awareness. However, a DCF model is based on assumptions and prediction, resulting in a financial value that is uncertain. 21
Acknowledgments
The authors thank the JM review team for their suggestions during the review process. The authors also thank Bernd Skiera, Simone Wies, Arvid Hoffmann, Rutger van Oest, Anatoli Colicev, and the participants of the Marketing Strategy Meets Wall Street VI Conference and of seminars at BI Norwegian Business School and the University of Adelaide Business School for their helpful comments. Yan Dong, Patrizia Fazli, Timothy Fuchs, Qijia Liao, Antara Mandal, Marcus Theel, Annette Vitkievicz, and Sebastian Weber were instrumental in collecting the data for this study.
Coeditor
Shrihari Sridhar
Associate Editor
Neil Morgan
Declaration of Conflicting Interests
The authors declared no potential conflicts of interest with respect to the research, authorship, and/or publication of this article.
Funding
The authors disclosed receipt of the following financial support for the research, authorship, and/or publication of this article: The first author acknowledges the financial support of RMIT University's College of Business and Law ECR publication scheme. The second author acknowledges a research grant from the University of Melbourne's Department of Management and Marketing publication scheme.
Notes
References
Supplementary Material
Please find the following supplemental material available below.
For Open Access articles published under a Creative Commons License, all supplemental material carries the same license as the article it is associated with.
For non-Open Access articles published, all supplemental material carries a non-exclusive license, and permission requests for re-use of supplemental material or any part of supplemental material shall be sent directly to the copyright owner as specified in the copyright notice associated with the article.