
Abstract
When a firm collaborates with its suppliers, it expands its access to external know-how and thus can enhance its innovation performance. Such collaborations are common and argued to have significant impact on the firm's market outcomes. However, such collaborations also expose the firm to various transactional hazards, including knowledge spillovers and opportunism. This trade-off looms over the firm's commitment to a market positioning strategy and the functional capabilities it draws on to generate its strategy dividend. Recent accounts suggest that the verdict on supplier collaborations is noisy and that partner perceptions of these collaborations do not align on key issues of governance, strategy, and value generation. To investigate this, the authors study 202 formal codevelopment contracts of high-tech original equipment manufacturers that collaborated with suppliers from 1985 to 2016. Drawing on the governance value analysis framework, the authors show how misalignment between the firm's codevelopment contracts, capabilities, and market positioning strategy significantly erodes its innovation performance. Thus, blanket prescriptions for one type of contract or the other are misdirected, their effectiveness being a contingent outcome dependent on the firm's market positioning strategy and functional capabilities. This research presents one of the most complete tests of the governance value analysis framework to date.
Keywords
When Unilever partners with Novozymes, it is collaborating with one of its major suppliers of enzymes to fast-track innovation and improve its business performance (Gutierrez et al. 2020). Such codevelopment collaboration (CDC) is formally defined as a collaboration “that involves combining knowledge, technologies, and other resources across organizational boundaries to create a novel product, service, or solution” (Oinonen and Jalkala 2015, p. 291). Such partnerships are common, and industry reports indicate that up to 85% of firms believe they are effective means of innovation (Tevelson et al. 2013). In many cases, participating in CDCs enables firms to achieve strategic goals; for example, they may aim to (1) set new industry standards and reshape the market by developing next-generation, more advanced, and/or better-performing products (sometimes at lower costs and with faster delivery) than those available in the market at that time, (2) preempt competitors by getting access to unique resources, (3) overcome economic and technical challenges of developing sophisticated products, and (4) cut product development time and costs. Thus, empirical evidence demonstrates that CDCs have significant impact such as enhancing firm innovativeness (Markovic et al. 2020; Wu 2014; Xie, Liu, and Chen 2023) and affecting the market value of the partnering firms (Fang, Lee, and Yang 2015; Wu et al. 2015). Based on some industry reports, firms that collaborate regularly with suppliers in innovation activities outperform (e.g., grow more, profit more, reduce operating costs) their peers that do not form CDCs (Gutierrez et al. 2020). This broader impact of these collaborations is aptly captured in the following public statement by Bristol Myers Squibb (2023): “As critical drivers of our strategy, external innovation and partnering have brought significant commercial success and pipeline growth. Twelve of our company's twenty blockbuster medicines are derived from collaborations. In addition, more than sixty percent of our current development pipeline is externally sourced bringing significant external innovation to complement our internal capabilities and innovation.”
The performance-enhancing impact of CDCs is not totally unexpected. Suppliers specialize in cognate technologies, have ongoing relations with other firms, and are often independently engaged in technology development (Yang et al. 2023). So, partnering with suppliers expands a firm's access to external know-how and thus can shorten learning cycles, accelerate product development, reduce research and development (R&D) costs, and enhance innovation performance overall (Li, Wu, and Zhu 2022; Xie, Liu, and Chen 2023). However, CDCs also expose the firms to risks of partner opportunism (e.g., knowledge spillovers, misappropriations, and renegotiations), raising the specter that misaligned partnerships will bleed value (Carson and John 2013; Du 2021; Heide and John 1990). So, the focal firms need to balance the value to be gleaned from the CDCs against the potential transactional hazards that come with them. These trade-offs are sharpened as the firm's strategic resources are increasingly invested in effectively leveraging the collaborations. These are complex issues, and, not surprisingly, the verdict on supplier alliances is noisy. Evidence from industry points to as much as 80% of executives being dissatisfied with their outcomes (Tevelson et al. 2013). More specifically, recent data suggest that buyers’ and suppliers’ perceptions of these collaborations do not align on the key issues of governance, strategy, and value generation (Gutierrez et al. 2020). Unfortunately, this industry interest notwithstanding, the research literature has important gaps in helping managers unpack these key implications for supplier collaborations. We elaborate on these gaps and our contributions in the following paragraphs.
Most marketing studies focus on the trade-offs firms face in the dichotomous choice between formal and relational arrangements (e.g., Bouncken, Clauß, and Fredrich 2016; Noordhoff et al. 2011). Yet, as the strategic payoffs and the transaction costs of collaborations pull in different directions, firms face a more granular set of CDC modes. For instance, Boeing and Textron formed a joint venture (JV), Bell-Boeing, to develop and manufacture the V-22 Osprey, a military aircraft. Microsoft, in contrast, signed a joint development agreement with 3Com for developing its OS/2 LAN Manager. In yet another arrangement, Network Equipment Technologies granted Interphase a license to use its AATM (adaptive asynchronous transfer mode) interface technology in developing ATM adapter cards. The right choice of CDC form leads to superior firm performance, relative to the wrong choices. With only a few articles addressing the spectrum of formal contracts that dominate practice (Mowery, Oxley, and Silverman 1996; Oxley 1997), this leaves important sources of potential variation unexplained and limits inferences that practitioners can draw from research results. To address this critical gap, in this article, we study the implications of the entire spectrum of CDC contracts, from more arm’s-length agreements and licensing to more integrated JVs. We focus on their impact on firm innovation performance, which we define as the extent to which a firm succeeds in developing and commercializing innovative products as indicated by the quality of its patented inventions and the frequency of its new product announcements (NPAs).
The extant literature is also quite limited in its treatment of the firm's marketing strategy despite its critical role in driving the effectiveness of CDCs, as argued by Ghosh and John (1999, 2005). Many of the marketing studies that examine CDC effectiveness do so independently of the role of firm capabilities and positioning strategy (e.g., Bouncken, Clauß, and Fredrich 2016; Lee 2011). Yet, commitment to a specific market positioning strategy binds a firm to resource deployments that not only draw on the firm's existing capabilities but, in doing so, could also discriminate between the effectiveness of different CDCs with its suppliers. Drawing inferences without considering such strategy may lead to erroneous inferences about the effectiveness of CDCs. For example, JVs may not be well suited for a highly differentiation-oriented firm with considerable marketing resources at its disposal. However, JVs may be perfectly suited for the same firm if it does not seek high levels of differentiation vis-à-vis its competition. Interestingly, there is indeed disagreement on the efficacy of governance modes among such studies (Sampson 2004a). We hope to address this by explicitly accounting for the firm's positioning strategy in our framework. Relatedly, in our article we use measures of positioning strategy derived from archival data to build on current results. In this, we borrow from the accounting literature (Banker, Mashruwala, and Tripathy 2014) and build on research in marketing that often uses self-reported measures of strategy (e.g., Kaleka and Morgan 2019). 1
A consideration of firm strategy would be incomplete without simultaneous consideration of firm capabilities. Conceptually, the resource-based view points to different functional capabilities, such as marketing, technological, and operations, as key to sustainable competitive advantage. Empirically, many studies (e.g., Moorman and Slotegraaf 1999; Narasimhan, Rajiv, and Dutta 2006) draw on the resource-based view to investigate the relationship between capabilities and firm performance. However, explicit consideration of the effect of functional capabilities on CDC effectiveness is scant in the marketing literature (cf. Fang, Lee, and Yang 2015; Wu 2014). In our article, we investigate the simultaneous impact of functional capabilities along with positioning strategy and CDC governance forms on the firm's innovation performance.
For this, we draw on the roadmap of the governance value analysis (GVA) framework of Ghosh and John (1999, 2005), which highlights the significance of studying how governance forms that are misaligned with the firm's strategic resources and misaligned with its market positioning strategy may negatively impact firm performance. We draw on GVA to hypothesize how the performance of firms participating in CDCs is determined by the fit among the spectrum of contractual arrangements, firm capabilities, and the firm's relevant positioning strategy. The inherent complexity of studying this three-way alignment presents significant empirical difficulties, which has led to only partial tests of GVA in much of the extant literature (Nickerson, Hamilton, and Wada 2001). To the best of our knowledge, the full-fledged test of the GVA framework we undertake will be among the first.
Our empirical study uses a database of 202 CDCs that we created from multiple archival sources. We adopt established measures of variables, including factor analyses and stochastic frontier models. Our estimations use generalized linear models, utilizing the Gaussian copula (Park and Gupta 2012) and two-stage residual inclusion methods (Terza, Basu, and Rathouz 2008) to control for potential endogeneity.
To summarize, in our article we target several key gaps in the research literature in the following ways: (1) we study the full range of governance modes that dominate the CDC spectrum; (2) we explicitly account for the role of marketing strategy in determining outcomes; (3) we account for how different firm-level functional capabilities operate together to impact outcomes; (4) we address the complex interaction between governance, strategy, and capabilities with an almost full-fledged test of the GVA approach; and (5) we build a unique database of CDCs from different archival sources and base all our measures and empirical models on this secondary data.
Consistent with the postulates of the GVA framework, we find that fit among a firm's positioning strategy, its capabilities, and its CDC forms results in superior innovation performance. We also find that the different strategic capabilities interact differently with different CDCs to moderate the latter's effects on a firm's innovation outcomes.
Our key contributions are twofold. First, we offer a more holistic depiction of the misalignment costs of innovation contracts and how they impact innovation outcomes. We do this in three ways: (1) we generate more granular insights by considering the entire spectrum of CDC contracts; (2) we include marketing capabilities (MCAPs) and technological capabilities (TCAPs) in our model and control for operational capabilities, making our article, to the best of our knowledge, the first to illustrate how they operate jointly to impact innovation; and (3) we include positioning strategy along with governance and firm capabilities, in a single model, being among the first to study their interlinked mechanisms in the context of innovation collaborations.
Second, our work highlights the keystone role of a firm's positioning strategy in successful innovation. In the process, we offer one of the few direct tests of the full-fledged GVA framework, in a new context and with new data, contributing to the interface of governance and marketing strategy. In the rest of the article, following a review of the CDC literature, we present our theory and empirical efforts, and discuss our results.
Literature Review
Firms usually participate in CDCs to share product development costs and risks, acquire new skills, access unique technologies, and accumulate competencies (Xie, Liu, and Chen 2023). Yet, they also face the risks of partner opportunism, knowledge spillover, renegotiations, and appropriation hazards (Du 2021; Oxley 1997) and, thus, suffer from a high failure rate estimated to be as much as 70% (Noordhoff et al. 2011). In fact, that partner conflicts can negatively impact firm performance has been well documented (Eshghi and Ray 2021; Xu et al. 2023). Not surprisingly, keen managerial interest centers on how to effectively design and manage CDCs, and there is a large body of scholarly literature in the domain across multiple disciplines. In Table 1, we list a select group of articles in marketing to summarize the general contribution of our article in that spectrum.
Selected Marketing Studies on Product CDCs and Performance.

As we ground our conceptual model (see Figure 1) on the GVA framework, we postulate that fit among governance, capabilities, and strategy would enhance innovation performance by minimizing transaction costs and/or maximizing the created value. Thus, our study contributes to several research domains, including innovation collaboration and governance, firm strategy and capabilities, and firm performance, as discussed subsequently.

Conceptual Framework for Innovation Performance.
Several marketing articles study how CDCs impact firm performance, including market value (e.g., Boyd and Spekman 2008; Fang, Lee, and Yang 2015), financial performance (e.g., Luo, Rindfleisch, and Tse 2007), and innovativeness (e.g., Bouncken, Clauß, and Fredrich 2016; Fang 2008; Li, Wu, and Zhu 2022). However, the results reveal disagreement on the effectiveness of vertical CDCs. For instance, Yeniyurt, Henke, and Yalcinkaya (2014) and Luzzini et al. (2015) find that supplier CDCs enhance innovation, whereas Li, Wu, and Zhu (2022) conclude that upstream collaborations have no direct effect on innovation. Similar mixed results for downstream CDCs also proliferate the literature. For instance, Campbell and Cooper (1999) find that customer alliances have no advantage over in-house development in enhancing product performance. Statsenko and Corral de Zubielqui (2020) also conclude that customer CDCs have no direct impact on innovation performance. In contrast, Fang, Palmatier, and Evans (2008) find that customer participation improves new product development.
Most of the preceding studies ignore the different CDC governance forms, leaving open the possibility that variation in the results may be resolved with a more granular governance model. Ideas that peg a firm's performance to the governance structure of its CDC are not isolated (Sampson 2004b). Drawing on transaction cost economics, several nonmarketing studies (e.g., Sampson 2004a) have examined the conditions under which a firm would prefer one CDC form over others.
Three governance modes are commonly ascribed to CDCs (Mowery, Oxley, and Silverman 1996; Oxley 1997): (1) technology licensing contracts (“licenses” hereinafter), whereby one firm (the licensor) gives another firm (the licensee) a license to utilize its technology for development activities in exchange for a fee; 2 (2) codevelopment agreements (“agreements” hereinafter), whereby partners work jointly on projects to develop new products; and (3) JVs, in which ownership of a separately incorporated entity is shared by partners. However, most research on CDCs (e.g., Bouncken, Clauß, and Fredrich 2016; Noordhoff et al. 2011) focuses on the trade-off between relational and transactional modes, bypassing the complicated choice of different formal CDC arrangements faced by firms. Yet, other authors study heterogeneity within governance modes; for example, Carson and Ghosh (2019) and Ghosh and John (2005) consider completeness of contracts, while Heide and John (1990) study “closeness” in interfirm arrangements in a nonequity participation setting. In contrast, our research explicitly considers all three governance forms.
Our focus on the three “top-tier” CDC forms is driven by three main concerns. First, our context of innovation is laden with major strategic significance for the firm. Second, these three forms comprise the spectrum of innovation contracts in practice. Third, these forms are substantially diverse from each other in practice; for example, the duration and termination costs of JVs are more than those of either agreements or licenses, whereas their decision making is much less decentralized. We summarize the differences between the three governance modes in Table 2. We believe that not accounting for these diverse contractual arrangements is a critical gap in the CDC literature. This gap leaves a big part of the implications of CDCs unaddressed and limits inferences that can be drawn from research results.
Benefits and Costs of Different Formal CDC Governance Forms.

In the context of mixed results in the CDC–performance relationships, it is also interesting to note the relatively thin focus on the role of firm-level strategic factors. In general, a firm's functional capabilities (i.e., marketing, technological, and operations) are indicated as critical factors of firm performance (Krasnikov and Jayachandran 2008). Yet, only a few marketing studies explicitly consider their moderating effects on the effectiveness of CDCs (Fang, Lee, and Yang [2015] is a notable exception). Even this thin slate of studies focuses on either TCAPs or MCAPs (e.g., Lee and Chang 2014), and none account for all three capabilities simultaneously. We believe this leaves key parts of the variation in innovation performance unexplained, limiting our inferences. We incorporate both MCAPs and TCAPs in our theoretical framework and control for operations capabilities (OCAPs) in our empirical model, thereby accounting for all three capabilities simultaneously. 3
The absence of explicit treatment of the firm's positioning strategy in studies of CDCs is surprising. Strategy defines organizational goals, sketches directions for firms’ activities, integrates and motivates efforts, and provides criteria to measure performance. In addition, strategy delineates firms’ value propositions, designating prioritization of capabilities and allocation of resources to create value. Positioning a new product is one of the key strategic decisions that determine the product's performance in a market. In the context of the mixed results in the literature, this is a rather significant gap, which we address in this article.
To that end, Porter's widely studied generic strategy of product differentiation (Porter 1980) has had a great impact on studies of firms’ product strategy in marketing, since it explicitly addresses one basic pillar of competition related to products themselves. Other strategy frameworks have concentrated more on environmental factors (Swink and Hegarty 1998). We focus our investigation specifically on the role of the firm's product differentiation strategy.
Theory and Hypotheses
Firms collaborating to improve their innovation performance are forced to reckon with a trade-off: gaining access to external know-how and expertise, versus bleeding value in the transaction costs of misaligned contracts due to hazards of knowledge appropriation and other partner opportunism. Licenses, for instance, offer firms external know-how but have inadequate safeguards against such hazards, which, when high, lead to high ex post adaptation costs, thereby distracting from innovation. At the same time, the firm's strategic orientation is focused on generating a dividend in terms of sustainable competitive advantage and determines how the firm develops and deploys its resources in prioritizing different action alternatives. Thus, the collaboration decisions cannot be neutral to the firm's strategy (Merchant 2014). The same resources that may be seen as boosting the strategy dividend for the firm could be wasteful in the context of realizing the objectives of supplier collaboration. For example, resources that engender high MCAPs are useful for sensing and anticipating market dynamics ahead of rivals, and thus are suitable for firms focused on offering unique solutions to differentiate themselves. Effective implementation of a high-differentiation strategy calls for flexibility to implement quick and frequent changes in product design and attributes. CDC forms laden with higher bureaucracy, such as the more integrated JVs (relative to the more arm’s-length agreements and licenses), might be less suitable in this case because they may get in the way of quick adaptations, bleeding the value gained from possessing strong MCAPs. Thus, misalignment between the firm's capabilities, its strategy, and the CDC governance form would result in inferior innovation outcomes. An emerging literature in marketing studies the role of such ex ante firm differences in vertical governance (Carson and Ghosh 2019; Ghosh and John 2005). In particular, GVA examines this by proposing that the firm's strategic positioning draws on the bundle of resources it possesses, and that this positioning, along with the firm's resources, influences organizational structure and governance choices. At the core of this argument are the trade-offs between the strategy dividend derived from its strategy portfolio vis-à-vis the transactional costs of its governance structure, and recognition of the endogenous nature of firm decisions of strategy, resources, and governance (Nickerson, Hamilton, and Wada 2001).
We build our hypotheses on GVA. Figure 1 depicts the conceptual framework driving our hypotheses. This framework has four main elements: (1) innovation outcomes are jointly determined by the original equipment manufacturer's (OEM's) strategy, its capabilities, and governance; (2) the governance form is jointly determined by both the firm's strategy and its capabilities; (3) capabilities are jointly determined by its strategy and governance forms; and (4) innovation performance emerges as a net of strategy dividend and transaction costs. 4 Our ultimate goal is to investigate the full GVA-inspired model of the three-way interactions among strategy, capabilities, and governance. However, we cannot do so without first setting the base models of the simple relationships and two-way interactions. Thus, we follow a sequential approach to develop our theory as discussed subsequently.
Governance Forms and Innovation Performance
Licenses might be seen as the “default” mode because they generate less negotiation and formation costs than agreements and JVs (Sampson 2004b). However, given the special nature of technological transactions, which are centered on the exchange of knowledge, and the associated problems of specifying, observing, and enforcing licenses without elevating the transaction costs of crafting and monitoring, licensing contracts are necessarily incomplete. The incompleteness increases the risk of opportunism and appropriability hazards. So, ceteris paribus, firms might reserve licenses for situations where the risk of opportunism is low. In contrast, a JV would normally provide greater protection against partner opportunism (Oxley and Sampson 2004), which could motivate the partners to make specific investments and share valuable knowledge and technological resources (Sampson 2004a). The more intimate exchanges these foster will help partners better acquire and assimilate complementary knowledge from each other (Lane and Lubatkin 1998), ultimately assisting novel inventions. Thus, ceteris paribus, in a similar situation, for firms facing high opportunism risks, JVs may drive higher innovation performance than agreements or licenses.
JVs have also been argued to ease coordinated adaptation under uncertainty (Noordewier, John, and Nevin 1990). This is in line with Walker and Weber (1984), who prioritize hierarchical forms over markets when buyers face high technological uncertainty. However, JVs are not a panacea. The uncertainty of developing high-tech products presents significantly different adaptation challenges. Parties to the innovation collaboration may need to frequently change research directions, face unexpected barriers to developing new products, be forced to seek new technology/knowledge to solve intractable problems, and even abandon developed prototypes to reprioritize their R&D portfolio, among other challenges. In line with Balakrishnan and Wernerfelt (1986) and Heide and John (1990), who contend that technological uncertainty favors market-type arrangements, JVs may not be ideal here, as their high bureaucracy and initiation costs potentially frustrate innovation (Lee, Yeung, and Cheng 2009; Sampson 2004a).
In comparison to JVs, agreements have less negotiation and initiation costs in similar situations, and offer more flexibility to firms because they employ decentralized decision-making processes (Sampson 2004b) and are easier to terminate (Oxley 1999). However, while facilitating flow of knowledge between partners, their flexibility makes them vulnerable to appropriation hazards. Although shared outcomes and emergence of mutual hostages could drive some incentive alignment to mitigate these hazards, such alignment is not guaranteed and is dependent on various firm resources (Lane and Lubatkin 1998). Further, agreements tend to specify the domain of the technology collaboration more narrowly than licenses, which allow greater freedom in application of the licensed technology (Oxley 1999). Hence, it is unclear whether agreements would be associated with higher innovation performance than a JV or license. The competing explanations indicate that governance forms have contingent outcomes, and their aggregate impact is best considered an empirical issue.
Functional Capabilities and Innovation Performance
Firms’ MCAPs, TCAPs, and OCAPs are key to their success in developing, manufacturing, and commercializing new products (Danneels 2002). MCAPs are the firm’s ability to sense and understand customer needs and wants better than rivals, and to deploy its marketing-based resources (e.g., ad expenditures, customer relationship) efficiently to satisfy these requirements ahead of competitors (Day 1994; Eshghi, Shahriari, and Ray 2021). MCAPs imply strong market orientation, considered a substantial source of innovative ideas (Dutta, Narasimhan, and Rajiv 1999). Understanding the market dynamics motivates innovation to exploit them ahead of rivals. MCAPs also enable firms to forecast potential returns on their investments in innovation projects and thus allocate resources effectively among them (Zang and Li 2017). TCAPs are a firm's ability to deploy its technological resources (e.g., R&D expenditures) in developing new technologies, and its skills in utilizing various technologies in innovating products and processes to satisfy current and emerging customer needs (Moorman and Slotegraaf 1999). TCAPs enhance a firm's ability to evaluate, acquire, and utilize external knowledge and technologies in developing innovative products. Thus, TCAPs are crucial for achieving superior innovation performance, especially for firms operating in high-tech markets where product life cycles are short and new product introductions are rapid. A firm with superior TCAPs can develop and introduce new products more frequently, faster, and more cheaply than rivals (Dutta, Narasimhan, and Rajiv 1999). OCAPs are a firm's ability to enhance its output through the most efficient use of its production processes, technologies, and coordinating the flow of materials (Krasnikov and Jayachandran 2008). See Table 3 for more details.
Definitions and Construct Details of Functional Capabilities.
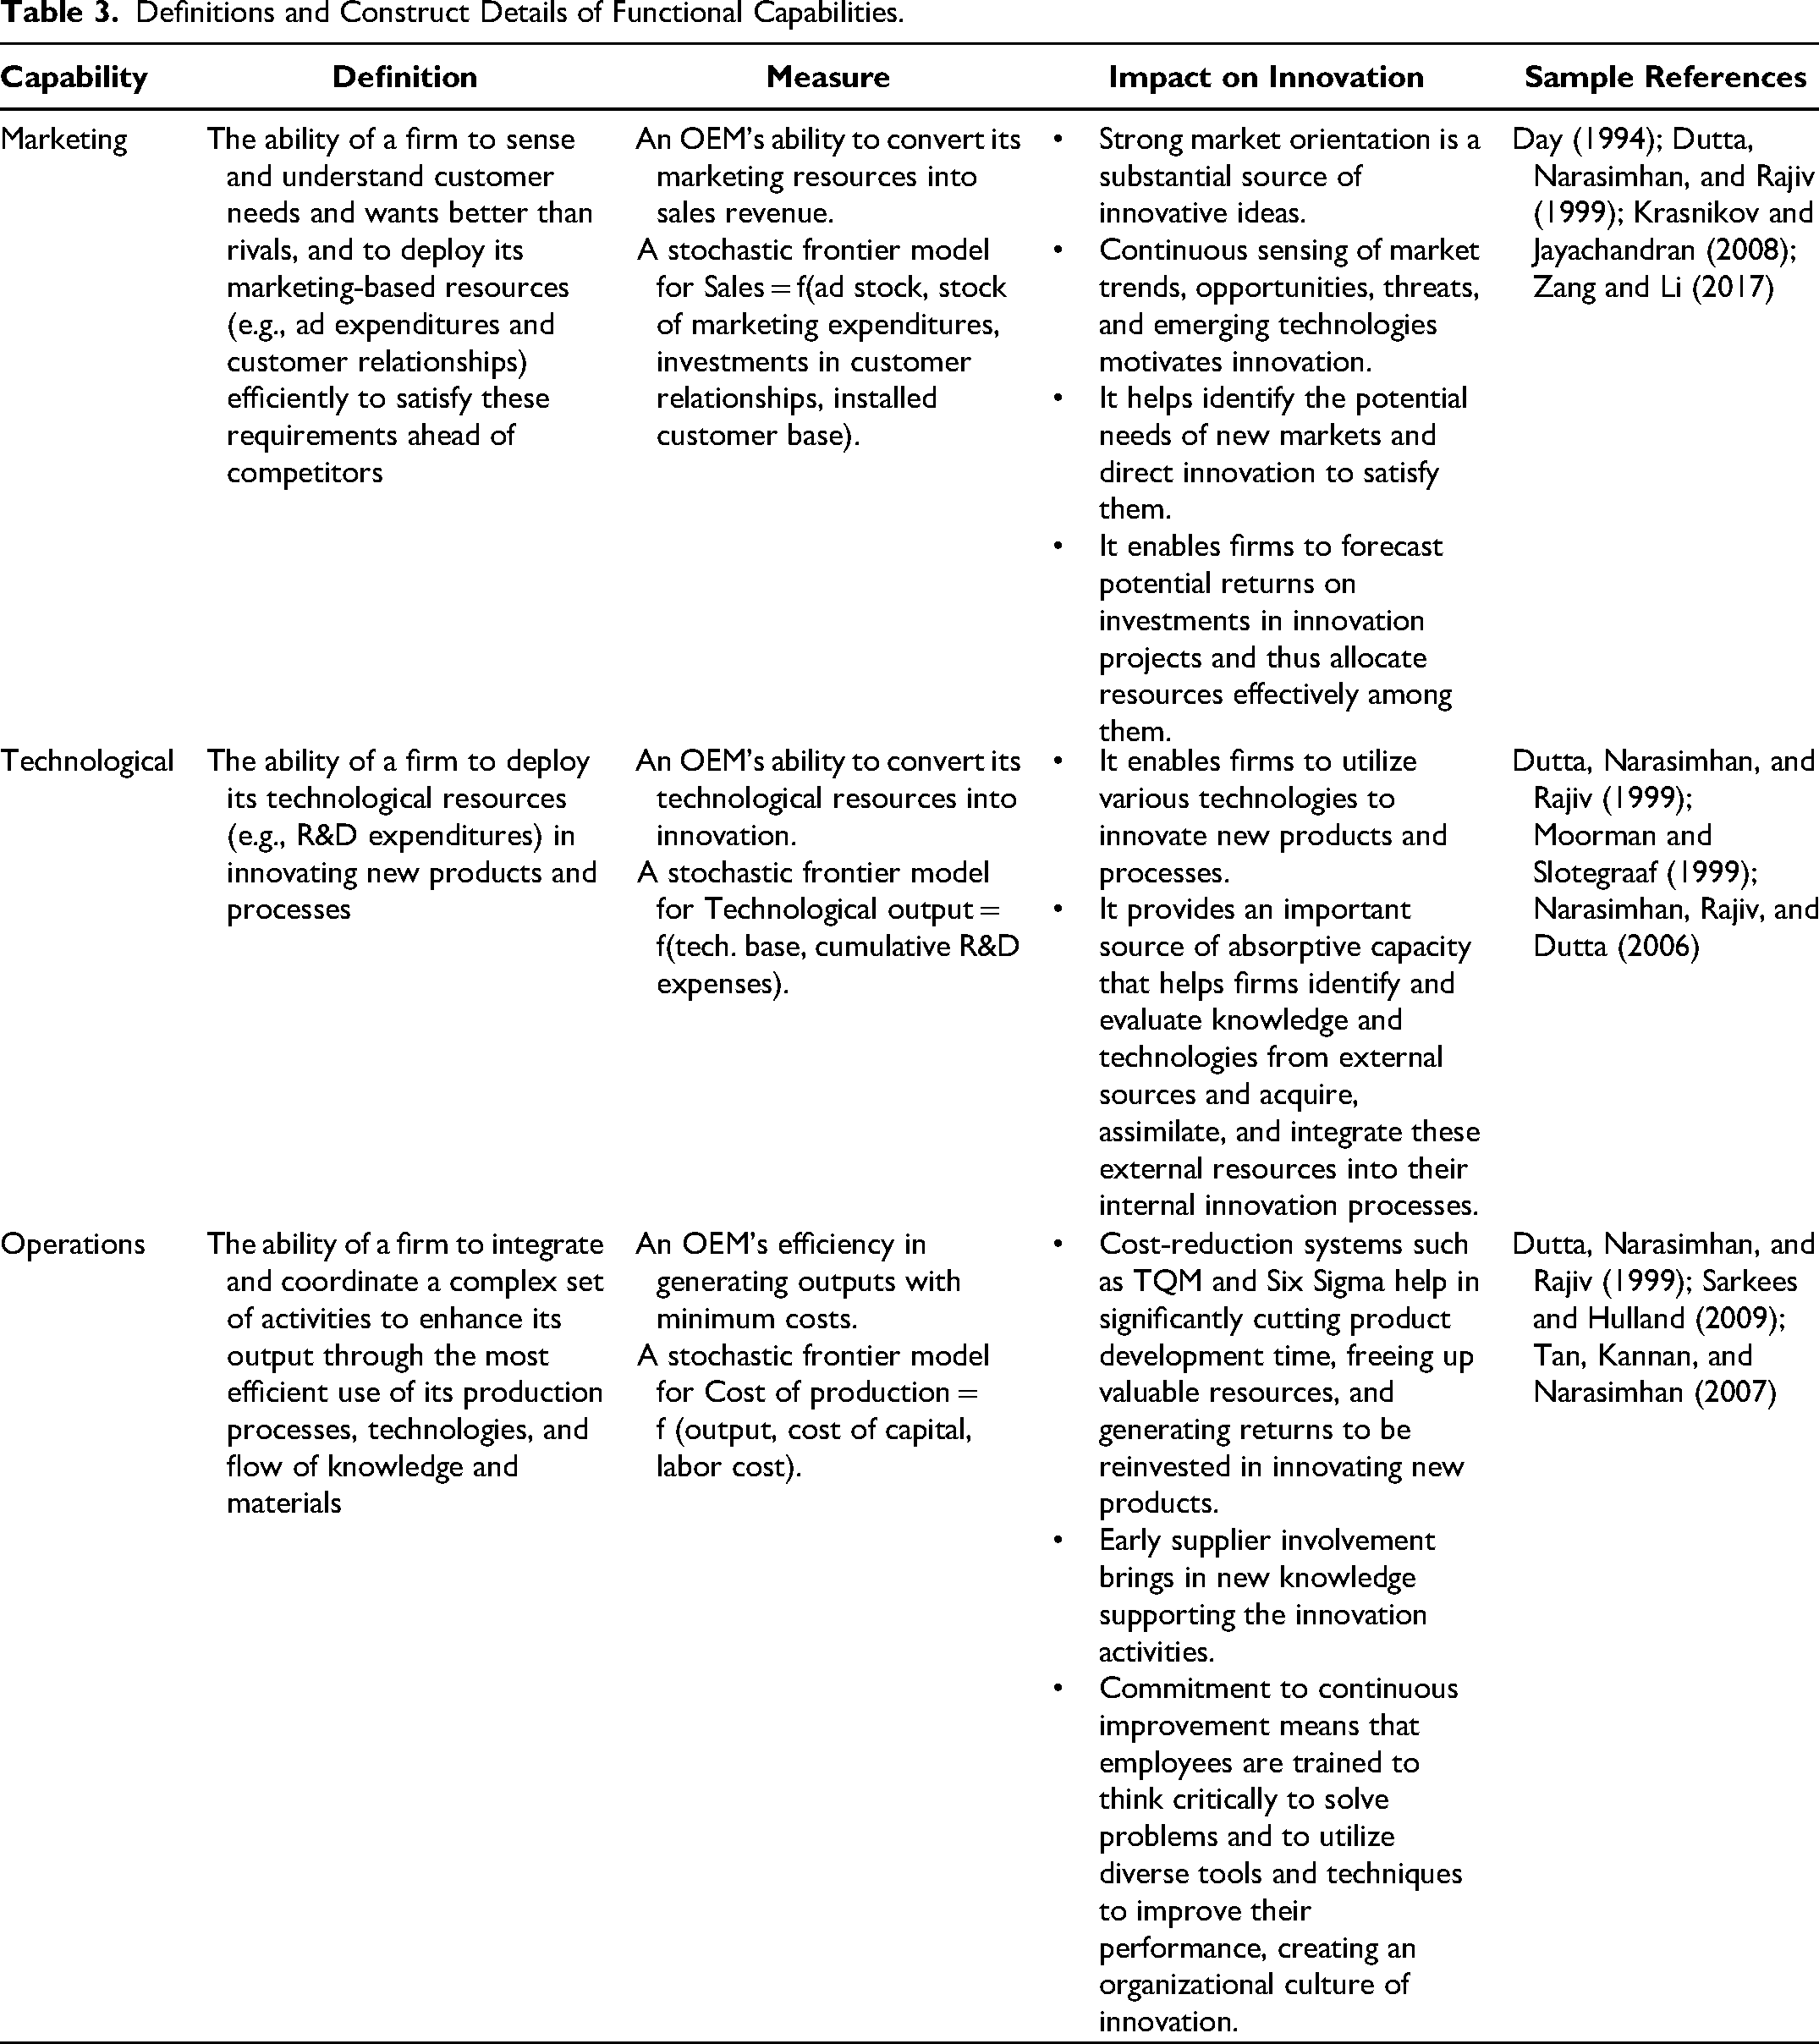
Capabilities do not have immutable impacts and may boost or dampen firm performance differently (Feng, Morgan, and Rego 2017; Krasnikov and Jayachandran 2008). Therefore, we model them simultaneously, focusing only on MCAPs and TCAPs, which are more directly relevant to the codevelopment context, and incorporating OCAPs as a control variable in our analyses. Consistent with the preceding explanations, we expect that each of the MCAPs and TCAPs will be positively associated with innovation performance.
Governance Forms, Functional Capabilities, and Innovation Performance
Firms’ capabilities are key to their sustainable competitive advantage. In structuring any CDC, key considerations would be leveraging these capabilities to create value from the learning and knowledge sharing in the collaboration while avoiding the hazards of misappropriation by the partner. Nevertheless, these capabilities themselves involve unique firm-level resources that must be fully deployed to derive maximum value from the CDCs (Fang, Lee, and Yang 2015). So, while these capabilities may differ in the type of ex post value creation they engender, they present the OEM with significant appropriability concerns. We next discuss how these moderate the outcomes.
MCAPs, governance form, and innovation performance
Strong MCAPs enable firms to identify good opportunities and offset some uncertainty in successful innovation. However, effective exploitation of higher levels of MCAPs involves the firm sharing with its partners increasingly unique and proprietary market/customer knowledge and resources, which can be opportunistically appropriated in the absence of adequate safeguards. For firms more vulnerable to partner opportunism, a hierarchical arrangement, like a JV, offers greater safeguards (Houston and Johnson 2000). So, ceteris paribus, faced with greater appropriability hazards, a high-MCAP firm will be more motivated to engage with its partners and leverage its MCAPs under a JV, compared with the more arm’s-length forms of licenses and agreements (Sampson 2004a). The intense direct interactions with its JV partner afford the firm better opportunity to learn from the partner (Keil et al. 2008), further improving the odds of successful innovation for firms with stronger MCAPs. Thus:
TCAPs, governance forms, and innovation performance
Firms with strong TCAPs face types of trading hazards very similar to those associated with MCAPs because leveraging strong TCAPs could require the firm to exchange increasingly unique and valuable technological knowledge and resources with its suppliers. Consequently, the need for monitoring to prevent opportunistic appropriation of its technological know-how is well recognized (Veugelers 1997). So, ceteris paribus, these greater appropriability hazards would motivate a high-TCAP firm to prefer the better safeguards of a JV arrangement over the more arm’s-length modes of licenses and agreements (Sampson 2004a). Further, the better-coordinated adaptations under JVs will also enable easier absorption of knowledge and expertise in the CDC, complementing the higher levels of technology absorption capacity that comes with higher TCAPs (Berchicci 2013). Thus:
Governance Forms, Capabilities, Strategy, and Innovation Performance
Strategy defines organizational goals, sketches directions for firms’ activities, integrates and motivates efforts, and provides criteria to measure performance. Firms need to be superior at distinctive capabilities to attain their strategic goals (Day 1994), pointing to the need for targeted resources to develop these capabilities. In a collaboration, these shared resources are accompanied by the usual appropriability hazards, pointing to the need for organizing efficient transaction arrangements to enhance joint performance.
We discuss how the fit among strategy, capabilities, and governance might affect innovation performance. In discussing the fit among the three, we take the firm's strategy as given. There are two reasons for this. The first reason is pragmatic. A model in which all three simultaneously impact each other increases the complexity of reasoning, making it difficult to glean sharp takeaways. The second reason is more contextual. While GVA does imply simultaneous causation among the three variables, in many cases, as in our sample, firms make relatively longer-term commitments to their strategies, and are thus not prone to frequent revisions. This allows us to anchor our reasoning on the immutable nature of strategy and explore the interactions.
A high differentiation strategy is mainly centered on idiosyncratic innovations and unique marketing efforts that are difficult to imitate (Svendsen et al. 2011). We focus only on differentiation since it is the most directly relevant strategic posture in our context of product innovation. 5
Market knowledge is crucial for a successful implementation of a differentiation strategy. Collaborations allow firms to access that knowledge (Keil et al. 2008), and firms with strong MCAPs can effectively use their high market sensing for such purpose (Day 1994; Porter 1980). However, just gathering knowledge is not predictive of a successful strategy. A successful high-differentiation strategy must confront the need to quickly adapt to changing market conditions. This need stems from several sources, including frequent changes in competitive product assortments that require the firm to adapt quickly to maintain its differentiation (Harrigan 1988). While a JV facilitates easier knowledge sharing, its relatively higher bureaucracy can get in the way of implementing successful differentiation (Miller 1986).
Differentiation requires a focus on “unique” products. Whereas a flexible environment grants employees more space to be creative to achieve that uniqueness, highly bureaucratic environments might restrain such creativity. The more decentralized forms, in contrast, allow the partners greater flexibility to quickly adapt to changes and seize emerging market opportunities (Sampson 2004b).
Access to diverse knowledge is also a key to the success of differentiation (Merchant 2014). Engaging in several short-term agreements with multiple suppliers offers greater advantages on this count than committing to longer-term JVs with few partners.
So, while a high-MCAP firm may prefer a JV as better suited from the perspective of safeguards, the effectiveness of its differentiation strategy is critically dependent on the firm being able to leverage its superior market sensing and customer understanding without the constraints of JVs. While licenses have some of the flexibility of arm’s-length arrangements, they offer lesser opportunities for the direct interaction and knowledge sharing that characterize agreements. So, given the greater flexibility and knowledge sharing of agreements, high-MCAP firms are naturally able to leverage their stronger information gathering and processing advantages to support the requirements of successful differentiation. Thus:
Note that implementing a high-differentiation strategy also entails producing more “specialized” products, which involves a relatively high degree of knowledge specificity (Merchant 2014; Svendsen et al. 2011). At the same time, and despite such need for specificity, for the strategy to be effective in a competitive scenario, the firm needs to maintain flexibility to produce a broad range of such products, as it responds to market changes, and protect its differentiation advantage. Thus, the firm not only needs to be able to quickly acquire and assimilate external technological knowledge effectively, but also must be able to do so for a dynamic spectrum of diverse technologies as well. High-TCAP firms can effectively evaluate, acquire, and utilize such external knowledge to develop novel products more frequently and rapidly (Berchicci 2013). Nevertheless, a high-differentiation strategy imposes an additional and crucial demand for flexibility. Despite their better safeguarding properties, this makes the more integrated JVs less suited (compared with agreements and licenses) to fully leverage the firm's strong TCAPs for effective differentiation.
Of course, any arm’s-length transactions come with their expected limitations. With the effectiveness of TCAPs residing in the firm's ability to acquire and assimilate knowledge from the collaboration as it engages in innovation, any opportunistic withholding of information (or misinformation) by the partner can easily undermine the firm's innovation outcomes and thus the effectiveness of its differentiation strategy. This becomes a greater concern as effective differentiation may require the firm to make investments in technology that may be very transaction specific, opening it up to even more holdups.
So, on one hand, differentiation-oriented high-TCAP firms face the prospect of not being able to fully leverage their TCAPs in JVs; on the other hand, in the more arm’s-length modes of agreements and licenses they face significant technology-related transactional hazards despite being able to leverage their TCAPs. If a firm could identify these technology-related transaction hazards and proactively address them in well-defined terms, it would mitigate some of the concern. This would require the firm to be well-informed about the technology spectrum and industry trends, have a good grip on possible interdependencies between disparate protocols, and be able to identify diverse usage of the technology to reduce holdups—all characteristics of a firm with strong TCAPs (McGee, Dowling, and Megginson 1995). A high-TCAP firm is more likely to effectively specify the terms of its technological exchanges such that they can be verified, monitored, and enforced without being subjected to protracted renegotiations.
This suggests that, ceteris paribus, a high-TCAP firm may be better positioned to leverage the flexibility required of a high-differentiation strategy with arm’s-length CDCs such as licenses and agreements, as well as to ride out the associated transaction hazards that come with these forms. However, agreements tend to limit the collaboration to already identified objectives (Oxley 1999). Licenses, in contrast, while restricting knowledge transfers outside of the licensed technology, also allow the firm freedom to use the technology in diverse applications. Since high-TCAP firms have strong absorptive capacities, they can still assimilate and effectively integrate diverse external knowledge outside of contracted formal interactions with partners, to identify, sort, and design how the licensed technology will be used in different applications to meet the needs of differentiation. Thus:
Empirical Analyses
Data and Variables
We built our database from several archival sources. From the SDC Platinum database, we identified an initial sample of 428 dyads of high-tech OEMs that formed CDCs with high-tech suppliers between 1985 and 2016. From this, we extracted measures for CDC governance and several control variables. Next, for firms in this sample, we consulted their annual reports and searched other databases (Compustat, Thomson One, Factiva, and Mergent Online) to collect data on firm-specific strategic factors. Then, we searched the U.S. Patent and Trademark Office (USPTO) and ABI/Inform databases to collect data on innovation outcomes. After merging the data, we were left with a final sample of 202 observations. The sample consists of OEMs operating in five high-tech sectors, namely electronics, computer hardware and software, telecommunications, biotech and pharmaceutical, and medical equipment. Approximately 30% of the sample are international, while the majority (about 88%) of the OEMs are U.S. firms. All financial data were standardized to be in millions of U.S. dollars. The average annual revenue of these OEMs is U.S. $20.3 billion, with a standard deviation of U.S. $25.7 billion. About 60% of the OEMs had agreements with suppliers, 28% had licenses, and the rest had established JVs; about 56% had prior experience with similar alliances.
Dependent variables
We measured innovation performance using two indicators. First, for patent citations, we counted the number of patent citations received, in subsequent patents, by each of the patents an OEM filed within one year of establishing the CDC. This indicates the quality of the OEM's inventions. Second, for NPAs, we counted the number of new product launches announced by each OEM within four years of forming the CDC. 6 This indicates the frequency of an OEM's success in converting its inventions into commercial products. Our measures of innovation performance are similar to those used in earlier studies (Cao et al. 2023; Zhang et al. 2010). Number of patents has also often been used as a measure of innovation outcome. However, since historical patent activity is a component of our measure of TCAPs, we exclude it from our estimations. 7 Table 4 summarizes these and other measures.
Measurements of Research Variables.

Independent variables
We categorized the CDCs between OEMs and suppliers into three forms of governance: JVs, codevelopment agreements, and technology licensing contracts (Oxley 1997).
We followed prior studies to measure firms’ functional capabilities using stochastic frontier estimations (Dutta, Narasimhan, and Rajiv 1999; Narasimhan, Rajiv, and Dutta 2006). Details of our estimation procedures and results are in Web Appendix A. For MCAPs, we used sales revenue as an output, and the inputs are current-year advertising expenditures, advertising stock, current-year marketing expenditures, stock of marketing expenditures, investments in customer relationships, and installed customer base. For TCAPs, we considered patent counts to be a technological output, and the inputs are patent stock, current R&D expense, and accumulated R&D expenses from previous years. We also measure OCAPs, subsequently used as a control variable, estimating a cost function to minimize the cost of goods sold, using three inputs: cost of labor, output, and cost of capital.
For product positioning strategy, we draw inspiration from earlier studies (e.g., Banker, Mashruwala, and Tripathy 2014; Mintzberg 1987) that distinguish between intended strategy (i.e., strategy seen as an intended course of action) and realized strategy (i.e., strategy reflected by actual actions resulting from the firm's decisions). While the intended strategy can be captured through perceptual measures of the survey method, the realized strategy cannot be easily inferred without direct observations of the firm's actions, in particular how it deploys and prioritizes its resources. Since it is the realized strategic actions that have a direct bearing on the firm's realized outcomes, it is important to try to capture that in any empirical test relating strategy to outcomes. Albeit not as direct a measure as observation can be, financial data reported by the firm in its annual reports can help us infer the firm’s realized strategy (Banker, Mashruwala, and Tripathy 2014). The idea behind this measurement approach is that a firm would likely dedicate more resources to the activities that are essential to the deployment of its strategy, and these investments would be reflected in its financial statements. At its core, a differentiation-focused strategy is mainly centered on deploying idiosyncratic innovations and unique marketing efforts to create “unique” value for customers that is difficult to imitate. In contrast, an efficiency-focused strategy emphasizes the efficient use of firm resources to gain competitive advantage. Differentiation is the most directly relevant strategic posture in our context of product innovation. However, as argued by Hambric (1983), who uses measures similar to ours, the two strategic orientations of differentiation and efficiency are not mutually exclusive, and a firm can effectively implement both simultaneously. Therefore, it is important to examine their joint impact in our model, and we control for efficiency in our analyses.
Following the measurement approach of Banker, Mashruwala, and Tripathy (2014), who argue that a firm adopting a differentiation strategy would invest more in R&D and marketing activities, we pose the following ratios as indicators for differentiation strategy: selling, general, and administrative expenditures/sales; R&D expenses/sales; and sales/cost of goods sold (COGS). Similarly, following their argument that a firm adopting an efficiency strategy would make the most efficient use of its resources to generate revenue and use as few assets as possible per unit of output, we pose the following as indicators for efficiency strategy: sales/total assets, and sales/capital expenditures. 8 For each of these five ratios, we took its mean over five years to capture the long-term nature of the strategic orientation of an OEM. An exploratory factor analysis of the five ratios confirmed the reliability, and a confirmatory factor analysis attested to the validity of these measures. We then used the factor loadings of each ratio to compute a factor score for each factor. Our measures for the strategies are the respective standardized factor scores (see Web Appendix B for more details).
While we follow Banker, Mashruwala, and Tripathy (2014) to compute them, these measures have potential limitations. For example, sales/COGS may also be seen as part of the efficiency strategy (lowering costs will increase the ratio), and current assets, like accounts receivables, in total assets may be seen as deviating from the spirit of efficiency (accounts receivables are sales but bias the sales/total assets ratio downward). So, for further validation, we test two alternate measures. For the first, we replace sales/total assets with sales/plant and equipment, and for the next, we drop sales/COGS. In both cases, the ratios load as expected on the factors, and our key results remain unchanged. We take these findings as vindication of the robustness of our measures and results (details in Web Appendix C).
Control variables
We measure, as controls, several OEM-specific, supplier-related, and alliance-related variables that might have an impact on innovation performance. Specifically, we measure the year in which the CDC was formed; the high-tech industry in which the OEM operates, the OEM's OCAPs; the OEM's nationality; the OEM's age on the date of partnering; whether the OEM had prior experience with similar collaborations; the scope of the CDC (i.e., whether the CDC was limited to R&D or also included marketing and/or manufacturing); whether the CDC was a domestic alliance or included cross-border partners; the supplier's patents, as a proxy of partner innovativeness; and the market overlap between partners.
Tables 5 and 6 present the descriptive statistics and correlations between our variables. On average, the computer hardware and software sector achieved the highest average number of patents, citations, and NPAs, at 1,012, 25,610, and 60 respectively, whereas the biotech sector scored the lowest average patent counts and citations, at 52 and 1,053 respectively. The medical equipment sector had the lowest average number of NPAs at just 2. However, it formed more JVs (35% of the sector) than the other sectors, whereas electronics firms tended to utilize agreements more (70% of the sector) than the others. The biotech sector had the highest percentage of licenses at about 47%. In addition, differentiation strategy was most prominent for biotech firms, whereas efficiency focus was most prominent for medical equipment firms. We also assessed multicollinearity between our variables by running variance inflation factor tests using a log-transformed version of our models. Results are reported in Web Appendix D.
Correlation Matrix and Descriptive Statistics.

*Significant at 95%.
Sample Characteristics by the High-Tech Sector.


Model Specification and Estimation
Our basic approach to estimating our hypothesized effects is to model the impact of governance, capabilities, and strategy, and their interactions, on innovation performance. We take a stepwise approach to this by estimating the following four equations:


Generalized linear models
Since our dependent variables are counts, we used the generalized linear models (GLMs) for our estimations, assuming a negative binomial distribution (Nelder and Wedderburn 1972). 10
Clustered standard errors
Our sample covered the period 1985–2016, and an OEM may have multiple CDCs with suppliers in that period. Therefore, we estimate our models using the cluster-robust standard errors, which allows errors within individual clusters (i.e., OEMs) to be correlated while keeping errors across clusters independent (Cameron and Trivedi 2010, p. 313).
Endogeneity: mixed approach—Gaussian copula and two-stage residual inclusion
There may be several sources of endogeneity in our specifications. Unobserved factors that may determine a firm's innovation outcomes may constrain its choice of marketing strategy. A firm could also adjust its strategy, based on the observed outcomes. These could make strategy potentially endogenous. Nevertheless, a firm's positioning strategy is a long-term commitment toward forming a specific image in the market, which is not prone to frequent adjustments (Ghosh and John 2005). Thus, the endogeneity in question here is more likely to be pertinent for more temporal tactical adjustments in the firm's marketing mix, which do not impact its core positioning. Further, we estimated positioning strategy using data over the five years before the collaboration year, ruling out any potential contemporaneous impact. Thus, positioning strategy is considered exogenous.
Reverse causality between the regressors and the dependent variable can also be a source of endogeneity. To rule this out, we measure innovation performance one year after the collaboration, whereas other regressors including governance and capabilities are measured in the year of collaboration.
Nevertheless, it is difficult to rule out all sources of endogeneity, especially for governance and capabilities. Several unobserved variables (e.g., management competency, idiosyncratic local market conditions) could simultaneously impact choice of governance, investment in capabilities, and innovation performance, necessitating endogeneity corrections. Given the different types of these potentially endogenous variables, we used mixed methods (i.e., the Gaussian copula and two-stage residual inclusion methods) to correct for such endogeneity.
First, we utilized the instrument-free Gaussian copula method to correct for potential endogeneity in the continuous variables (functional capabilities). Park and Gupta’s (2012) semiparametric copula method constructs the joint distribution of the endogenous variable and the error term from the individual marginal distributions. While this method assumes that the structural error term is normally distributed, the results have been shown to be robust to other distributions as well (Park and Gupta 2012). 11 It also requires the distribution of the endogenous variable to be nonnormal; our endogenous variables satisfy this condition, as the results of the Shapiro–Wilk normality test confirm that none of the functional capabilities are normally distributed (see Web Appendix G). Following Carson and Ghosh (2019), we estimated copula terms for each of our endogenous capabilities variables using the formula Cv = Φ−1(H(v)), where Cv is the copula term for an endogenous variable (v), Φ−1 is the inverse normal cumulative distribution function, H is the kernel cumulative density function, and v is the endogenous regressor. Then, we added these terms as control variables to Models 3 and 4. This control function approach for endogeneity correction follows Rutz and Watson’s (2019) recommendations for nonlinear models. 12
Second, we implemented another control function method to correct for potential endogeneity in our categorical variable, governance. We employed the two-stage residual inclusion method suggested by Terza, Basu, and Rathouz (2008) and Wooldridge (2015). This method depends on using a valid instrument that is correlated with the endogenous variable, but uncorrelated with the dependent variable. We used two instrumental variables to estimate the first-stage model: cross-technology transfer and coefficient of variation in OEMs’ sizes. Cross-technology transfer is a binary variable indicating whether a CDC's deal included an agreement between the partners to exchange technology. Firms committed to this are more likely to make specific investments to facilitate the technology transfer process. After assimilating and internalizing the acquired technology, the switching costs would be high, and thus each partner would be more likely to avoid opportunistic actions. This might affect the choice of the governance form, but it should have no impact on innovation performance of an OEM. The coefficient of variation in OEMs’ sizes is calculated from the firms’ total assets. A firm's size dispersion from rivals might drive the choice of a particular collaboration form. Smaller firms might prefer to form JVs to gain more assets and be competitive in their markets. Larger firms, in contrast, might have strong bargaining power that makes market-like contracts more appealing to them. Yet this size dispersion should not affect innovation performance of a firm.
We implemented the two-stage residual inclusion method in three steps: First, we ran a first-stage multinomial logistic regression model for governance using our two instruments along with all other regressors appearing on the right-hand side of Equation 3 and the copula terms controlling for endogeneity in functional capabilities. Second, we estimated the predicted probabilities of this model and subtracted the observed values from it to get the residuals. Third, we then added the computed residual as an additional regressor to Equation 3. We repeated the steps for the three-way interaction model in Equation 4. Results of the first-stage multinomial logit models are in Web Appendix G. After adding copula terms and control functions, our adjusted Models 3 and 4 are as follows:
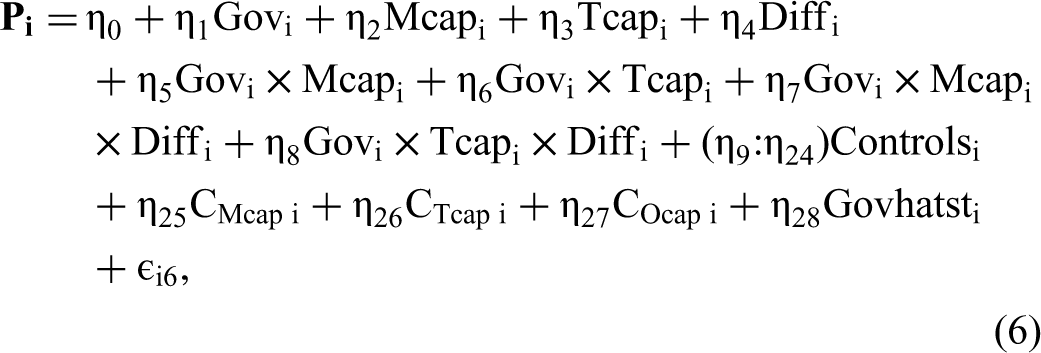
Results
We present our estimations and results in four steps. First, we estimate Equation 1 for each of the innovation performance indicators, including only the governance modes as regressors in addition to the control variables. Second, we estimate Equation 2, including only the capabilities as regressors in addition to the control variables. Third, we estimate Equations 3 and 5 with the two-way interactions between governance and capabilities added to the model. We estimate both the baseline GLM (Equation 3), without endogeneity corrections, and an adjusted GLM (Equation 5), with the endogeneity corrections. Fourth, we estimate Equations 4 and 6 with the three-way interactions included, estimating both the baseline GLM (Equation 4) and the adjusted GLM (Equation 6) that includes the endogeneity corrections. We summarize the results of the first two phases here and present detailed results in Web Appendix H. Our results pertaining to the contingent effects are presented in Tables 7 and 8.
The Two-Way Interaction Between Governance Forms and Firm Capabilities.

*p < .1. **p < .05. ***p < .01.
Notes: Standard errors are in parentheses.
The Three-Way Interaction of Governance, Firm Capabilities, and Strategy.

*p < .1. **p < .05. ***p < .01.
Notes: Standard errors are in parentheses.
Results of direct impact of CDC governance forms and functional capabilities
In our first estimation, we find that the aggregate marginal impacts of all governance modes are significantly positive. Each unit increase in JVs, agreements, and licenses is associated with an increase in the number of citations by about 4,905, 8,076 and 7,321, respectively. Agreements are associated with 30% more NPAs than licenses, and no significant differences between agreements and JVs. In our second estimation, we find that both MCAPs and TCAPs are positively associated with innovation performance. A 1% increase in MCAPs is associated with a 4.9% and 3.9% increase in citations and NPAs, respectively. Similarly, a 1% increase in TCAPs is associated with a 5.7% and 1.6% increase in citations and NPAs, respectively (detailed results in Web Appendix H).
In Figure 2, we plot the predicted innovation performance values based on the estimated coefficients of Equation 2 calculated at the means of all other variables. Note the positive slopes of MCAPs and TCAPs for the two indicators. Citations are higher for firms with high levels of TCAPs, whereas NPAs seem to be higher for firms with high levels of MCAPs.

Sample Effects on Innovation Performance: The Relationship Between Capabilities and Innovation Performance.
Results of two-way interactions: capabilities × governance
Next, we estimate governance and capabilities simultaneously, and their relationship with innovation performance to test H1 and H2 (see Table 7). Our baseline model in Panel A shows that agreements are associated with higher innovation performance than JVs, whereas there is no support for it in the adjusted model in Panel B. We also find support for the positive relationships between each of MCAPs and TCAPs and innovation performance once again in both the baseline and adjusted models. Table 7 also illustrates the two-way interaction effects of governance and capabilities.
The baseline model confirms that JVs are associated with the highest innovation performance for firms with strong MCAPs. For example, the baseline model shows that for JVs, a 1% increase in MCAPs is associated with 7.5% more citations and 10.2% more NPAs over that of agreements, and 9.7% more NPAs over that of licenses. Although the adjusted model conveys that for JVs, a 1% increase in MCAPs is associated with 9.8% more citations and 9.3% more NPAs over agreements, it also has a more positive, but not significant, relationship over licenses. These results offer partial support for H1, which suggests that for firms with high MCAPs, JVs are associated with higher innovation performance than both agreements and licenses. Although the baseline model coefficients are largely insignificant for the interactions with TCAPs, after correcting for endogeneity the adjusted model returns several significant coefficients. In particular, we find that a 1% increase in TCAPs for agreements is associated with 6.4% and 2.9% more citations than JVs and licenses, respectively. Thus, we reject H2, with agreements being associated with higher innovation performance than both JVs and licenses, for firms with stronger TCAPs. We speculate that in spite of the fact that firms with higher TCAPs may face similar types of trading hazards associated with high MCAPs, strong TCAPs of the type alluded to in our discussions preceding H4 might enable firms to leverage their superior technological expertise to mitigate such hazards.
To illustrate the results, in Figure 3, we plot the predicted number of citations against the capabilities at the mean of other variables, for different governance modes, based on estimations of Equation 5. Observe that at high values of MCAPs, JVs generate higher citations than agreements and licenses. In contrast, note that for firms with higher TCAPs, agreements generate higher citations than other modes.

Sample Effects on Innovation Performance: Two-Way Interactions.
Results of three-way interactions: capabilities × governance × strategy
Finally, we include the three-way interactions of governance, capabilities, and strategy to test H3 and H4 (see Table 8). Interpretations of the three-way interactions are more involved. In H3, we hypothesized that for differentiation-oriented firms, agreements would outperform JVs or licenses at higher levels of MCAPs. The significant coefficients of JV × MCAP × Differentiation in Panel C suggest that for JVs, each unit increase in MCAPs and differentiation is associated with 9.3% and 9.1% fewer citations and NPAs, respectively. In contrast, looking at the coefficients for Agreement × MCAP × Differentiation, we find that under the same conditions, for agreements, it is associated with an increase of 9.6% in citations (and no significant results for NPAs). In comparison, the coefficient for License × MCAP × Differentiation suggests that for licenses, the increase would be on the order of 7.8% for citations (not significant for NPAs). The corresponding coefficient in the endogeneity-adjusted model suggests that it is only for agreements that differentiation is associated with higher innovation performance of 7.8% more citations (no significance for others). We infer that these offer overall strong support for H3.
The results for the three-way interactions involving TCAPs lead us to reject H4. In particular, the coefficients for License × TCAP × Differentiation show, in both the baseline and the endogeneity-corrected model, that each unit increase in TCAPs and differentiation is associated with less innovation performance (2.3% and 1.8% fewer citations). So, we speculate that beyond the need for flexibility, a high-differentiation strategy may invoke additional appropriation hazards for high-TCAP firms. This could result from the need to develop product technologies that are highly specific to achieve differentiation. In arm’s-length CDCs such as licenses, the holdups accompanying high-TCAP firms may thus be magnified under a high-differentiation strategy. While such firms may effectively identify technologies for better product differentiation, contrary to our expectations, they may not be as effective in managing the significant holdups that may arise here.
The preceding result offers an interesting foil to the results we observe with regard to H2. High-TCAP firms would be better at qualifying partners and their associated technology complement, as well as deploying their superior knowledge and technology absorption to achieve higher value creation and lower transaction hazards (Berchicci 2013). Ceteris paribus, this allows the firm to seek the greater efficiencies of bureaucratic costs in more arm’s-length modes of agreements or licenses compared with JVs (Houston and Johnson 2000). However, the superior absorptive capacity that supports enhanced organizational learning and knowledge development offers both the ability and the incentive to develop product technologies that may be highly specific and thus open to appropriation hazards, muting the desirability of arm’s-length CDC modes. This contingent impact is the crux of our article.
Among interactions not hypothesized, we find that for efficiency-oriented firms, both JVs and agreements are associated with fewer citations and NPAs at higher levels of MCAPs, and at higher levels of TCAPs, JVs are associated with higher NPAs. Agreements are associated with fewer NPAs, and JVs are associated with greater citations at higher levels of OCAPs.
The other results offer deeper insights into our previous results. While the baseline model, in Panel C, shows that agreements generate higher innovation performance than JVs and licenses, the adjusted model shows no significant differences among the impacts of the governance modes. This highlights the contingent efficiency of the governance forms, which is a central plank of our theory.
Both the baseline and the adjusted models confirm the positive relationships between each of MCAPs and TCAPs and innovation performance; however, these relationships are insignificant in the adjusted model. The two-way interactions between governance and capabilities are consistent with our previous observations, albeit to a lesser degree. For example, the JV × MCAP coefficient is significant only for citations in the baseline model, such that for JVs, a 1% increase in MCAPs is associated with an increase of 1.3% in citations over that of agreements, the other results being not significant. While the relevant interaction terms are insignificant in the baseline model, the TCAP interaction terms in the endogeneity-adjusted model show that with increasing TCAPs, agreements are associated with 8.5% more citations than JVs. However, the difference is not significant with respect to licenses.
To illustrate the three-way interactions, in Figure 4 we plot the predicted innovation performance indicator, calculated using the estimated coefficients of Equation 6, against the capabilities for each governance form, once each for high and low values of the firm's positioning strategy (based on a median split of the strategy measures). 13 The predictions are calculated at the mean of the other variables. We only plot some of the significant results. In Panels A and B of Figure 4, note that both agreements and licenses result in higher citations for highly differentiation-oriented firms with high levels of MCAPs. However, for less differentiation-oriented firms, that is no longer the case, and agreements are dominated by JVs. JVs are also associated with higher NPAs for highly efficiency-oriented firms with strong TCAPs. Note that the advantage of JVs over the other forms does not hold for less efficiency-oriented firms, as agreements dominate at high levels of TCAPs. While these are consistent with our hypothesized effects, the broader point is that the fit of strategy, capabilities, and governance modes enhances the firm's innovation performance; conversely, misalignments bleed value. Thus, to claim that any one form, such as JVs, would always be more effective would be wrong.

Sample Effects on Innovation Performance: Three-Way Interactions.
Discussion
At the core of any strategic decision taken by firms are the presumed value generated from the implementation of the decision and the presumed costs to be incurred in the process. To the extent innovation codevelopments are seen as contributing to the firm's broader marketing strategy, one dominant managerial concern should be whether any strategy dividend will be sustained by such contracts. The strategy dividend can be whittled away by the transaction costs of misaligned contracts, as well as misaligned sunk costs in functional capabilities. Thus, the fit between the firm's strategic positioning, its functional capabilities, and the codevelopment governance modes is critical. To that end, one of the key contributions of our results is that they help calibrate the costs of misalignments and thus offer an evidentiary base for decision making on innovation collaborations with suppliers.
Consider, for example, industry observations that JV partnerships can help firms navigate economic downturns (Bamford, Baynham, and Ernst 2020). Economic downturns impose a need for cost efficiencies, and JVs can help achieve that through the more integrated equity participation involved. Yet, as our hypotheses and results show, this economic dividend can only be realized when firms have high levels of TCAPs. We estimate that, for firms with similar efficiency orientations, TCAPs are associated with an increase of 5.2% in NPAs for JVs, but not for licensing and agreements. In contrast, estimates show that strong MCAPs in the same situation are associated with a 17.9% decrease in citations for JVs. Nevertheless, MCAPs seem to be more benign for agreements in highly differentiation-oriented firms. For such firms, MCAPs are associated with an increase of 7.8% in agreements. Indeed, going back to Porter (1980), while MCAPs can be seen as vital for implementing a differentiation strategy, they may be incongruent with an efficiency focus. Thus, one of our central themes is that the idea of fit in CDCs comes with underlying notions of misalignment costs, which need to be recognized. 14
In mapping these bases of misalignment, we draw on a more granular spectrum of contractual arrangements in the domain, building on studies like Noordhoff et al. (2011), which studied binary relational versus transactional modes of collaboration. In a similar vein, we also use the spectrum of functional capabilities in our model. While their critical role in driving firm performance is recognized, they have rarely been studied together in the context of innovation codevelopments. In this, our work complements studies that do (e.g., Fang, Lee, and Yang 2015). An underlying rationale for studying the spectrum of capabilities is the idea that the payoffs from these capabilities are not immutable. Some of these payoffs can be lost at higher levels, further underscoring their misalignment costs. Nevertheless, there are resources vested in these capabilities, and at high levels, firms would be driven to safeguard them by aligning their contracts, balancing safeguarding needs with the value to be gleaned from the collaboration type: JVs for firms with high MCAPs and agreements for firms with high TCAPs.
Perhaps our signature contribution to mapping the bases of misalignment in innovation collaborations is in highlighting the keystone role of the firm's positioning strategy. By itself this should not be surprising, for strategy frames how a firm deploys its resources and focuses its energies. So, a misalignment will naturally manifest in deadweight losses, perhaps a loss that will emerge over time. What is surprising, however, is the near absence of studies examining the role of strategy in effectiveness of innovation collaborations. Thus, by considering the firm's positioning strategy, we build a distinct dimension of fit and misalignment that has been missing in the innovation codevelopment literature. In this, we borrow from and offer further validation of the governance value approach that frames misalignments as the net of transactional (in)efficiency and the strategy dividend (Ghosh and John 1999). As the empirical results bear out, this is for good measure: misalignment between contracts, capabilities, and strategy significantly erodes innovation outcomes.
Managerial Implications
We offer three key managerial takeaways. First, our findings identify the appropriate codevelopment arrangements for superior innovation performance, given existing firm capabilities and positioning strategy. This minimizes misalignment costs while easing the process of generating and sharing value. So, as firms focus on motivating partners to share know-how and expertise and facilitating efficient knowledge transfers, they must also pay attention to protecting the firm's valuable knowledge and skills from opportunistic appropriation and ensure effective use of its deployed resources, for better innovation outcomes. Second, our results provide guidance for building the “right” functional capability to yield the most benefit from innovation collaborations. For instance, we suggest that a firm needs to invest in building MCAPs if it is driven by high differentiation and considering more arm’s-length arrangements such as agreements with suppliers. In contrast, our results suggest that firms driven by efficiency considerations are better off developing their TCAPs when considering a JV. Third, our results warn against blindly copying the practices of other firms, regardless of the appearance of “industry best practices.” Particularly, we find that considering the firm's positioning strategy along with its capabilities is crucial to designing effective contracts. Thus, blanket prescriptions for one type of contract or the other (e.g., JVs during downturns) may be misdirected.
Limitations and Further Research
One key substantive limitation of our study is it does not consider the relational modes of collaborations. We call for future studies in this area given the long history of research on the role of relational governance for collaboration outcomes (Poppo and Zenger 2002). Future studies should also investigate frameworks that differentiate between different innovation outcomes (e.g., patents, citations, NPAs); our framework does not have that level of granularity. We also call for studying other conceptualizations of strategies, beyond the product differentiation that we study. We believe that such research will help map a wider spectrum of misalignment costs. Empirically, while we control for supplier innovativeness and market overlap between partners, the OEM-side-only nature of our data is a limitation. Future studies with dyadic data could investigate the role of suppliers’ capabilities and how that may complement the focal firms’ capabilities in identifying the “right” CDC form for better mutual outcomes. Another data limitation is that we lack explicit measures of transaction attributes (we use proxies, e.g., cross-technology transfer for asset specificity in the first stage of the governance model, and the year of collaboration for economic uncertainty). In our already complex empirical framework, adding these would have compounded the research challenges. Our research already generates significant insights at the interface of governance, capabilities, and strategy, so the incompleteness was a trade-off against the distraction of even greater complexity. We hope future studies will tackle this with more granular transaction-level data such as (1) specific assets invested by each partner to facilitate the exchange and deployment of knowledge and technologies, (2) technological uncertainty pertaining to the acquired technologies and their related problems of ex ante considerations of value and performance, and (3) previous ties between the collaboration's partners. We also hope future research will improve on our estimations, in finding efficient ways of using nonlinear simultaneous equations with multiple innovation outcomes, for models with a mix of count, categorical, and continuous variables.
Supplemental Material
sj-pdf-1-jmx-10.1177_00222429231222269 - Supplemental material for Collaborating to Innovate: Balancing Strategy Dividend and Transactional Efficiencies
Supplemental material, sj-pdf-1-jmx-10.1177_00222429231222269 for Collaborating to Innovate: Balancing Strategy Dividend and Transactional Efficiencies by Nehal Elhelaly and Sourav Ray in Journal of Marketing
Footnotes
Acknowledgments
The authors sincerely thank the JM review team for their insightful feedback and constructive guidance throughout the review process. They also thank the attendees and reviewers of the following for their comments on earlier versions of the work: the 2018 Empirical and Theoretical (ET) Symposium (Guelph, Ontario), the 2019 Marketing Strategy Consortium (Bloomington, Indiana), the 2019 Institute for the Study of Business Markets Doctoral Award Competition, the 2021 marketing research workshop at the McMaster University DeGroote School of Business, and the 2022 Winter AMA Conference (Las Vegas, Nevada).
Coeditor
Detelina Marinova
Associate Editor
Jan B. Heide
Declaration of Conflicting Interests
The author(s) declared no potential conflicts of interest with respect to the research, authorship, and/or publication of this article.
Funding
The authors acknowledge the financial support granted to Nehal Elhelaly from the Egyptian Ministry of Higher Education and Scientific Research and from the Canadian Social Sciences and Humanities Research Council, and McMaster University's Art Research Board funding to Sourav Ray.
Notes
References
Supplementary Material
Please find the following supplemental material available below.
For Open Access articles published under a Creative Commons License, all supplemental material carries the same license as the article it is associated with.
For non-Open Access articles published, all supplemental material carries a non-exclusive license, and permission requests for re-use of supplemental material or any part of supplemental material shall be sent directly to the copyright owner as specified in the copyright notice associated with the article.