
Abstract
Increased consumer demand for healthier product options and looming regulation have prompted many consumer goods brands to adjust the amount of sugar content in their product lines, including adding products with reduced sugar content or smaller package sizes. Even as brands adopt such practices, little guidance exists for how they should do so to protect or enhance their brand performance. This research studies whether and when sugar reduction strategies affect sales. The analysis of almost 130,000 product additions by nearly 80 brands over 11 years in the U.S. soda category shows that, on average, products with sugar content reductions perform comparably to similar products without reduced sugar content, while smaller package sizes perform better. Importantly, these effects depend substantially on product labeling, branding, and packaging decisions. By accounting for these contingent effects, this study establishes win–win conditions, in which brands realize higher volume sales while category-level sugar sales decrease. In doing so, the study sheds light on how marketing can bridge brands’ sales objective with society's health focus, doing well and doing good simultaneously.
Keywords
We are, beyond question, the greatest sugar-consumers in the world, and many of our diseases may be attributed to too free a use of sweet food. Let there be an attempt made to bring about a moderate reformation in this respect. It will be certain to have a good financial effect if none other.
Despite clear evidence of the negative consequences of excessive sugar consumption, consumers’ intake has steadily increased. It is higher than might have been anticipated by 19th-century journalists and far in excess of Food and Drug Administration recommendations (Food and Drug Administration 2016). This is a costly indulgence. Excessive sugar consumption induces severe illnesses that increase health care costs (Hu 2013; Ma, Ailawadi, and Grewal 2013), and research suggests that reducing sugar in consumer packaged goods (CPG) in the United States by a modest 8%–10% could lead to savings of more than $110 billion in health care costs (Huang et al. 2019).
To that end, an estimated 58% of U.S. adults indicate a desire to cut back on sugar to avoid obesity, diabetes, and heart conditions (Prentice 2016). However, this demand-side view is not sufficient. We follow Moorman, Ferraro, and Huber (2012) by arguing that manufacturers of CPG may play a key role in achieving this goal.
The challenge lies in the fact that while CPG manufacturers and retailers feel the pressure to make sugar reductions, they are also motivated to protect and increase their sales level, two motives that will conflict if consumers reject reduced-sugar product alternatives. As the “war on sugar” (Cardello 2017) rages on, CPG manufacturers seek sweet spots (pun intended) that allow them to maintain their sales levels without harming society, that is, engage in responsible retailing. To this end, hundreds of CPG companies have announced reductions of unhealthy ingredients, including sugar, in a sizable portion of their stockkeeping units (SKUs) (Chambers 2017).
To lower total sugar content across a product line, 1 brands might adopt two different strategies: (1) sugar content reduction and (2) package size reduction. We study these sugar reduction efforts in the soda category in the United States (the country with the highest per capita sugar intake globally). Sodas are the greatest source of added sugars in people's diets (Drewnowski and Rehm 2014), so they evoke close regulatory scrutiny.
A sugar content reduction involves launching a new product that contains no sugar or less sugar than current products. This tactic is currently being implemented by all major players in the soda sector as confirmed in interviews with executives at three leading soda manufacturers. 2 For example, in 2011, PepsiCo introduced Pepsi Next, which has about half the sugar of regular Pepsi products (Arthur 2015). A package size reduction involves brands introducing smaller package sizes that help consumers cut back on their sugar intake. The brand's average (relative) sugar content across its product line remains the same in this case, but consumers’ absolute intake diminishes. Prominent use of this tactic appeared in the introduction of 7.5 oz. mini sizes by many soda brands.
Unfortunately, the literature lacks theoretical or empirical insight into these sales outcomes, which leaves brand managers in a difficult situation when considering the use of sugar-reduction strategies. Further, evidence from practice points to the fact that some existing sugar reductions have achieved success (e.g., Coca-Cola Zero Sugar, 7.5 oz. mini size), but others have failed (e.g., many midsugar lines such as Pepsi Next; package sizes such as 12.5 oz. versions).
We examine the direct effects of these sugar reduction strategies, while also proposing that their effect depends on product-related strategy decisions involving labeling, branding, and packaging that change the calculus of benefits. First, with respect to labeling, brand manufacturers must decide which product claims to feature. Claims of the presence or absence of un(healthy) ingredients can signal enjoyment and/or healthiness (André, Chandon, and Haws 2019; Zlatevska et al. 2019). For example, Pepsi emphasizes enjoyment and highlights the use of sugar for select SKUs (e.g., “Made with Real Sugar”), whereas Mountain Dew has highlighted the absence of sugars for several of its SKUs (e.g., “Zero Sugar”). Second, branding decisions determine whether reduced-sugar products are launched under a mini or diet subbrand—which is consistent with the sugar reduction strategy—or the main brand. For example, Coca-Cola recently launched zero-sugar products under the Coca-Cola name, not a subbrand such as Coke Zero (Arthur 2018). Third, packaging decisions, such as the number of products per pack, also matter. Single items limit consumption, which is consistent with the package size reduction, whereas multipacks give consumers stock for continued consumption. We show that these strategy decisions have important moderating effects on how the sugar reduction strategy affects sales.
Our approach offers the following contributions. First, we analyze the effect of sugar reduction efforts on product sales and assess the moderating role of product strategies. Second, we quantify the effects of sugar reduction efforts on brand sales and decompose these effects into primary demand and secondary demand (i.e., within- and across-brand switching). Third, we document the effect of sugar reduction efforts on sugar sales in the category to identify win–win scenarios that benefit both brands (more volume sales) and policy makers (less category sugars sold).
To analyze the implications of introducing SKUs that reduce the total sugar offered in soda brand portfolios, we match 11 years (2006–2016) of quarterly store scanner sales data from Nielsen with extensive product-level nutritional information from Label Insight. With a survey, we also gather fine-grained measures of the product claims promoted on soda packages. By combining these complementary data sets, we establish the effects of sugar reduction efforts on volume and sugar sales across entire product lines in the soda category in local U.S. markets. This assessment at the category level enables us to find potential win–win scenarios in which brands achieve more volume sales, while society receives the benefits of reduced sugar sales.
Sugar Reduction Strategies and SKU Sales
Figure 1 presents our framework. We begin by considering the direct effect of sugar content and package size reductions (i.e., additions with a lower value than the brand's average) on SKU sales, compared with the impact of SKU additions that do not reduce sugar on SKU sales. We then consider the moderating influence of the three product strategies firms can deploy in their sugar reduction strategy on the effect of the sugar reduction strategy on SKU sales.

Conceptual Framework of the Effect of Sugar Reduction on Sales.
Direct Effects of Sugar Content Reductions and Package Size Reductions
Although there is an absence of work on sugar content reductions, research on package size reductions provides some insights into its possible effects on sales. Game-theoretical work focused on the economics of offering smaller packages and finds that consumption depends on the degree to which consumers attempt to exert self-control and may even increase (Jain 2012). In an empirical study of the effect of package size reductions on brand (rather than SKU) sales, Çakır and Balagtas (2014) show that consumers in a single selected city react to package size reductions in the bulk ice cream category by buying fewer units. Thus, the current literature lacks a comprehensive view of how lower sugar content and smaller package sizes influence SKU sales across various characteristics of the introduced SKUs.
We argue that both sugar content reductions and package size reductions offer health benefits. Ceteris paribus, less sugar should be perceived as healthier and exert a positive effect on sales. However, whereas the taste of the product remains the same for package size reductions, taste is influenced for sugar content reductions. Consumers may dislike the taste of products with less sugar due to their innate preference for sweet tastes (Conner et al. 1988). Moreover, in some cases artificial sweeteners are used to reduce sugar content, yet many consumers express concerns about seemingly unnatural ingredients or report their dislike for the aftertaste that some artificial sweeteners provide (Allen et al. 2013). Given that the positive health effect may be offset by a negative taste effect, the direct effect of sugar content reductions on SKU sales is not clear, a priori. However, as package size reductions offer health benefits with no change in taste and offer potentially new consumption moments (e.g., “on-the-go”), we expect a positive direct effect on SKU sales.
Moderating Role of Product Characteristics in Sugar Reduction Effects
In line with Kotler, Armstrong, and Opresnik’s (2017) product strategy typology, we assess the moderating effects of six labeling, branding, and packaging elements. First, in terms of labeling, we examine how the use of (1) enjoyment-oriented and (2) health-oriented product claims influence the impact of both sugar content and package size reductions on SKU sales. Second, we study the impact of two branding strategy decisions on the effect of sugar content reductions on SKU sales: (3) using a dedicated diet subbrand (vs. using the main product line brand) and (4) using a dedicated mini size (vs. using the main product line). Finally, we study the impact of two packaging strategy decisions on the effect of package size reductions on SKU sales: (5) introducing a new product (vs. reformulating current products) and (6) using a multipack (vs. a single pack) of the reduced package size products. Table 1 summarizes our predictions.
Effects of Sugar Reduction Efforts on SKU Sales.

Notes: + (−) indicates we expect a positive (negative) main or moderating effect on SKU sales.
Enjoyment-oriented claim strategy
These claims may be especially relevant for SKUs for which enjoyment may be compromised by the reduction in sugar (through either a sugar content reduction or a package size reduction). Thus, we expect that enjoyment-oriented claims lead to more beneficial sales effects of both types of reductions, as indicated by the positive moderating effects in Table 1.
Health-oriented claim strategy
While the healthier nature of products with sugar content reduction or package size reduction will be attractive to consumers (contributing to the direct effect), offering explicit health-oriented claims has the potential to backfire. That is, highlighting the reduction or absence of sugar reinforces the notion that the product is less enjoyable (Kiesel and Villas-Boas 2013). Thus, we expect that health-oriented claims would weaken the beneficial sales effects of both types of reductions (sugar content and package size), as indicated by the negative moderating effect in Table 1.
Diet subbrand strategy (vs. using the main product line brand)
For sugar content reductions, a first branding choice is to launch new reduced-sugar products under a main brand (e.g., Pepsi) or a diet subbrand (e.g., Diet Pepsi). Diet versions, with zero or few calories, often rely on artificial sweeteners in lieu of sugar. Such branding choices can drive expectations about the products’ taste and healthiness (Chandon and Wansink 2011). While a diet subbrand sends an unambiguous message of very low or no sugar content, it also may imply the use of artificial sweeteners. This latter aspect may make consumers more hesitant to purchase such a product than to purchase an identical product without the diet subbrand (and artificial sweetener concerns). Therefore, we expect a negative moderating effect of a diet subbrand strategy on the effect of launching products with sugar content reductions on sales.
New product strategy (vs. reformulating a current product)
For sugar content reduction, a second decision is whether to launch the new SKUs as reformulations of an existing product or as new products. Reformulations likely benefit from existing SKU awareness and equity levels. At the same time, reformulations may also raise concerns about taste. Specifically, reducing the sugar content through a reformulation changes the product's taste, which may alienate some customers who enjoyed the more sugary version (Griffith, O’Connell, and Smith 2017), thus reducing sales. Conversely, launching the reduced-sugar content SKUs as new does not carry this risk as much. Consequently, we expect a positive moderating effect of a new (vs. reformulated) product strategy on the effect of sugar content reductions on sales.
Mini size line strategy (vs. the main product line brand)
For package size reductions, one choice is the usage (or not) of a dedicated mini line, clearly differentiated from other package sizes (Moorman, Ferraro, and Huber 2012). We expect this dedicated line to increase the positive effect of package size reductions on sales. This is because mini sizes are explicitly positioned to provide the same taste in a smaller portion, allowing sugar intake control without sacrificing taste. In addition, this dedicated branding choice promotes the idea of new usage occasions in which other package sizes may be too large to consume comfortably. Thus, we expect that the mini size line will strengthen the positive effect of package size reductions on SKU sales as indicated by the positive moderating effects in Table 1.
Multipack strategy (vs. a single pack)
For package size reduction, a second decision is whether to either launch single items (e.g., individual cans) or multipacks (e.g., 12 mini cans per pack). We expect multipack items (vs. single packs) to weaken the positive effect of package size reductions on sales because of two reasons: first, multipacks reduce consumers’ ability to control their sugar intake, 3 and, second, initially, consumers may be less willing to purchase a new product (especially in a smaller package size) in large quantities until they have some experience with it.
Sugar Reduction Strategies’ Effect on Brand and Category Sales
Thus far, the discussion has focused on the effects of sugar reduction strategies on SKU sales. However, brands care about volume sales at a brand level, which includes consideration of how other products associated with the same brand are affected by the sugar reduction strategies. Further, policy makers focus on total sugar sales at the category level across all brands. Acknowledging these various interests, we aim to determine how each introduction of a reduced-sugar product influences brand sales and category sugar sales. In the spirit of Van Heerde, Gupta, and Wittink (2003) and Van Heerde, Leeflang, and Wittink (2004), we disentangle the sources of sales accruing to the new SKU by distinguishing between primary demand effects (effects on category demand) and secondary demand or cross effects (effects on existing SKUs sold by existing brands).
Primary demand effects
A new SKU may draw new buyers into the category (or make existing buyers purchase more) and therefore not draw sales from other SKUs from the same or other brands in the category. In that case, sales for the new SKUs accrue due to a primary demand effect, which represents an expansion in category sales.
Secondary demand or cross effects
A new SKU can have a positive effect on the sales of other, existing SKUs due to a spillover effect. A spillover effect happens when changes in the product line positively affect perceptions of the original offerings, which can occur even with expansions into subbrands (Chandon and Wansink 2011). For example, introducing smaller packages may increase attention to the brand due to the greater variety in the product line, thereby increasing sales for existing products (Kahn and Wansink 2004). It may also normalize the selection of smaller packages more generally (Sharpe, Staelin, and Huber 2008).
A new SKU can also have a negative effect on the sales of other, existing SKUs. A negative effect happens when consumers substitute purchases of the other SKUs in favor of the new SKU. Cannibalization or within-brand switching occurs when consumers’ purchases of new SKUs come at the expense of sales of existing SKUs of the same brand, whereas across-brand switching occurs when these new SKU purchases come at the expense of existing SKUs of other brands.
Heterogeneity in secondary demand or cross effects
Within- and across-brand switching is unlikely to be uniform across products; product additions affect sales of SKUs of the same brand more strongly than those of competitor brands (Rooderkerk, Van Heerde, and Bijmolt 2013). But even within a brand, cannibalization and spillover effects tend to be heterogeneous, such that more similar products generally are more heavily affected (Rooderkerk, Van Heerde, and Bijmolt 2011). Consistent with this idea, Sethuraman, Srinivasan, and Kim (1999) discuss “asymmetric neighborhood” cross effects, which imply that cross effects depend on not only the products’ similarity but also their relative position (higher vs. lower than the focal SKU). In our study context, reduced-sugar additions may affect products with a lower sugar content more than those with a higher content, due to the critical role of taste considerations. Consumers of regular sugared products (“original taste”) are not as willing to give this benefit up, but consumers of lower-sugar products, who already balance taste and health considerations, may be willing to experiment more. For reduced package size additions, products with a smaller package size may be affected more than larger products, because existing consumers of smaller package sizes likely gain more from switching, in that larger packages typically are less expensive. Consequently, cross effects may depend on whether the affected SKU's brand is the same or different, the absolute difference in sugar content and package size in comparison with the added SKU, and its positioning as higher or lower in sugar content and package size than the added SKU.
Data and Measures
Setting
The U.S. soda industry generates more than $245 billion in revenues annually (Statista 2020), and it is the largest source of added sugars in consumers’ daily sugar intake. In this relevant context, we gather a large set of rich data sources, including Nielsen and Label Insight, complemented by survey data collected through Prolific. At the three-digit zip code level, we establish 875 markets. Because of differences in a brand's product line across markets, the same SKU may reduce a brand's average sugar content and/or package size in one market but not in another. We use Nielsen Retail Measurement Services (RMS) scanner data (2006–2016), provided by the Kilts Center for Marketing, and focus on all brands that achieve at least 1% market share in any year in a local market and restrict the sample to SKU–market combinations with a local market share greater than .1% during the observation window. We drop all private labels, as the RMS data preclude us from identifying them, which is required to match them to the Label Insight data set. Thus, we observe all additions, delistings, and constantly offered SKUs of national brands throughout the entire data period.
The information available from Label Insight refers to more than 500,000 CPG products sold by 17,000 brands, equivalent to approximately 80% of the U.S. food and beverage industry. These data provide detailed product-level information, including product descriptions, brand names, package sizes, nutritional labels (including sugar content), and package claims. We matched the Nielsen RMS and Label Insight databases, representing approximately 90% of all value sales by products in the former data selection. Then we complemented the Label Insight data with product-level information from the USDA Branded Food Products Database, GS1 US, and 1WorldSync. Furthermore, we manually screened online resources, such as manufacturers’ and retailers’ web pages and food technology company databases (e.g., Innit). Ultimately, from the sales value, we obtain complete data for more than 99% of all products in our sample.
We aggregate data at the SKU–store–week level to the SKU–market–quarter level to inspect the effect of SKU additions (and delistings) on quarterly performance at the SKU, brand, and category levels. Table 2 details the variable operationalization, and Web Appendix A provides a correlation matrix and summary statistics. We detail the role of all the variables in the “Method” section and describe the main variables next.
Variable Operationalization.

Weights are set to each store’s share of total category sales in a given calendar year (Datta, Ailawadi, and Van Heerde 2017).
Notes: All variables are based on Nielsen data, except for sugar variables and product claims (Label Insight). For claims, we also use a Prolific study into the orientation of these claims (see Web Appendix B). The calculation of the IMR and control function terms is discussed in the “Identification” section. All variables, except binary and cross sugar effect variables, are mean-centered to ease interpretation.
As is common with retail scanner data, we rely on sales data to infer SKU addition and delisting decisions due to the lack of SKU availability data. Similar to Hwang, Bronnenberg, and Thomadsen (2010, p. 865), we define all SKUs as part of the assortment, unless no sales of a SKU persist over at least four quarters. If a SKU is not sold for four quarters, we assume it was delisted after the last period with sales. We define a SKU as added in the first quarter in which we observe sales and measure its effect, in line with prior literature, for the first four quarters following its first observed sales (e.g., Steenkamp and Gielens 2003). Our main interest is in SKU sales, measured as sales volume in liters. For sugar content, we use measures in grams of sugar per 100 milliliters of the SKU; package size is measured in milliliters. To facilitate interpretations, we reverse-code both sugar content and package size (i.e., multiply by −1), so the associated parameters indicate the effect of a reduction (rather than increase) in sugar content or package size. The data also feature several product claims, which we asked a sample of 100 U.S.-based consumers to rate in a survey (1–5 scale) about their enjoyment or health orientations (see details in Web Appendix B). We use Nielsen and Label Insight data to determine SKU characteristics and marketing-mix variables.
Descriptive Statistics
Our data contain 73 brands in 875 markets and cover 44 quarters. On average, 15.2 brands (Min: 5, Max: 22), with an average market share of 1.4%, are available per market. These statistics indicate that our data cover both large and small regional brands. Web Appendix C provides, separately for each brand, additional details. As we find, brands’ average sugar content and package size change over time. We provide graphical evidence of the variation in sugar content and package size for the leading four brands (Coca-Cola, Mountain Dew, Pepsi, and Dr Pepper) in Web Appendix D. Importantly, for all brands we find substantial variation in the sugar content and package size over time across all markets, with both periods of increases and decreases. However, the evolution of the brand's (aggregate) sugar strategy across 875 markets masks how the brand altered its sugar strategy in local markets.
To understand better how sugar strategies are implemented at the local level, we present all variations of Pepsi in one market (Atlanta, Georgia) in Figure 2. The average package size (sugar content) starts at 710 mL (6.7 g/100 mL) and changes with every product addition (dark gray bars with roman numerals); we also note limited changes due to delistings (light gray bars).

Evolution of Sugar Content and Package Size of Pepsi in Atlanta, Georgia.
Every change in Pepsi's average sugar content or package size is due to one of ten product additions or one of three product delistings. Of the ten additions, eight are package size reductions, and two are sugar content reductions; their package size or sugar content is smaller than Pepsi's average in the Atlanta market. In turn, Pepsi's average package size decreased from 710 mL to 654 mL, but its average sugar content increased from 6.6 to 7.6 g/100 mL. We provide the relevant graphs for Coca-Cola, Dr Pepper, and Mountain Dew in the same market in Web Appendix E. Web Appendix F contains a condensed summary of all additions across markets and over time.
Figure 2 illustrates that brands change their strategies over time, using both product additions and delistings. In our data set, the majority of the 231,476 changes across all markets and brands involve additions (55.5%, or 128,381), whereas delistings account for fewer changes (44.5%). We zoom in on additions to understand the product characteristics brands introduce (Table 3). A similar table detailing the characteristics of delisted products is in Web Appendix G.
Product Characteristics of New SKUs.
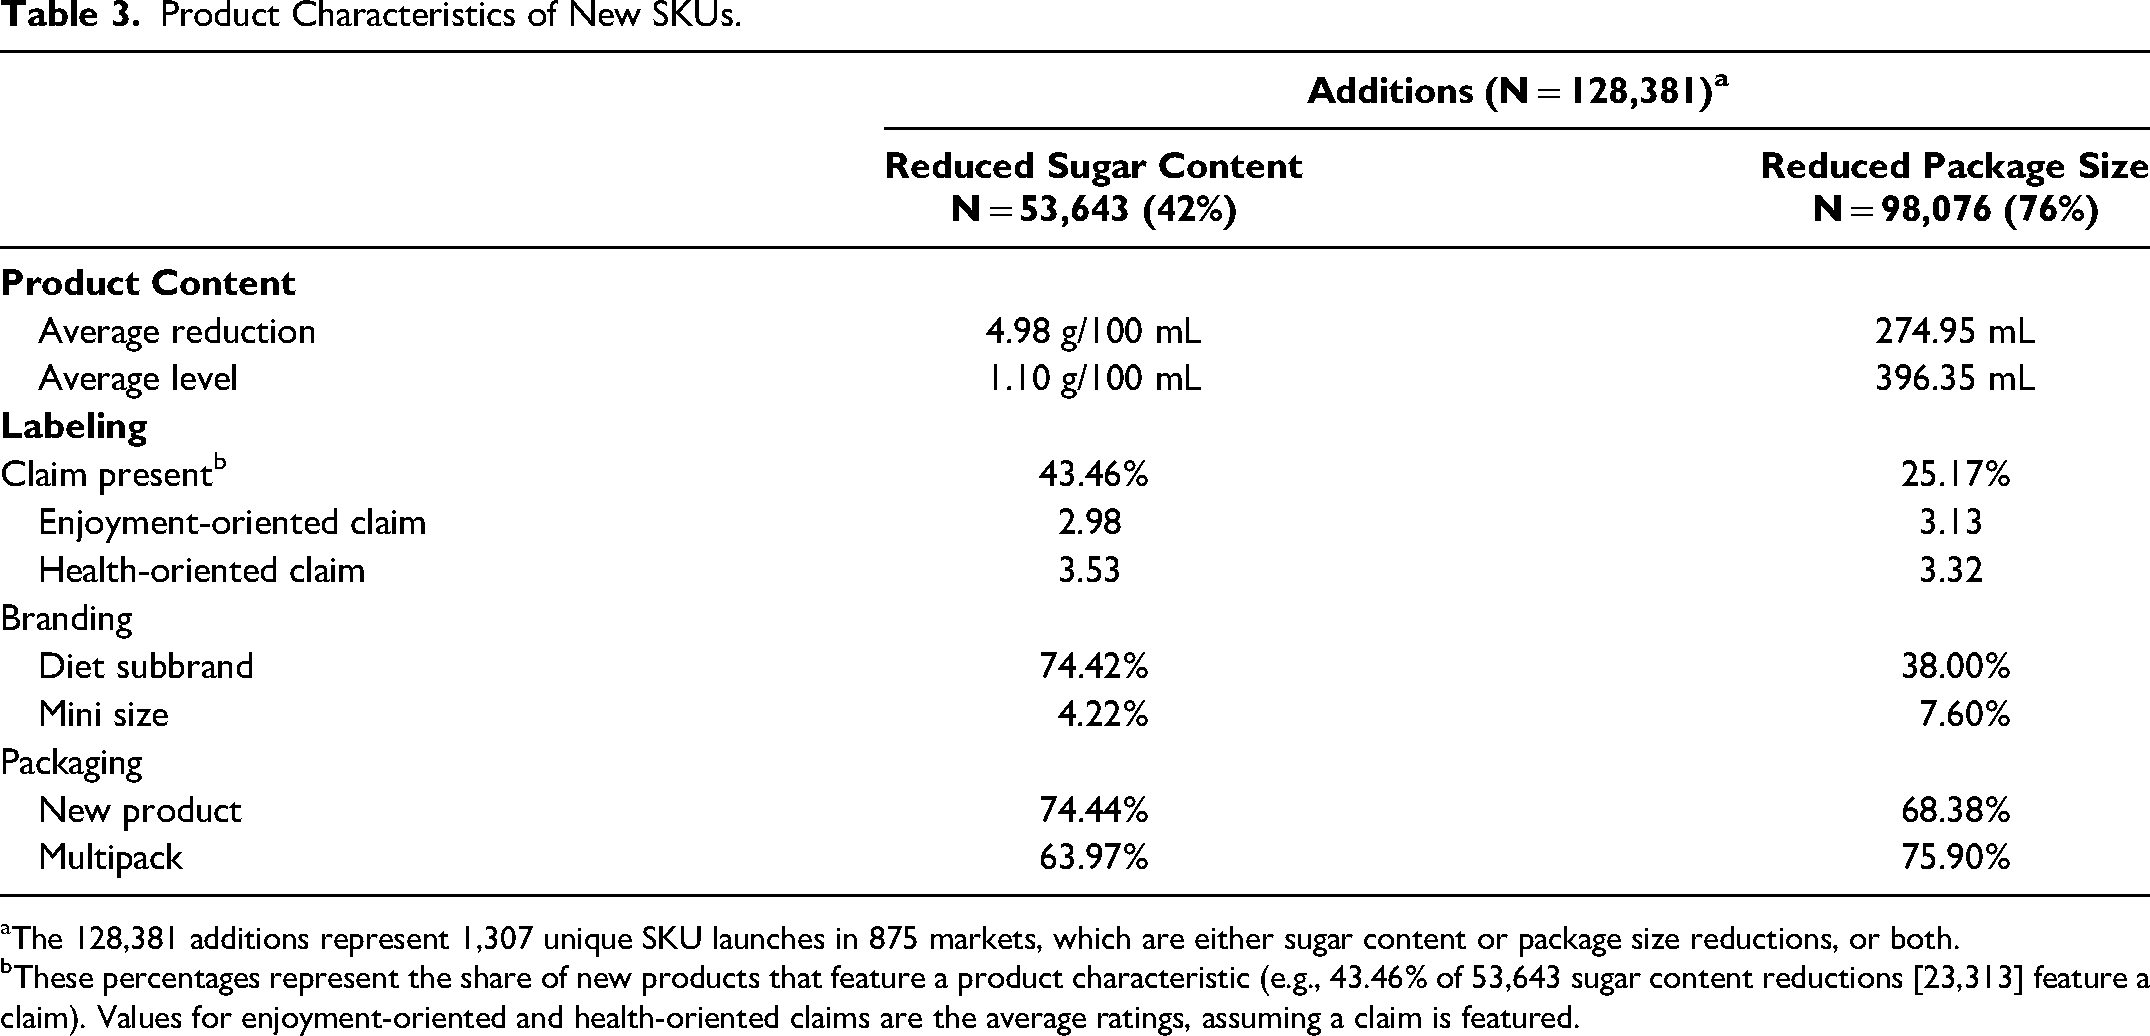
The 128,381 additions represent 1,307 unique SKU launches in 875 markets, which are either sugar content or package size reductions, or both.
These percentages represent the share of new products that feature a product characteristic (e.g., 43.46% of 53,643 sugar content reductions [23,313] feature a claim). Values for enjoyment-oriented and health-oriented claims are the average ratings, assuming a claim is featured.
Roughly 76% of the additions produce a decrease in package size, and about 42% of the additions have a reduction in sugar content. The average sugar content of a reduced-sugar SKU is about 1.10 g per 100 mL, or 4.98 g per 100 mL lower than the brand's average. Turning to package size reductions, we find an average new package size of 396 mL, about 275 mL smaller than the brands’ average values. Sugar reductions can result from sugar content or package size decreases or both; these strategies do not need to be exclusive. As shown in Web Appendix H, of all additions that decrease sugar content or package size (N = 128,381), 32.46% reduce both, whereas 43.94% of the additions that decrease the average package size come with increased sugar content. Less frequent are introductions that feature a package size increase but sugar content decrease (9.33%) or an increase in both sugar content and package size (14.28%).
Method
We assess the sales implications of sugar reduction strategies by studying product additions and testing whether products with a reduced sugar content or package size perform differently than additions that do not use a sugar reduction strategy. Moreover, to evaluate the moderating effect of product characteristics and secondary demand effects on brand volume sales and the influences on category-level sugar sales, we need a model that meets four criteria. First, it should support evaluations of the effects of sugar reductions on the performance of the newly launched SKU, as well as the moderating role of product characteristics. Second, it should account for secondary demand (or cross) effects, such that we can determine performance implications at both brand and category levels. The cross effects may depend on added and affected SKUs, so we need a model that allows for heterogeneity in secondary demand effects. Third, the model must account for the timing of SKU availability in markets and the potential bias arising from the endogeneity of marketing mix or other relevant factors. Fourth, markets can feature multiple introductions simultaneously, so the cross effects should not suffer from aggregation bias. Given these requirements, we specify a linear model (Wooldridge 2010, p. 300), which avoids aggregation biases (Christen et al. 1997).
Model Derivation
We model the volume sales of SKU s in market m in quarter q (VolSalessmq) throughout the period for which it is available. For ease of exposition, we first illustrate how we identify the sales of an added SKU using a stylized example. Then, we gradually build the model, starting with a baseline that we extend to meet the aforementioned criteria. With each step, we present the relevant equations (1a–1d) with added terms in bold font.
Stylized example
Table 4 presents a simplified data structure for three sample SKUs in one market, observed for eight quarters. SKU A, added in Quarter 3, has average sales of 5 in the addition period, and 7.5 sales afterward. SKU B is always present and has sales of 4 throughout the data period. SKU C is added in Quarter 4 with sales of 2 for the first four quarters and then sales of 6. Note that the addition dummy variable is 1 for the four quarters of the one-year addition period in which we estimate the addition effect. From this stylized example we can learn that average addition effect for a new SKU should be the average of SKU A's and SKU C's first-year sales, which is (5 + 2)/2 = 3.5. As discussed subsequently, this is exactly the value that our regression model recovers.
Stylized Example of Data Structure and Addition Effect.

To estimate the addition effect, our regression model uses SKU sales as the dependent variable and uses the addition variable as the focal independent variable, expected to obtain a regression coefficient of 3.5 in the example, representing the average of sales in the addition period of SKUs A (5) and B (2) (in an extended model with moderators, the differences in success of SKUs A and C are at least partially explained through differences in their strategies).
To achieve this, the model additionally includes what we label “partial fixed effects.” For SKUs that are on the market all the time (e.g., SKU B), they are the same as traditional fixed effects (1 if the observation is for that SKU, and 0 otherwise). For newly introduced SKUs (such as A and C), the fixed effects are only 1 for a SKU in the postaddition period. This way, they account for each SKU's sales level in the postaddition period, while the average sales level of newly introduced SKUs during the addition period is captured by the coefficient for the addition variable. In the example, the parameters for the partial fixed effects of A, B, and C should be 7.5, 4, and 6, respectively, corresponding to new SKU A's and new SKU C's postaddition sales levels and existing SKU B's average sales level across the entire observation period.
We tested the model with volume sales as a dependent variable using simulated data, and we can exactly retrieve the parameters for addition (3.5) and the partial fixed effects (7.5, 4, and 6, respectively).
Baseline model
We first focus on how a SKU's sugar content (SCs) and package size (PSs) affect the volume sales effect during the addition period (captured by ADDsmq). We do so by specifying interaction effects among sugar variables and the addition indicator. We control for the SKU's own marketing mix (i.e., regular price, promotion depth, and distribution breadth; Datta, Ailawadi, and Van Heerde 2017) and include SKU–market (αsm) partial fixed effects, as outlined in our stylized example. We also add (43) quarter fixed effects, separately for diet and nondiet products (i.e., quarter × diet subbrand αqd). Therefore,
Heterogeneous effects of sugar reduction efforts
The effect of additions (β1) depends on the SKU's sugar content (β2) and package size (β3) and their interaction (β4). To account for the moderating effect of the SKU's product characteristics (ProdChari,s), we include interactions of the relevant product characteristics with sugar content and package size:
Secondary demand or cross effects
New SKU sales may create primary demand (e.g., attract new consumers) or draw from sales of existing SKUs, of the same or competitor brands. To reflect the effect of an addition on other SKUs, we add two variables indicating additions by the SKU's own brand (
Heterogeneity in secondary demand
Thus far, our specification has implied that the extent to which new SKUs draw sales from other SKUs (i.e., secondary demand) depends only on whether affected SKUs are of the same or a competitor brand. But because more similar SKUs have stronger substitution patterns (Rooderkerk, Van Heerde, and Bijmolt 2011), we also extend our cross effect specification in two ways. First, the strength of cross effects may depend on the absolute difference in sugar content or package size between added and affected SKUs. Second, cross effects may differ depending on whether the affected SKU has a higher or lower sugar content or package size than the added SKU. Thus, we derive four terms each for sugar content and package size (
Control terms: Endogeneity, timing, and delistings
Finally, we include a sample selection correction (inverse Mills ratio [IMR]), a set of residuals obtained from control functions for the endogenous marketing mix (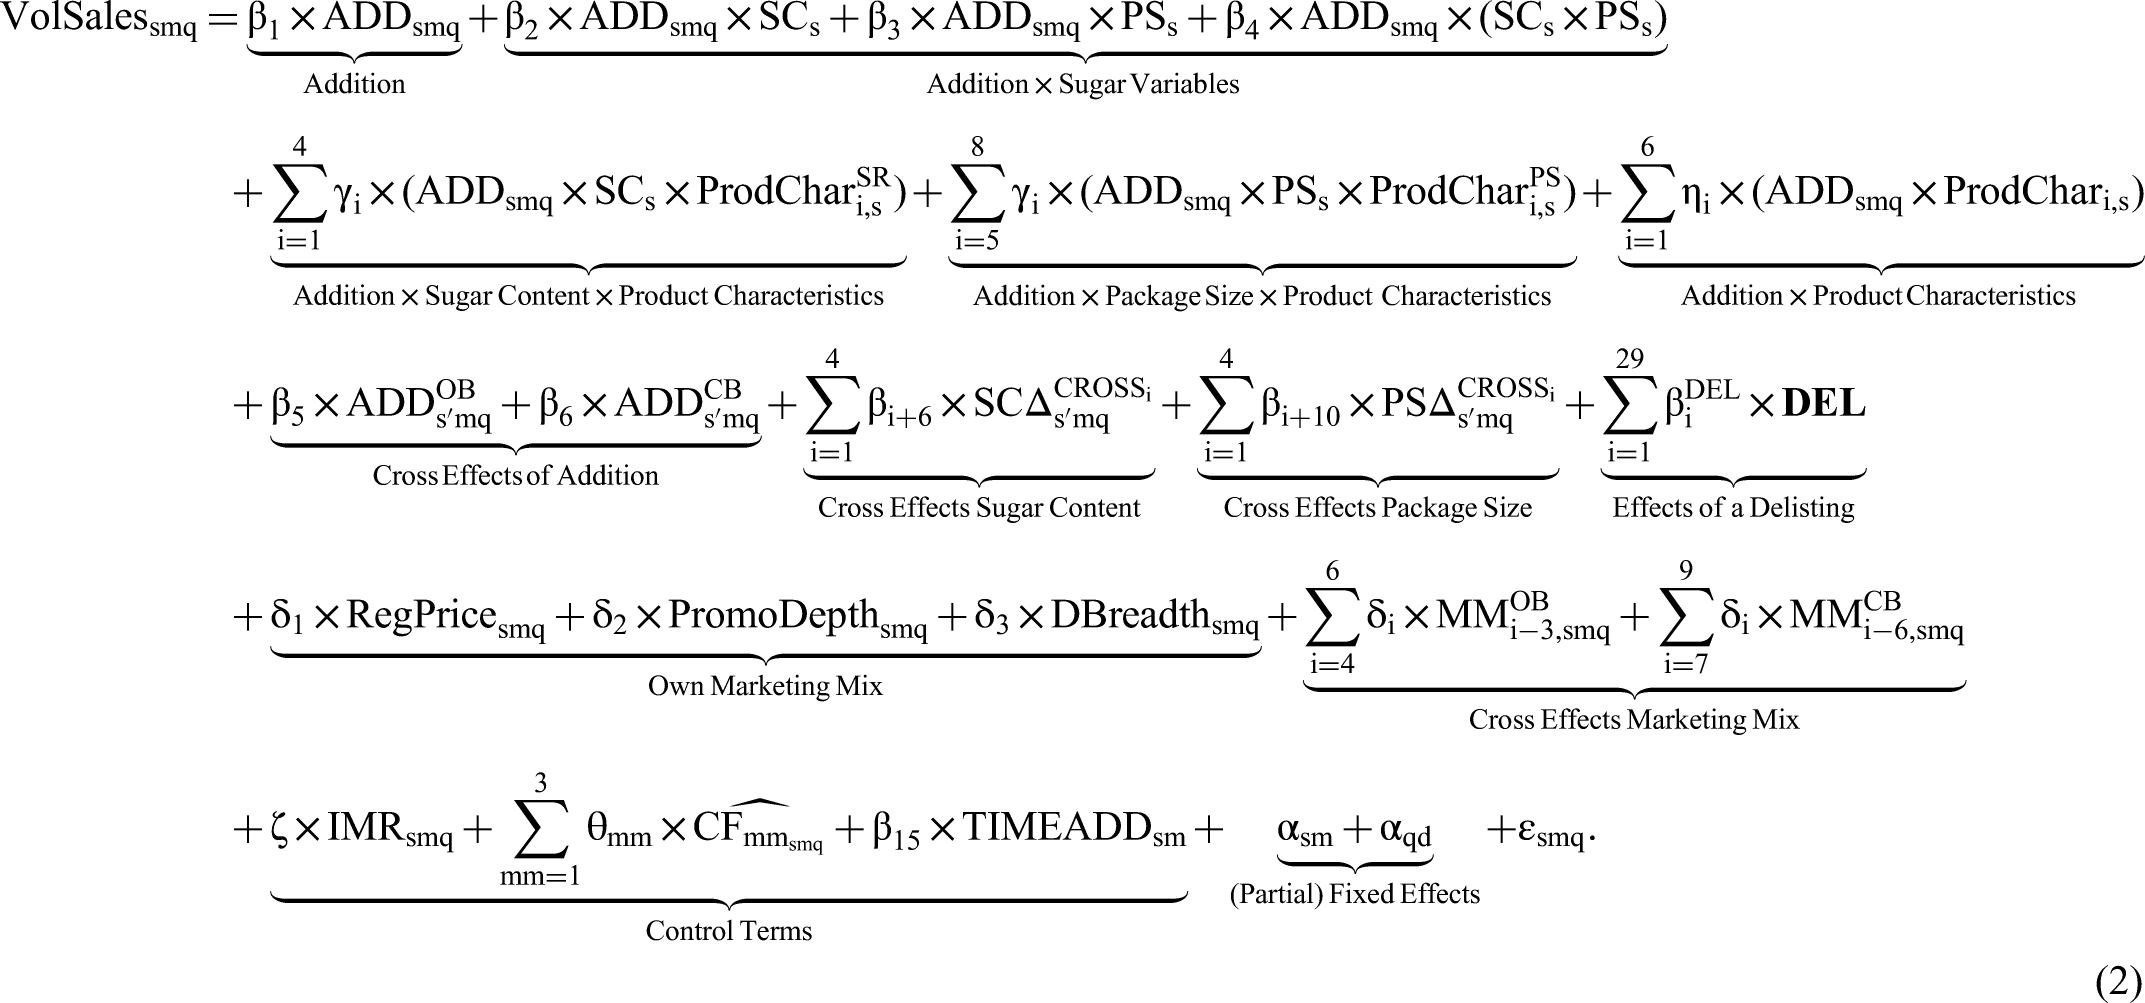
Identification
We face several threats to identification. First, not all SKUs are offered in all markets at all times. If the decision to offer the SKU in a given market at a specific time is made with the expected sales in mind, our parameter estimates may be biased and inconsistent (Wooldridge 2010). In particular, unobserved aspects in products (e.g., taste) and markets (e.g., acceptance of new products), as well as changes over time (e.g., changing preferences for diet products), may be correlated with sugar reduction efforts and need to be accounted for. Second, the marketing mix of the focal and competitor SKUs may influence sales of additions and bias our findings if not accounted for. Third, potentially strategic applications of marketing-mix variables may be correlated with expectations of a sugar reduction's sales and subsequently bias our findings.
To address these threats, we employ a multipronged approach. First, we correct for the potentially endogenous nature of the timing when and markets where the SKU was introduced. For example, a low-sugar SKU may be more likely to be added to a market with highly health-oriented consumers (“where”). When consumers’ health orientations shift, some markets may become more or less attractive for a particular SKU over time (“when”). To reflect time-varying unobserved factors that drive the timing decision of an SKU's presence in a given market (i.e., whether we observe a particular SKU–quarter or not), we adopt two different measures: fixed effects and a selection model approach.
The quarterly fixed effects capture non-SKU generic opportune moments to introduce a new product (e.g., seasonality, overall trend changes). We include these quarterly fixed effects separately for diet and nondiet products (αqd), to avoid confounding our diet subbrand moderator with the changing appeal of diet sodas over time (see “Unobserved Effects” in Germann, Ebbes, and Grewal 2015). We also include an IMR (IMRsmq) based on a selection model to account for the appeal to launch a SKU in a specific market and quarter. We employ time-varying instruments (share of peer markets offering a SKU in the previous quarter). These time-varying instruments exogenize the location and timing of addition decisions. Once SKU–market and quarterly–diet fixed effects and the IMR are included, any omitted variables related to the (time-varying) match value between a SKU and a market are covered. Similarly, the addition variable, which reflects the first four quarters of a SKU, may be endogenous if there are omitted variables that drive the timing of an addition. However, after inclusion of the IMR, these omitted variables are captured, and the addition variable should be exogenous. We detail this selection model and the validity of the instruments in Web Appendix I.
Second, we gather marketing-mix variables at the SKU level, as well as competitor SKUs’ marketing-mix variables, to control for their influence (Germann, Ebbes, and Grewal 2015) and reduce the risk of omitting relevant drivers.
Third, the marketing mix might correlate with the error term, rendering them endogenous. We adopt a control function approach to account for the potentially endogenous marketing mix. We detail the concern for endogeneity, our approach, instruments, and estimates in Web Appendix J. With these estimates, we derive
Results
Before turning to the parameter estimates of the outcome model (Equation 2), we note that the parameters of the instruments in the selection model are significant and have the expected signs. The instruments in the control functions also relate to the endogenous variables positively and significantly and exhibit sufficient strength. We discuss these results in Web Appendices I and J, respectively. The estimation results in Table 5 offer support for seven of our nine predictions. Web Appendix K contains the full set of parameter estimates (i.e., for all parameters for which we provide check marks in Table 5).
Parameter Estimates of Sales Model.

*p < .10.
**p < .05.
***p < .01 (two-sided).
Indicates supported expectations.
Notes: Dependent variable = sales volume. We performed several specification tests to assess the validity of our results. First, multicollinearity does not seem to be an issue; see Web Appendix A. Second, the serial correlation in our sample is substantial (Wooldridge 2002, pp. 282–83), so we account for it using the Prais–Winsten correction (e.g., Datta, Ailawadi, and Van Heerde 2017). We derive heteroskedasticity-robust standard errors.
The parameter estimates for the marketing mix are face valid: regular price (δ1 = −313.46, p < .01) and promotion depth (δ2 = 2,972.50, p < .01) are negative and positive, as expected, 5 and higher distribution breadth increases sales (δ3 = 4,132.00, p < .01). The IMR is positive and significant (ζ = 132.14, p < .01), underscoring the importance of accounting for the endogenous timing of product offerings.
Direct Effect of Sugar Content and Package Size Reductions on New SKU Sales
The average sales level of an average product during its addition period is 2,445.74 L (p < .01) per quarter. Whereas the addition's effect does not vary significantly with average sugar content reductions, it does so with package size reduction, which positively affects sales (β3 = 1.69, p < .01). 6 These effects are economically meaningful: an average package size reduction (396.35 mL vs. average of 698.51 mL) sells 510.65 L more (1.69 × (698.51 − 396.35), p < .01) than an average-sized addition. To put the absolute sales volume difference of 511 L in context, we divide it by the sales volume of an addition with average sugar content and package size (β1 = 2,445.74 L), for a relative sales difference of 20.9%.
Sugar content reductions: The moderating role of product characteristics
The effect of sugar content reductions (vs. average product additions) is on average negative, but nonsignificant. The interaction effect of the two sugar reduction efforts indicates that they counteract each other (β3 = −.03, p < .01; Aerts and Smits 2017) rather than creating synergies, and we find substantial heterogeneity that reflects the products’ characteristics. For example, more enjoyment-oriented claims positively moderate the effect of sugar content reductions (γ2 = 19.57, p < .05), whereas a claim's health orientation negatively affects sugar content reductions (γ1 = −46.07, p < .01). Using a diet subbrand negatively moderates the effects (γ3 = −64.32, p < .01), resulting in lower sales than sugar content reductions without such a branding approach. Adding a totally new product (vs. reformulating a product) appears not to moderate the effect of sugar content reductions (γ4 = −5.91, p > .1). Importantly, at reasonable values (0 or 1 for binary variables and 10th and 90th percentiles for continuous variables), all moderators have substantial impacts with regard to their effect on the sugar-reducing addition. Sugar content reductions with a high level of enjoyment claim are highly effective (moderated effect of sugar content reduction = 21.29, p < .05) at increasing sales, while those without an enjoyment claim are not (−3.14, p > .1). Health claims are most impactful, such that a low level leads to a reduction in sales (38.24, p < .01) and a high level leads to a substantial decrease (−53.84, p < .01). Although the effect of a sugar content reduction is not significantly different from zero at the baseline level of binary moderators (−1.13, p > .1), both using a diet subbrand (−65.45, p < .01) and adding a new product (−7.04, p < .01) result in highly significant effects.
Package size reductions: The moderating role of product characteristics
We observe similar variation in the (positive) average effect of package size reductions. More enjoyment-oriented claims further boost the effect of package size reductions on sales (γ6 = .84, p < .01), but health-oriented claims weaken this effect (γ5 = −.47, p < .01). Similar to sugar content reductions, a dedicated positioning is detrimental. Specifically, using a mini positioning substantially reduces the positive effect of package size reductions (γ7 = −16.64, p < .05). Offering a multipack should be considered with care, as it also reduces the advantageous effect of package size reductions (γ8 = −1.51, p < .01). To summarize, the effect is consistently significantly positive, but differs substantially in magnitude depending on the level of the moderator variables (ranging from .18, p < .1, for a multipack to 2.66, p < .01, for a high level of an enjoyment claim). Only for mini sizes, the parameter flips to a negative effect (−14.95, p < .01). That is, the average effect of sugar content (package size) reduction efforts is negative (positive), but product strategy factors can change the magnitude or direction of the effect substantially.
Calculation of Aggregate-Level Effects of Interest
The model also allows us to make inferences about various scenarios of interest at the brand and category level, including reductions where only the sugar content is changed and reductions that use a particular product strategy element (e.g., diet subbrands).
Average reductions
We illustrate two stylized options: adding a SKU that keeps the average sugar across the brand line constant (“average addition”) and a SKU that reduces the sugar (“reduced-sugar addition”). Then we calculate the effect of these two options on volume sales and sugar sales, as detailed in Web Appendix L. To start, we determine the sales effects of an average addition versus no addition, then identify the effects of a reduced-sugar addition versus no addition. In both cases, we hold all other factors constant. The difference indicates the effect of interest: the sales difference due to a reduced-sugar addition versus an average addition. For the own SKU sales effect, the expected volume sales of an average addition (vs. no addition) is captured by the addition parameter β1 and the sugar content multiplied by β2, reflecting the effect of sugar content. Then, to arrive at own brand sales, we allow the added SKU to affect other SKUs of the same brand, due to the mere presence of another option (Rooderkerk, Van Heerde, and Bijmolt 2013), but with varying intensity based on the relative positioning (higher/lower in sugar) of the new to the affected SKU. The extent to which new SKUs affect sales from other SKUs that are lower in sugar content equals the number of affected (lower sugar content) SKUs,
Effect of product strategy
To assess the effect of sugar reductions on brand and category sales with different product strategy elements, we follow the same logic but adjust all relevant factors using two additional steps. First, the effectiveness of sugar reductions (β2) differs with the level of a product strategy element (γi). Second, the average values of sugar content and distance to (and number of) affected products that are higher/lower in sugar content are conditional on observed sugar content reductions with a given product characteristic (e.g., sugar content reductions with a diet subbrand may have a different average sugar content than the average of sugar content reductions across all additions).
Brand-Level Sales Effects of Sugar Reductions
We briefly discuss the parameters for the cross effects within the same brand before discussing the impact on the brand overall.
Within-brand switching
On average, a new addition negatively affects demand for other SKUs with similar sugar content and package sizes of the same brand (β5 = −46.79, p < .01). However, the differences in sugar content and package size are highly relevant in determining the total cross effect: the further the SKU is from the affected SKU in its package size, the less it draws demand from it, irrespective of whether the affected SKU is smaller (β12 = .05, p < .01) or larger (β11 = .00, p < .10) or has a lower sugar content (β8 = 2.95, p < .01). These findings are in line with the notion of neighborhood price effects, such that cross-price effects are stronger among products that are priced similarly (Sethuraman, Srinivasan, and Kim 1999). In contrast, within-brand switching becomes somewhat stronger for SKUs with higher sugar content when they are further apart in terms of sugar content (β9 = −3.95, p < .01).
To assess the total within-brand switching for reduced-sugar additions (vs. average additions), we calculate within each market the average number of SKUs that are lower and higher in sugar content and the same based on package size. Then, within each group, we calculate the average distance in sugar content and package size. We conduct a similar assessment for additions with an average sugar content and package size. All values used for these calculations are presented in Web Appendix N. Compared with an average addition, within-brand switching is stronger on average, for both sugar content reductions (−412.27, p < .01) and package size reductions (−125.00, p < .01).
Own brand sales effect
To arrive at the brand-level implications of reduced-sugar versus regular additions, we add the own sales effect (e.g., −6.16 L for sugar content reductions) and cross-sales effect within the same brand. For sugar content reductions, negative within-brand switching amplifies the SKU-level sales loss at the brand level (−6.16 − 412.27 = −418.43, p < .01). In contrast, package size reductions, driven by their positive SKU-level evaluation, perform better (510.83 − 125.00 = 385.83, p < .01) than average additions at the brand level. That is, sugar content reductions result in more within-brand switching than package size reductions, for which fewer sales come from within the brand, and thus lead to higher brand sales. These are average values; we explore the heterogeneity in this effect next.
Win–Win Cases: Higher Brand Sales and Lower Category Sugar Sales
We next examine the effect of a strategy that introduces a reduced-sugar product on brand-level sales volume and the concomitant impact on category-level sugar sales (vs. an average, otherwise comparable, addition). Web Appendix O contains the calculation details, but similar to our brand-level evaluations, this model allows for alternative scenarios in terms of sugar sold at the category level, even if the estimation is based on sales volume at the SKU level. Precisely, we evaluate implications for the amount of sugar sold by looking at expected sales of a new SKU and cross effects on existing SKUs, within and across brands. To arrive at sugar sales for the focal SKU, we multiply the volume sold by the number of grams of sugar per 100 mL. To calculate sugar sales changes for existing products, we multiply the sales volume changes by their respective sugar content. As a baseline, we note that an addition with average sugar content and package size results in an additional 187 kg of sugar sold at the category level. Win–win situations increase brand-level sales but lower category sugar sales. Figure 3 presents, for low and high levels of each moderator, these effects.

Brand Volume Sales and Category Sugar Sales Effects of Sugar Reductions.
Win-win opportunities using package size reductions
On average, package size reductions (Figure 3, Panel B) result in a win–win situation, because brand sales increase (black bar, +385.83 L) but category sugar sales decrease (gray bar, −37.17 kg) through beneficial switching away from more sugary products. This beneficial situation persists over a wide range of enjoyment-oriented claims. With a low level of enjoyment orientation, brand sales gain (+438.64 L), while category sugar sales still decline overall (−16.14 kg). Similarly, for products with a high level of health claims, brand sales increase (+195.85 L) but category sugar sales decline substantially (−224.52 kg).
Mini sizes are a double-edged sword: brand sales decrease dramatically, as do category sugar sales. Thus, a win–win situation appears more likely without mini sizes. Sugar content reductions (Figure 3, Panel A) also are less well-suited to create win–win situations. Even if category sugar sales decrease (−294.39 kg), brand sales do too (−418.43 L), limiting the attractiveness for brand manufacturers. Moreover, the various product strategy elements alter the extent of brand sales and category sugar sales, but no factor can individually create a win–win situation.
Win–win opportunities using delistings
In line with managers’ interests, we focus on win–win situations through additions. However, our model can also reveal how sugar reductions through delistings affect brand volume sales and category sugar sales. Figure W2 in Web Appendix O provides details; briefly, effect sizes for delistings tend to be smaller than those for additions, with rather few beneficial situations. Similar to additions, delistings with sugar content reductions (i.e., delisting products with above-average sugar content), versus delistings without such reductions, consistently reduce brand volume sales, but category-level sugar sales mostly increase, resulting in lose–lose situations. Package size reductions, on average, decrease both brand volume sales (−1,243.95 L) and category sugar sales (−99.68 kg).
Discussion
Summary of Findings
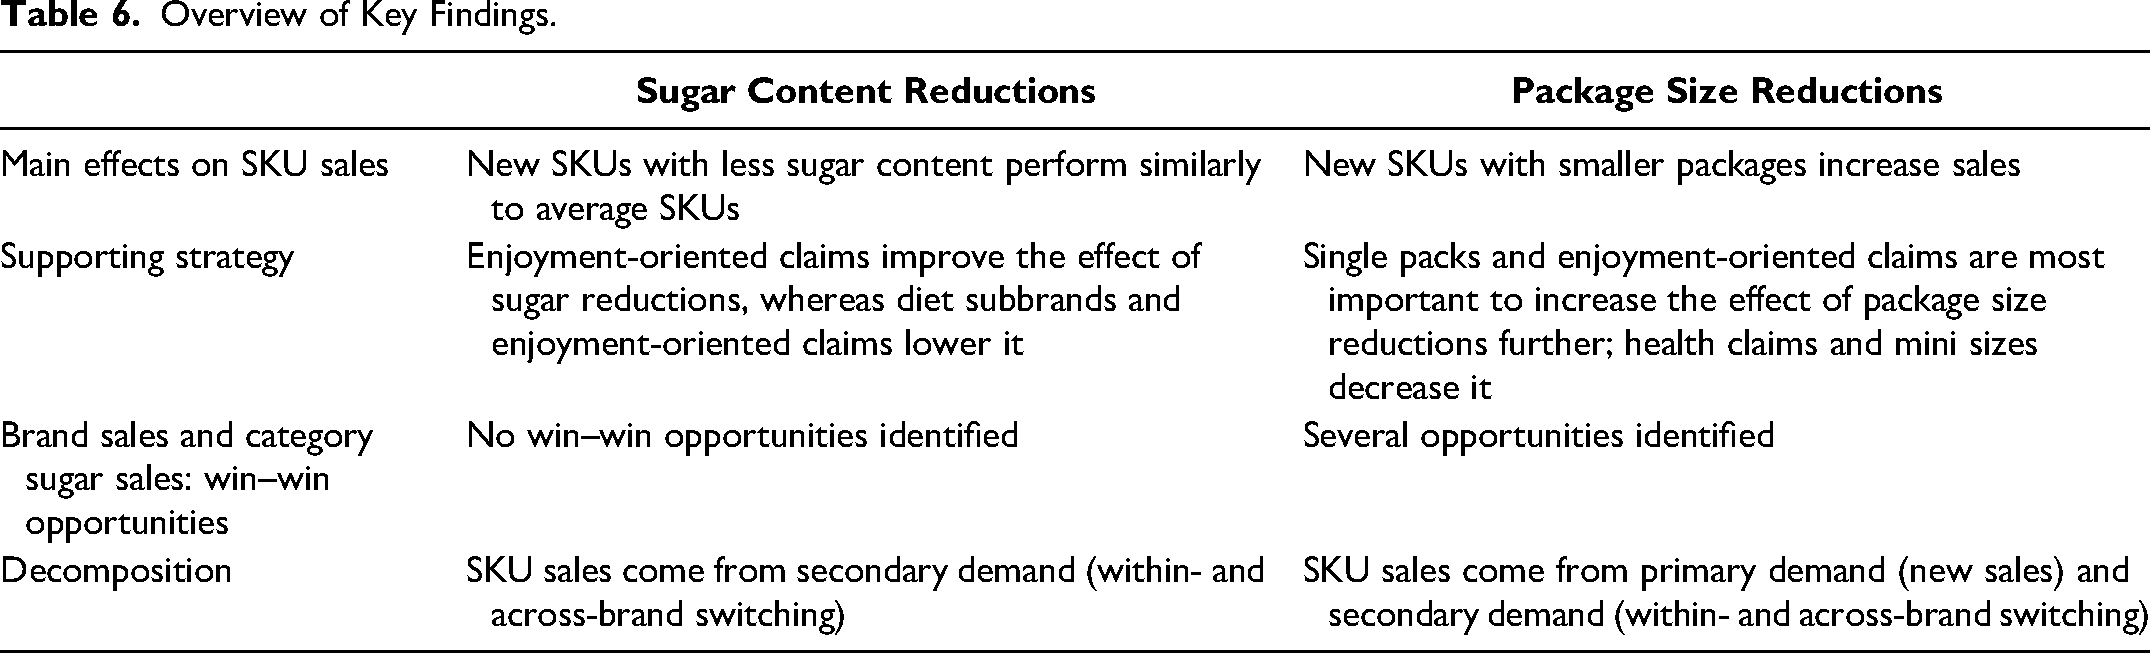
This study offers novel insights on the effects of sugar content and package size reductions on the SKUs’ own sales, the role of the moderating effect of the supporting strategy, implications for brand and category sales, and the relevance of primary versus secondary demand. Table 6 summarizes our findings.
Overview of Key Findings.
Theoretical Implications
This study is the first large-scale, empirical investigation of the effectiveness of sugar reduction efforts. Previous studies note portion size changes or environmental nudges; we specifically investigate package size and sugar content reduction efforts and their effects on SKU volume, brand volume, and category-level sugar sales. A key theoretical contribution arises from arguments on the effects of sugar content and package size reductions, reflecting various product strategy elements. We assess how new products that reduce sugar perform.
An average reduced-sugar addition, compared with an average product, performs similarly; package size reductions result in sales increases. We document and advance our understanding of the substantial variation in both effects by studying several product strategy elements at soda manufacturers’ disposal: labeling, branding, and packaging decisions. Then we identify factors that allow brands to create situations in which their sugar reduction efforts benefit themselves and society. Few of those situations readily exist in the marketplace; however, our framework sheds light on how to create products to facilitate them.
Furthermore, we add to literature on demand decomposition (Van Heerde, Srinivasan, and Dekimpe 2010). Specifically, our model sheds light on the total sales volume due to reduced-sugar additions, which we decompose into constituent sources: primary demand and secondary demand or cross effects (Web Appendix L). It is relevant for brand manufacturers “to decompose secondary demand effects into within-brand (cannibalization) and between-brand effects” (Van Heerde, Leeflang, and Wittink 2004, p. 331), but few studies show them how to do so, especially in settings with many competitor products (Van Heerde, Srinivasan, and Dekimpe 2010). Table 7 provides the results decomposing three additions—a typical new SKU at common values (sugar content 11 g/100 mL; 591 mL package), a low-sugar addition (0 g/100 mL; 591 mL package), and a small package size (11 g/100 mL; 222 mL package)—according to the three constituent sources of sales effects.
Demand Decomposition for SKU Additions.

For a typical new addition, 41% of expected sales come from primary demand among new customers or increased sales to existing customers. The remaining 59% of sales are due to secondary demand (switching): 49% cannibalized from sales of other SKUs of the same brand, and 11% drawn from SKUs of competitor brands. Sugar reductions have a different composition of primary and secondary demand. With lower sugar content, primary demand is close to zero (reflective of the general decline of diet sodas), while within-brand switching increases to 75%. That is, SKUs with low sugar content do not create primary demand but mostly encourage switching within the brand. Further, given the lack of primary demand, they also attract consumers of other brands a little more often than typical new additions (25%). Sales of a new SKU with a smaller package size seem to be the best way to grow a category, in that primary demand makes up close to half (46%) of sales, and across-brand switching is low (12%). Within-brand switching is slightly lower than that for a typical new addition (42%). Small package sizes thus seem to create new consumption moments that complement the brand's other SKUs. In summary, secondary demand is the predominant source of a new SKU's sales in the first year following the SKU addition, but sugar content and package size strongly influence the source of any remaining sales increases.
Managerial Implications
Societal pressures to reduce sugar consumption and the threat of sugar taxes have prompted many brands to try to achieve sugar reductions. However, this is a risky proposition as reduced-sugar products that lower the brand's average sugar content typically do not perform better than those that increase the brand's average sugar content. New SKUs in smaller packages perform well on average, but substantial variation exists depending on the product strategy.
How can brands benefit from sugar reduction efforts?
Brands’ sugar reduction efforts work substantially better if they do not overemphasize the reduced sugar content in new additions: sugar reductions perform better without a dedicated subbrand and with enjoyment rather than health claims. Indeed, Coca-Cola's Zero Sugar product was redesigned in 2021 to more closely resemble the “regular” Coca-Cola (e.g., through the same red color and a claim “Real Coke Taste” in Australia) rather than the earlier distinct “Coca-Cola Zero” positioning (which used a black package color and no such claim). Package size reductions perform better if the product is presented as a fun, high-quality product, rather than a stern, healthy alternative, so brands should apply enjoyment-oriented claims. Using single items rather than multipacks tends to further support this positioning. However, brands are advised not to combine reduced sugar content with a small package size. Instead, our results show that these tactics should be embodied in separate SKUs. Finally, we encourage brand manufacturers to pursue the four win–win strategies, for the benefit of themselves and society.
How do sugar reductions contribute to society?
While it is unlikely that all soda products, many of which have been around for a long time, will be replaced in the short run, pursuing package size reductions can have a substantial impact on consumers’ sugar exposure. An average package size reduction reduces incremental category sugar sales by more than 20% compared with an average addition (−37 kg vs. 182 kg). Importantly, at the end of our data period, more than a quarter of all offered products had a larger-than-average package size (on average close to 1,500 mL), leaving ample room for future package size reductions. The potential (sugar) savings are substantial considering that people consume more than one-third of all added sugars through soda (Drewnowski and Rehm 2014), and already a modest 8%–10% reduction in added sugars is estimated to reduce health care costs by over $110 billion (Huang et al. 2019).
Do consumers merely shift their sugar sales to other product categories?
Despite the clear dominance of sodas as a source of sugar in most people's diets, one concern is that reducing sugar in sodas may lead to licensing effects (Khan and Dhar 2006) that encourage increased sugar sales in other categories. Thus, we also assess whether changes in sugar sales from the soda category spill over to changes in sugar sales in the three next most important categories for added sugar intake: grain-based desserts, fruit drinks, and candy (Drewnowski and Rehm 2014). We find no evidence of a licensing effect. Rather, we find positive effects; if consumers reduce their sugar sales from sodas, they also tend to reduce it from grain-based desserts (β1 = .608, p < .01), fruit drinks (β1 = .758, p < .01), and candy (β1 = .413, p < .01). Thus, our estimates of the effectiveness of a brand's sugar reduction efforts appear conservative, in that a sugar reduction in one category may have positive spillover effects on other product categories. These results are also robust to several alternative model specifications, as outlined in Web Appendix P.
Future Research Directions and Limitations
At the same time, the current study offers some clear avenues for further research. First, we consider working with individual-level panel data to study dynamics in consumer response important. One crucial consideration is to better understand which subsets of customers purchase or do not purchase reduced-sugar products. An improved understanding of these customers, ideally along with information on how they react to other product design decisions and their sensitivity to marketing conduct, provides opportunities for firms and policy makers alike. Also, reduced-sugar products may be less addictive and lead to different consumption patterns. Firms may adjust their marketing conduct to these usage patterns and observe different outcomes: do promotions and advertising play a different role (e.g., as a reminder) and lead to different outcomes (e.g., a higher increase in primary demand)? Another relevant aspect is how consumers adopt reduced-sugar products across brands and categories, as such an analysis can prove useful in targeting consumers as well as deciding the level of customization of marketing campaigns for both firms and regulators.
Second, our focus is on brand-level new product decisions, leaving the interaction with retailers as a fruitful area for future research: For example, do all sugar reduction efforts receive similar in-store support from retailers? Do retailers devote extra shelf space to such products or is shelf space redistributed from existing products? Do retailers copycat sugar reduction efforts and give preferential treatment to their private-label sugar reduction efforts?
Third, we study secondary demand effects and shed light on where additional sales for new SKUs with reduced sugar come from. However, competitive dynamics seem to be an interesting area for additional research: Are some sugar reduction efforts more likely to be imitated by competitor brands than others, and if so, why? Similarly, do some brands stand to gain more from imitating (vs. innovating on) sugar reduction efforts than others?
Fourth, our analysis focuses on the performance of healthier products but does not speak to how marketing tools, including promotion decisions, may be used differently for healthier products or whether they may benefit from an advantageous marketing-mix effectiveness. Anecdotal evidence suggests that healthier products are promoted less often than their unhealthy counterparts; is this an empirical regularity and is it driven by differential effectiveness of promotions? In summary, better understanding how marketing can be used to promote such products provides a fruitful avenue for future research.
Lastly, our study, in the soda category, highlights the important role of marketing factors but ignores category-level contingency factors. More insights on the effectiveness of sugar reduction efforts in other categories and efforts to reduce other ingredients (e.g., fat, sodium) may help inform attempts to improve consumer health. We thus hope our study proves useful in sugar reduction efforts and stimulates further research in the increasingly important role of marketing in helping businesses achieve beneficial outcomes for a variety of stakeholders.
Supplemental Material
sj-pdf-1-jmx-10.1177_00222429231152181 - Supplemental material for A War on Sugar? Effects of Reduced Sugar Content and Package Size in the Soda Category
Supplemental material, sj-pdf-1-jmx-10.1177_00222429231152181 for A War on Sugar? Effects of Reduced Sugar Content and Package Size in the Soda Category by Kristopher O. Keller and Jonne Y. Guyt in Journal of Marketing
Footnotes
Acknowledgments
The authors thank Marnik Dekimpe, Inge Geyskens, Els Gijsbrechts, Katrijn Gielens, Rajdeep Grewal, Kyuhong Han, Harald van Heerde, Tarun Kushwaha, Arjen van Lin, Jan-Benedict Steenkamp, and the JM review team, as well as seminar participants at the University of North Carolina at Chapel Hill, University of Amsterdam Business School, 2020 Marketing Analytics Symposium Sydney, and INFORMS Marketing Science conference for their useful comments. Kristopher O. Keller acknowledges the support of the M. W. “Dyke” Peebles, Jr. Faculty Development Fund. The authors acknowledge the Kilts Center for Marketing at the University of Chicago Booth School of Business for providing access to the Nielsen RMS data. Researcher(s) own analyses calculated (or derived) based in part on data from The Nielsen Company (US), LLC and marketing databases provided through the Nielsen Datasets at the Kilts Center for Marketing Data Center at the University of Chicago Booth School of Business. The conclusions drawn from the Nielsen data are those of the researcher(s) and do not reflect the views of Nielsen. Nielsen is not responsible for, had no role in, and was not involved in analyzing and preparing the results reported herein.
Associate Editor
Kusum Ailawadi
Declaration of Conflicting Interests
The author(s) declared no potential conflicts of interest with respect to the research, authorship, and/or publication of this article.
Funding
The author(s) received no financial support for the research, authorship, and/or publication of this article.
Notes
Correction (March 2024):
This article has been updated to correct the typographical error on Table 6. The corrected statement now reads: “Enjoyment-oriented claims improve the effect of sugar reductions, whereas diet subbrands and health claims lower it.”
References
Supplementary Material
Please find the following supplemental material available below.
For Open Access articles published under a Creative Commons License, all supplemental material carries the same license as the article it is associated with.
For non-Open Access articles published, all supplemental material carries a non-exclusive license, and permission requests for re-use of supplemental material or any part of supplemental material shall be sent directly to the copyright owner as specified in the copyright notice associated with the article.