
Abstract
Patients at risk for hepatocellular carcinoma or liver cancer should undergo semiannual screening tests to facilitate early detection, effective treatment options at lower cost, better recovery prognosis, and higher life expectancy. Health care institutions invest in direct-to-patient outreach marketing to encourage regular screening. They ask the following questions: (1) Does the effectiveness of outreach vary among patients and over time?; (2) What is the return on outreach?; and (3) Can patient-level targeted outreach increase the return? The authors use a multiperiod, randomized field experiment involving 1,800 patients. Overall, relative to the usual-care condition, outreach alone (outreach with patient navigation) increases screening completion rates by 10–20 (13–24) percentage points. Causal forests demonstrate that patient-level treatment effects vary substantially across periods and by patients’ demographics, health status, visit history, health system accessibility, and neighborhood socioeconomic status, thereby facilitating the implementation of the targeted outreach program. A simulation shows that the targeted outreach program improves the return on the randomized outreach program by 74%–96% or $1.6 million to $2 million. Thus, outreach marketing provides a substantial positive payoff to the health care system.
Keywords
In 2018, over 1.7 million new cases of cancer were diagnosed in the United States, and the cost of cancer care surpassed $147 billion (National Cancer Institute 2018). Following the guidelines of the National Comprehensive Cancer Network (2018), health care institutions encourage at-risk patients to undergo regular screening, as this opens the door for early detection, more cost-effective treatment options, and better recovery prognosis. Regular screening reduces mortality rates for lung (20% drop; Humphrey et al. 2013), breast (20%–40% drop; Oeffinger et al. 2015), and liver (37% drop; Zhang, Yang, and Tang 2004) cancers. Moreover, cancer screening can reduce annual treatment costs by nearly $5,000 (Benoit, Grönberg, and Naslund 2001).
Health care institutions invest heavily in direct-to-patient outreach interventions to increase screening completion among at-risk patients. For example, Johns Hopkins Hospital’s cancer center uses emails, letters, seminars, and community events to encourage screening completion among patients (Johns Hopkins Medicine 2019). With 1.7 million outreach interventions launched in 2015, and $123 million spent on prevention and education efforts, 1 only 8% of U.S. adults over 35 years old utilize preventive services (Borsky et al. 2018). This percentage is too low. Health care institutions face three challenges in improving outreach effectiveness.
First, most studies examine only the main effects of medical interventions (e.g., Singal, Pillai, and Tiro 2014; Singal et al. 2019), neglecting variation due to patient demographics, health status, visit history, health system accessibility, and neighborhood socioeconomic status (Figueroa and Jha 2018). By incorporating this heterogeneity in patient response to outreach interventions, health care institutions can implement “personalized health care marketing” and boost outreach effectiveness. Second, medical scholars typically compare the relative efficacy of outreach interventions using a single-period research design (e.g., Basch et al. 2006). Given the importance of regular screening compliance over multiple periods (Chubak and Hubbard 2016), it is critical to evaluate screening compliance over multiple periods. Third, quantifying the return on outreach interventions to incorporate the health benefits and financial cost of interventions will help health care institutions communicate the tangible value they bring to the community and enable funding agencies to sustain these interventions (Andersson et al. 2008). As the director of cancer education for the Stanford Cancer Center notes, “durable, long-term solutions will require a substantial investment in academic/community partnerships to improve cancer education” (Conger 2010).
To addresses these three challenges, we use a multiperiod randomized field experiment conducted at a large hospital system with at-risk patients for hepatocellular carcinoma (HCC), the most common type of primary liver cancer (Singal et al. 2019). Patients were randomly assigned (1:1:1) to three conditions: usual care, outreach alone, or outreach with patient navigation. Usual care is the baseline condition in which physicians offer preventive care recommendations at their discretion during a patient’s usual care visits. As we describe subsequently, outreach alone and outreach with patient navigation provide two different levels of marketing using outreach mails, outreach calls, and customized motivational education by trained patient navigators. The focal outcome is the patient’s screening completion status within 6 months (Period 1), 6–12 months (Period 2), and 12–18 months (Period 3) of the initial randomization. This enables an investigation of the impact of outreach interventions on regular screening compliance. We evaluated screening completion status every 6 months, as this interval has been demonstrated to increase early detection and survival compared with longer screening intervals (Santi et al. 2010). To incorporate patient heterogeneity, we iteratively construct the focal covariates based on the extant medical literature and pragmatic considerations that the study design affords, including patients’ demographics, health status, visit history, health system accessibility, neighborhood socioeconomic status, and prior screening compliance.
Relative to the baseline condition, outreach alone (outreach with patient navigation) increases screening completion rates by 10–20 (13–24) percentage points, but the effectiveness of the two outreach interventions does not significantly differ. Central to this article, the similarity in these main effects masks considerable heterogeneity in outreach effectiveness due to patient-level differences (Blanchard et al. 2012). We uncover patient-level treatment effects of these two interventions using causal forests, a state-of-the-art development in the machine learning and economics literature (Wager and Athey 2018). Results show the following: (1) compared with outreach alone, outreach with patient navigation induces a higher proportion of patients with significant positive heterogeneous treatment effects in Periods 2 (9%) and 3 (23%); (2) the increased screening completion from outreach alone or outreach with patient navigation is higher for patients who are female, are part of a racial/ethnic minority, have a better health status, have a more frequent visit history, are covered by medical-assistance insurance, reside in closer proximity to clinics, and reside in a more populated neighborhood; (3) the increase in screening completion due to outreach alone is higher for patients who are younger, commute faster, and reside in a neighborhood with more public insurance coverage; in contrast, the increase in screening completion as a result of outreach with patient navigation is higher for patients who are older and reside in a higher-income neighborhood.
Incorporating patient-level differences in their responsiveness to outreach interventions, and a well-established scheme of cost–benefit calculation that quantifies health benefits and financial costs associated with outreach interventions (e.g., Goossens et al. 2017), we assign patients to the baseline, outreach-alone, or outreach-with-patient-navigation condition in each period on the basis of their predicted treatment effect and predicted net return. As a result, the commensurate return on the patient-level targeted outreach program is $3,704,270–$4,167,419 when extrapolated to 3,217 eligible patients in the hospital’s database. The targeted outreach program improves the return on the randomized outreach program ($2,130,921) by 74%–96%.
We make several contributions to marketing theory and health care practice. First, the literature on marketing interventions in health care (Table 1, Panel A) typically relies on experimentally manipulated moderators, such as test accuracy (Luce and Kahn 1999) or consumer goals (Wang, Keh, and Bolton 2010); while theoretically interesting, they are impractical for health care institutions to implement. Health care institutions can readily utilize observable patient characteristics—such as ethnicity, visit history, and insurance coverage—that are of theoretical relevance. The bulk of the marketing literature has focused on attitudinal consequences using self-reports of behavioral intentions (e.g., Bolton et al. 2008), risk perceptions (e.g., Menon, Block, and Ramanathan 2002), and attitudes (e.g., Basil and Brown 1997) in a lab setting. While insightful, they are of little practical relevance to addressing actual health care behaviors such as screening completion among real patients.
Literature Review on Cancer Care and Preventive Care.

a The authors note that they were unable to find the heterogeneity of treatment effect due to the small sample size in each subgroup.
Notes: References are provided in Web Appendix H.
Second, we extend the medical literature on cancer outreach effectiveness, which has focused primarily on the main effects of cancer outreach interventions from randomized field studies (Table 1, Panel B). The causal forests approach provides a practical way to improve the efficacy and external validity of field experiments by systematically exploring the treatment-effect heterogeneity across intervention types, across patient subgroups, and over time without prespecifying the sources of heterogeneity (Cook and Campbell 1979; Lynch 1982).
Third, we provide insights into what patient subgroup benefits more (less) from outreach interventions, offer ways to customize the interventions, and help practitioners allocate limited financial resources to those with the largest potential gains. For example, while outreach programs typically target diverse, socioeconomically difficult-to-reach disadvantaged patient populations to improve their health outcomes (Singal et al. 2019), patients more responsive to outreach interventions tend to be female, be part of a minority, be in good health status, have more frequent visit history, be covered by medical-assistance insurance, reside in closer proximity to clinics, and reside in more populated neighborhoods. Thus, simply targeting one or two patient characteristics may not maximize the gains from the outreach interventions.
Fourth, our approach provides a roadmap for implementing personalized health care marketing by customizing outreach interventions and quantifying the return on such interventions. Using patient-level treatment effect estimates with valid confidence intervals, we not only provide a tool that can recommend the most suitable intervention for each patient given their profile but also provide an individual-level cost–benefit analysis to measure the return on personalized health care marketing investments.
Institutional Setting, Study Design, and Data
Institutional Setting: Cancer Outreach and the Importance of Regular Screening
Our field experiment is based on the cancer outreach efforts of a large hospital system to increase regular screening completion for early detection of HCC, the most common form of liver cancer, among patients with higher risk of HCC. Most patients with liver cancer do not display symptoms until it reaches an advanced stage; they often miss the time window during which treatment options, such as transplant and surgical resection, are effective. The five-year survival rate for early-stage liver cancer patients who undergo surgery is 60%–70%, while the five-year relative survival rate for liver cancer is 18% (American Cancer Society 2019). Yet, the utilization rate of HCC screening is below 20% in the general cirrhotic population, and even lower among low-socioeconomic-status and non-Caucasian patients (Singal et al. 2012).
The outreach program was designed to promote regular screening (i.e., obtain a screening every six months). The six-month screening interval is in line with the evidence-based recommendations issued by the American Association for the Study of Liver Diseases and National Comprehensive Cancer Network (e.g., Marrero et al. 2018; Tzartzeva et al. 2018). It was initially based on tumor doubling times and (1) is better for early detection than longer intervals (e.g., 12 months; Santi et al. 2010) but worse than shorter intervals (e.g., 3 months; Trinchet et al. 2011) and (2) minimizes patient and provider burden (Bruix and Sherman 2011).
The hospital system conducted a randomized trial between December 2014 and March 2017. The study was approved by the University of Texas Southwestern Medical Center Institutional Review Board. The trial protocol is available on clinicaltrials.gov (NCT02312817), where the study is registered. The random assignment (1:1:1) consisted of one baseline condition (no outreach) and two conditions with outreach interventions (outreach alone and outreach with patient navigation), with the outcome being HCC screening completion status. 2
Study Design
Sample
The eligibility criteria for patient inclusion using established norms have been developed in the medical field (for details, see Web Appendix A1). From the 3,217 eligible patients in the hospital’s database, 1,800 patients were randomly selected for the study. 3
Focal independent variable: intervention type
As we summarize in Figure 1, each patient was randomly assigned to one of three conditions in a 1:1:1 ratio:

Study design: Cancer outreach interventions.
Multiperiod study design and sample sizes in periods 2 and 3
To encourage regular screening completion, the study repeated the outreach-alone and outreach-with-patient-navigation interventions during each of the three periods. We define Period 1 as the time within 6 months of the first randomization, Period 2 as the time between month 6 and month 12 since the first randomization, and Period 3 as the time between month 12 and month 18 since the first randomization. In summary, the hospital system undertook the outreach interventions in all three periods, each period being six months apart, and each patient belonging to the same condition across the three periods. The goal of this design is to encourage screening in each period.
Once a patient has completed the screening in the first period, the patient does not exit the pool and is contacted in the second and third six-month periods. There are two exceptions to the repeated interventions: (1) if the patient completes the screening and is diagnosed with HCC during the experiment, the patient exits the pool as the providers must refer the patient for HCC treatment instead of routine screening; (2) if the patient completes the screening and dies during the course of the experiment, the patient cannot complete the screening in later periods. As a result, the sample size is 1,800 for Period 1, 1,772 for Period 2, and 1,743 for Period 3. 4 The sample sizes in the baseline, outreach-alone, and outreach-with-patient-navigation conditions are (600, 600, 600) for Period 1, (591, 592, 589) for Period 2, and (577, 584, 582) for Period 3.
Dependent variable: screening completion status
Screening completion status is measured as a patient getting an abdominal imaging screening test (1) or not (0). 5 We observe the dependent variable for each patient in Periods 1, 2, and 3.
Constructing Focal Covariates: An Iterative Approach
Taking theoretical and pragmatic considerations into account, we followed a four-step iterative approach to determine the focal covariates that inform patient heterogeneity in response to outreach interventions. This process of including covariates starts from original yet tentative variables available to researchers and is informed by a multifaceted understanding of theory models, prior studies, research questions, and practice. The approach resembles a theory-in-use process (e.g., Zeithaml et al. 2020) that iteratively intertwines exploratory and confirmatory research to incorporate the interplay of heterogeneity with treatment.
Step 1: Utilize original variables. We begin with the variables that are available in the electronic medical record system (EMR) and are relevant to practitioners and well-documented in medical research (and thus relevant to academic scholars).
6
These systems store and track key patients’ information such as patient demographics (e.g., Wetherell et al. 2013), health status (e.g., Ferrante, Chen, and Kim 2008), and visit history record (Skolnik 2011). As Table 1 shows, previous studies in health care have analyzed these “ready-for-use” variables in the EMR (e.g., Humiston et al. 2011; McCarthy et al. 2018).
Step 2: Construct theoretically relevant variables. We use the information available in the EMR to construct new variables that are not captured by the raw unrefined data but draw on theories such as health belief model and protection motivation theory (e.g., Lisjak and Lee 2014; Moorman and Matulich 1993). Thus, a patient’s health insurance and location information proxy their insurance coverage (financial access to care) and proximity to clinics (geographical access to care). This is consistent with the research showing that health system accessibility and “improving health system accessibility across the socio-economic spectrum” (Australian Digital Health Agency 2018, p. 19) is a strategic priority for policy makers (Provincial Health Services Authority 2011).
Step 3: Explore external secondary data sources. To supplement the previous steps, we also gather additional data from external secondary sources. Socioeconomic factors can help marketing researchers develop a better understanding of understudied and underserved consumers (MacInnis et al. 2020). We collect data on each patient’s neighborhood socioeconomic status—including educational attainment, income, commute time, private/public health insurance coverage, employment status, and population—by collecting zip-code-level data from American Community Survey.
Step 4: Incorporate contextually relevant variables. Along with variables that are static in nature, we include each patient’s screening compliance in prior periods. Incorporating cancer screening compliance across different periods (Chubak and Hubbard 2016) captures the temporal variation in screening completion. It also informs us how outreach effectiveness might vary due to patients’ prior behavioral pattern.
In summary, we include six sets of patient characteristics: (1) demographics including age, gender (coded as 1 if a patient is female, 0 otherwise), ethnicity (non-Hispanic Caucasian, Hispanic, Non-Hispanic African American, or other/unknown), and primary language (English, Spanish, or other); (2) health status, which includes Child-Pugh B (coded as 1 if Child-Pugh score is higher than 6, 0 otherwise), Charlson Comorbidity Index, presence of documented cirrhosis (coded as 1 if yes), etiology of liver disease (hepatitis C, hepatitis B, alcohol, nonalcoholic steatohepatitis, or other); (3) visit history, which includes the number of primary care visits in the year prior to cohort entry and receipt of hepatology care (coded as 1 if the patient received the hepatology care prior to cohort entry, 0 otherwise); (4) health system accessibility, which includes insurance coverage (commercial, Medicaid, medical assistance/charity, Medicare, self-pay, or unknown) and proximity to clinics (coded as 1 if there are more than three clinics in the zip code that matches the first three digits of the zip code 7 where the patient resides, 0 otherwise); (5) neighborhood socioeconomic status, which includes educational attainment (percentage with a bachelor’s degree or higher), income (per capita income), average commute time, insurance coverage (percentage with a private or public health insurance plan), unemployment rate, and population measured at the three-digit zip code level 8 ; and (6) screening completion status in the prior period(s) (coded as 1 if a patient completes the screening test in Periods 1 or 2, 0 otherwise). Table 2 describes each variable, its operationalization, and descriptive statistics. Web Appendix B compares the means of all variables across three conditions. Differences are statistically nonsignificant, showing that random assignment was successful.
Summary Statistics.

a We used zip code to identify the neighborhoods. All zip-code-level covariates are aggregated to the level of the first three digits by calculating the sum (i.e., population) or mean (bachelor’s degree or higher, mean travel time to work, and per capita income) across all five-digit zip codes that share the same first three digits.
Notes: After we exclude patients who were diagnosed with HCC or deceased, the screening completion rate is 38.5% in Period 2 and 35.4% in Period 3.
Model-Free Evidence
Figure 2, Panel A, shows the number of patients who completed screening in different periods. Whereas 435 patients (24%) completed the screening only once during the three periods, 660 patients (37%) did so more than once. For all three periods, more patients completed the screening with outreach alone (102) and outreach with patient navigation (134) than the usual care (36) condition. The evidence suggests that both interventions increase HCC screening.

Model-free evidence.
Figure 2, Panel B, shows screening completion rates in each condition in each period after excluding the patients who were deceased or diagnosed with HCC in the previous period(s). In Period 1, 25% in the no-outreach condition, 45% in the outreach-alone condition, and 48% in the outreach-with-patient-navigation condition underwent screening. The screening completion rate in the outreach-alone condition (difference = .198, p < .01) and the outreach-with-patient-navigation condition (difference = .232, p < .01) is significantly higher than the no-outreach condition. Results in Periods 2 and 3 show a similar pattern. Comparing the screening completion rate in the outreach-alone condition and the outreach-with-patient-navigation condition, there is no statistically significant difference in Period 1 (difference = .033, n.s.) or Period 2 (difference = .033, n.s.), and Period 3 (difference = .051, p < .10). The model-free evidence suggests that both outreach conditions outperform the baseline condition but do not differ in effectiveness relative to each other. 9
Empirical Strategy
Causal Forest Estimation of Patient-Level Treatment Effects
To draw inferences about the causal effect of different interventions, researchers typically estimate and compare the average treatment effects (i.e., main effects) of randomized interventions. Such a comparison may not consider that treatment effects vary across subgroups within and across treatment conditions. Moreover, to avoid searching for particularly responsive subgroups, medical researchers must register preanalysis protocols for clinical trials to specify which subgroups will be analyzed. Such protocols may fail to identify strong but unexpected treatment-effect heterogeneity, especially in emergent fields in which moderators are ex ante ambiguous. We use causal forests to address these two challenges (Wager and Athey 2018). Causal forests enable nonparametric estimation of patient-level treatment effects with valid asymptotic confidence intervals, without restrictions on the number of covariates or the need for a larger number of experimental conditions or repeated measures. Causal forests also alleviate concerns regarding spurious treatment-effect heterogeneity due to searching for particularly responsive subgroups (Web Appendix D1 and D2 compare causal forests with several established approaches). Next, we outline the potential outcome framework, followed by an overview of causal forests.
Potential outcome framework
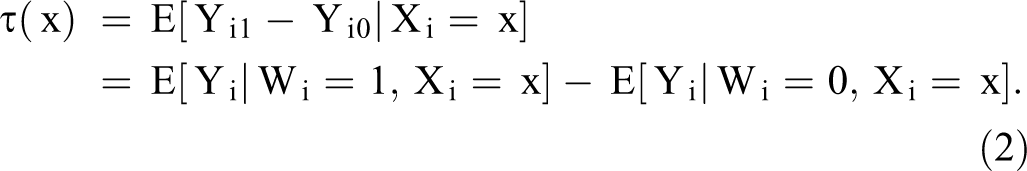
For illustration purposes, we consider the case of one period and the outreach-alone intervention (treatment condition) compared with no outreach/usual care (control condition). For a set of independent and identically distributed patients i = 1,…, n, we observe the outcome of interest Yi (screening completion), treatment assignment Wi (i.e., whether the patient is assigned to the outreach-alone or no-outreach condition), and vector of patient characteristics Xi (e.g., patient demographics, health status). Following the potential outcome framework (Rubin 1974), for each patient i, there are two potential outcomes: if a patient is assigned to the treatment condition, we observe the outcome Yi = Yi1, and if the patient is assigned to the control condition, we observe Yi = Yi0. We define the conditional average treatment effect (CATE) (i.e., treatment effect at x) to assess whether the treatment effect is heterogeneous among subgroups:

The fundamental challenge to identifying the CATE is that we only observe one of the two potential outcomes: Yi1 and Yi0. Thus, we must invoke the assumption of unconfoundedness to estimate the CATE (Rosenbaum and Rubin 1983). As patients are randomly assigned to one of the experimental conditions, the treatment assignment Wi is independent of the potential outcomes conditional on Xi (i.e.,
Common approaches to estimate the function
Causal forests
Causal forests combine causal inference in economics with random forests in machine learning. Random forests (Breiman 2001) deploy supervised machine learning algorithms to achieve high out-of-sample prediction accuracy with very little tuning, particularly with high dimensional data with underlying nonlinear relationships (Hastie, Tibshirani, and Friedman 2009). Random forests (1) build a large collection of individual decision trees such that each tree predicts the outcome variable given the vector of covariates and (2) average the predictions from those trees. First, each tree is trained on a bootstrap training sample (not on the original sample) with a randomly chosen subset of covariates (not with all the covariates), and it is built by recursively partitioning the chosen covariate space into splits, determining each split by minimizing the mean squared error of the prediction of outcomes in the case of regression trees. Given the tree split, each tree clusters the most similar observations into a terminal node known as a leaf. To predict the outcome of an observation outside of the estimation sample, each tree makes a prediction using the mean of outcomes in the leaf where this new observation belongs. Finally, a random forest averages the prediction from those trees.
Researchers have recently adapted random forests to draw inferences. The technique known as causal forests utilizes an algorithm for flexible modeling of interactions in high dimensions by building many causal trees and averaging their predictions to estimate the treatment effect function τ(x). Causal forests provide valid asymptotic confidence intervals for the treatment effects (Wager and Athey 2018).
Given a profile of patient characteristics x, tree-based models help identify the most similar patients locally in the patient characteristics space with an adaptive neighborhood metric (i.e., similar patients are in the same leaf). Wager and Athey (2018) adapt the regression tree to estimate the within-leaf treatment effects by taking the difference between the mean outcomes of treated and control units in the same leaf:

To ensure consistency and asymptotic normality, Wager and Athey (2018) prove a bias-reducing condition called honesty: a tree achieves honesty if each bootstrap training sample only uses the outcome of interest Yi to estimate the within-leaf treatment effect based on Equation 3 or to determine where to split the covariate space, but not both. In other words, the bootstrap training sample is further split into two subsamples: one used to build the tree (i.e., understand where the treatment heterogeneity is given the vector of covariates), 10 and the other used to estimate the treatment effects given the tree structure.
Using this process, causal forests produce an ensemble of B such trees (Breiman 2001; Wager and Athey 2018), each of which outputs an estimate
This aggregation scheme also helps reduce variance and smooths sharp decision boundaries (Bühlmann and Yu 2002). The variance estimate of causal forests is defined as follows (Efron 2014; Wager and Athey 2018; Wager, Hastie, and Efron 2014):

where
In marketing, causal forests have been applied in the context of customer retention (Ascarza 2018), information disclosure and physician payments (Guo, Sriram, and Manchanda 2019), and adoption of voice-activated shopping devices and consumers’ purchase quantity, spending amount, and search activities (Sun et al. 2019). To our knowledge, this is the first study to use causal forests in the context of randomized health care field experiments.
Application to our context
Following Singal et al. (2019), we have two different treatment conditions (outreach alone and outreach with patient navigation) and three different periods. We use the following procedure to perform six causal forest estimations. Additional aspects of the estimation are summarized in Web Appendix D3.
Step 1. Using patient characteristics as covariates,
11
we applied causal forests to obtain each patient’s treatment effect estimate in the sample that includes patients in the baseline (condition 1, sample size = 600) and those in the outreach-alone condition (condition 2, sample size = 600) in Period 1. For each patient i in condition 1 in Period 1, the patient-level treatment effect estimate is
Step 2. After excluding the patients who were deceased or diagnosed with HCC in the previous period(s), we repeated Step 1 to obtain
Step 3. We repeated Step 1 to obtain each patient’s treatment effect estimate in the sample that includes patients in the baseline (condition 1, sample size = 600) and those in the outreach-with-patient-navigation condition (condition 3, sample size = 600) in Period 1. For each patient in condition 1, the patient-level treatment effect estimate is
Step 4. We repeated Step 2 to obtain
Table 3 and Figure 3 show the distribution of the patient-level treatment effect estimates based on the causal forest estimation. Relative to the baseline condition, outreach alone (outreach with patient navigation) increases screening completion rate by between 10 and 20 (13 and 24) percentage points (Table 3, Panel A). Causal forests enable us to construct confidence intervals for patient-level treatment effect estimates. As we report in Table 3, Panel B, outreach-alone intervention induces positive and statistically significant treatment effects among 100%, 74%, and 66% of the patients in Periods 1, 2, and 3, respectively (p < .05), while the outreach-with-patient-navigation intervention does so among 100%, 83%, and 89% of the patients in Periods 1, 2, and 3, respectively (p < .05).
Summary of Average Treatment Effects (ATEs) and Patient-Level Conditional Average Treatment Effects (CATEs) by Outreach Type.

a Statistical significance is at the 95% level.
Notes: CI = confidence interval.

Distribution of patient-level CATEs.
Germane to the focus of this article, there is substantial heterogeneity in those significant patient-level treatment effects: (1) compared with outreach alone, outreach-with-patient-navigation intervention induces a higher proportion of patients with significant positive treatment effect estimates in Periods 2 (83% − 74% = 9%) and 3 (89% − 66% = 23%), and (2) patient-level treatment effect estimates of outreach-alone (outreach-with-patient-navigation) intervention range from 5–31 (5–37) percentage points. Next, we investigate the sources of heterogeneity.
Incorporating Heterogeneity in Patient-Level Treatment Effects
We examine the treatment effect heterogeneity by correlating treatment effect estimates with patient characteristics. Accordingly, we estimated the following equations:

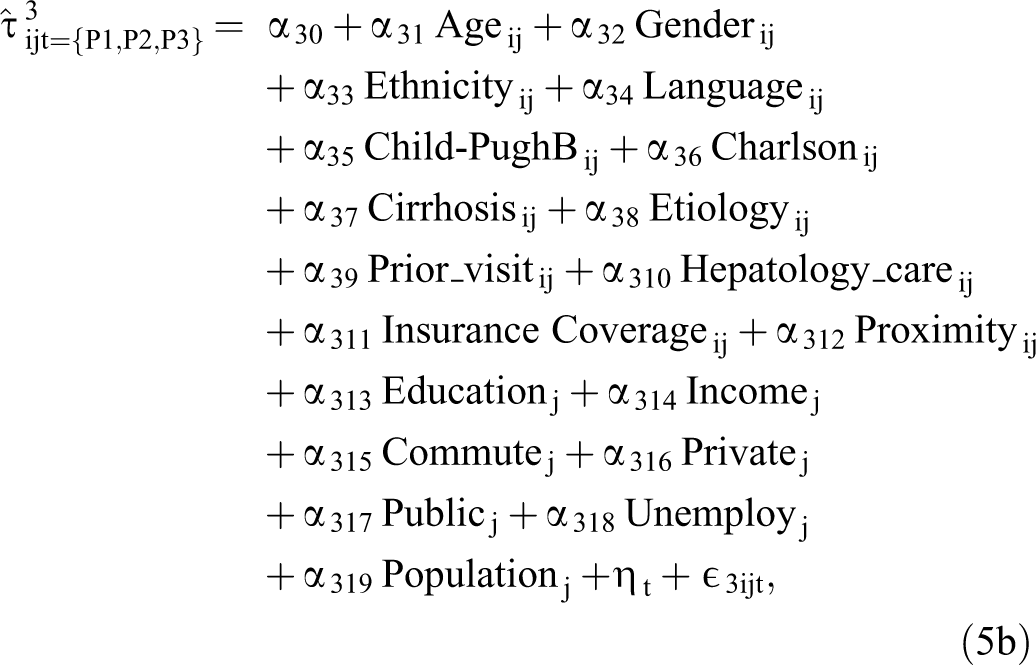
where
Columns 1 and 2 of Table 4 report the results showing the sources of heterogeneity in patient-level treatment effects. Next, we discuss the patient characteristics associated with the treatment effect heterogeneity.
Sources of Heterogeneity in Patient-Level CATEs.

*p < .05.
**p < .01.
***p < .001.
Notes: The baseline categories of main effects are male, non-Hispanic Caucasian, Hepatitis C, English, medical assistance/charity, and Period 1. We scaled continuous variables to zero mean and unit variance. As we pooled the estimates of three periods, sample sizes are 3,544 (1,200 + 1,183 + 1,161) and 3,539 (1,200 + 1,180 + 1,159) (see sample size columns of Table 3, Panel B).
Age
Older patients are less responsive to the outreach-alone intervention than younger patients (
Gender
Female patients are more responsive to both outreach interventions than male patients (outreach alone:
Ethnicity and language
Hispanic patients are more responsive to both outreach interventions than Caucasian patients (outreach alone:
Health status
Patients in a poorer health status (those with Child-Pugh B) are less responsive to both outreach interventions than patients with a better health status (outreach alone:
Visit history
Patients with a higher number of prior primary care visits are more responsive to both outreach interventions than those with fewer prior primary care visits (outreach alone:
Health system accessibility
Patients with insurance coverage through medical assistance/charity are generally more responsive to both outreach interventions than patients with other types of insurance (outreach alone:
Neighborhood socioeconomic status
Patients who live in more educated neighborhoods are not necessarily more or less responsive to interventions (outreach alone:
While patient-level insurance coverage should capture the impact of health system accessibility, the neighborhood-level health insurance coverage can also offer additional insights. Patients’ responsiveness to the outreach interventions does not vary by the degree of private health insurance coverage in their neighborhood (outreach alone:
Neighborhood unemployment rate does not significantly affect patients’ responsiveness to the interventions (outreach alone:
Additional post hoc analysis combining patient characteristics
As described in Columns 3 and 4 of Table 4, we explore possible combinations of patient characteristics with the interactions between prior primary care visits and other patient characteristics. This is akin to examining higher-order interactions in an analysis of variance. This analysis offers several insights.
The marginal benefit of additional primary care visits diminishes such that a patient’s primary care visit has a nonlinear effect on outreach intervention effectiveness. Referring to Columns 3 and 4 of Table 4, there is a positive linear coefficient (outreach alone: b = .020, p < .001; outreach with patient navigation: b = .022, p < .001) and a negative quadratic coefficient (outreach alone: b2 = −.003, p < .001; outreach with patient navigation: b2 = −.004, p < .001) for the effect. Jointly, the coefficients capture diminishing returns such that a patient’s first few primary care visits yield large marginal returns. Given the importance of the initial visits, health care professionals can enhance outreach effectiveness by targeting patients who have made fewer than numerous visits in the past.
The interactions between prior primary care visits and patient characteristics can help practitioners further identify the responsive subgroups. For example, Spanish-speaking patients’ responsiveness to outreach interventions is attenuated as primary care visits increase (coefficient = −.005 p < .001 for both outreach alone and outreach with patient navigation). It could be that Spanish-speaking patients perceive that outreach interventions are less informative than primary care visits. Practitioners may target Spanish-speaking patients who have no prior primary care visits in the past. Patients with Child-Pugh B are even less responsive to outreach interventions as primary care visits increase (outreach alone: coefficient = −.003 p < .001; outreach with patient navigation: coefficient = −.003, p < .01), suggesting that increased primary care visits compound the perception of a fear and death anxiety of having cancer triggered by outreach interventions and thus decrease the use of screening. Overall, our post hoc analysis highlights the need to understand how outreach effectiveness varies by the combination of patient characteristics.
Dynamics in the Proportion of Treatment Effects that Are Statistically Significant
The dynamics in the proportion of treatment effects that are statistically significant across each condition display an interesting pattern. As Figure E1 in Web Appendix E shows, there is very little heterogeneity in Period 1 in terms of the proportion of treatment effects that are statistically significant. Specifically, 100% (100%) of the treatment effects due to outreach alone (outreach with patient navigation) are statistically significant in Period 1. However, compared with outreach alone, outreach with patient navigation induces a higher proportion of patients with significant positive treatment effect estimates in Period 2 (83% vs. 74%) and Period 3 (89% vs. 66%). The effectiveness of the outreach with patient navigation relative to outreach alone improves over time. Medical and health care professionals believe that exposure to outreach nurtures the motivation for screening compliance, which is the crucial first step. Once patients are compliant to screening, potential barriers to getting screening may be addressed in subsequent periods. Thus, it is possible that the heterogeneity in the proportion of significant treatment effects could be related to the repetition of the treatment over different periods.
As a thought experiment, we conducted an analysis investigating the extent of heterogeneity in the proportion of treatment effects that are statistically significant when we “turn off” the repeated nature of the treatment. In this analysis, we define the dependent variable as whether a patient undergoes a screening at least once in the short (0–6 months), medium (0–12 months), and long (0–18 months) runs. The goal of this approach is to study whether interventions can bring at-risk patients in for a screening at least once during the three periods investigated. We also wanted to understand if heterogeneity, in terms of proportion of treatment effects that are statistically significant, manifests when we “turn off” the repeated nature of the treatment. Web Appendix Figure E2 reports the screening completion rates and plots the patient-level treatment effects, and Table E2 reports the summary of the treatment effects across each condition. The main takeaways are as follows:
There is little heterogeneity in the proportion of treatment effects that are statistically significant. Web Appendix Table E2 reports that outreach-alone intervention induces positive and statistically significant treatment effects among 100%, 100%, and 99.9% of the patients in Periods 1, 2, and 3, respectively (p < .05), while the outreach-with-patient-navigation intervention does so among 100%, 99.7%, and 98.5% of the patients in Periods 1, 2, and 3, respectively (p < .05).
There remains substantial heterogeneity in the magnitude of treatment effects. Web Appendix Table E2 reports that patient-level treatment effect estimates of outreach-alone (outreach-with-patient-navigation) intervention range from 10–32 (11–37) percentage points.
Web Appendix Figures E1, E2, and Table E2 jointly show that the heterogeneity in the proportion of treatment effects that are statistically significant is related to the dynamics induced by the repeated nature of the treatment. Future research should investigate the sources of these dynamics.
Return on Cancer Outreach Interventions
We evaluate the return on outreach interventions among patients and across three periods:
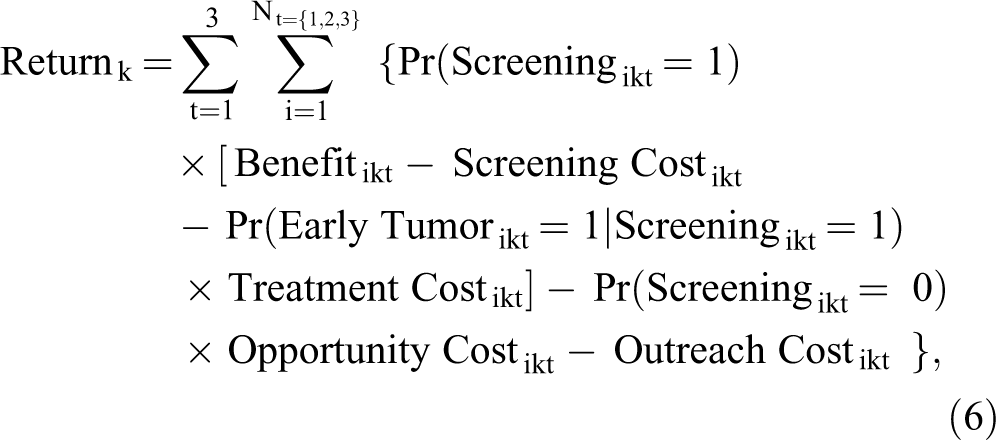
where If a patient completes the screening test: ○ The health care institution generates Benefitikt for patient i receiving intervention type k in period t, captured by the quality-adjusted life years of a patient attributable to the screening (typically expressed in the financial value in the medical literature). ○ The health care institution incurs Screening Costikt for patient i receiving intervention type k in period t, which includes the costs of an ultrasound/MRI/CT test or a combination of these tests (i.e., each patient can complete multiple tests). ○ Conditional on being detected with an early tumor, the health care provider incurs Treatment Costikt for patient i intervention type k in period t, which includes the costs of tumor resection, liver transplantation, and local ablative therapies. If a patient does not complete the screening test: ○ The health care institution incurs Opportunity Costikt if patient i receiving intervention type k in period t develops advanced HCC, which creates costs. Irrespective of whether the patient completes the screening test: ○ Outreach Costikt is incurred if the health care institution employs an outreach program. The outreach costs are higher for the outreach-with-patient-navigation than the outreach-alone condition and are zero for the baseline condition.
Research has documented that HCC screening completion with biannual ultrasound extends patients’ quality-adjusted life expectancy by 1.3 months, and HCC screening utilization with MRI does so by 2 months (Goossens et al. 2017). Patients may complete an ultrasound, an MRI, a CT scan, or a mix of these tests. We assume the average quality-adjusted life expectancy to be 1.65 months for each patient who completes the screening. The medical literature posits that the financial value per quality-adjusted life year is $50,000 (Andersson et al. 2008; Goossens et al. 2017). Thus, total benefits can be obtained by multiplying the number of quality-adjusted life years by the financial value per quality-adjusted life year ($50,000) (i.e., multiply total number of patients who complete the screening by average quality-adjusted life expectancy).
Table 5 presents the results of the benefit–cost calculation using Equation 6 for each condition in each period. We use the observed values in the data (e.g., actual number of patients who visit) in conjunction with parameters (e.g., early detection rate) from the medical literature to calculate the return in each condition in each period. Web Appendix F documents details on parameters from the medical literature.
Return on Nontargeted Outreach Interventions.
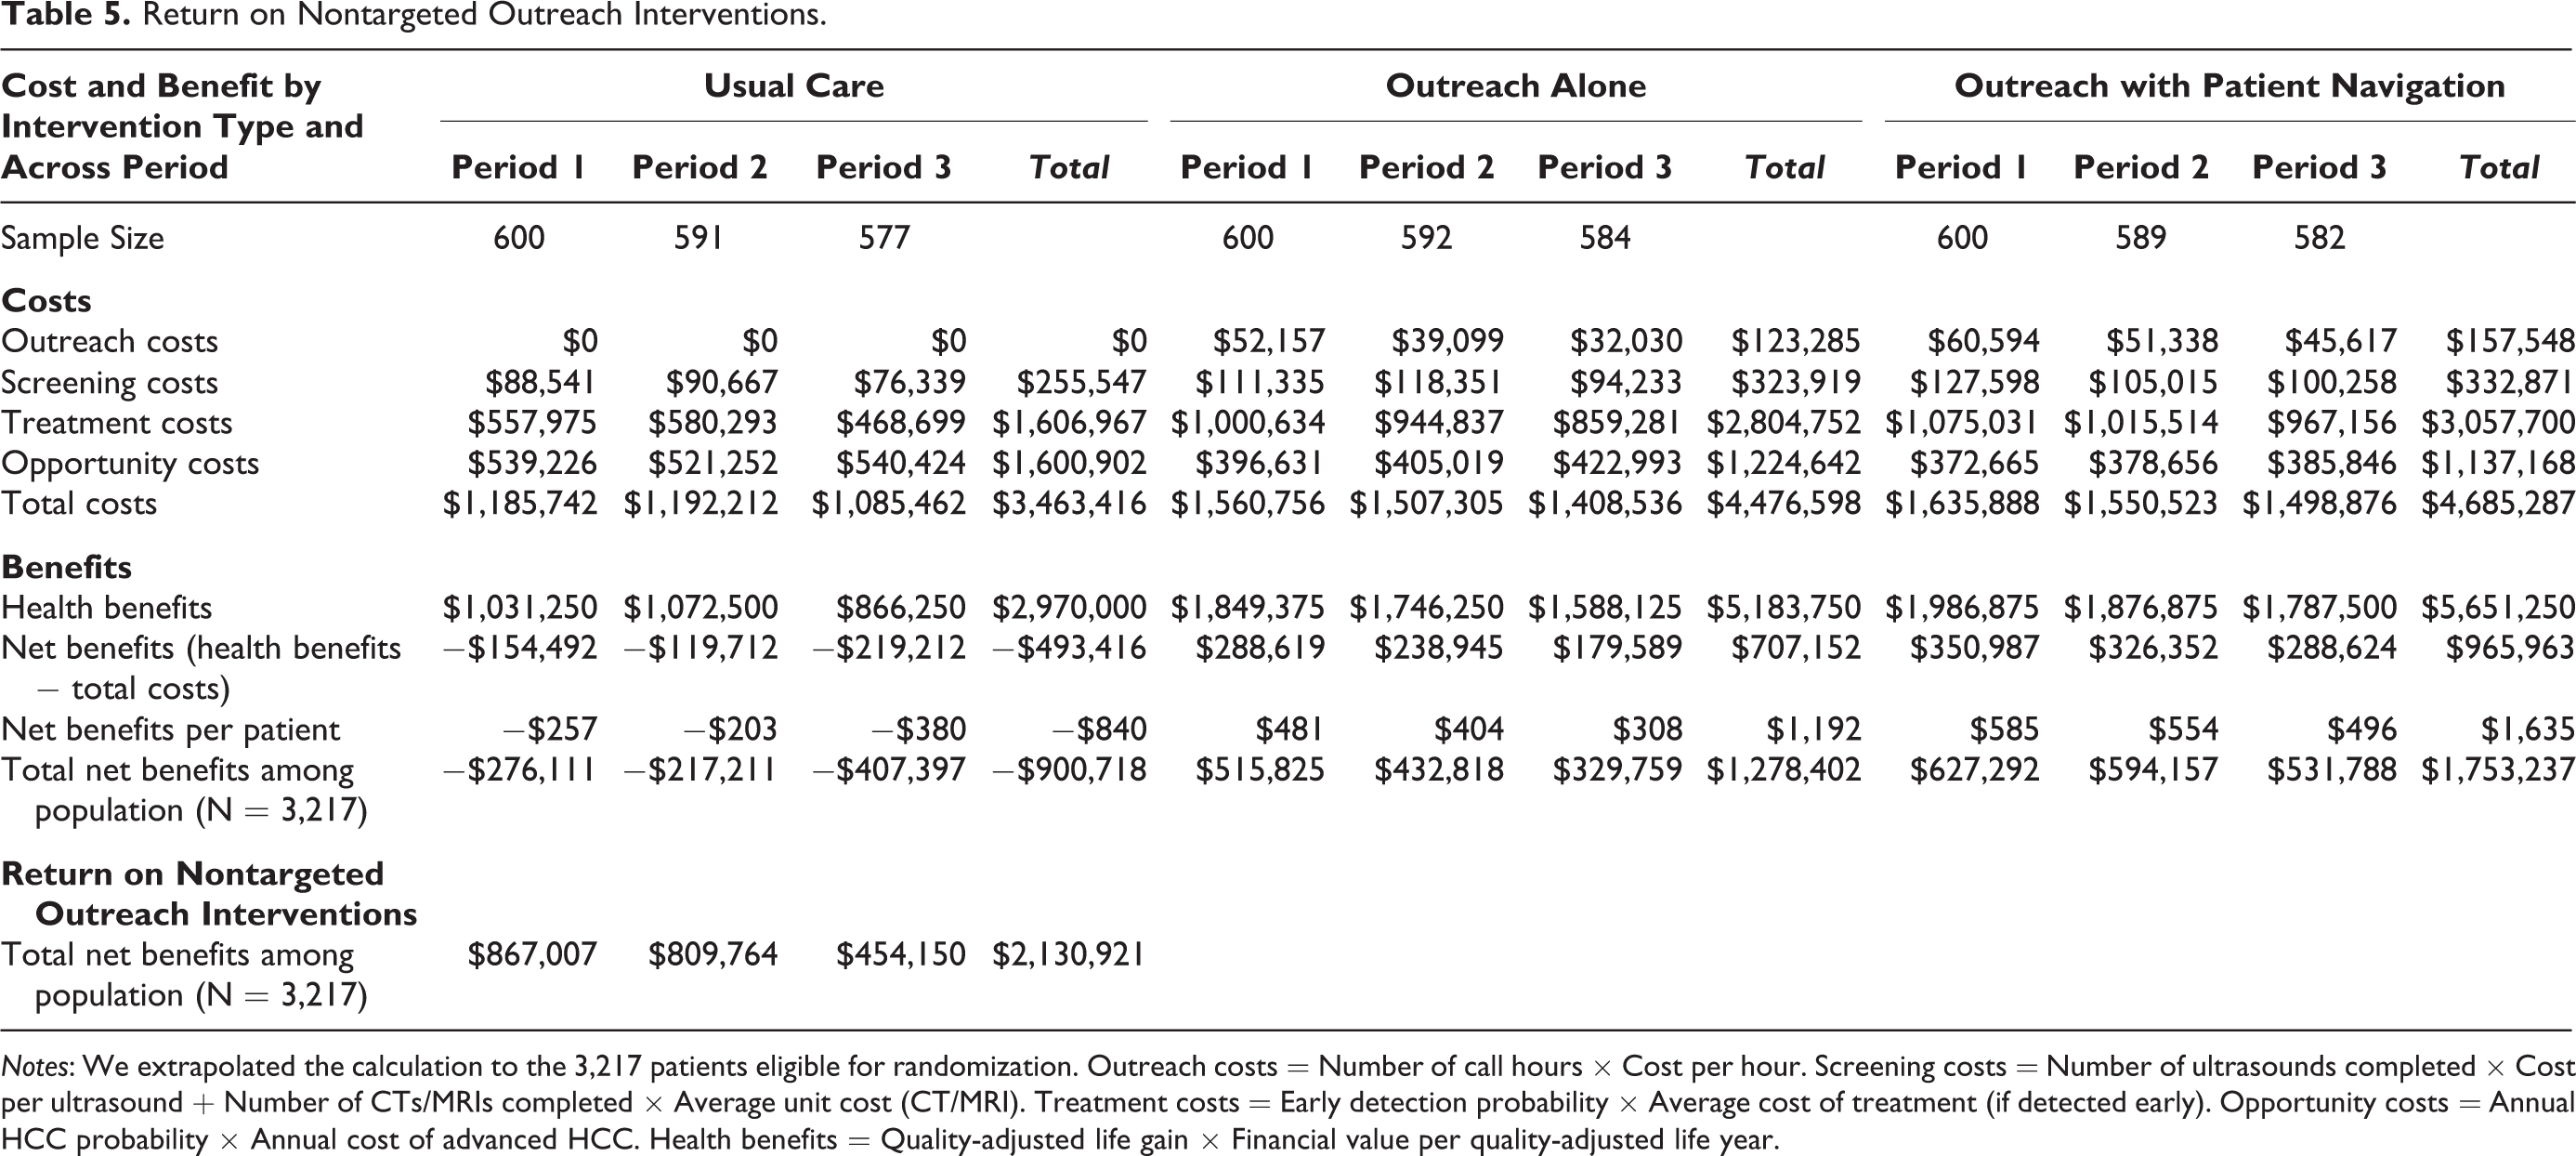
Notes: We extrapolated the calculation to the 3,217 patients eligible for randomization. Outreach costs = Number of call hours × Cost per hour. Screening costs = Number of ultrasounds completed × Cost per ultrasound + Number of CTs/MRIs completed × Average unit cost (CT/MRI). Treatment costs = Early detection probability × Average cost of treatment (if detected early). Opportunity costs = Annual HCC probability × Annual cost of advanced HCC. Health benefits = Quality-adjusted life gain × Financial value per quality-adjusted life year.
No-outreach condition
We observe that 150/600, 156/591, and 126/577 patients in no-outreach condition completed the screening in Periods 1, 2, and 3, respectively. The total benefits of the no-outreach condition across the three periods are estimated to be $2,970,000.
The screening costs are the total costs of ultrasound, CT, and MRI tests completed. The number of ultrasound (CT and MRI) tests completed is 127 (69), 149 (68), and 113 (59) in Periods 1, 2, and 3. The cost per ultrasound is $143, while the average cost of CT and MRI is $1,020. Thus, the total screening costs are estimated to be $255,547. Focusing on treatment costs, 5% of the total number of screening tests typically result in early tumor detection. The average treatment cost per patient for early tumor detection is $74,397 (Goossens et al. 2017). Given that 150/600, 156/591, and 126/577 patients in the no-outreach condition completed the screening in Periods 1, 2, and 3, 5% of them would undergo treatment costs, giving a total treatment cost of $1,606,967. Opportunity cost is incurred if patients who have not completed the screening develop advanced HCC. The annual cost of advanced HCC is $41,320, and the annual HCC probability is 2.9% (Goossens et al. 2017). Multiplying the number of patients who have not completed the screening in the no-outreach condition by the probability of HCC (2.9%) gives us a total opportunity cost of $1,600,902. Finally, outreach costs are zero in the no-outreach condition. Subtracting the total cost from the total benefit, the total return in the no-outreach condition is −$493,416, which translates to a loss of $840 per patient to the health care system.
Outreach-alone condition
Compared with the no-outreach condition, there are higher benefits in the outreach-alone case ($5,183,750 vs. $2,970,000), as there are 269/600 patients, 254/592 patients, and 231/584 patients who have completed the screening in Periods 1, 2, and 3, respectively. Using the same approach as the one used for no-outreach condition to calculate the costs, the screening costs, treatment costs, and opportunity costs, respectively, are $323,919, $2,804,752, and $1,224,642 in the outreach-alone condition. In addition, the total number of hours devoted to outreach calls is 3,477, 2,607, and 2,135. Assuming a $15 hourly wage, the total outreach cost in the outreach-alone condition is $123,285. Thus, the total return in the outreach-alone condition is $707,152, which translates to a gain of $1,192 per patient to the health care system.
Outreach-with-patient-navigation condition
Compared with the no-outreach condition, there are higher benefits in the outreach-with-patient-navigation condition ($5,651,250 vs. $2,970,000), as there are 289/600 patients, 273/589 patients, and 260/582 patients who would complete the screening. Following the same calculation approach, the screening costs, treatment costs, opportunity costs, and outreach costs are $332,871, $3,057,700, $1,137,168, and $157,548, respectively, in the outreach-with-patient-navigation condition. Thus, the total return in the outreach-with-patient-navigation condition is $965,963, which is substantially greater than that in the no-outreach condition and translates to a gain of $1,635 per patient to the health care system.
Summary of returns on nontargeted cancer outreach interventions
No outreach results in a net loss of $840 per patient to the medical hospital, whereas outreach alone (outreach with patient navigation) generates a monetary gain of $1,192 ($1,635) per patient. When extrapolated to the 3,217 patients eligible for randomization from the hospital’s patient database, the cancer intervention results in a loss of $900,718 from no outreach or usual care, a gain of $1,278,402 from outreach alone, and a gain of $1,753,237 from outreach with patient navigation. In this scenario, the total gain is $2,130,921.
Return on Patient-Level Targeted Cancer Outreach Interventions: A Simulation
Thus far, the calculation of return on cancer interventions has been based on the random assignment of patients and on patients remaining in the same condition over three periods. However, (1) there is heterogeneity in patient-level treatment effects of outreach-alone intervention and in those of outreach-with-patient-navigation intervention, (2) not all patient-level treatment effect estimates are statistically greater than 0, (3) treatment effect heterogeneity varies across periods, and (4) the net return on outreach interventions varies across intervention types and over time. As such, given each patient’s characteristics in a particular period, outreach with patient navigation is unlikely to be uniformly more effective than outreach alone. This poses two questions: (1) Given each patient’s observed characteristics, which intervention type is most suitable for each patient? and (2) For the same patient, does the most suitable intervention vary across periods? Accordingly, we conduct a simulation that assigns each patient to the most suitable condition in each period based on two types of allocation schemes: (1) predicted treatment effect and (2) predicted net return (see detailed procedure in Web Appendix G).
Recommended allocation based on predicted treatment effect
Conceptually, in each period, given each patient’s profile, we compare each patient’s treatment effect estimate in their corresponding condition (e.g., condition 2) with their simulated treatment effect estimate in the counterfactual condition (e.g., condition 3). Then we assign this patient to the best-suited intervention that generates a significantly higher treatment effect estimate (e.g., condition 3, p < .05). If none of these estimates is significantly larger than 0, we assign this patient to condition 1.
As we show in Table 6, Panel A, the recommended allocation for each period is as follows: Period 1: 0%, 99.9%, and .1% of patients are assigned to the no-outreach, outreach-alone, and outreach-with-patient-navigation conditions, respectively. Period 2: 9.0%, 74.0%, and 16.9% of patients in each condition, respectively. Period 3: 8.4%, 66.9%, and 24.7% of patients in each condition, respectively.
Simulation Results Based on Patient-Level Treatment Effect Estimates.
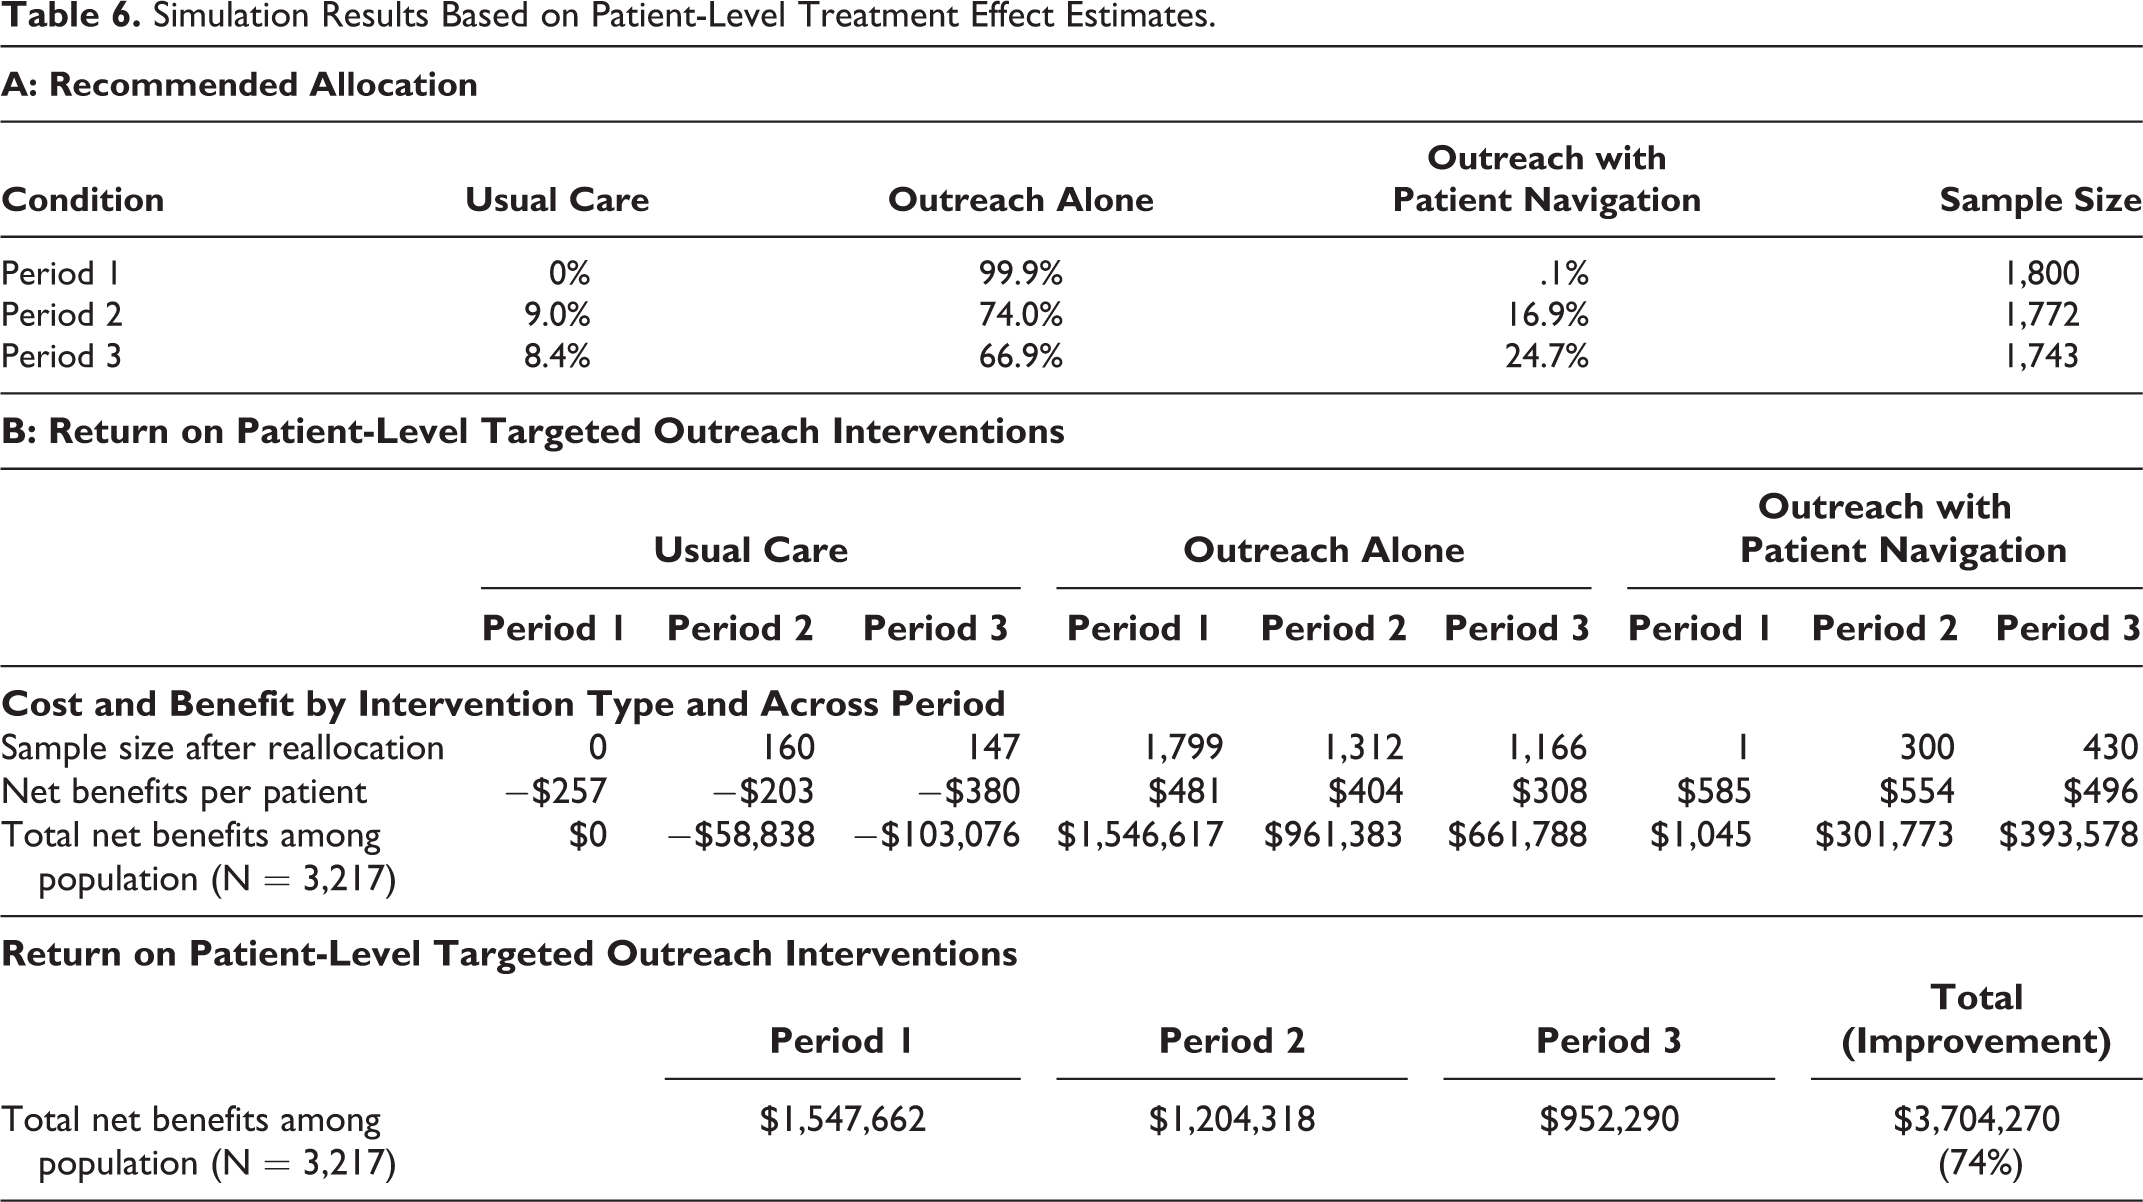
There are four noteworthy takeaways from this recommendation. First, the recommended split deviates from the original allocation based on the randomized controlled trial (1:1:1), suggesting that targeting induces asymmetric allocation of patients to different conditions. Second, there is a fraction of patients who stay in the baseline condition in Periods 2 and 3. For these patients, neither of the interventions is more effective than the baseline. Third, we reallocate most patients to the outreach-alone condition, suggesting that health care institutions can achieve the same level of effectiveness by aligning only moderate outreach efforts with these patients. Fourth, over time, the outreach-with-patient-navigation condition seems to be more effective, given the higher allocation to this condition (.1% in Period 1, 16.9% in Period 2, and 24.7% in Period 3).
Table 6, Panel B, shows the return on patient-level targeted outreach interventions. When extrapolated to the 3,217 patients eligible for randomization from the hospital’s patient database, patient-level targeted outreach program across conditions generates a gain of $1,547,662, $1,204,318, and $952,290 in Periods 1, 2, and 3, respectively. The total net return on patient-level targeted outreach program is $3,704,270, or 74% higher than that on nontargeted outreach program based on the random assignment ($3,704,270–$2,130,921 = $1,573,349).
Recommended allocation based on predicted net return
What if the health care system aims to maximize the overall return derived from assigning each patient to the most suitable intervention? As such, we can assign each patient to the intervention that gives the highest predicted net return based on Equation 6 rather than only the highest predicted treatment effect. Specifically, in each period, we compare each patient’s predicted net return in the corresponding condition (e.g., condition 2) with their simulated patient’s estimated net return in the counterfactual condition (e.g., condition 3). Then we assign the patient to the best-suited intervention that generates a significantly higher net return (e.g., condition 3, p < .05). If none of these estimates is significantly larger than 0, we assign this patient to condition 2 because the net return in the baseline condition is negative across all three periods (recall Table 5).
As we show in Table 7, Panel A, the recommended allocation for each period is: Period 1: 0%, 87.2%, and 12.8% of patients are assigned to the no-outreach, outreach-alone, and outreach-with-patient-navigation conditions respectively. Period 2: 0%, 79.3%, and 20.7% of patients in each condition, respectively. Period 3: 0%, 68.7%, and 31.3% of patients in each condition, respectively.
Simulation Results Based on Patient-Level Estimated Return.

There are two takeaways from this recommendation. First, no patient stays in the baseline condition under this allocation scheme, reflecting the goal of maximizing overall return. Second, while we still reallocate most patients to the outreach-alone condition, the outreach-with-patient-navigation intervention seems to be even more effective over time given the higher allocation to this condition than the previous allocation (e.g., 31.3% vs. 24.7% in Period 3).
Table 7, Panel B, shows the return on patient-level targeted outreach interventions. When extrapolated to the 3,217 patients eligible for randomization from the hospital’s patient database, the total net return on the patient-level targeted outreach program is $4,167,419, or 96% higher than that on the nontargeted outreach program based on the random assignment ($4,167,419 − $2,130,921 = $2,036,498). In summary, patient-level targeted outreach interventions improve the payoffs to the health care system by 74%−96%, or $1.6 million to $2 million.
Discussion
The difference in allocation based on predicted treatment effect versus predicted net return shows the versatility of our approach in providing practical guidance to medical professionals and policy makers. The nature and magnitude of benefits can shift based on the goals that a health care institution sets for itself. Using this approach, an organization can set its strategic goals to maximize the benefits from personalized outreach. These results also confirm that the cumulated benefits from repeated and upgraded health education through outreach with patient navigation can be enhanced using individually tailored outreach over time.
Discussion
Relying only on the main-effects analysis, scholars might conclude that the outreach with patient navigation and outreach alone are equally effective. However, our application of causal forests uncovers patient heterogeneity in outreach effectiveness and leads to different conclusions and important practical implications. Specifically, patients with different characteristics respond very differently to each intervention. For example, patients who are more responsive to outreach alone or outreach with patient navigation tend to be female, be part of minority populations, be in better health status, be covered by medical assistance, have closer proximity to clinics, and reside in a populated neighborhood. Patients who are more responsive to outreach alone tend to be younger, have faster commutes, and reside in neighborhoods with more public insurance coverage. Patients responsive to outreach with patient navigation tend to be older and reside in a higher-income neighborhood. Over time, the outreach-with-patient-navigation intervention becomes more effective for an increased proportion of patients. As such, we illustrate time-varying heterogeneity in the outreach effectiveness.
A cost–benefit analysis shows that the baseline condition results in a net loss of $840 per patient, whereas outreach alone (outreach with patient navigation) generates a gain of $1,192 ($1,635) per patient. When extrapolated to the 3,217 eligible patients, the total net gain of the nontargeted cancer outreach program across conditions is $2,130,921, which implies that outreach marketing provides a substantial positive payoff to the health care system. Our simulation shows that targeted outreach interventions can enhance this return by 74%−96%.
Research Implications
For the marketing discipline, this article provides a framework for better understanding and analyzing sufficiently powered field experiments that are based on random assignment of heterogeneous customers to different treatments. Instead of focusing only on the main effects of the treatment or a subset of individual-level covariates, causal forests flexibly predict personalized treatment effects based on high-dimensional, nonlinear functions of those covariates. Such an approach also obviates the need for choosing several one-way interactions a priori to test for heterogeneity or searching over many interactions for particularly responsive subgroups. Accordingly, this article provides a methodological solution to the field’s concern of external validity. Many empirical findings are typically much less generalizable than we imagine, because researchers lack a process and corresponding insights to identify moderators (i.e., the interaction of treatment and unmodeled/unmanipulated background factors) (Cook and Campbell 1979; Lynch 1982).
For the emerging discipline of personalized health care, we show that causal forests can identify particularly responsive subgroups without the need for a larger number of experimental conditions. While modern health care has implemented personalized medicine using genetic information, most health care outreach and educational programs still rely on untailored communications. Practitioners who manage these programs should recognize that the use of a large number of patient characteristics can substantially improve the outreach responsiveness through a tailored approach.
Our research also responds to a recent call for boundary-breaking marketing-relevant research (MacInnis et al. 2020) in several ways. First, our covariates are motivated by “real-world phenomena, rather than the constructs and theories in the marketing” (p. 11). Our findings that treatment effects vary across covariates not only engage “academics in other disciplines” (p. 1) but also offer important implications to the extant literature and theory going forward. Second, our findings have “life and death implications” (p. 9)—they help detect liver cancer at early stages. Third, our covariates, such as ethnicity, language, insurance coverage, and neighborhood socioeconomic status, elucidate how outreach effectiveness may vary among “understudied consumers such as minorities, privileged or impoverished classes, and marginalized consumers (e.g., special needs populations)” (p. 5).
Patient-Centric Health Care Marketing Implications
We urge hospitals and medical centers with outreach programs to leverage patient information to improve the effectiveness of outreach investments. Hospitals and health care practitioners should realize that a “one-size-fits-all” outreach program is neither effective nor economic. The use of machine learning can power data-driven patient-centric outreach programs that are also dynamically adaptive. Practitioners should consider both cross-sectional and temporal adaptation of outreach programs to maximize the benefit of health care interventions.
We urge policy makers in the federal, state, and local health departments, American Hospital Association, American Cancer Society, and American Liver Foundation to financially support personalized outreach programs. More hospitals should reach out to the underrepresented populations as they are more responsive to outreach messages; however, this requires additional resources and training. Incentivizing hospitals to reach out to patients with varying personal, clinical, structural, and socioeconomic backgrounds can also be effective. They should also engage a multidisciplinary group from health care, marketing, computer science, and other disciplines to fund an accumulation of comprehensive databases to facilitate even better targeting of patients to improve outcomes.
Limitations and Future Research
First, because patients have different barriers to screening, future research should test the effectiveness of different barrier-reduction strategies by analyzing the nature of communication between patients and the staff with the use of call recordings. Second, our study focuses on the endpoint outcome: screening completion. Future research could apply the notion of customer journey to disentangle which parts of the intervention (e.g., barrier discussion during an outreach call vs. reminder calls) are more effective at not only increasing completion but also reducing no-show rates or time to response, further enhancing the return. Third, although we track individual patients, outreach designed to serve an individual may have influenced other members of the household. Future research could study possible spillover effects of outreach interventions.
Supplemental Material
Supplemental Material, WEB_APPENDIX_3_17_2020 - Improving Cancer Outreach Effectiveness Through Targeting and Economic Assessments: Insights from a Randomized Field Experiment
Supplemental Material, WEB_APPENDIX_3_17_2020 for Improving Cancer Outreach Effectiveness Through Targeting and Economic Assessments: Insights from a Randomized Field Experiment by Yixing Chen, Ju-Yeon Lee, Shrihari (Hari) Sridhar, Vikas Mittal, Katharine McCallister and Amit G. Singal in Journal of Marketing
Footnotes
Acknowledgments
The authors would like to thank Len Berry for his feedback on an earlier draft.
Associate Editor
Oded Netzer
Declaration of Conflicting Interests
The author(s) declared no potential conflicts of interest with respect to the research, authorship, and/or publication of this article.
Funding
The author(s) disclosed receipt of the following financial support for the research, authorship, and/or publication of this article: This study was supported by National Cancer Institute R01 CA222900 and AHRQ R24HS022418. The content is solely the responsibility of the authors and does not necessarily represent the official views of the NIH or AHRQ.
Notes
References
Supplementary Material
Please find the following supplemental material available below.
For Open Access articles published under a Creative Commons License, all supplemental material carries the same license as the article it is associated with.
For non-Open Access articles published, all supplemental material carries a non-exclusive license, and permission requests for re-use of supplemental material or any part of supplemental material shall be sent directly to the copyright owner as specified in the copyright notice associated with the article.