
Abstract
The authors examine consumers’ information channel usage during the customer journey by employing a hedonic and utilitarian (H/U) perspective, an important categorization of consumption purpose. Taking a retailer-category viewpoint to measure the H/U characteristics of 20 product categories at 40 different retailers, this study combines large-scale secondary clickstream and primary survey data to offer actionable insights for retailers in a competitive landscape. The data reveal that, when making hedonic purchases (e.g., toys), consumers employ social media and on-site product pages as early as two weeks before the final purchase. By contrast, for utilitarian purchases (e.g., office supplies), consumers utilize third-party reviews up to two weeks before the final purchase and make relatively greater usage of search engines, deals, and competitors’ product pages closer to the time of purchase. Importantly, channel usage is different for sessions in which no purchase is made, indicating that consumers’ information channel choices vary significantly with the H/U characteristics of purchases. The article closes with an extensive discussion of the significant implications for managing customer touchpoints.
Keywords
With the proliferation of electronic commerce, examining the role of various information channels during the customer journey is becoming increasingly important. A “customer journey” is the series of actions a customer takes to arrive at the moment of purchase (Lemon and Verhoef 2016). Importantly, these actions include an examination of various information sources and the evaluation of alternatives before the purchase decision. Online information channels, which conveniently provide a variety of pertinent information (Shankar et al. 2011), significantly affect purchase decisions (Batra and Keller 2016; Li and Kannan 2014). As retailers’ spending on online marketing continues to grow, understanding how to best allocate resources across various touchpoints necessitates a “360-degree view” of how customers interact with and leverage multiple information channels throughout the customer journey (Kannan and Li 2017). Accordingly, several path-to-purchase information channels have garnered considerable attention, including search engines (Ghose and Yang 2009), social media (Rishika et al. 2013), review sites (Chevalier and Mayzlin 2006), deal sites (Kumar and Rajan 2012), and retailer product pages (Huang, Lurie, and Mitra 2009).
Given the nuances of customer journeys on the internet, identifying the mechanisms behind information channel choices and usage remains challenging. Channel choices and usage are contingent on diverse retailer- and product-category characteristics as well as heterogeneous consumer preferences. For example, retailers differ considerably in their product and service offerings, brand equity, and target customer segments, potentially influencing consumers’ information search behaviors. Moreover, consumers’ shopping characteristics (Kushwaha and Shankar 2013), prior shopping experience (Frambach et al. 2007), trust (Bart et al. 2005), and demographics (Inman, Shankar, and Ferraro 2004) may also lead to significantly different channel choices. Furthermore, channel choices are interdependent and could vary at various stages of the customer journey (De Haan, Wiesel, and Pauwels 2016; Moe 2003; Valentini, Montaguti, and Neslin 2011). Consequently, marketing managers continue to wrestle with how to best allocate resources for a variety of product offerings across an array of online touchpoints at different stages of the customer journey (Anderl, Schumann, and Kunz 2016; Batra and Keller 2016).
In addition to a utility-based perspective popular in the extant literature, recent studies have called for a social and psychological angle (e.g., Kushwaha and Shankar 2013) to investigate information channel usage patterns and customer journeys. Purpose has been identified as an important consideration. A recent study published by Google’s Zero Moment of Truth (Taniguchi 2019) finds consumer search behaviors to be driven by six needs: the need for surprise, help, reassurance, education, thrill, or the need to be impressed. These needs and purposes are shaped by not only the product category but also by where consumers are in their journey, namely their “path to purpose.”
In this study, we use a hedonic–utilitarian (H/U) perspective—a purpose-oriented categorization of consumption extensively studied in the marketing literature (Holbrook and Hirschman 1982)—to explore information channel usage patterns across customer journeys. The H/U characteristics of purchases reflect affective and instrumental motives, which could provide a richer picture of consumers’ perceptions toward purchases as well as consumers’ information search behaviors. For example, emotions such as fun and guilt have emerged as important considerations for hedonic purchases, with implications for preferences of certain information channels (Moe 2003; Schulze, Schöler, and Skiera 2014). Furthermore, many customer-centric measurement scales have been proposed to quantify the characteristics of product categories or brands based on the H/U dimensions (Babin, Darden, and Griffin 1994; Batra and Ahtola 1991; Voss, Spangenberg, and Grohmann 2003), which has the potential for large-scale analysis of individual customer journeys across a myriad of retailers and product categories.
Therefore, we contribute to the literature by examining how the usage of a rich set of digital information channels—search engines, social media, third-party reviews, deal sites, and product pages of target retailers and competing retailers—during the customer journey differs by the retailer-product-level H/U characteristics. The specific research questions we answer are the following: Do consumers use digital information channels differently for H/U purchases? How does this usage vary over the customer journey? Does this usage vary between converted and unconverted sessions?
We examine these research questions using both primary and secondary data. We first survey the H/U characteristics of 20 product categories sold by 40 retailers—a total of 115 retailer–product combinations. To understand the H/U effect on actual channel usage, we analyze a large volume of comScore clickstream data that includes all internet activities from 4,356 consumers with 22,751 purchases that account for $1.2 million sales during a 24-month period. We use a hierarchical Bayesian approach to consider channel interdependency, retailer, product, and individual heterogeneity in online information channel usage.
We find that consumers making hedonic purchases tend to utilize social media and product page views on the target retailer’s website more extensively than people engaging in utilitarian purchases. By contrast, consumers making utilitarian purchases tend to use search engines, third-party reviews, deal sites, and product page views on the competing retailer’s website more frequently than those engaging in hedonic purchases.
Furthermore, we explore the dynamics of channel usage between hedonic and utilitarian purchases throughout the customer journey. We find the H/U effect on the usage of social media and third-party review sites to be stronger earlier in the customer journey. Conversely, the effect of H/U differences on search engines and deal site usage is stronger closer to the point of purchase. While the H/U effect on product page views is significant throughout the customer journey, the magnitude decreases toward the end of the customer journey.
Finally, for unconverted hedonic purchases, consumers visit social media sites less often, visit deal sites more, and are more likely to benchmark with competing retailers’ product pages compared with converted sessions, suggesting a potential guilt-justification effect. For unconverted utilitarian purchases, the four channels that facilitate information search are less utilized, indicating an insufficient information search for purchase decisions.
Our research aims to make at least four important academic contributions. First, we extend the customer journey literature by complementing the utility-centric perspective with a social/psychological angle. We analyzed the H/U effect on six prepurchase information channels for 20 product categories across 40 retailers. An examination of this interplay is conceptually and theoretically significant because it provides a new angle to understand the role of affective mechanisms such as amusement seeking, guilt justification, and brand affect during the shopping process. Second, we uncover the dynamics of H/U effects throughout the customer journey, which allows more actionable insights for marketing managers and adds to the nascent research on the temporal effect of the customer journey (Batra and Keller 2016; Lemon and Verhoef 2016). Third, we highlight the importance of considering H/U characteristics at a more granular level. Unlike the existing H/U literature, which mostly focuses on product-level differences, our survey shows a considerable variation of H/U characteristics for similar product categories across retailers, calling for a retailer-category vantage point for future H/U research. Finally, we contribute to the literature regarding the use of Big Data for deriving marketing insights in complex digital environments (Bradlow et al. 2017; Kitchens et al. 2018; Sudhir 2016; Wedel and Kannan 2016). We demonstrate the benefits of conducting innovative Big Data marketing research by combining a variety of research methods and data sources. Our research utilizes survey analysis, clustering, text mining, and Bayesian modeling and seamlessly combines survey-based primary data and large-scale secondary clickstream. As a result, we provide a more comprehensive view of customer journey across channels and stages.
Our work offers several actionable implications for marketing managers’ digital spend allocation and online marketing strategies. We suggest that marketing managers collect consumers’ H/U perceptions of their product offerings relative to their competitors. Leveraging our empirical model, marketing managers can use the obtained H/U characteristics of their products to understand the shopping purposes of their customers, most valuable information channels, and the most common sequences of touchpoint prospects at different stages of the customer journey. Accordingly, they can design their marketing strategies on the basis of not only a utility-centric view but also the social/psychological needs of their customers (Batra and Keller 2016), thereby enhancing the consumer experience on the path to purchase (Lemon and Verhoef 2016).
Conceptual Development
Hedonic and Utilitarian Characteristics of Purchases
The importance and impact of consumer goals on the purchase process have been emphasized extensively in the prior literature. Different purpose-oriented categorizations of consumption have been employed, with search–experience (S/E) and H/U perhaps being the two most prevalent. In line with differences in the cognitive processes related to the acquisition of alternative forms of information, the S/E perspective highlights the different information-seeking behaviors associated with search goods and experience goods (Huang, Lurie, and Mitra 2009). By contrast, the H/U perspective emphasizes the bidimensional consumer attitudes toward brands and consumption that stem from affective and instrumental motives (Holbrook and Hirschman 1982). Hedonic consumption is based on the consumer’s experience of shopping, emotional attachment, focusing on fun, playfulness, enjoyment, excitement, and the need for surprise (Arnold and Reynolds 2003; Babin, Darden, and Griffin 1994). By contrast, utilitarian consumption is often more goal-directed and pertains to the need to complete specific tasks efficiently and effectively (Childers et al. 2002; Mathwick, Malhotra, and Rigdon 2001). Recent studies demonstrate the importance of H/U characteristics for purchases. For example, Kushwaha and Shankar (2013) show that consumers who make hedonic purchases are likely to utilize multiple purchase options. Moreover, Park et al. (2018) find that gamers’ social network ties on an online gaming platform significantly influence the spending for hedonic products.
The H/U perspective affords at least three opportunities to enrich and enhance insights gained through the S/E vantage point of purchases. First, the theoretical underpinnings for H/U draw from cognitive/social psychology—particularly in consideration of both affective and cognitive attitudes (Batra and Ahtola 1991; Sirgy 1982). These affective–cognitive trade-offs have the potential to complement the utility-centric information-seeking view adopted by the S/E perspective (Nelson 1970). For instance, emotions such as pleasure and guilt have emerged as important considerations for certain forms of consumption, with implications for path-to-purchase channels such as social media (Schulze, Schöler, and Skiera 2014). Furthermore, when processing information about the product (e.g., the product name), consumers process hedonic products more holistically than utilitarian products (Melnyk, Klein, and Volckner 2012). Second, in contrast to the S/E’s narrow focus on the product categories, the H/U perspective enables customer-centric thinking by quantifying the H/U characteristics of product categories or brands from the customer’s perspective. One of the most popular scales (from Voss, Spangenberg, and Grohmann 2003) allows measurement of the customer’s perceived H/U characteristics of purchases at both the product-category and retailer levels, making it highly conducive to a large-scale examination of purchases from different customers on various retailers’ product categories.
Third, the hedonic and utilitarian dimensions are independent (Voss, Spangenberg, and Grohmann 2003). As Batra and Ahtola (1991, p.161) observe, hedonic and utilitarian “motivations for consumption need not be (and usually are not) mutually exclusive: a toothpaste may both prevent cavities and provide pleasure from its taste.” Thus, the bidimensional analysis allows for granular assessment of the role of purpose in the customer journey. For these three reasons, we use H/U as our primary perspective to examine path-to-purchase channels. However, to be more holistic in our operationalization of purpose, we also include S/E as a control variable in our model.
Despite the tremendous potential of the H/U perspective to enhance our understanding of path-to-purchase tendencies, prior studies have typically not considered the role of H/U characteristics on consumers’ channel usage during the purchase funnel. In addition, previous studies of customer journeys focus on a few channels or on a single retailer site, which calls for a more comprehensive view with multiple channels, product categories, and retailers. Moreover, H/U characteristics are not unique to the product (category) level but also manifest at the retailer (brand) level (Voss, Spangenberg, and Grohmann 2003). Furthermore, there is potential for differences in consumers’ behavior between product-category-level and retailer-level H/U characteristics. For example, independent of the product, consumers demonstrate greater affective involvement with hedonic retailers and relatively more cognitive involvement with utilitarian retailers (Zaichkowsky 1994). In addition, retailer-level characteristics are usually associated with brand positioning (Park, Jaworski, and MacInnis 1986). These findings suggest the potential for a simultaneous retailer- and product-category-level effect that may influence H/U motivations.
To illustrate this effect, we conducted a survey involving 3,250 Amazon Mechanical Turk (MTurk) participants to report their H/U perceptions toward 115 common retailer categories. Each participant randomly evaluated the H/U characteristics for six retailer-category combinations, resulting in approximately 100 responses for each retailer-category combination. Figure 1 shows the H/U plots for some common product categories at Walmart, Home Depot, and Amazon (Panel A), and within Amazon (Panel B). Looking at the Panel A, we see that the same product category is perceived differently across retailers. For the electronics category, Home Depot is positioned low on utilitarian and in the middle for hedonic, while Amazon and Walmart are high on both utilitarian and hedonic dimensions. Similarly, Amazon’s jewelry and sports products are considered more hedonic relative to Walmart’s. Panel B shows differences in consumer H/U perceptions across many of Amazon’s product categories.
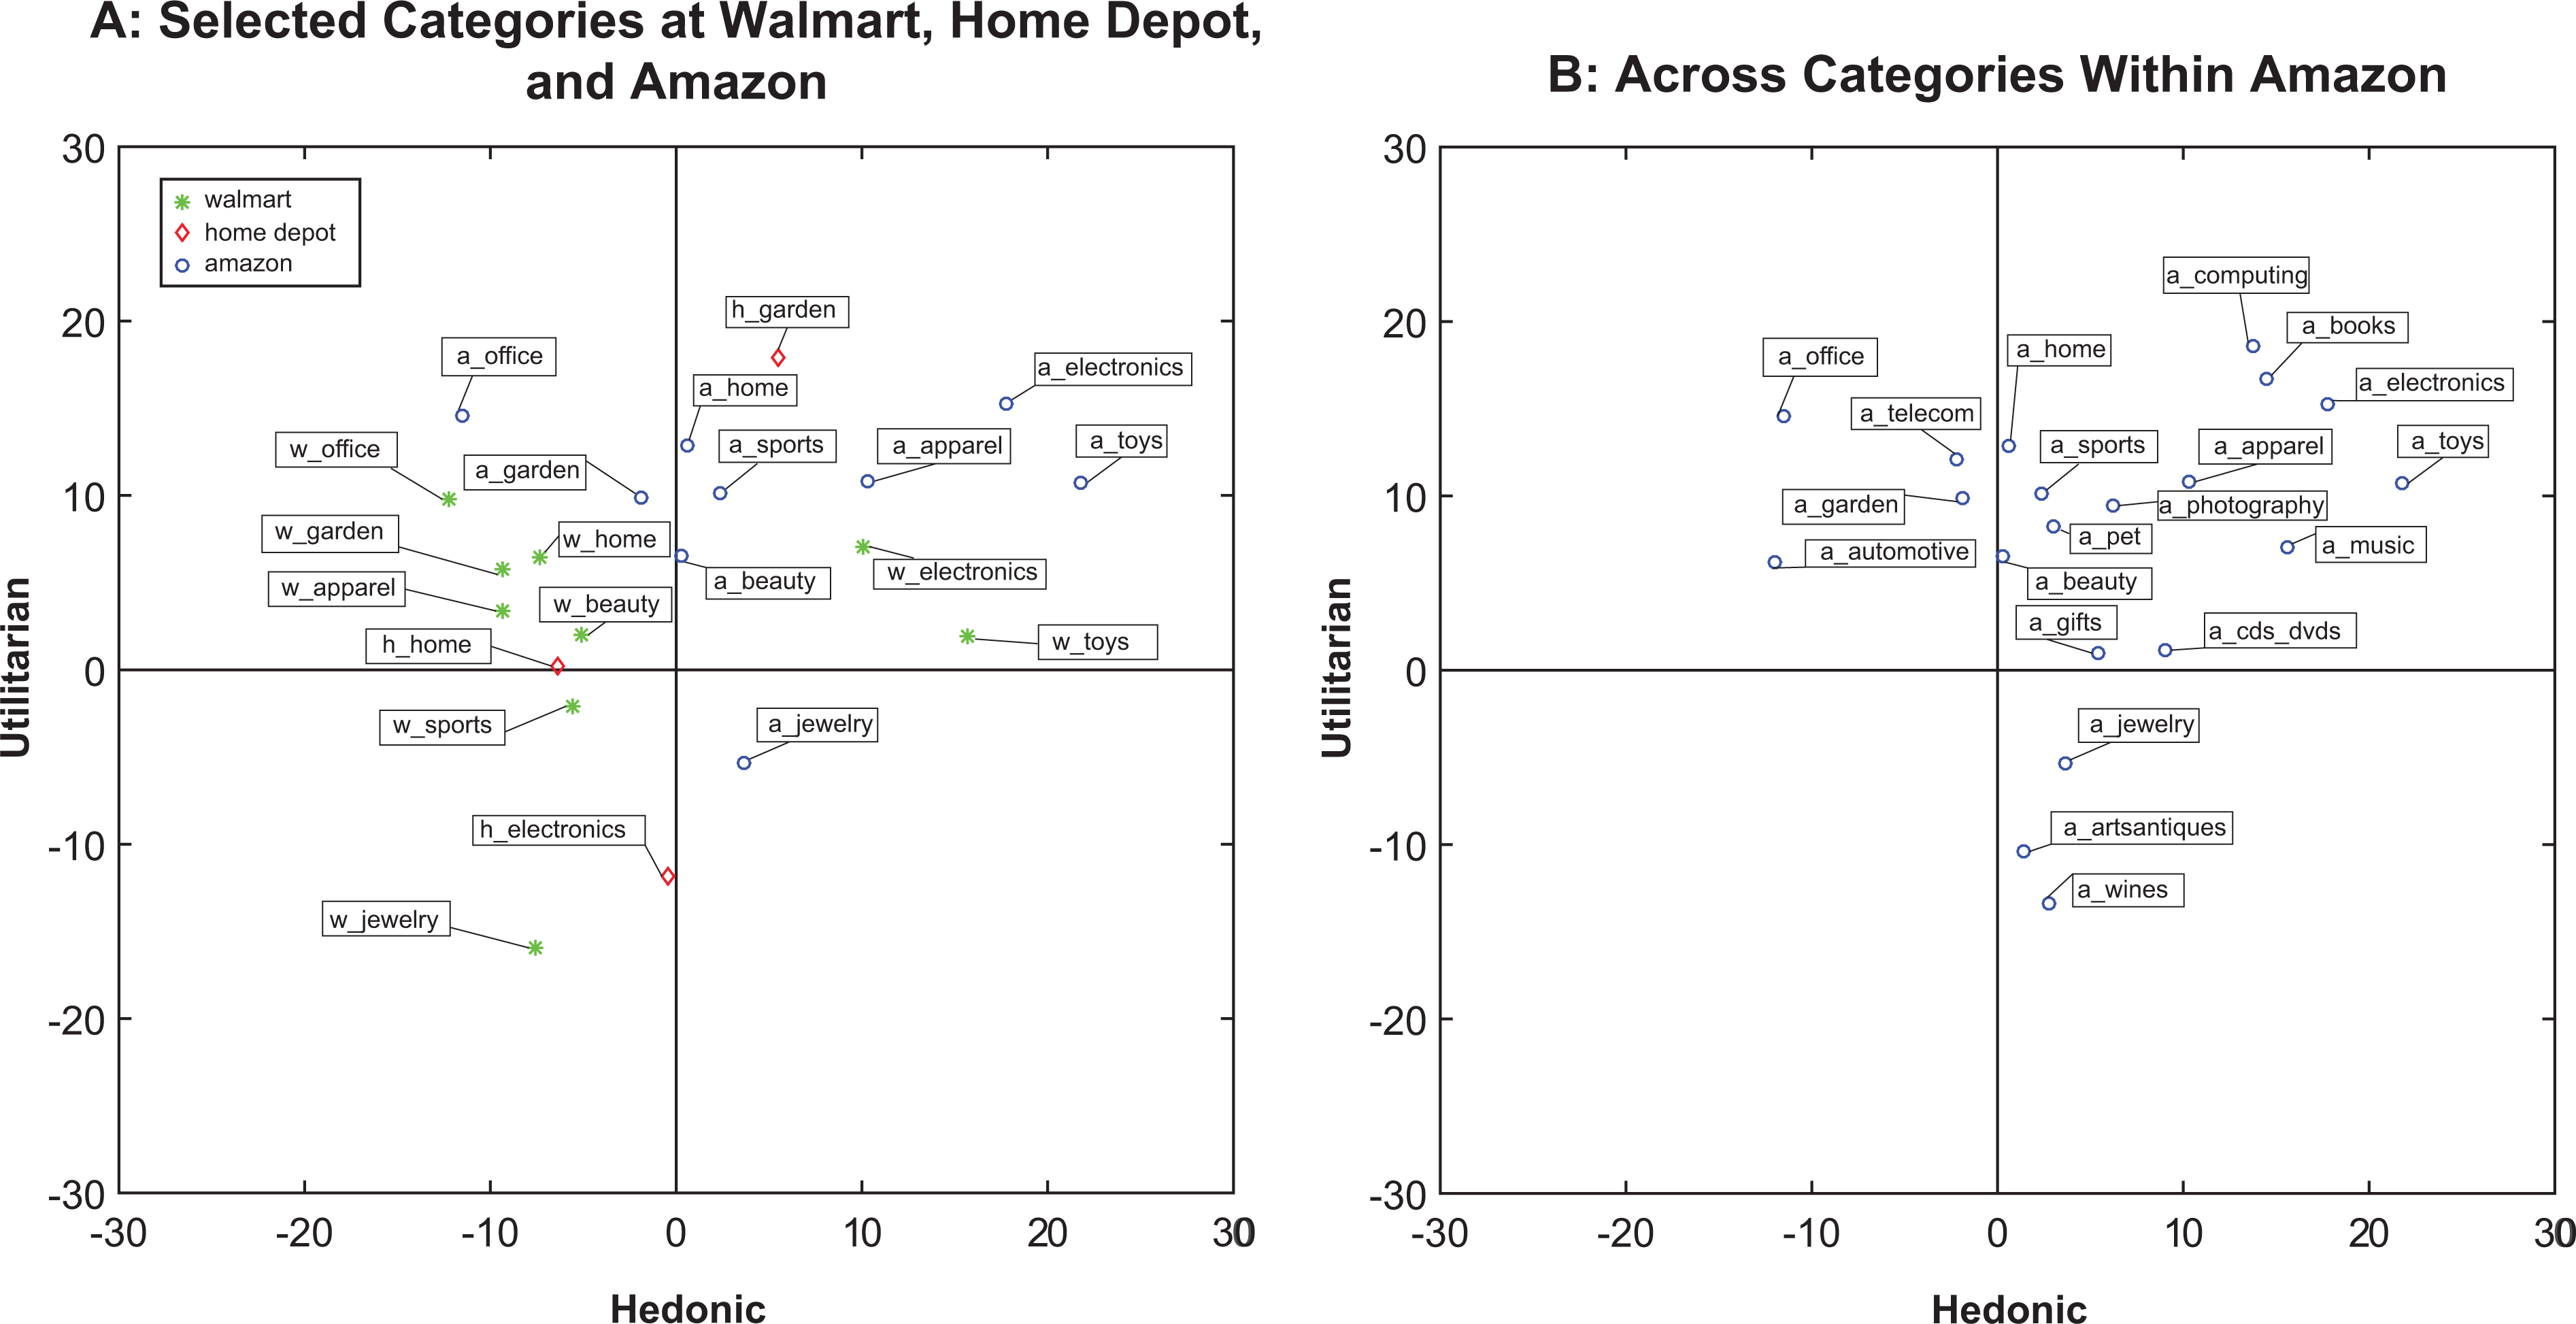
H/U plots for Amazon, Home Depot, and Walmart for selected categories and for various product categories at Amazon.
In summary, these charts highlight the notions that (1) the same product category can have varying H/U perceptions across different retailers and (2) the same retailer can have different H/U characteristics for its product categories. Collectively, to account for these important variations, the plots underscore the value of examining H/U at the “retailer-category” level. In addition, the plots reinforce the potential value of considering the hedonic and utilitarian dimensions separately to allow for more nuanced analysis between retailer categories in the four quadrants, as well as between the ones along the same diagonals. Next, we discuss how cross-channel customer journeys may vary across hedonic and utilitarian retailer-category combinations.
Differences in Customer Journey for Hedonic and Utilitarian Purchases
Drawing from research on hedonic and utilitarian purchases, utilitarian purchasing is a relatively more goal-directed cognitive process, while hedonic purchasing is a comparatively more goal-ambiguous, emotional experience. This cognitive and affective dichotomy not only defines the goals of online shopping but also influences channel preferences. Consumers evaluate the outcome of an exchange process with another entity (e.g., channel, retailer) by comparing the relevant perceived benefits against perceived costs (Bagozzi 1975). These benefits and costs include economic utility and social and psychological returns, such as enjoyment, trust, and respect. In the context of hedonic and utilitarian purchases, we expect that these inherent cognitive and affective differences would result in varying benefits and costs associated with different digital channels. Moreover, channel usage would likely differ depending on where consumers are on their journey, time-wise. Thus, we also explore how the H/U effects change dynamically as the consumer progresses through the purchase funnel. Finally, prior studies (e.g., Kushwaha and Shankar 2013) have shown that the choice of information channels could affect conversion outcomes. Accordingly, we also examine the H/U effect on the path to nonpurchases. Next, we discuss how information channel usage may differ across hedonic and utilitarian purchases. A review of relevant literature is included in Table 1.
Summary of Prior Research on Hedonic/Utilitarian Purchases and Online Information Channel Usage.
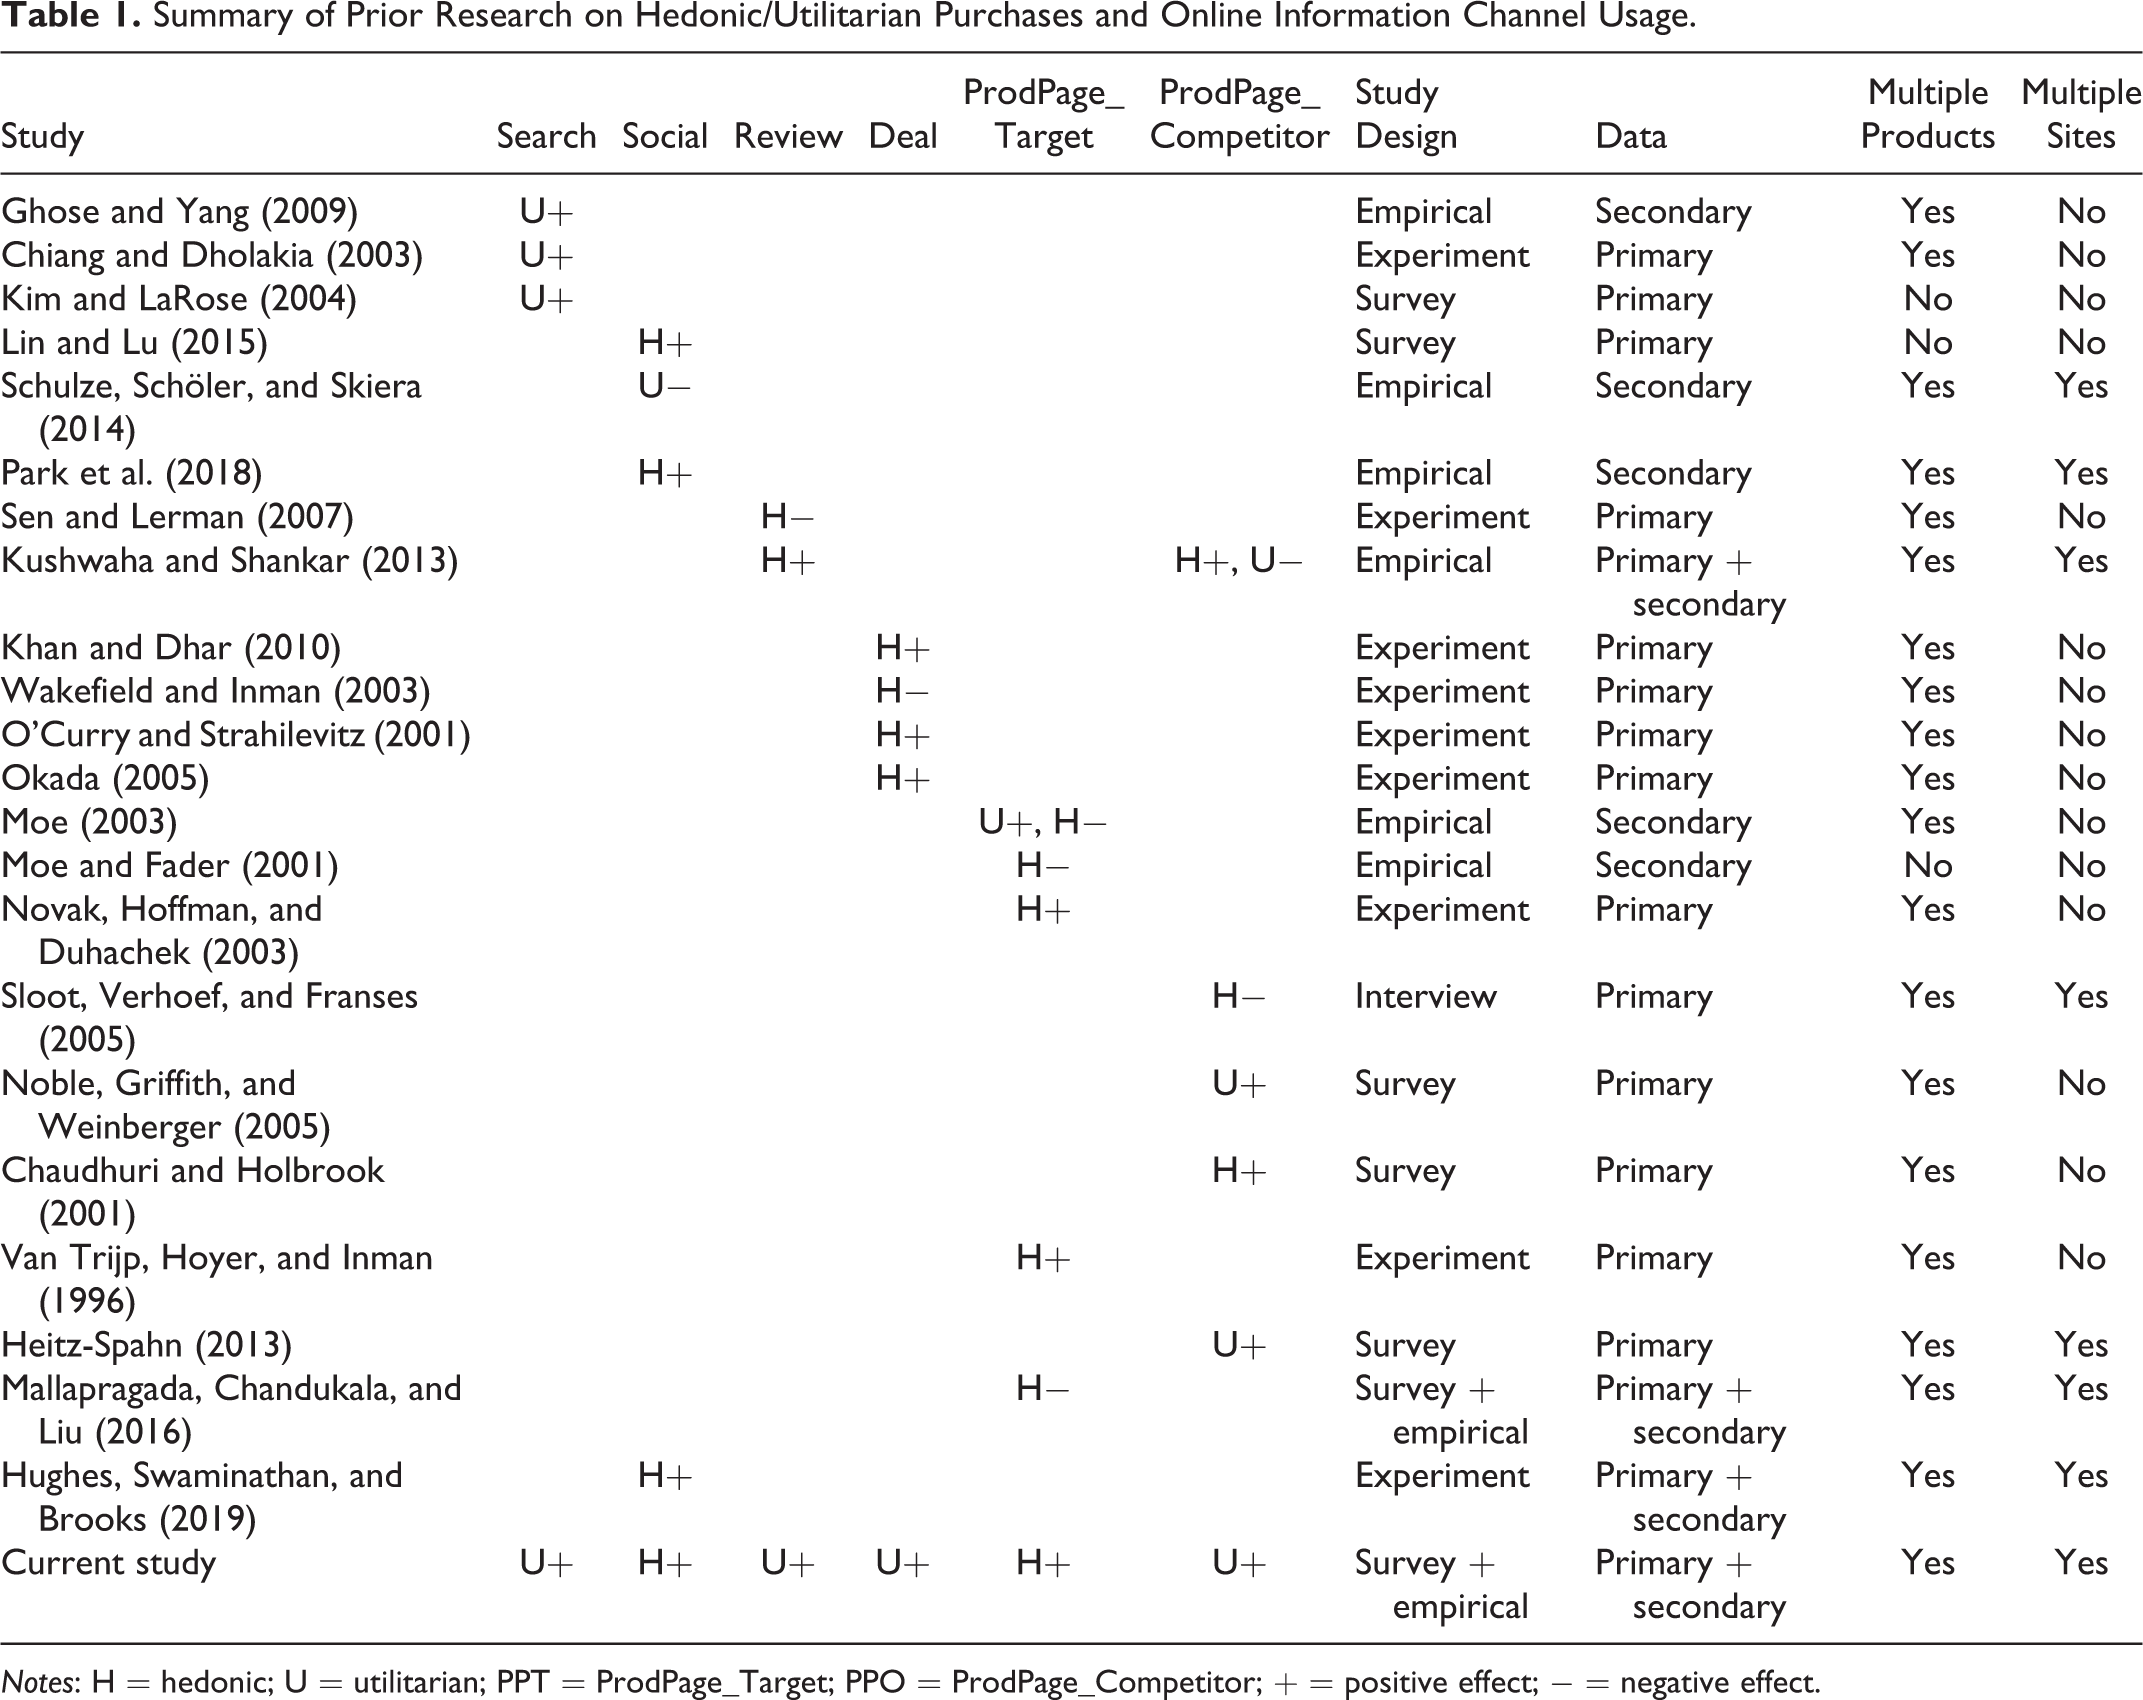
Notes: H = hedonic; U = utilitarian; PPT = ProdPage_Target; PPO = ProdPage_Competitor; + = positive effect; − = negative effect.
Utilitarian purchases are rational and goal-driven, with the objective of making the best purchasing decision (Novak, Hoffman, and Duhachek 2003). Therefore, they often require deeper information processing across concrete, predefined purchase attributes in an efficient manner (Mathwick, Malhotra, and Rigdon 2001; Park et al. 2018). Moreover, utilitarian purchases are often deliberate and planned, with well-defined dominant attributes that are easy to compare. Accordingly, this ease of comparison reduces brand differentiation and increases price sensitivity (Noble, Griffith, and Weinberger 2005). Consequently, consumers purchasing utilitarian products tend to prefer information channels that allow for convenient and efficient searches and comparisons for product attributes and prices across various alternatives so as to optimize purchasing decisions.
According to prior literature, certain channels could be more effective for utilitarian purchases. First, search engines promote efficiency-oriented shopping by allowing customers to easily and quickly find products through specifying attributes of interest via search queries (Chiang and Dholakia 2003; Ghose and Yang 2009). The list-wise, clear, and condensed format of the search results and the large-scale indexed content enable consumers to quickly navigate alternatives and compare product offerings from different retailers (Kim and LaRose 2004). Second, third-party review sites provide quantitative and qualitative information about product attributes for comparison, making them more conducive for utilitarian purchases that usually have well-defined and searchable attributes. Similarly, deal sites allow consumers to search for the best deals efficiently and conveniently, which could be useful for consumers to optimize their spending. Finally, because brand differentiation in utilitarian purchases is less extensive, consumers are more likely to browse product pages across multiple retailers to optimize their time, place, and possession needs (Noble, Griffith, and Weinberger 2005). As a result, they could adopt a “cross-channel free-riding” behavior where one retailer’s channel is used to prepare a purchase that is eventually completed at another retailer (Heitz-Spahn 2013). In this regard, their product page browsing on competing retailers’ websites could be more extensive.
Consumers making hedonic purchases seek surprise, adventure, fun, and variety during their shopping process (Arnold and Reynolds 2003; Novak, Hoffman, and Duhachek 2003). These goals imply a unique set of perceived benefits that consumers may consider when seeking and attaining information pertaining to hedonic purchases. Due to the affective nature of hedonic purchases, consumers are more likely to rely on simple cues and heuristics rather than deeper information processing to reach their purchase decision (Park et al. 2018). Instead of trying to find the best alternatives, consumers could have a strong “affective attachment” to brands (Chaudhuri and Holbrook 2001) and may process information more holistically (Melnyk, Klein, and Volckner 2012). Consequently, consumers making hedonic purchases could spend less time on searching and comparing. However, prior research has also found that consumers buying hedonic products may engage in guilt-reducing justification behaviors (Kivetz and Simonson 2002; O’Curry and Strahilevitz 2001; Okada 2005) by spending more time in the search process. Consumers could also engage in a variety-seeking behavior (Kushwaha and Shankar 2013; Novak, Hoffman, and Duhachek 2003) due to considerable product differentiation in hedonic purchases (Van Trijp, Hoyer, and Inman 1996). Therefore, the complex nature and multiple mechanisms of hedonic purchases could have different implications for information channel search under various contexts.
Regarding the information channels for hedonic purchases, social media has emerged as an influential channel, with 70%–80% of study respondents reporting that their purchases are affected by the social media posts of companies and friends (eMarketer 2017; Hewett et al. 2016; Kumar et al. 2016). Previous studies show that consumers find fun- and entertainment-oriented social media to be a more suitable information source for hedonic purchases (Hughes, Swaminathan, and Brooks 2019; Liu et al. 2019; Park et al. 2018; Schulze, Schöler, and Skiera 2014). However, for third-party reviews, prior research has not been definitive regarding their implications for hedonic purchases. On the one hand, the abstract attributes of hedonic products are less conducive to comparisons through review aspects and dimensions. On the other hand, the lack of concrete attributes also results in uncertainty for hedonic purchase (Kushwaha and Shankar 2013), which might drive greater usage of qualitative comments.
Similarly, the prior literature on deal websites has been ambivalent regarding their implications for hedonic purchases. Deals have been found to be more effective for hedonic purchases (Khan and Dhar 2010), supporting the notion that users favor guilt-alleviation mechanisms to justify hedonic consumption (Okada 2005). However, deals could also be less helpful because consumers are less price-sensitive due to the difficulty of comparing hedonic products (Wakefield and Inman 2003). Finally, the findings for product page views for hedonic purchases are also mixed. The experiential nature of hedonic purchases is more closely aligned with hedonic browsing behavior, which is characterized by a leisurely examination of fewer product pages and often results in impulse purchases (Mallapragada, Chandukala, and Liu 2016; Moe and Fader 2001; Park et al. 2012). Hedonic consumption is also associated with greater variety-seeking behaviors, which could potentially extend page views across multiple retailers (Kushwaha and Shankar 2013; Novak, Hoffman, and Duhachek 2003; Van Trijp, Hoyer, and Inman 1996). Consequently, due to the mixed findings in the prior literature, there remains a need to formally examine the effect of H/U characteristics on information channel usage.
Empirical Analyses
To provide a comprehensive picture of how consumers’ utilization of different online information channels throughout a customer journey varies with the H/U purchases, we operationalized the H/U characteristics at the retailer-category level through a survey. We then combined primary (survey) and secondary (clickstream) data to demonstrate the H/U effect on the usage of different information channels prior to purchases. The data analysis process and the conceptual model are depicted in Figure 2.

Identification strategy and conceptual model.
Retailer and Product Category Selection
Our retailer-category analysis covers 20 product categories from 40 online retailers. To select appropriate retailers, we started with 500 top internet retailers from 2014 sales rankings (https://www.internetretailer.com/top500) and narrowed that list down to 336 that have easily discernible product page URL patterns. Combined with a comScore data set from 2013 to 2014, we found that these retailers’ number of transactions shows a Pareto-like distribution, with the top 40 retailers accounting for over 91% of all transactions. We also examined the main products sold by these 40 retailers and found that they cover a wide range of hedonic and utilitarian product categories. Thus, these retailers were included in our study (for details, see Web Appendix W1).
For product categories, we initially used the 22 categories proposed by Kushwaha and Shankar (2013), which adequately captured the major product categories on the H/U spectrum. Drawing from the product purchases on these retailers on a comScore data set, we found 115 unique retailer-category combinations (e.g., Amazon apparel). We then mapped all the extracted categories to the initial 22 and removed 2 that were absent, resulting in a final set of 20 product categories.
Main Study: Clickstream Analysis
Data
We collected approximately 1 terrabyte of the U.S. comScore web clickstream data between January 2013 and December 2014. The data recorded all online clicking behaviors in the form of URLs and timestamps from approximately 100,000 randomly selected households each month. The clicked URLs and timestamps were grouped into clickstream sessions. The end of a clickstream session is determined when clicking behaviors are inactive for a certain period of time. For the clickstream sessions involving a purchase, extra information (e.g., purchased product categories) was provided by comScore. The unit of analysis of our study is a purchase session (converted or unconverted), which captures a consumer’s decision-making process toward an actual or intended purchase. A converted session denotes an online purchasing cycle for a consumer, starting with an information search across various information channels and ending with a purchase. Due to the complexity of information search, this purchase cycle can last for several days.
Determining the length of the purchasing cycle is often challenging. Existing literature has mixed findings regarding cycle lengths; depending on the research context and product categories, it could range from several days to one month (De Los Santos, Hortaçsu, and Wildenbeest 2012; Johnson et al. 2004). We derived the purchase cycle length for each of the 20 product categories from the comScore data. The intuition for our method is that consumers may start a purchase cycle by browsing product pages related to an intended product category on any channel. Thus, our algorithm tracked their first encounter with these pages. Web Appendix W2 documents the process in detail. The key to this method is to ensure that product page URLs could be accurately mapped to our 20 product categories. Many retailer websites embed product names or categories in the product page URLs. Therefore, we developed a text-mining algorithm (described in Web Appendix W3) to extract product categories from these URLs. This method is conducive for all retailers except Amazon and Walmart, whose product URLs are sometimes coded with product IDs. Accordingly, we used their product application programming interface to map product IDs to our focal product categories. The average purchase cycle for each product category is presented in Table W2.1 of Web Appendix W2. We found that while some product categories exhibit shorter or longer cycles (e.g., office, music), most of the cycles last around 14 days. Consequently, we used 8–14, 2–7, and 0–1 day windows to capture consumers’ information channel usage during the early, middle, and late stages, respectively, of the path to purchases.
Each consumer could have multiple purchases during the two-year period, which creates an opportunity for us to account for variations at both the session and consumer level. To cleanly attribute channel usage to a unique purchase cycle, we removed the purchases that overlapped within a 14-day window (20.78% of the sessions). Furthermore, we found that approximately 23.3% of those purchases involve multiple product categories, which could complicate our analysis because these multicategory purchases could have more than one H/U characteristic. Therefore, we also removed these purchases from our study.
To identify whether the H/U effect on information channel usage is only restricted to converted sessions, we also included unconverted sessions of the same consumers identified previously. Note that we only examine online unconverted sessions for these consumers because our data set is limited to online web clickstream—it is possible that a consumer did not purchase online but purchased through other channels (e.g., offline). Specifically, an online unconverted session denotes a website visitation with an intended purchase (i.e., focused product browsing) but exit before completion (e.g., cart abandonment or leaving the website before adding products to the cart). While the comScore data nicely flags clickstream sessions without purchases, we don’t know whether these sessions have product purchasing intentions. Thus, the H/U characteristics of this session could not be determined directly from the comScore data. Fortunately, we can use the text mining method described above to infer the intended products from browsed URLs. Specifically, we identified the product categories from all the browsed URLs during the day of a clickstream session. The category that receives the highest presence is considered as the intended product category. We found this method to be reasonable because people rarely browse product pages unless they have a purchase intention—only 4.6% of the unconverted clickstream sessions have product page views during the session day. Therefore, we include only this subset of sessions with purchase intentions in our unconverted data set. Furthermore, for each consumer, we removed all the unconverted sessions that tap into the converted sessions (approximately 28% removed) or overlap with each other on a 14-day window (approximately 43% removed). Similarly, we derived 8–14, 2–7, and 0–1 day windows to examine the early, middle, and late stages, respectively, of the path to nonpurchases.
Key independent variable
We conducted a survey on MTurk to derive our key independent variables related to the H/U aspects of a product category purchased on a specific retailer. Details of the survey are provided in Web Appendix W4. Following Kushwaha and Shankar (2013), we calculated a mean composite hedonic (utilitarian) score by averaging the scores of the five hedonic (utilitarian) scale items. Because H/U have a low correlation of .16, we used separate H/U scores for each retailer-category combination. To account for the heterogeneity of H/U perceptions across consumers, we imputed the H/U scores for the clickstream data using the insights from the MTurk survey. Consequently, consumers with varying demographic characteristics in the clickstream will have different H/U scores despite the same retailer-category purchases. Finally, both scores are mean-centered before being included in the study.
Dependent variables
Information channel usage is defined as the number of visited channel URLs corresponding to a search engine, social media, third-party reviews, deals, product page views on target retailers, and product page views on competing retailers. Following prior work, the visited URLs were mapped to six channels using URL token matching (Moe 2003). Web Appendix W1 shows the product categories for identifying competing retailers (i.e., retailers offering the same product categories are considered as competitors), and Web Appendix W5 presents the set of social media, third-party reviews, and deal sites included.
Control variables
We included several control variables to address the selection bias that commonly occurs in secondary data analysis. Drawing on this principle and previous studies (Huang, Lurie, and Mitra 2009; Kushwaha and Shankar 2013), we identified five types of control variables:
Retailer-specific controls: It is important to control for retailer heterogeneity because the key independent variable H/U scores are at the retailer-category level, and retailers’ diverse marketing strategies could affect channel usage (Valentini, Montaguti, and Neslin 2011). Thus, we included five types of retailer-level controls. First, we used the top 500 Internet Retailer sales ranking in 2014 to approximate each retailer’s popularity rank. Second, we incorporated the visit volume across the comScore clickstream to account for retailer popularity rank specific to the comScore panel. Third, we used the number of page views per user obtained from Alexa (www.alexa.com) to control the level of consumer engagement with different retailers. Fourth, we collected the number of likes for each retailer’s Facebook page to control for their social media presence. Because all these controls are highly positively skewed, we log-transformed them before inclusion. Finally, we used a 20-dimensional product category vector to represent the product assortment of each retailer. Specifically, each dimension corresponds to a product category, and the dimensional value denotes the proportion of this category purchased during a two-year period. The higher the proportion, the greater the likelihood that it is a primary category for this retailer.
Product category control: We included an S/E dummy variable to control for category-level characteristics other than H/U. The S/E assignment for each category is based on the prior literature (e.g., Huang, Lurie, and Mitra 2009). For example, home and garden products are search goods (S/E = 1), and beauty and automotive products are experience goods (S/E = 0). By including this control, we also intend to empirically illustrate how the two divergent perspectives complement one another, as alluded to in the conceptual development section.
Prior purchase experience: According to Valentini, Montaguti, and Neslin (2011), channel usage may be determined by state dependence: how many purchases a consumer has previously made. Therefore, we included the number of prior purchases, as well as the number of purchases specific to the intended product category prior to the current session, to control for a potential systematic shift in channel usage over time.
Price: Prior research shows that H/U characteristics might be correlated with the dichotomy of luxuries and necessities (Khan, Dhar, and Wertenbroch, 2005). Thus, we included price to control for channel usage driven by other category- and retailer-specific factors. Note that this variable is only available for converted sessions.
Demographics: Prior studies (e.g., Inman, Shankar, and Ferraro 2004) have shown that demographics such as age, family size, and education play an important role in determining channel usage. Therefore, we included user demographic information accompanying the comScore clickstream as consumer-level controls. Specifically, we incorporated household size, age, gender, education, income level, and the presence of children.
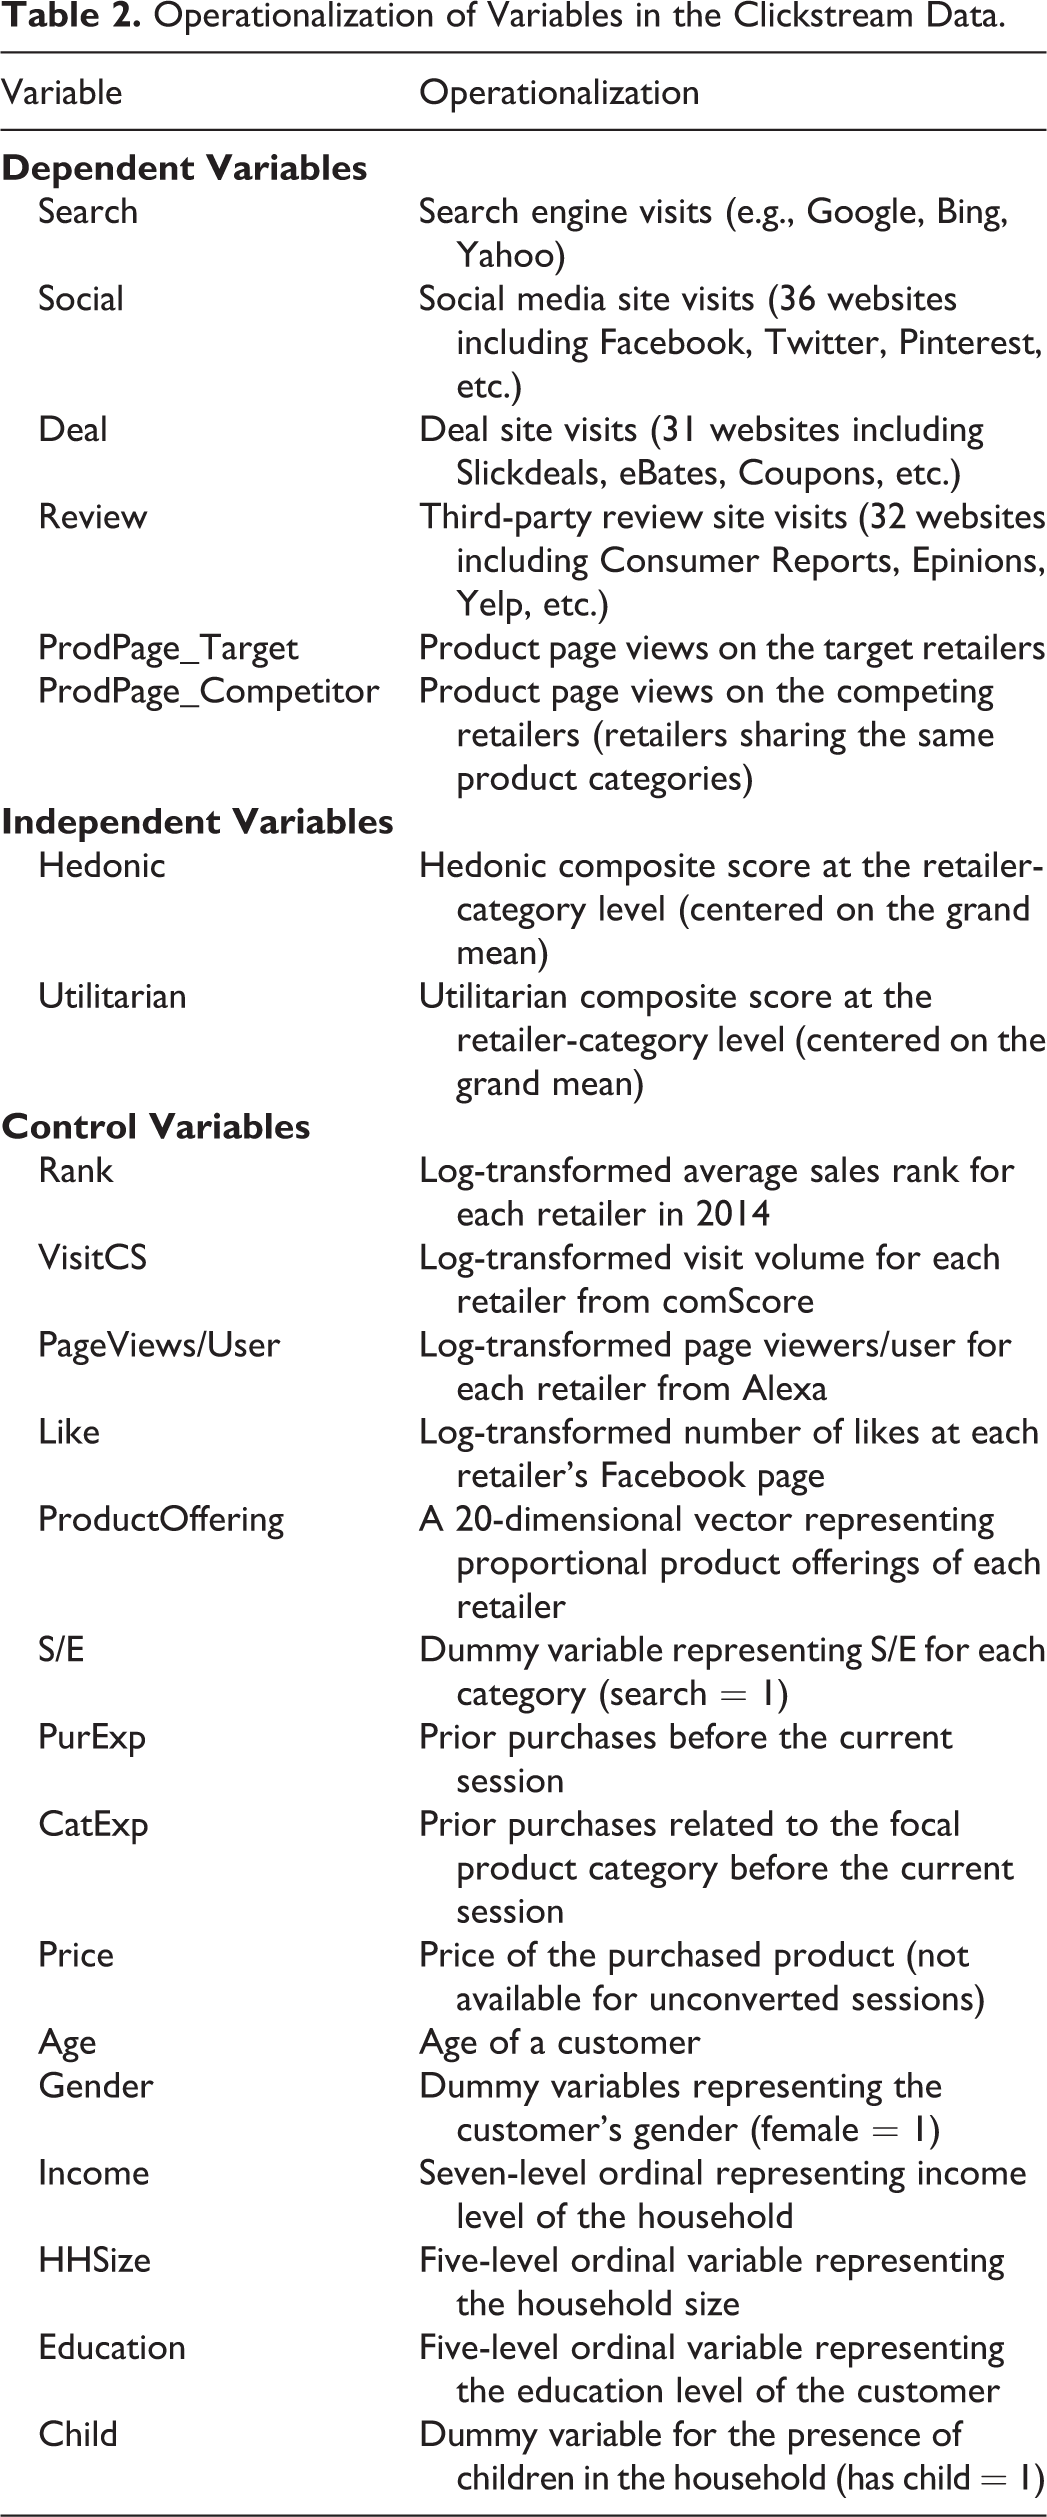
To account for unobserved consumer heterogeneity in information channel usage (in addition to demographics), we adopted a hierarchical Bayesian approach to estimate the parameters of interest. Given the complexity of the proposed model, it is challenging to estimate the entire data set—the computational time increases significantly with the number of consumers. We noticed that 55.70% of the consumers made only two purchases in a two-year period but only occupied 19.60% of the total transactions. We removed these consumers without losing generalizability, resulting in 22,751 converted sessions and 30,550 unconverted sessions from 4,356 consumers in a two-year period, generating approximately $1.2 million in total sales. 1 Note that only 3,854 of these consumers have qualified unconverted sessions. A detailed description of all variables included in our model appears in Table 2. Summary statistics for the 14-day sample appear in Web Appendix W6. These statistics show that most channel usage and control variables are different in hedonic and utilitarian conditions.
Operationalization of Variables in the Clickstream Data.
Model formulation
We developed a multivariate multilevel model to explain how the channel usage patterns differ from H/U characteristics and other factors. Consider a consumer i who has made a purchase at retailer j of category k on occasion t. This consumer can utilize M channels to gather necessary information throughout the customer journey. The channel utilization is denoted by the number of URL visits to each channel Yijktm. Because the distribution of URL visits is heavily positively skewed, we log-transformed the visits. We add one to observations where the number of visits is zero (Criscuolo et al. 2019). Thus, our model becomes a semilog model and the 100 × slope parameters measure the percentage change of the information channel usage given a one-unit absolute change of the explanatory variables. Given the time allocated to shopping, consumers make trade-offs between the usage of different channels. To catch the potential interdependencies among the six channels in our study, we let the channel utilization follow a multivariate normal distribution. Following previous studies (e.g., Li and Kannan 2014), we also consider consumer heterogeneity in channel utilization. Thus, we develop a multilevel setting to allow every consumer to have a unique channel usage intercept.
Level 1:


Level 2:


In the Level 1 Model, aim is a random intercept that allows for variation in baseline channel usage across consumers. Hedonicijk and Utilitarianijk are grand-mean-centered hedonic and utilitarian scores for a product category k purchased at a retailer j, which can vary depending on consumer i’s characteristics. We controlled for product prices Pricejk, prior purchase experiences PurExpit and CatExpikt, and product category heterogeneity S/Ek. The model for unconverted sessions is estimated separately and does not have the control Pricejk. The variables Retailerj help control for the retailer heterogeneity, such as retailers’ sales ranking (Rank), visit volume (PurchaseCS), Alexa traffic (PageViews/User), number of likes on retailer’s social media page (Like), and proportional offerings of 20 product categories for each retailer (ProductOffering). Because a consumer in our data, on average, has five sessions, but retailer controls consist of 24 variables, we took an alternative route to identify the Level 1 model. Specifically, we performed K-means clustering to construct three retailer groups and include two cluster dummies into our model. Clustering details are discussed in the “Retailer Clustering” subsection. Therefore, cm7 is a vector of parameters corresponding to retailer cluster variables. Finally, because ln(Yijktm) follows a multivariate normal distribution MVN(µ, ∑∊), the error term follows MVN(0, ∑∊), where ∑∊ is a variance–covariance matrix that allows the error terms to be correlated across channels. Due to a lack of prior knowledge about the correlation pattern, we allow ∑∊ to be unstructured to allow flexible variance–covariance matrix.
For the Level 2 model, to account for heterogeneity across consumers, we assume aim ∼ N(am, σ2), where am and σ2 measure the mean effect and dispersion of aim across consumers, respectively. am can be further decomposed into an intercept am0 and the effect of demographic controls Demoi, such as Age, Gender, Income, Education, household size (HHSize), and whether a child is present in the household (Child).
Retailer clustering
Incorporating all 24 retailer-level controls, we performed K-means clustering to categorize the 40 retailers into a more manageable set of clusters. Using the appropriate evaluation criteria, three clusters emerged. In the main model, we omit Cluster 1 as the base cluster and introduce two dummy variables to the Level 1 model to account for retailer heterogeneity. Web Appendix W7 describes the clustering details, the specific clustering assignment for each retailer, and a cluster centroid table that depicts characteristics of the three clusters.
Model estimation
We estimated six models corresponding to 8–14, 2–7, and 0–1 day windows for converted and unconverted sessions. We conducted a Kolmogorov–Smirnov test on the parameter samples obtained from converged Markov chain Monte Carlo iterations to assess the significance of slope difference for hedonic and utilitarian scores between converted and unconverted sessions. We conducted this estimation of the multivariate multilevel model using a Gibbs sampler programmed in JAGS (Plummer 2003), with uninformative priors for all parameters. To promote the efficiency of estimation and the ease of interpretation, we median split all the ordinal variables, including income, household size, and education. A robustness check on the 0–1 data found that median splitting these variables does not change the sign and significance of the H/U effect. The final estimates are posterior means based on 40,000 Markov chain Monte Carlo iterations with a thinning factor of 4, after 40,000 burn-ins. To assess the convergence of the model estimates, we use three diagnostic methods, including the Geweke (1992) diagnostics, the Gelman and Rubin (1992) diagnostics, and the effective sample size (Kass et al. 1998). The Geweke statistics for all the parameters are less than 1.96, confirming that all the parameters have reached the stationary posterior distributions. We run two additional chains with different sets of initial values with the same number of burn-ins. The potential scale reduction factors are approximately 1.001 (<1.2) for all parameters, supporting the convergence of all three chains. The effective sample size is above 500 for all parameters, suggesting that previous samples are not highly autocorrelated with the samples from the posterior distribution.
Model comparison
We compare the proposed model with a model that does not allow for variation in baseline channel usage across consumers (i.e., a single-level model without uim term) and a univariate model (i.e., no off-diagonal elements for ∑∊), using the deviance information criterion (DIC; Spiegelhalter et al. 2002) on the 0–1 window data. Our model (DICproposed = 236,788) is substantively better than the two benchmarking models (DICfixed = 261,370; DICunivar = 485,641), suggesting substantial consumer heterogeneity and channel interdependencies. We also estimated a multilevel multivariate Poisson log-normal model (El-Basyouny, Barua, and Islam 2014) on the 0–1 window data and found consistent results.
Results and Discussion
Tables 3 and 4 summarize the posterior means of all the parameters for the converted and unconverted sessions with 8–14, 2–7, and 0–1 day windows (early, middle, and late stages, hereinafter). We used highest posterior density (HPD) intervals to evaluate the significance of the model parameters. Consistent with the prior literature (e.g., Huang, Lurie, and Mitra 2009), we found that usage of at least some information channels differs across S/E, purchase sequence, retailer characteristics, and demographics. In the following subsections, we discuss the changes in the baseline channel usage across the customer journey. Subsequently, we discuss the channel-specific H/U effects using a typical hedonic product (toys) and a representative utilitarian product (office supplies).
Retailer-Category H/U Effects on Information Channel Usage for Converted Sessions.

*90% of the HPD interval does not contain 0.
**95% of the HPD interval does not contain 0.
***99% of the HPD interval does not contain 0.
Notes: Hedonic = mean-centered hedonic score; Utilitarian = mean-centered utilitarian score; RMSE = root mean squared error.
Retailer-Category H/U Effects on Information Channel Usage for Unconverted Sessions.

*90% of the HPD interval does not contain 0.
**95% of the HPD interval does not contain 0.
***99% of the HPD interval does not contain 0.
Notes: Hedonic = mean-centered hedonic score; utilitarian = mean-centered utilitarian score; RMSE = root mean squared error.
Dynamic Channel Usage Across the Customer Journey
We derived the average daily number of visits in each of the purchase windows (i.e., the intercepts from early, middle, and late-stage models) for the six digital channels, as presented in Figure 3. The daily channel usage (intercept) varies significantly across different time windows, confirming prior studies (Johnson et al. 2004; Moe 2006; Valentini, Montaguti, and Neslin 2011) showing that consumers utilize channels at differing intensities throughout the customer journey. Specifically, all six channels’ usage increases toward the final purchase, validating that they are important information search channels for online shopping. From the middle to the late stage of the journey, the increase in the rate of product page views on the target retailer’s website (ProdPage_Target) is greater than that of product page views on competing websites (ProdPage_Competitor), suggesting a consumer lock-in, consistent with prior findings that consumers gradually narrow their consideration set throughout the customer journey (Johnson et al. 2004; Moe 2006). Finally, the covariance among channel usage is all significant, verifying considerable interdependency among channel usage. Specifically, for converted sessions, search engine and social media usage are highly correlated with each other (e.g., correlation = .54 for the late stage), representing high co-usage of these two information channels. In addition, toward the end of the purchase, product page views on target websites are the most correlated with rest of other channels (average correlation = .21) but product page views on competing websites are the least correlated (average correlation = .09), indicating a funneling effect of the information search on target websites.
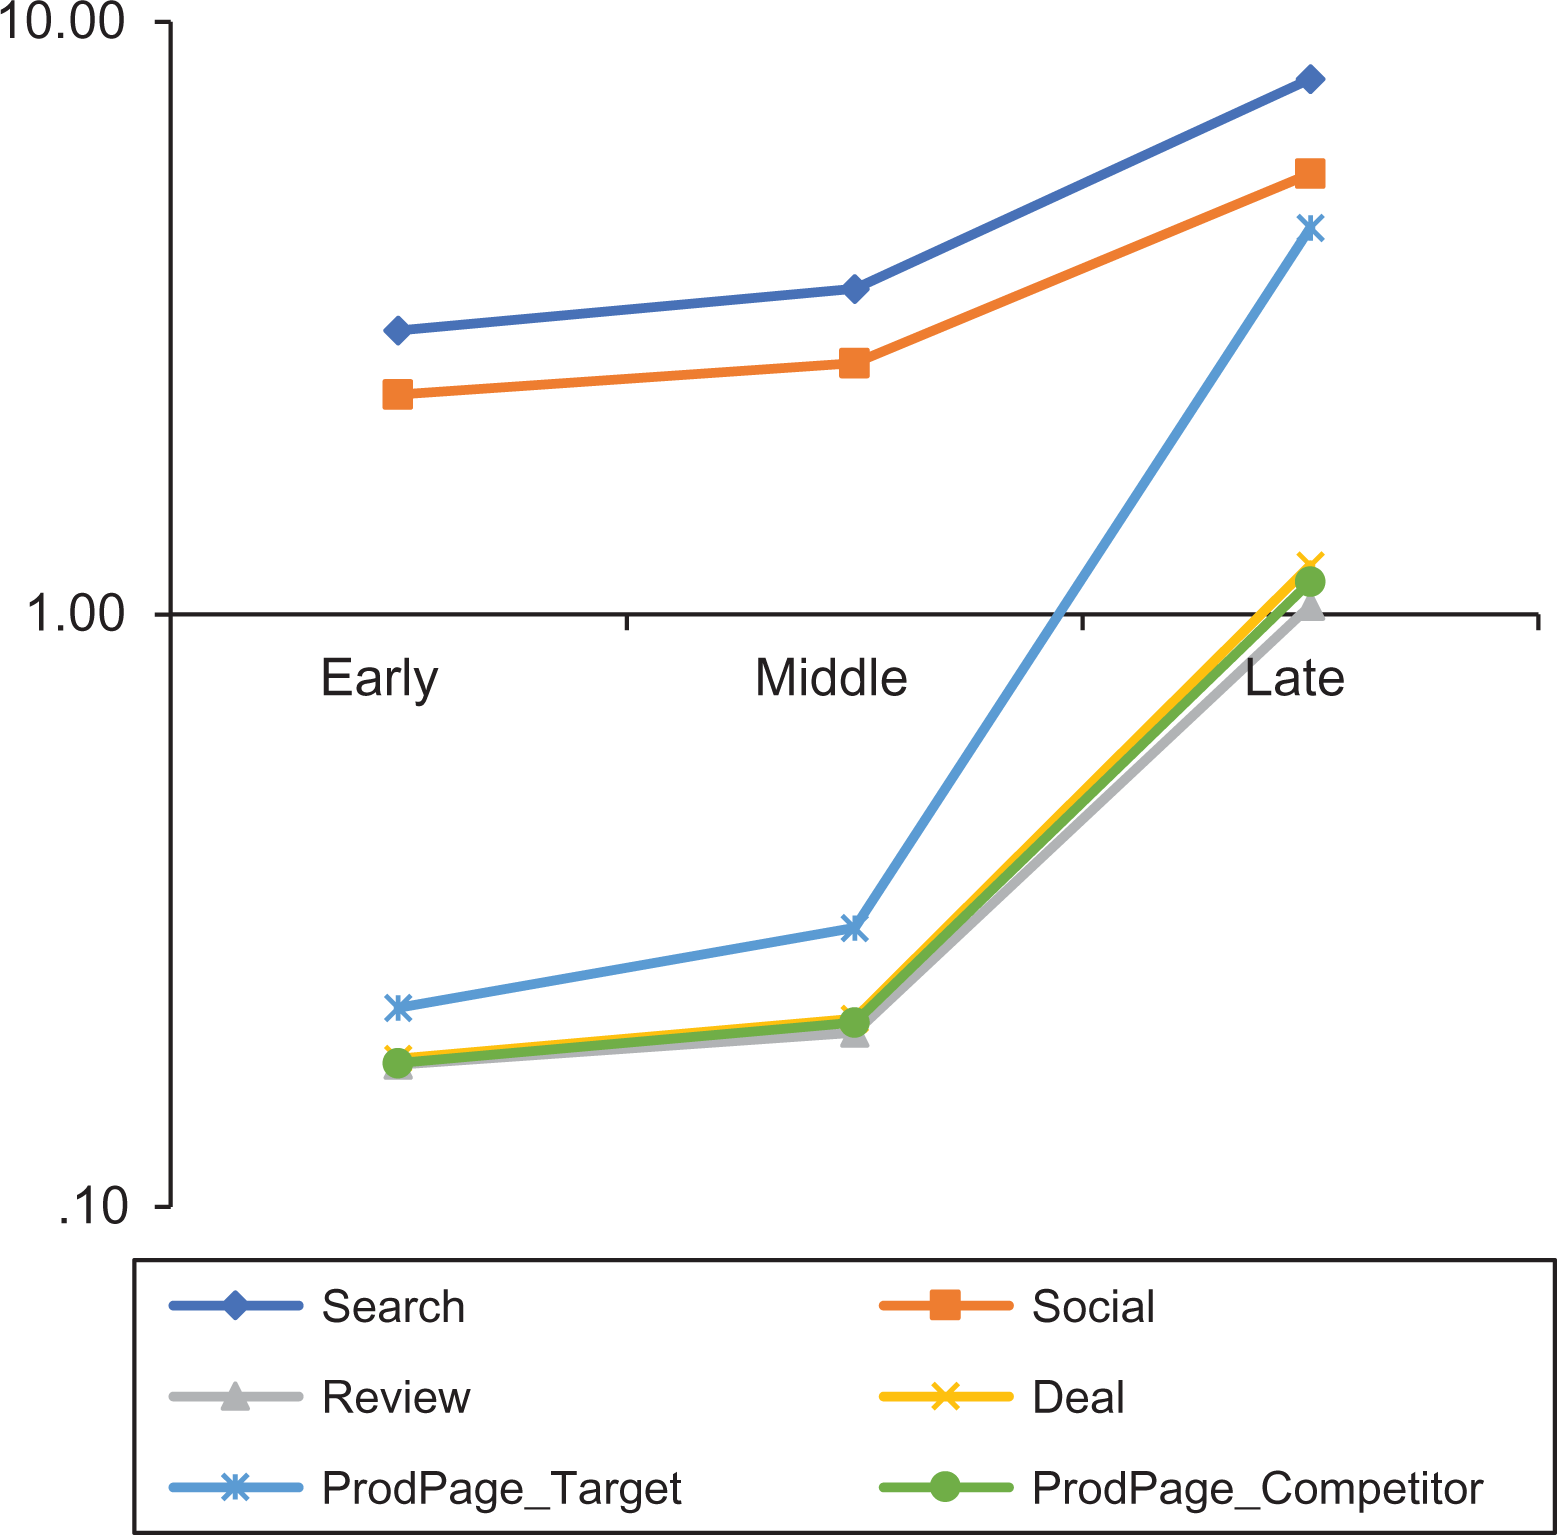
Average daily channel usage (intercept) for three stages of the customer journey.
H/U Effect on Channel Usage
For the converted sessions described in Table 3, the utilization of six information channels varies significantly with the H/U characteristics of purchases, and across different stages. Because the H/U score follows a 0–100 scale, one unit change of the H/U score on a 100-point scale would equal to a 1% change of the H/U score. In our semilog model setting, given that b is the parameter for the H/U score, a 1% change of H/U score, conditional on a focal consumer’s other purchase characteristics, will correspond to a 100 × b percentage change of information channel usage. For instance, the significant parameter .0039 (p < .01) of the Hedonic score on social media during the late (0–1 day) window indicates that a 1% increase in the Hedonic score in the late stage of the journey leads to a .39% increase in social media usage. In general, we find that a 1% increase in the Hedonic score involves a greater usage of social media (early: .43%, middle: .32%, late: .39%) and more product page views on the target retailers’ site (early: .17%, middle: .17%). Furthermore, a 1% increase in the Utilitarian score is associated with heavy usage of search engines (late: .23%), third-party reviews (early: .11%, late: .04%), and deal sites (middle: .09%).
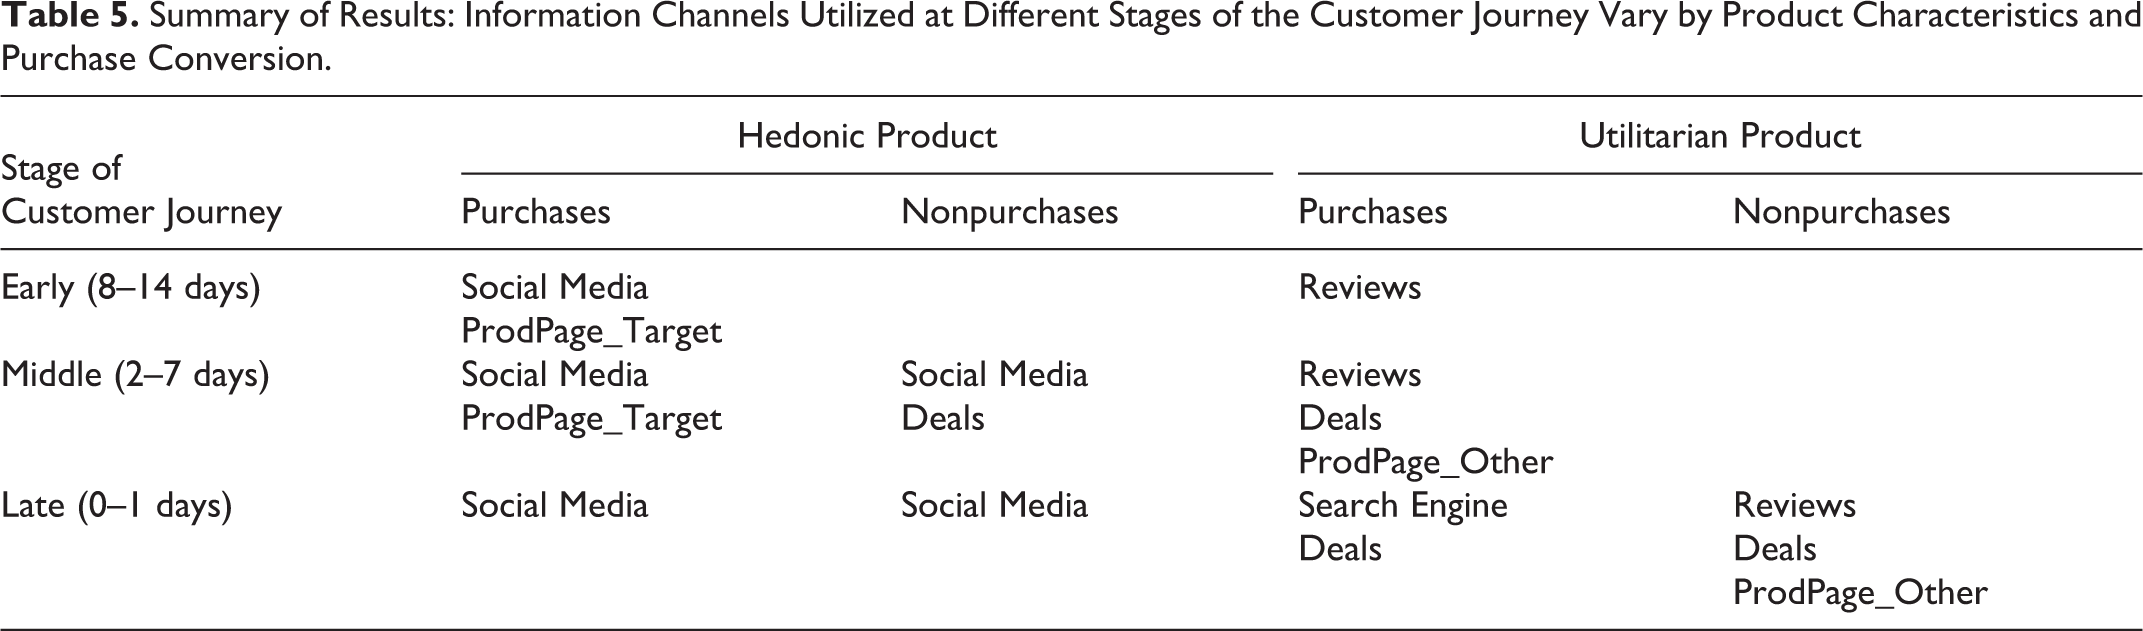
In contrast to the converted sessions, the H/U effects are different for the unconverted sessions depicted in Table 4. For example, the Hedonic score’s effect on social media is attenuated (unconv_late: .25% vs. conv_late: .43%; p < .05) based on a Kolmogorov–Smirnov test, and the signs for deal site usage (unconv_mid: −.13% vs. conv_mid: .09%) and product page views on the target retailers (unconv_early: −.22% vs. conv_early: .17%; unconv_mid: −.17% vs. conv_mid: .17%) are flipped, suggesting that the H/U effects could be potentially related to conversion. To compare the differential H/U effects across different stages of customer journeys for converted and unconverted sessions, we selected a typical hedonic product—toys (Hedonic = 10.82; Utilitarian = −5.15)—and a typical utilitarian product—office supplies (Hedonic = −15.92; Utilitarian = 6.55)—and visualize their percentage change in channel usage relative to a product with the average H/U scores (H = 59.86; U = 66.35) 2 in Figure 4, Panels A–D. Drawing on this selection, we next discuss the important channels for hedonic and utilitarian purchases at different stages of the customer journey. Table 5 presents a summary of these results.

Channel usage percentage differences for hedonic and utilitarian purchases.
Summary of Results: Information Channels Utilized at Different Stages of the Customer Journey Vary by Product Characteristics and Purchase Conversion.
Important Channels for Hedonic Purchases
For converted sessions, toys (hedonic) purchases utilize a greater level of social media than office supplies (utilitarian) purchases, with an average of 10% more channel utilization throughout the purchase cycle (early toys: 4.65% vs. early office: −6.85%; middle toys: 3.46% vs. middle office: 5.09%; late toys: 4.22% vs. late office: −6.21%). Furthermore, the hedonic effect for social media uses increases slightly toward the end of the customer journey (middle toys: 3.46% vs. late toys: 4.22%), indicating that people may utilize the social media channel more when they have a relatively clear purchase intention. This finding nicely complements the social media literature (Kim and Ko 2012; Malhotra, Malhotra, and See 2012; Naylor, Lamberton, and West 2012) by showing that, in addition to soliciting impulse buying, social media might have become an information channel that consumers use to proactively search for information (e.g., finding product pictures on Instagram). However, the positive hedonic effect on social media use is significantly smaller for unconverted sessions than for converted sessions (p < .05), suggesting that a greater level of social media usage might be more useful for realizing hedonic purchases.
These findings reinforce the importance of emotive and social aspects during the hedonic shopping process highlighted by prior research in the H/U domain (Arnold and Reynolds 2003; Novak, Hoffman, and Duhachek 2003) and support the notions that social media is more effective for viral marketing of hedonic products (Berger and Schwartz 2011) and that online social connections are more influential for hedonic spending (Park et al. 2018). Furthermore, given that social media is utilized by hedonic purchases for both converted and unconverted sessions (with different effect sizes), social media marketing might be more effective to reach potential consumers and improve conversion.
It is important to note that our results regarding social media use are correlational in nature, and causal inferences should be made with caution. Because of privacy considerations, we cannot see what people are browsing on social media. While differences in social media usage across products and over time give us some confidence in making prescriptive recommendations, and these results are reinforced by other studies (Colicev et al. 2018; Colicev, Kumar, and O’Connor 2019; Hughes, Swaminathan, and Brooks 2019), the aforementioned caveat remains.
In addition, hedonic purchases involve more product page views on the target retailers up to two weeks before the conversion, with as much as a 4.55% difference between toys and office supplies purchases (early toys: 1.84% vs. early office: −2.71%), presenting a funneling effect toward to the final purchases. However, this effect is reversed for unconverted sessions, (early toys: −2.38% vs. early office: 3.50%), suggesting that consumers seeking hedonic products might browse more product pages on competing retailers and make purchases there, leading to nonconversion on the focal retailer site. This finding reveals that sufficient on-site product page views up to two weeks before conversion are crucial for realizing hedonic purchases, in support of the notion that consumers with hedonic purchases exhibit a greater level of “affective attachment” (Chaudhuri and Holbrook 2001) toward retailer brands and are less likely to engage in a brand-switching behavior (Kim and Ko 2012).
Finally, while deal sites are utilized less for hedonic purchases than for utilitarian purchases toward the end of the customer journey for converted sessions (middle toys: −.46% vs. middle office: .59%; late toys: −.54% vs. late office: .80%), this effect is reversed for unconverted sessions (middle toys: .67% vs. middle office: −.85%). Prior research has suggested that consumers buying hedonic products can engage in guilt-justification behavior (e.g., Khan and Dhar 2010; Okada 2005) by looking for deals. Were consumers doing so during the middle stage of the customer journey in the unconverted sessions? Because our data set does not contain information about the types of deals consumers viewed, we are unable to investigate the exact association between the deal visits and nonconversion (e.g., is this nonconversion due to unsatisfying discount level?). Future research with more granular data could investigate this guilt-justification mechanism in the customer journey.
Important Channels for Utilitarian Purchases
As illustrated in Figure 4, Panel B, consumers making utilitarian purchases such as office supplies utilize more third-party reviews (early office: 1.68% vs. early toys: −1.21%; middle office: 1.11% vs. middle toys: −.76%) at the beginning and the middle of the customer journey. They also visit product pages on competing retailers more often (middle office: 1.59% vs. middle toys: −1.08%) in the middle of the journey. In addition, consumers demonstrate greater usage of search engines 3 (late office: 1.51% vs. late toys: −1.18%) and deal sites (middle office: .59% vs. middle toys: −.46%; late office: .80% vs. late toys: −.54%) toward the end of the customer journey. 4
These findings are consistent with the cognitive mechanisms discussed in the H/U literature (Novak, Hoffman, and Duhachek 2003). Utilitarian purchases are often rational and goal-driven, with the objective of optimizing the purchase decision. With more tangible and well-defined utilitarian attributes, information channels that facilitate flexible and direct search and allow for convenient comparisons among alternatives, such as search engines and third-party review sites, might be particularly useful. In addition, the less extensive differentiation associated with utilitarian products makes consumers easier to benchmark across retailers (Noble, Griffith, and Weinberger 2005). Thus, utilitarian purchases involve more product page views on competing retailers than hedonic purchases.
For the unconverted sessions illustrated in Figure 4, Panel D, the patterns observed for converted sessions are attenuated at the early and middle stages of the customer journey. In fact, we find that the overall late-stage channel usage patterns for the unconverted sessions are more like the early-stage channel usage patterns of converted sessions. Thus, analyzing channel usage in sessions that have not led to purchase is important and could be viewed as information search in the early stage of a shopping funnel. In summary, we found that search engines, reviews, deal sites, and competing retailers’ product pages are important for utilitarian purchases, and we speculate that the nonconversion related to utilitarian purchases might be due to insufficient information search and alternative comparisons.
General Discussion
Theoretical Contributions
This study makes several important contributions to the established literature on hedonic and utilitarian consumption, the emerging research on customer journey, and the nascent literature on Big Data marketing. First, we extend the prior customer journey research on online information channel usage (e.g., Kushwaha and Shankar 2013; Li and Kannan 2014; Neslin and Shankar 2009) by introducing a social/psychological angle. In addition to the utility-centric perspective of prepurchase information channels, we find that affective mechanisms such as pleasure seeking and affective attachment documented in the H/U literature (Arnold and Reynolds 2003; Chaudhuri and Holbrook 2001) have significant implications for information channel usage (Lamberton and Stephen 2016). For example, we find that hedonic purchases (e.g., toy products) utilize social media up to 10% more than their utilitarian counterparts (e.g., office supplies) throughout the purchase cycle and are less likely to switch retailer brands by browsing on competing retailers’ websites. Thus, we employ new angles to study information channel choices related to online purchases and extend the H/U literature by testing its predictions in the customer journey context (Batra and Keller 2016).
Second, our study provides a more nuanced view of the dynamic channel usage patterns during the paths to purchase. Our results highlight the importance of considering the temporal effect in the customer journey literature. By examining the early, middle, and late stages of the customer journey, we can derive more actionable insights. For example, we find that product page views on the transacting retailers are different between hedonic and utilitarian purchases up to two weeks before the conversion, and that deal sites are visited by consumers with utilitarian purchases one week before the final purchase. These nuanced findings indicate that when deploying marketing-mix, advertising, and promotion strategies, managers might want to leave a longer window for these strategies to be effective. In summary, we contribute to the customer journey literature (e.g., Johnson et al. 2004; Li and Kannan 2014) by demonstrating the necessity of considering the temporal dimensions in studying the purchase funnel and the customer journey (Lemon and Verhoef 2016).
Third, we provide an actionable framework for incorporating H/U scales in the online purchasing context. Unlike previous studies that have operationalized the H/U characteristics at the product-category level, we provide a more nuanced retailer-category vantage point. From our survey, we found that similar product categories sold at different retailers (e.g., electronics at Home Depot vs. Amazon) receive different H/U scores due to the characteristics of the retailer brands. Managers can leverage our scales to understand their H/U positions in relation to their competitors (see Figure 1 as an example for Home Depot vs. Amazon). Subsequently, these retailer-category-level H/U scores could be plugged into our multivariate multilevel model to identify effective touchpoints among different product categories (as shown in our toys vs. office example in Figure 4) or across different retailers. Therefore, we contribute to the H/U literature by highlighting the necessity of considering retailer brand differences in the product category’s H/U perceptions and bringing the H/U scales to the context of touchpoint management (Kannan and Li 2017).
Finally, we contribute to the growing literature of Big Data marketing (Bradlow et al. 2017; Kitchens et al. 2018; Sudhir 2016; Wedel and Kannan 2016) by demonstrating the great potential unlocked by “Big Data” through a multidata, multimethod approach. By combining primary and secondary data, we illustrate how primary data remain an important complement to large-scale clickstream data by providing critical perceptual enrichment. To integrate these data sources and harness the rich insights embedded in terabytes of data, we employ survey analysis, text mining, machine learning, and Bayesian modeling. Our multivariate multilevel model carefully considers the channel interdependency as well as the customer, retailer, and product heterogeneity through a hierarchical Bayesian approach, providing a viable framework for future research on customer journey. As a result, the study covers six channels and 20 product categories sold on 40 top internet retailers with 115 retailer-category combinations, with over $1 million in sales in a two-year period. To the best of our knowledge, this is the first study that incorporates such a comprehensive set of channels, product categories, and retailers in the customer journey literature. Future Big Data marketing research could use our approach as a framework to integrate multiple data sources encompassing both primary and large-scale secondary data and derive “big” insights accordingly.
Managerial Implications
Our results have several actionable implications for marketing managers. By identifying varying H/U effects on six information channels across customer journey for a total of 115 retailer-category combinations, our model offers a more principled, theoretically driven inductive approach for tailoring marketing strategies to consumers’ shopping needs throughout their journey. In the following, we discuss general marketing strategies as well as Black Friday (and Cyber Monday) marketing ideas for retailers selling hedonic and utilitarian products. Multicategory retailers can customize their marketing strategies based on their product types accordingly.
First, for retailers selling hedonic products such as toys, we provide two actionable insights: (1) embrace social media and (2) monitor on-site product page views. Our study shows that social media is being used extensively throughout the customer journey and is increasingly becoming a channel for proactive information search (eMarketer 2017). Therefore, marketing managers should consistently invest in social media marketing to entice more consumers to visit their websites. In addition, we find that there is a potential guilt-justification need for consumers who failed to complete hedonic purchases. Because social media is extensively used at the beginning of the journey, retailers could deploy social coupons with features that serve both the experiential and justification needs of hedonic purchases (Kumar and Rajan 2012). Furthermore, we find that on-site product pages are leveraged extensively at the beginning of the journey and start to reduce one week before the purchase. Given the affective nature of hedonic purchases, retailers should constantly improve the experiential features of the product pages on their sites to convert more hedonic purchases. Moreover, retailers can monitor their page views and reach out to heavy browsers with promotions with a longer redemption time (e.g., two weeks).
Second, for retailers selling utilitarian products such as office supplies, we offer two prescriptions: (1) benchmark price and product and (2) prioritize search engine marketing (SEM). Our study shows that consumers tend to optimize their utilitarian purchase by visiting third-party review sites, exploring deal sites, and browsing product pages on competing retailers’ sites. Therefore, retailers should employ price and product benchmark analysis to understand whether their price is above or below the market price and what potential customers see and experience when searching for similar products. Given the rise of competitive intelligence, managers could invest more in automated benchmarking tools to monitor, listen, and analyze the key competitive metrics (e.g., price, live deals, Yelp reviews) in real time. In addition, we find that consumers making utilitarian purchases tend to use search engines more toward the end of the journey. Because search engine optimization is more powerful in driving organic traffic at the top of the funnel, and SEM is more effective in driving conversions at the bottom of the funnel, retailers should prioritize SEM over search engine optimization. In addition, they should choose paid keywords that are more related to product features and benefits, provided that utilitarian purchases usually involve more product comparisons.
Finally, our dynamic view of channel usage across customer journey could offer specific guidelines for a Black Friday (and Cyber Monday) marketing strategy. Retailers selling hedonic products could market their promotional content on social media and send reminder emails inviting on-site traffic two weeks before Black Friday, when their customers start to engage in social media and on-site product pages. Retailers selling utilitarian products could extend their sales because consumers start to visit deal sites one week before they make purchases. In addition, they could optimize their SEM strategy during Black Friday or Cyber Monday to enhance the conversion rate.
Limitations and Future Directions
Admittedly, this study has several limitations that future work could address. First, we examined observed channel usage behaviors mostly at the URL level. We do not have data on the specific types of information searches that consumers performed—for example, seeing what a friend “liked” on a social networking site, as well as the content about the products available at these channels. Although such data are difficult to collect and raise significant privacy concerns, analyzing them could offer additional insights regarding the H/U effect on specific types of touchpoints as well as how this effect interacts with product availability. In a similar vein, although we track usage of review sites, we do not have measures of consumers’ use of product reviews within a retailer’s site because on-site product reviews are often embedded within the product pages, thereby lacking explicit URL patterns to help discern when a consumer has read a review. These limitations make it difficult to make unique causal attributions from social media, search engine, and review site browsing to product purchases.
Second, although we use three time-windows to capture the dynamic channel usage effect at the early, middle, and late stages of the customer journey (8–14, 2–7, and 0–1 days, respectively), we do not consider the order of channel usage within each time window. The temporal proximity of channel usage might affect the final purchase. While acknowledging this limitation, our goal was to highlight the interplay between retailer-category-level H/U scores and online channel usage leading up to consumer purchases. We believe the work on multichannel attribution models (e.g., Li and Kannan 2014) represents an important related body of literature that could be incorporated into future studies.
Similarly, we did not analyze search depth, which is often represented as total time spent on each URL. Search depth could be important for the H/U effect, as suggested by prior studies (Kushwaha and Shankar 2013; Okada 2005). Moreover, we did not employ category-specific cycle length because we could not differentiate product-based searches from baseline channel usage for certain channels. Future studies with detailed search log and clickstream data could solve this problem.
Finally, due to data limitations, we did not analyze other important information channels. These include email, referrals, television (see, e.g., De Haan, Weisel and Pauwels 2016; De Vries, Gensler, and Leeflang 2017; Srinivasan, Rutz, and Pauwels 2016) and visits to brick-and-mortar stores (showrooming). Given the increasing importance of social media (eMarketer 2017; Hewett et al. 2016), further research could investigate differential effects of various types of social media during the customer journey: examples include firm-generated content (Colicev et al. 2018), social influencers (Hughes, Swaminathan, and Brooks 2019), and the consumers’ individual expression on social media (Hollebeek and Macky 2019; Lamberton and Stephen 2016). In a similar vein, because our data set is restricted to desktop clickstream data, we did not observe purchases that occurred offline or through mobile sites. With the surge in mobile usage, cross-device channel usage could constitute an increasingly important future direction of research (e.g., De Haan et al. 2018).
Conclusion
Our results show that consumers’ utilization of various path-to-purchase channels differs across the retailer-category hedonic and utilitarian characteristics of purchased products. Specifically, consumers making hedonic purchases seek fun, enjoyment, and pleasure in their shopping process; prefer social media; and are more likely to browse product pages on the target retailers’ website. By contrast, consumers making utilitarian purchases prefer channels that facilitate convenient and efficient search across alternatives. Therefore, they prefer leveraging search engines, reading more reviews on the third-party review sites, comparing prices on deal sites, and browsing more product pages on competing retailers’ websites than hedonic purchasers.
Because channel usage changes dynamically throughout the customer journey, the H/U effect also varies. Specifically, for hedonic purchases, social media is used as early as two weeks before the final purchase. Conversely, for utilitarian purchases, third-party review sites are engaged two weeks before the final purchase, and this effect is attenuated toward the purchase day. Search engines and deal sites are utilized to a greater extent closer to the day of a utilitarian purchase. We also find that the H/U effect on product page views decreases over time, suggesting a consideration set narrowing process.
The analysis of unconverted sessions demonstrates a different H/U effect. For hedonic purchases, social media is only used by hedonic purchases closer to the end of the journey. Deal site visits and product page views on competing retailers’ sites increase, indicating a possible guilt-justification demand commonly shown in hedonic consumption. Conversely, channels used by consumers making utilitarian purchases are not employed at the same level in the unconverted sessions, indicating that the nonconversion might be due to insufficient information search.
As digital marketing and monitoring spending continue to grow, our findings provide important implications for marketing managers who want to better allocate resources across digital channels. We also believe this study constitutes an important step toward examining the interplay between hedonic and utilitarian characteristics of online purchases and their implications for digital path-to-purchase channels—a direction on which we hope future research can continue to build.
Supplemental Material
Supplemental Material, jm.16.0391-File003 - Path to Purpose? How Online Customer Journeys Differ for Hedonic Versus Utilitarian Purchases
Supplemental Material, jm.16.0391-File003 for Path to Purpose? How Online Customer Journeys Differ for Hedonic Versus Utilitarian Purchases by Jingjing Li, Ahmed Abbasi, Amar Cheema and Linda B. Abraham in Journal of Marketing
Footnotes
Acknowledgments
The authors thank Raj Venkatesan, Zijun Ke, and Chenhui Liu for helpful comments. Research support from the Center for Business Analytics at the McIntire School of Commerce is gratefully acknowledged.
Associate Editor
P.K. Kannan
Declaration of Conflicting Interests
The author(s) declared no potential conflicts of interest with respect to the research, authorship, and/or publication of this article.
Funding
The author(s) received no financial support for the research, authorship, and/or publication of this article.
Notes
References
Supplementary Material
Please find the following supplemental material available below.
For Open Access articles published under a Creative Commons License, all supplemental material carries the same license as the article it is associated with.
For non-Open Access articles published, all supplemental material carries a non-exclusive license, and permission requests for re-use of supplemental material or any part of supplemental material shall be sent directly to the copyright owner as specified in the copyright notice associated with the article.