
Abstract
Mathematics fact fluency is essential for proficiency in advanced topics, such as algebra. However, many students in the United States, including those in elementary and secondary grades, experience mathematics difficulties (MD) and struggle to develop fluency with mathematics facts. We synthesized findings from 35 group-design studies, reporting 178 effect sizes (ESs), conducted between 1975 and June 2024, to evaluate the efficacy of fact fluency interventions and identify key malleable moderators of intervention outcomes. Results from a Robust Variance Estimation (RVE) model revealed an educationally meaningful average ES (g = 0.76), providing evidence of the overall efficacy of fact fluency interventions. However, the prediction interval (−0.60 to 2.12) indicated substantial heterogeneity in treatment effects, warranting further investigation. To explore this variability, we conducted a meta-regression analysis to examine the role of intervention dosage indicators (e.g., frequency) and alignment indicators (e.g., grade level) while accounting for study-level confounders (e.g., publication era). Significant moderators included two dosage indicators (i.e., grouping and total sessions) and two alignment indicators (i.e., operation focus and outcome measures). We discuss these results in relation to limitations, implications for future research, and classroom practice.
Mathematics proficiency is essential for academic success and long-term economic opportunity (Cogan et al., 2018; Wang et al., 2023). In response to growing demands for mathematically literate citizens, initiatives such as the Common Core State Standards for Mathematics (CCSS-M) and the National Council of Teachers of Mathematics (NCTM) have emphasized conceptual understanding alongside procedural fluency (Asempapa & Sturgill, 2017). However, despite these efforts, national assessments reveal persistent underperformance in mathematics across grade levels. For instance, only 41% of fourth graders and 34% of eighth graders scored proficient or above on the 2019 National Assessment of Educational Progress (NAEP), and scores declined further following the COVID-19 pandemic (National Center for Education Statistics [NCES], 2024). These trends are even more troubling for students with disabilities: just 17% of fourth graders and 9% of eighth graders with disabilities reached proficiency in 2019, with most scoring below the basic level. These longstanding disparities underscore the urgent need to strengthen mathematics instruction (Witzel et al., 2024), particularly for students who face persistent challenges in foundational skills.
A lack of mathematics fact fluency is frequently cited as a significant contributor to the difficulty students experience in developing mathematics proficiency (Burns et al., 2010; Codding et al., 2011). Mathematics fact fluency is the ability to quickly and accurately recall foundational calculations, such as 5 + 5 = 10 or 2 × 8 = 16 (Morano et al., 2020; Price et al., 2013). It is a well-established precursor to later mathematical proficiency (Burns et al., 2024; Witzel, 2016). Mathematics fact fluency enables students to apply their knowledge of facts to achieve computational fluency, facilitating accurate execution of operations with multi-digit numbers and procedural steps, such as regrouping (Cason et al., 2019; Geary, 2013). Students who cannot extend their proficiency in mathematics facts to computational fluency may struggle with the complex reasoning skills required as they progress through grade levels (Burns et al., 2010; Cason et al., 2019). Therefore, fostering fact fluency is critical for improving mathematical outcomes, particularly for students facing challenges, such as those with mathematics difficulties (MD).
To enhance the development and application of students’ mathematics fact fluency, it is essential to equip practitioners with evidence-based insights into not just which interventions are efficacious but also how to intensify them to meet student needs (Burns et al., 2010; Codding et al., 2022). We define interventions as structured instructional and assessment practices delivered in addition to a student’s general education instruction (Powell et al., 2022). However, standard interventions may not provide sufficient practice or support for students with MD, necessitating greater instructional intensity, especially through features such as increased dosage and closer alignment to students’ curricular and learning needs (Fuchs et al., 2017; Powell et al., 2022).
Students With Mathematics Difficulties
Students with MD are those who experience persistent challenges in mathematics, including students who are formally identified with a specific learning disability (SLD) or those at risk for one (Swanson et al., 2018). Students with a formal SLD diagnosis in mathematics often have Individualized Education Program (IEP) goals outlining specific mathematics goals and services. These students typically exhibit difficulty with various academic tasks, such as those related to mathematical calculations or mathematical reasoning (Individuals with Disabilities Education Act [IDEA], 2004).
Students at risk for SLD display similar challenges to those with an SLD in mathematics, including difficulty with mathematics fact fluency (Cirino et al., 2015; Swanson et al., 2013). These students do not have a school-identified SLD but exhibit persistent low performance in mathematics, which is typically identified using predetermined performance criteria on standardized mathematics screening measures, often set by percentile ranks (e.g., at or below the 25th percentile; G. Nelson & Powell, 2018). In addition to screening measures, students can also be classified based on below-average class performance, teacher recommendations, or their limited response to increasingly intensive support in mathematics (Clarke et al., 2020; Jitendra et al., 2018; Lembke et al., 2012). For this study, we use the term MD to refer to students with and without SLD who face challenges in mathematics, regardless of how they were identified. One key area where students with MD often require intensified support is the development of mathematics fact fluency, the ability to quickly and accurately recall basic arithmetic facts (Burns et al., 2010; Codding et al., 2011). Without proficiency in fact fluency, students struggle to engage in more complex mathematical reasoning, resulting in persistent challenges to their overall mathematics achievement (Price et al., 2013; Witzel, 2016).
Mathematics Fact Fluency
Mathematics fact fluency, often called fact fluency or whole-number combinations, refers to a student’s capacity to quickly and accurately retrieve 390 facts: 100 addition facts with single-digit addends, 100 subtraction facts with single-digit subtrahends, 100 multiplication facts with single-digit factors, and 90 division facts with single-digit divisors (Burns et al., 2012; Fuchs et al., 2006; McVancel et al., 2018). Mathematics fact fluency is foundational for achieving success in mathematics (Burns et al., 2010; Powell et al., 2025; Riccomini et al., 2017). This automatic retrieval of mathematical facts without relying on counting strategies or visual aids is critical, as it frees cognitive resources for more complex tasks (Fuchs et al., 2016; VanDerHeyden & Burns, 2005). Students with limited mathematics fact fluency often face challenges in understanding more complex mathematical concepts, which can lead to limited proficiency in rational number operations and algebra (Bailey et al., 2014; Jordan et al., 2017; Witzel, 2016). Throughout this analysis, we will refer to mathematics fact fluency as fact fluency to align with the common reference of the construct.
In contrast, computational fluency involves accurately executing addition, subtraction, multiplication, and division with multi-digit numbers (Geary, 2011). For students to develop computational fluency, they must possess proficiency in mathematical facts, a conceptual understanding of number relationships, and the ability to perform multistep mathematical procedures (Jordan et al., 2007; Witzel, 2016). For example, for a student to accurately add 25 + 35, they could begin in the ones place and add 5 + 5, relying on the mathematical fact that 5 + 5 = 10. Once they have the sum of 10, students could regroup the 10 ones into 1 ten in the tens place. Finally, students will add 2 + 3 + 1 to calculate the sum of the tens place.
Students With MD and Their Mathematics Fact Fluency
Students with MD face significant challenges developing fact fluency due to several interrelated factors. Students often struggle to retrieve mathematical facts from long-term memory, resulting in slower response times and an overreliance on inefficient strategies, such as finger counting (Geary, 2013). In addition, procedural errors, challenges in automaticity with mathematics facts, and cognitive load issues, such as the strain on working memory when managing multiple steps in a problem or the inability to efficiently retrieve information from long-term memory, further hinder their progress (Mabbott & Bisanz, 2008; Swanson et al., 2013). These students require additional practice to achieve fluency and often continue using backup strategies long after their peers have progressed to more advanced reasoning (Burns et al., 2015; Stickney et al., 2012). Moreover, limited motivation or mathematics anxiety may exacerbate these struggles (Ashcraft & Krause, 2007; Pollack et al., 2021).
Many students with MD also lack access to targeted, effective fact fluency interventions, further hindering their progress (Codding et al., 2011). To address these challenges, researchers have designed various interventions to support the mathematics fact fluency of students with MD, including incremental rehearsal, Cover-Copy-Compare (CCC), and computer-based programs (Abu-Hamour, 2019; Burns et al., 2012, 2019). A systematic evaluation of these interventions across grade levels (K–12) is needed to determine how malleable intervention indicators, such as dosage and alignment, promote instructional intensity and, in turn, impact the fluency outcomes of students with MD.
Literature Review: Summary of Previous Systematic Reviews
Several systematic reviews have examined strategies to support fact fluency development among students with MD, including five meta-analyses and four narrative reviews. The narrative reviews primarily focused on instructional approaches such as CCC (Joseph et al., 2012; Stocker & Kubina, 2016) and technology-mediated interventions (Cozad & Riccomini, 2016; Kiru et al., 2017). While these reviews provide valuable summaries of intervention strategies, they do not aggregate effect sizes (ESs) or systematically evaluate how malleable features of instructional design influence student outcomes.
In contrast, five meta-analyses have exclusively synthesized the effects of fact fluency interventions for students with MD (Burns et al., 2010, 2024; Codding et al., 2011; S. A. Kim et al., 2023; Kleinert et al., 2018). Four of these studies relied exclusively or primarily on single-case design (SCD) studies, which, while helpful in assessing individual responsiveness to intervention, limit generalizability due to small sample sizes, absence of random assignment, and variations in design features that complicate the estimation and comparison of ESs across studies (Kratochwill & Levin, 2010). Moreover, these meta-analyses often lacked formal quality appraisals and did not conduct systematic moderator analyses. Only S. A. Kim et al. (2023) included group-design studies, although they were pooled with SCDs, making it challenging to interpret effects across methodological approaches. To extend this literature, the present meta-analysis focuses exclusively on group-design studies, including randomized controlled trials (RCTs) and quasi-experimental designs (QEDs), incorporates a formal quality appraisal, and systematically examines how indicators of instructional intensity (i.e., dosage and alignment) moderate the effects of interventions. This approach aims to generate practical, evidence-based guidance for intensifying fluency instruction for students with MD.
Conceptual Foundations: Dosage and Alignment as Moderators
Although instructional intensity has gained increased attention in interventions for students with MD, the role of malleable features in shaping that intensity and moderating intervention effects remains underexplored (Myers et al., 2022). Fuchs et al. (2017) identified dosage and alignment as key dimensions of instructional intensity, emphasizing their importance in optimizing the efficacy of interventions. More recently, Myers et al. (2024) investigated how variations in these features influence word problem outcomes among students with MD, highlighting their potential as moderators. However, prior meta-analyses have not systematically analyzed these dimensions within fact fluency interventions, limiting our understanding of how instructional exposure (i.e., dosage) and focus (i.e., alignment) support fluency development for students with MD. Intervention intensity is increasingly seen as a multidimensional construct that extends beyond simple treatment-control comparisons (Fuchs et al., 2017; Vaughn et al., 2011). Identifying specific, adjustable indicators that can be modified to improve fluency outcomes is essential. Dosage and alignment seem to be key mechanisms through which instructional intensity is organized and varied (Fuchs et al., 2017; Myers et al., 2024).
Potential Impact of Dosage Indicators
Dosage refers to the amount of instructional exposure that students receive, which is shaped by several factors, including frequency, duration, total number of sessions, grouping, and setting (Myers et al., 2024). These elements influence how often and how long students engage in structured practice, scaffolding, and feedback. Group size and instructional setting often go hand-in-hand. Smaller groups or one-on-one instruction can provide more individualized support, which may enhance learning outcomes (Powell et al., 2022). However, some studies suggest that classwide interventions can be equally or even more effective, especially when structured practice and consistent scaffolding are embedded (Kleinert et al., 2018). The setting also shapes the intensity of instruction: general education classrooms may limit individualized attention, while intervention settings can support higher-dosage, tailored instruction (Powell et al., 2022). These factors indirectly affect dosage and student outcomes (Myers et al., 2024).
Session frequency, defined as the number of sessions per week, also plays a role (Myers et al., 2022). Higher-frequency interventions are often linked to better outcomes due to more consistent practice (Myers et al., 2022). Still, the optimal balance remains unclear; less frequent but longer sessions may also yield meaningful gains, depending on content and context. Instructional duration, typically measured in total hours, determines how much cumulative exposure students receive. Although longer durations may enhance learning through extended practice, research indicates diminishing returns beyond a certain threshold (Myers et al., 2022). Finding the optimal duration helps maximize engagement and instructional efficiency without unnecessary time costs. Finally, the total number of sessions contributes to overall exposure and retention. More sessions generally support stronger fluency development, but excessive repetition may not provide additional value once core skills are established (Kong et al., 2021; Powell et al., 2022). Evaluating the interaction between frequency, duration, and session count is crucial for understanding how dosage affects the efficacy of interventions (Myers et al., 2024).
Potential Impact of Alignment Indicators
Alignment refers to the extent to which an intervention’s instructional content and structure align with students’ learning needs (Fuchs et al., 2017). Myers et al. (2024) conceptualized alignment in two dimensions: content alignment and student alignment. Content alignment involves the operation and outcome measure focus. The operation focus, defined as whether the intervention targets additive operations (addition/subtraction), multiplicative operations (multiplication/division), or both, can shape efficacy, as students with MD often struggle more with certain operations (S. A. Kim et al., 2023; Myers et al., 2021). Interventions that focus on addition and subtraction may yield stronger effects, particularly at early grade levels, due to their alignment with elementary curricula (Geary, 2013). Outcome measure refers to how intervention success is assessed. Some interventions target fact retrieval (i.e., fact fluency); others aim for broader computational fluency or problem-solving. The alignment between instructional emphasis and assessment type may influence ES estimates (Myers et al., 2024). For example, tasks that require integrating fluency within multistep word problems may show weaker effects due to added cognitive demands beyond fact retrieval alone (Powell et al., 2022).
Student alignment captures whether the intervention is developmentally appropriate. Grade level serves as a proxy here, as younger students (Grades K–3) tend to respond more rapidly to fluency instruction due to greater cognitive flexibility (Bloom et al., 2008). Older students (Grades 4–12) may require more structured or intensive support, and the relative impact of fluency interventions may decrease as curricular demands shift toward higher-level reasoning (Myers et al., 2023). While each dosage and alignment indicator may influence fluency outcomes, prior studies have not systematically examined their unique contributions within a unified analytical framework. By estimating the independent effects of key intensity indicators, such as frequency, duration, operation focus, and grade level, this study provides a nuanced understanding of how specific features of intervention design relate to outcomes. These findings aim to inform the development of more precisely targeted fluency interventions for students with MD across diverse instructional settings.
Potential Study-Level Confounders
The moderating influence of dosage and alignment indicators must be interpreted in conjunction with other study-level characteristics that can shape intervention outcomes (Tipton et al., 2023). Hence, we controlled for 12 study-level confounders: publication era, ethnic composition, gender composition, MD identification method, interventionist, fidelity of implementation reporting, research design, assignment level, control condition, dependent measure type, funding status, and country.
A critical moderator to consider is publication era (Lein et al., 2020; Myers et al., 2022). The release of the NCTM Standards in 2000 has prompted a significant shift in mathematics instruction away from rote fluency practice and toward conceptual understanding, reasoning, and problem-solving (Findell et al., 2001; Schoenfeld, 2004). Consequently, curricula developed in the subsequent period often reduced time devoted to systematic fluency building. This broader curricular context may have muted the observed impact of interventions targeting fact retrieval, as students’ baseline fluency was potentially lower. Later reforms, most notably the Common Core State Standards-Mathematics (CCSS-M), reintroduced procedural fluency as a foundational expectation, although embedded within broader reasoning goals (Porter et al., 2011). Therefore, testing publication era as a moderator is essential to isolate the specific effect of the interventions from the historical changes in prevailing curricular emphasis that define the instructional backdrop of the studies.
Other study-level confounders reflect variation in participant characteristics, MD identification methods, implementation fidelity, and study design features. Ethnic and gender composition of samples may also influence outcomes, as differences in access, opportunity, and motivation have been linked to mathematics performance (Cheema & Galluzzo, 2013; Fryer & Levitt, 2010). Furthermore, the MD identification approach may influence outcomes. Students with MD may be identified through different procedures, such as percentile cutoffs, standardized test scores, or multiple criteria, which yield samples that differ in baseline responsiveness to intervention (Dennis et al., 2016). Implementation fidelity and research design features may also significantly impact the results. In terms of interventionist, outcomes may differ depending on whether interventions are delivered by researchers, teachers, or computer programs, and whether fidelity is reported (Dennis et al., 2016; Myers et al., 2021, 2022). Methodological rigor also matters, as RCTs provide stronger evidence than QEDs, and the level of assignment (student versus classroom) has been shown to influence intervention effects (Myers et al., 2022; Xin & Jitendra, 1999). Similarly, the control condition may be consequential; comparisons against active treatments typically yield smaller effects than those against business-as-usual instruction (Kroesbergen & Van Luit, 2002).
Finally, dependent measure type, funding status, and country may represent additional study-level confounders. Prior meta-analyses of math outcomes have consistently shown that researcher-developed outcome measures produce larger effects than standardized assessments (Jitendra et al., 2020; Myers et al., 2021). Funding status may also influence study quality and reporting, as sponsored projects may differ in scope or carry risks of bias (Jefferson, 2020; Ou et al., 2024). The variable country controls for cross-national differences, as educational systems vary substantially in curriculum and teacher preparation, potentially shaping both the design and effectiveness of fluency interventions (Myers et al., 2022). Hence, by including these 12 study-level confounders, we aim to reduce omitted variable bias, leading to a more precise estimation of the unique contributions of intervention design to address fact fluency outcomes among students with MD.
Rationale
Prior syntheses have provided valuable insights into the effectiveness of mathematics fact fluency interventions for students with MD, primarily drawing on SCD studies and narrative reviews. These reviews have identified promising practices and suggested generally strong effects. At the same time, inconsistent application of quality standards and limited attention to instructional moderators have left important gaps in the evidence base. The present meta-analysis addresses these gaps by focusing exclusively on group-design studies to enable quantitative synthesis using consistent ES metrics, applying formal quality appraisal based on the Council for Exceptional Children (CEC) standards, and systematically examining how malleable instructional features, specifically dosage and alignment indicators, are related to fluency outcomes.
Furthermore, to ensure that the estimates for these primary moderators (dosage and alignment) are robust, we incorporated a set of study-level confounders into our models. Variables such as publication era, country, and dependent measure type help account for methodological, contextual, and sample-related differences that might otherwise bias the results. These study-level confounders are included solely as statistical controls, not as moderators for substantive interpretation. Our central focus is on dosage and alignment indicators, which provide the clearest insight into how often fluency instruction is delivered, in what form, and for which students (Myers et al., 2024).
Purpose and Research Questions
The purpose of this meta-analysis was to extend the existing literature by evaluating the overall efficacy of mathematics fact fluency interventions for students with MD in group-design studies. In addition to assessing study quality using the CEC quality indicators (QIs), this study systematically examined how malleable instructional features, specifically dosage and alignment, influence intervention effects. By identifying the independent contributions of these features, this meta-analysis aims to provide practitioners with evidence-based recommendations for intensifying fact fluency instruction to support mathematics fluency outcomes for students with MD. Two research questions guide our analysis:
Method
We conducted this meta-analysis following the Preferred Reporting Items for Systematic Reviews and Meta-Analyses (Page et al., 2021) guidelines and the systematic review process outlined by Pigott and Polanin (2020). Our search spanned peer-reviewed (i.e., journal articles) and non-peer-reviewed (i.e., dissertations, theses, reports) studies published from January 1975, marking the passage of Public Law 94-142, the first federal legislation mandating special education services in the United States, through June 2024. This start date marks the beginning of systematic research on interventions for students with academic difficulties, particularly in special education, which has laid the groundwork for much of the current research on MD more broadly. To ensure comprehensive coverage, we used a multimodal search approach that included electronic database searches, forward and backward citation searches of studies identified after completing the full-text screening of electronic records, and a review of references from existing reviews and meta-analyses. First, we conducted electronic database searches in Academic Search Complete, APA PsycInfo, Education Source, and ERIC using Boolean search strings targeting interventions for fact fluency and populations at risk for mathematics difficulties (see Figure 1). These searches yielded 3,159 records. After removing duplicates, we retained 2,696 records for initial title and abstract screening.
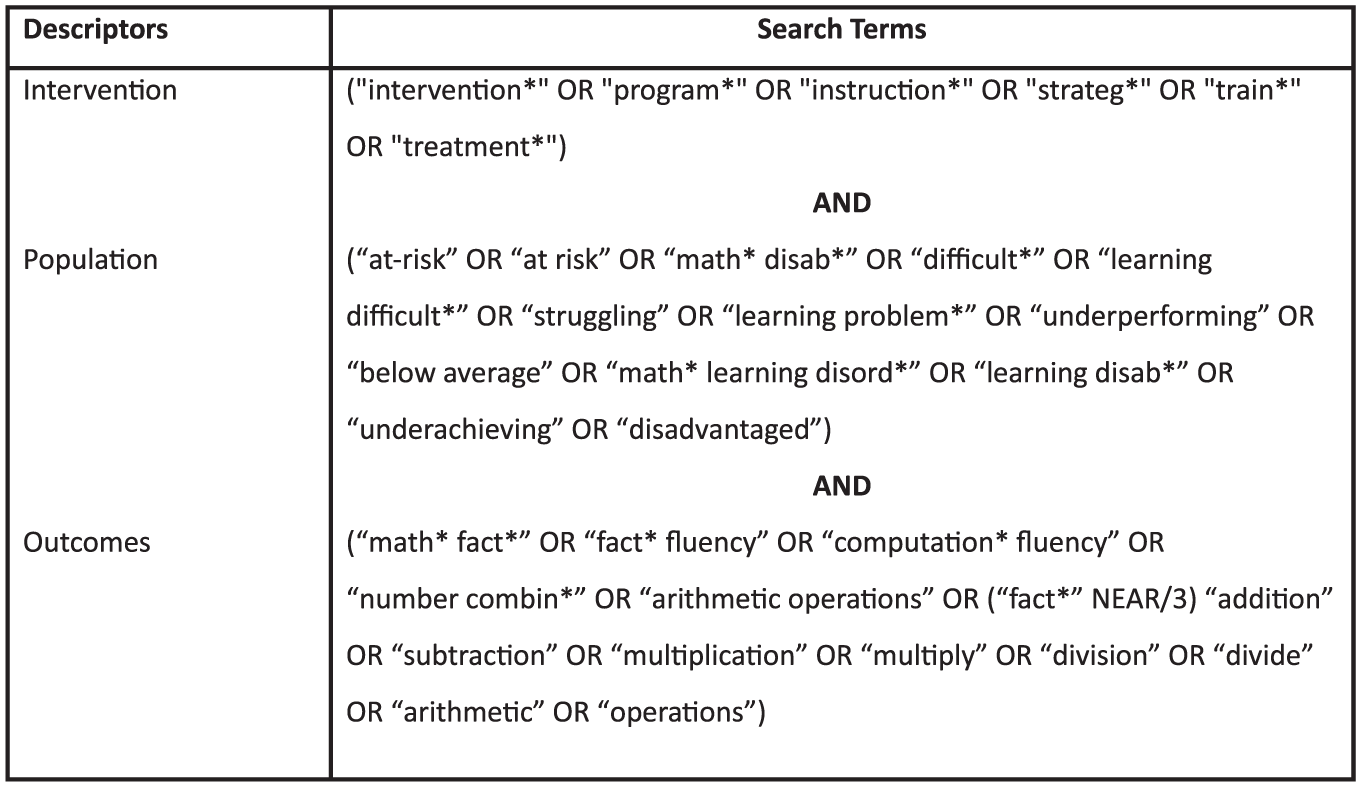
Boolean Search Terms for Electronic Database Searches.
We also conducted forward citation searches of the 33 studies retained after our screening process of the electronic search results (described below) and backward citation searches of their reference lists. These searches yielded 14 additional records, 12 of which were duplicates already retrieved through the electronic search. The remaining two records were unique and advanced to screening, where both met inclusion criteria, bringing the total number of included studies to 35. Screening of references from existing reviews and meta-analyses yielded no additional eligible records. The complete flow of studies through the review process is presented in Figure 2 (i.e., the PRISMA diagram). We describe the screening, coding, and data extraction procedures in the following sections; however, because these stages required independent coder judgment, we first explain how interrater reliability (IRR) was established and calculated.
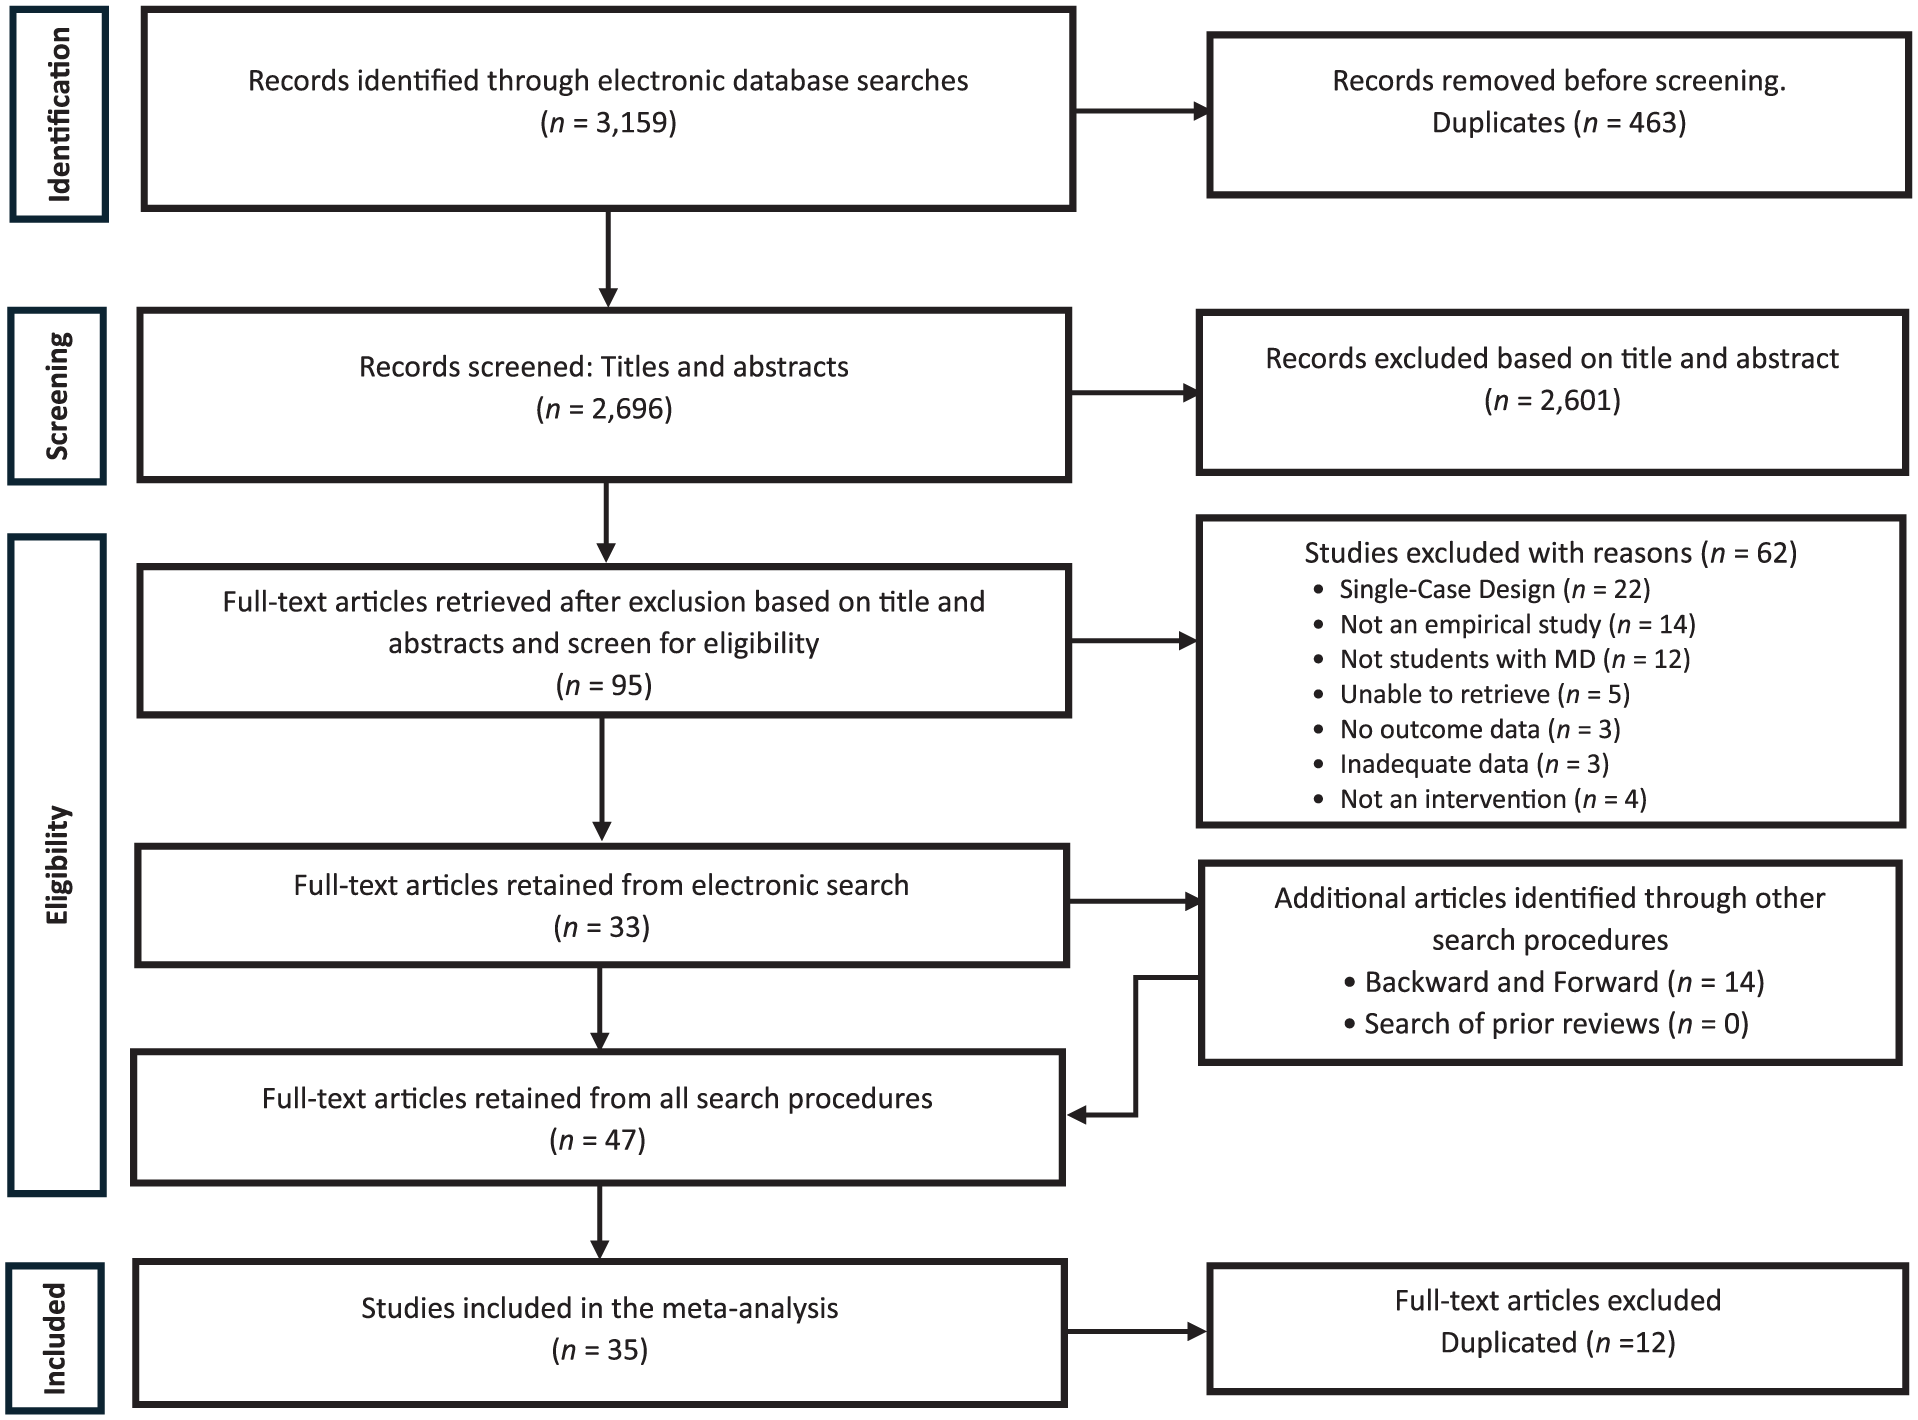
Diagram Showing the Search and Retrieval Process.
IRR Calculation
Two graduate research assistants (GRAs) independently completed all phases of screening, study coding, and ES data extraction, resulting in double-coding across the entire review process. Both had prior experience with systematic reviews and received structured training on the coding manual and procedures from a senior member of the research team prior to data collection. IRR was calculated as the number of agreements divided by the total number of ratings (agreements plus disagreements), multiplied by 100. Discrepancies were resolved in consultation with senior team members until full consensus was reached.
Screening Procedures
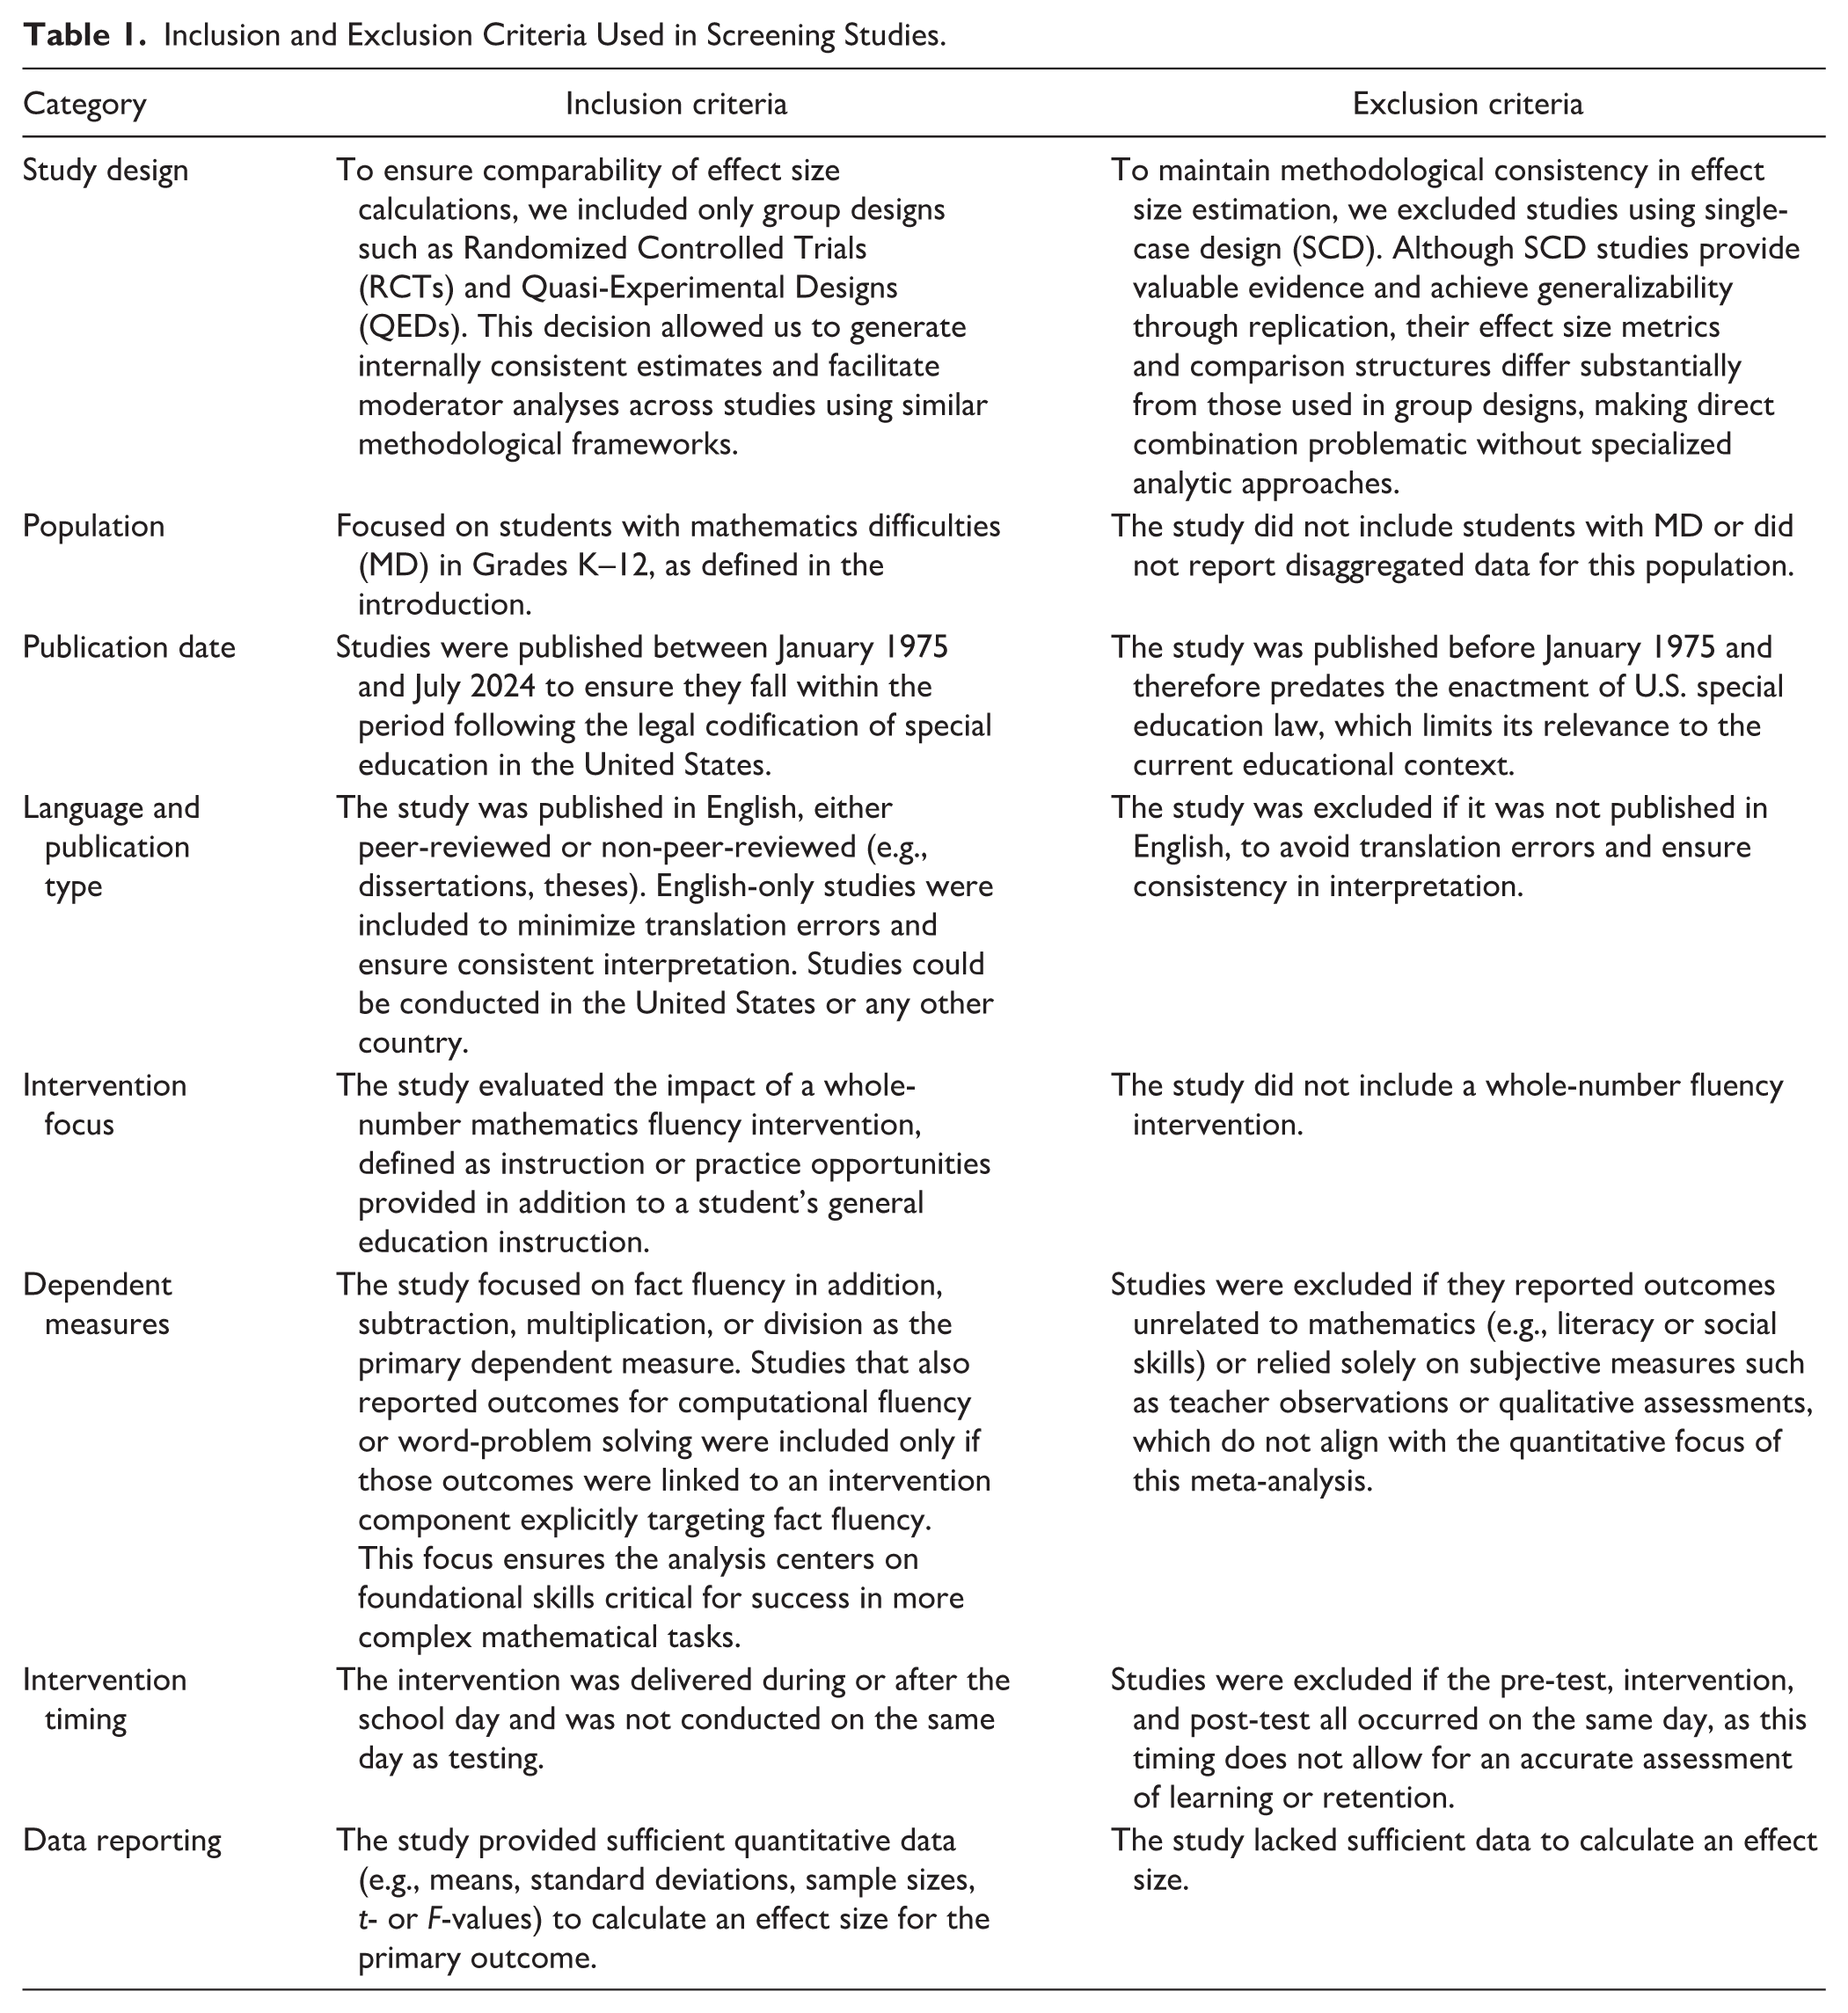
We screened the 2,696 records retrieved via electronic searches using Rayyan, a web-based platform designed to support systematic reviews. Titles and abstracts were evaluated against the inclusion and exclusion criteria outlined in Table 1. Of these, 2,601 records were excluded, and 95 were retained for full-text review. The IRR for this phase was 99.8%, with six discrepancies.
Inclusion and Exclusion Criteria Used in Screening Studies.
Study Coding and Data Extraction
We used a three-step process to code the 35 included studies: (a) evaluating study quality, (b) extracting study information to identify potential moderators, and (c) extracting data for ES calculations. The coding protocol for the first two phases was developed through an iterative process. The first and second authors collaboratively designed the initial coding manual, which was reviewed and refined in consultation with an additional author until full agreement on the final protocol was reached. For each phase, the two authors who conducted the initial screening independently coded all studies twice.
Phase 1: Study Quality Evaluation
The first phase of the coding process involved conducting a quality appraisal of each study that met our inclusion criteria, following similar procedures to those used in previous systematic reviews on interventions for students with MD (e.g., Dennis et al., 2016). We assessed study quality using a checklist of 24 QIs developed by the CEC for evaluating group-design research, which encompassed multiple dimensions, such as implementation fidelity, study context, psychometric properties of dependent measures, internal validity, and data analysis techniques (Cook et al., 2015). The two screeners independently coded each study and assigned a score of 1 (Met), 0 (Not Met), or “Not Applicable” (NA) for each QI. The NA designation was applied in cases where a specific QI did not logically pertain to a given study (e.g., fidelity monitoring indicators for fully automated, computer-based interventions that did not involve a human instructor). Across the 24 indicators coded for each of the 35 studies (840 total ratings, including NA as a valid code), IRR was 96.5% (811/840) with 100% agreement after discussion.
Previous studies (e.g., Dennis et al., 2016; Myers et al., 2022) have often used summed quality scores as a moderator in meta-analyses, implicitly assuming each indicator contributes equally to the overall quality score. However, researchers have highlighted limitations to this approach, as it may not accurately represent the structure or relative importance of individual items (McNeish & Wolf, 2020). Recognizing that not all QIs contribute equally to study quality, we chose not to aggregate the scores. Although including each QI as a separate predictor in the meta-regression model would have been ideal for explaining heterogeneity in effects, this was not feasible due to the limited number of data points relative to the number of predictors (Tipton et al., 2023). Instead, we describe patterns across the QIs and provide a descriptive summary of our assessment. This structured evaluation approach allowed us to identify recurring strengths and weaknesses in the methodological rigor of the included studies, which informed our interpretation of the meta-analytic results.
Phase 2: Study Information Data Extraction
In the second phase, we extracted study-level information for potential moderators in the meta-analysis, including alignment, dosage, and potential confounders (see Table 2 for a full list and coding criteria). The coding protocol for this phase was developed through an iterative process: the first and second authors collaboratively drafted the initial coding manual, piloted it on a subset of studies, and refined it in consultation with an additional author until full agreement was reached. This process ensured that all definitions and decision rules were clear before double-coding began. After the protocol was finalized, a senior researcher trained both coders to ensure consistent application of definitions and decision rules before double-coding began.
Coding Criteria for Variables Representing Dosage Indicators, Alignment Indicators, and Study-Level Confounders.
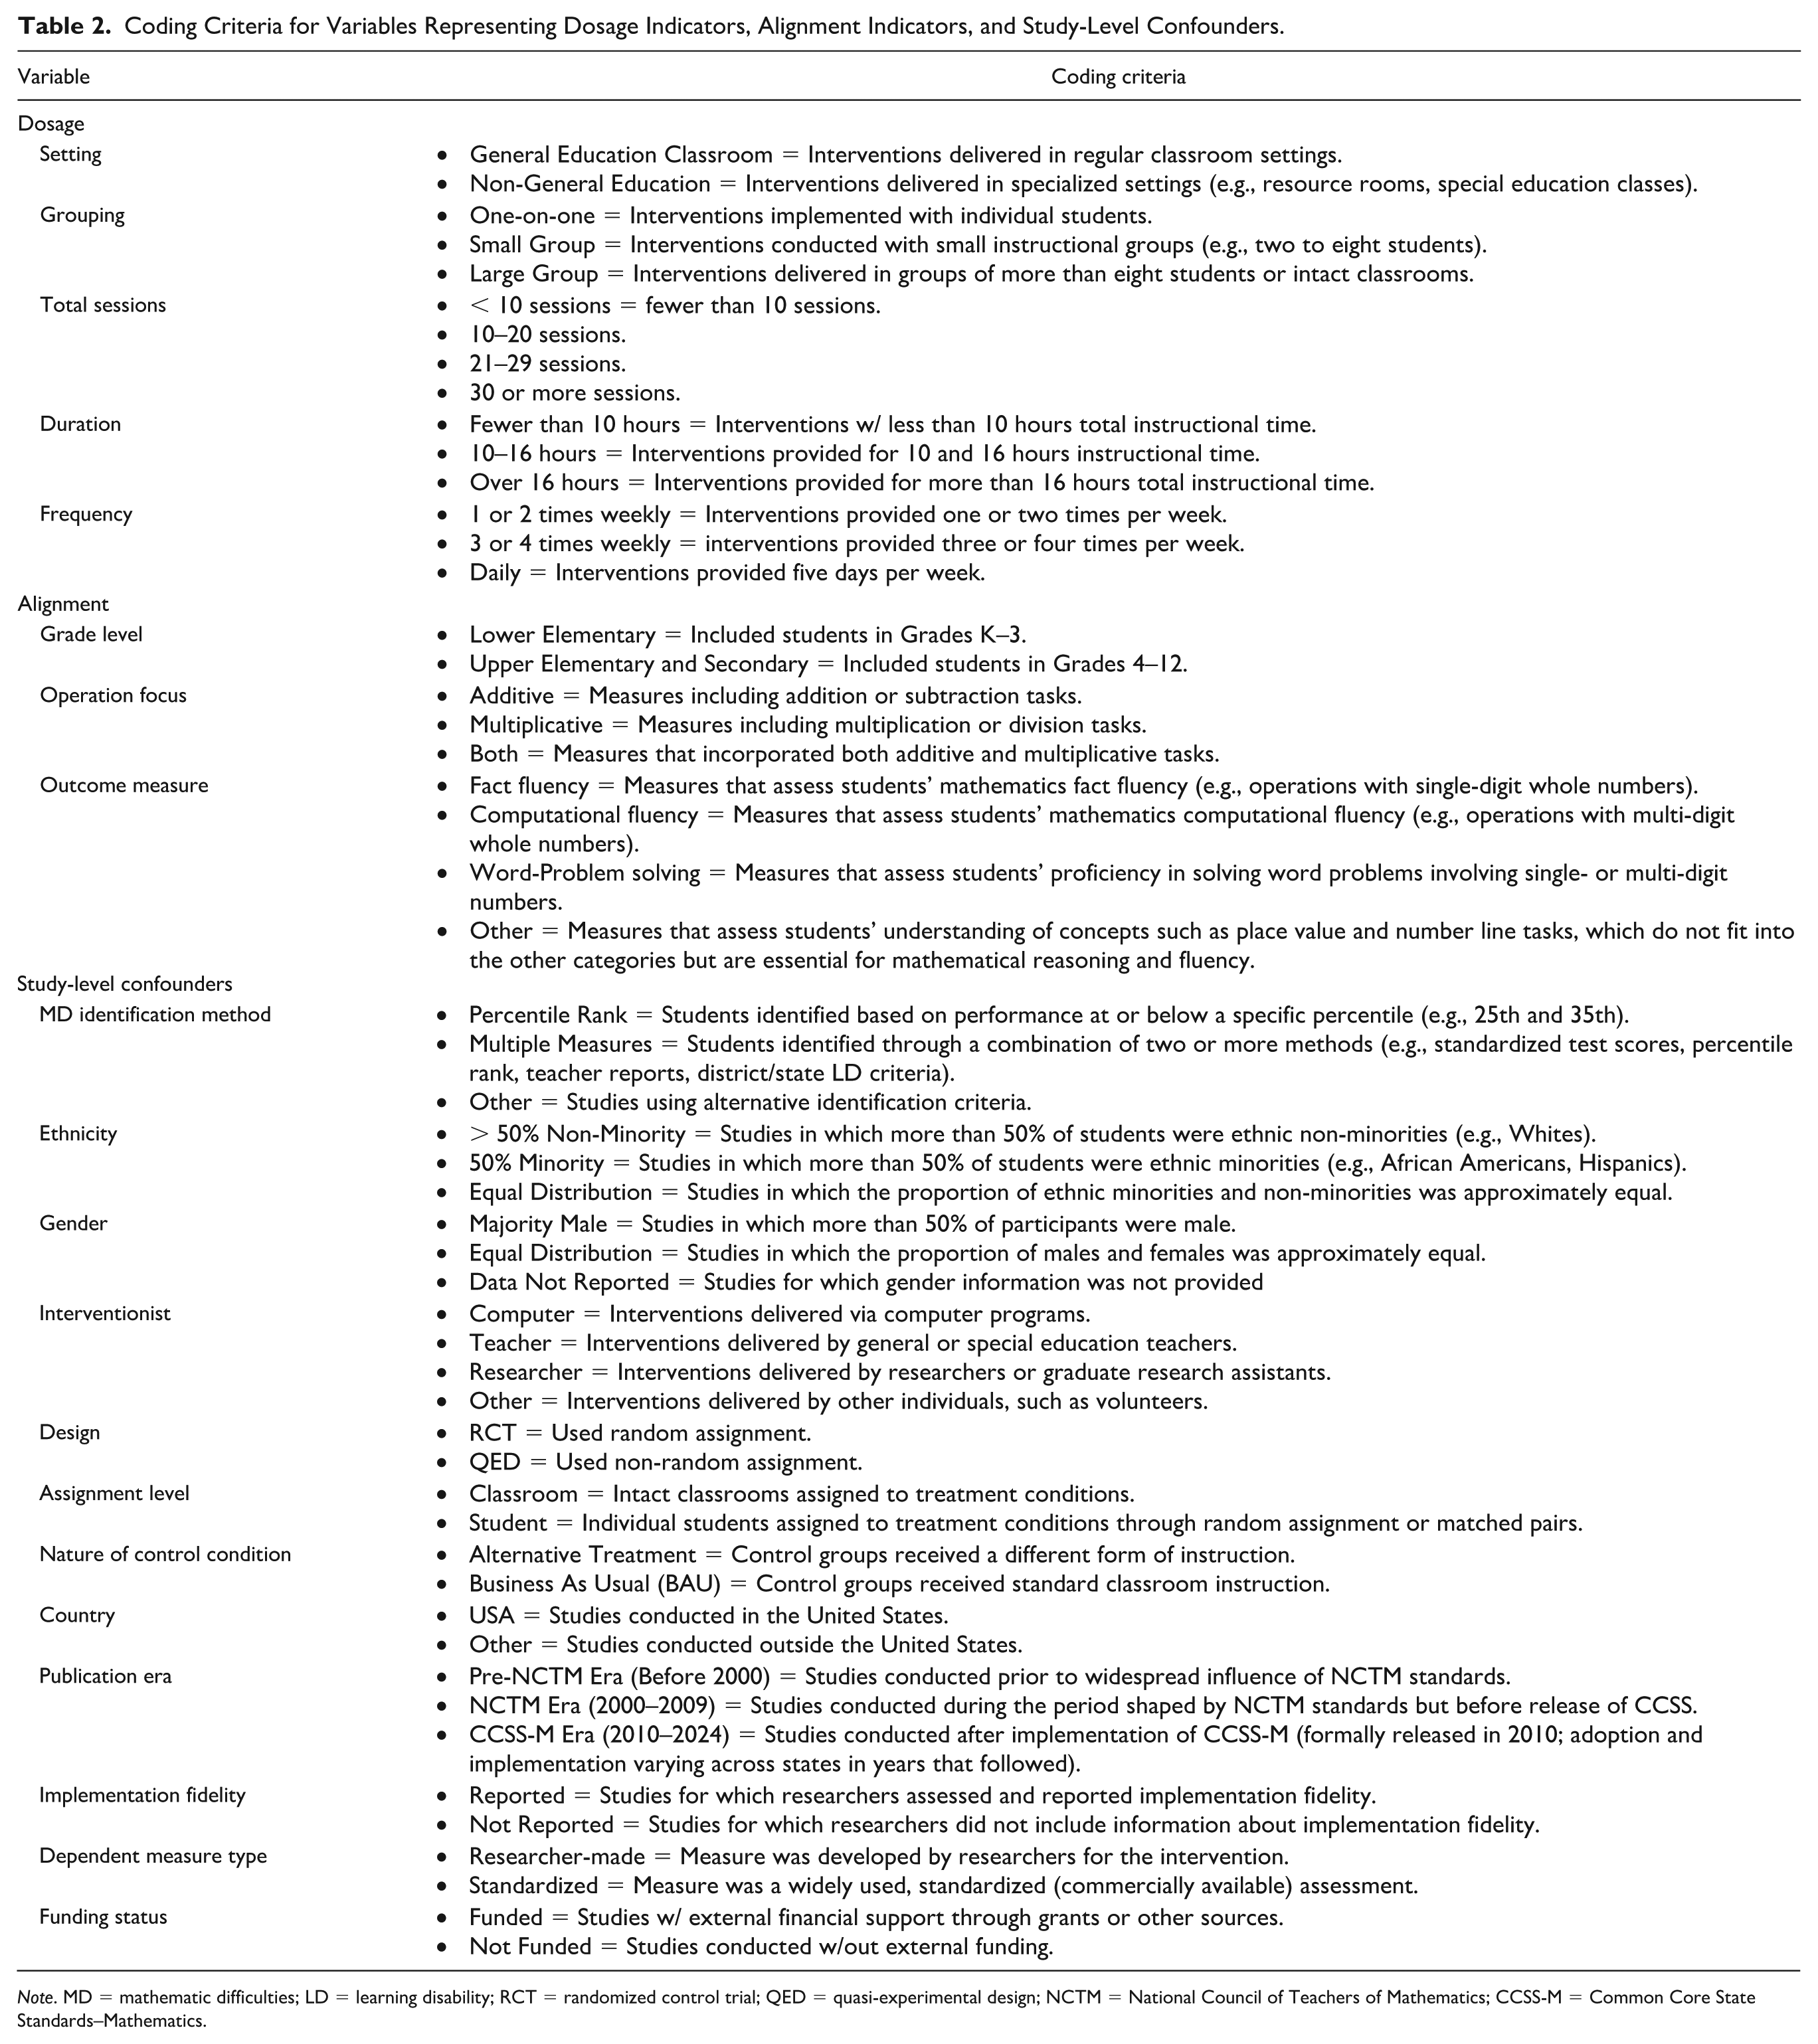
Note. MD = mathematic difficulties; LD = learning disability; RCT = randomized control trial; QED = quasi-experimental design; NCTM = National Council of Teachers of Mathematics; CCSS-M = Common Core State Standards–Mathematics.
After training, the two coders independently extracted study identification information (authors, title, year of publication) as well as dosage indicators (setting, grouping, number of intervention sessions, frequency, and duration) and alignment indicators (operation focus, outcome measure focus, and grade level). In addition, they coded 12 potential study-level confounders representing participant characteristics (e.g., gender and ethnic distribution) and study design features (e.g., assignment level, country, and interventionist). Across the 20 variables coded for each of the 35 studies (700 total ratings), IRR was 93.8% (657/700) and 100% agreement after discussion.
Phase 3: ES Data Extraction
In the third phase, the same two trained coders extracted data necessary for calculating ESs for each eligible outcome. Using Excel spreadsheets, they recorded information such as the name of the dependent measure, the treatment comparison, and the nature of the dependent measure. Pre- and post-test statistics for treatment and control groups were extracted, including the number of participants, mean scores, and standard deviations. When these data were unavailable, the coders recorded other statistical information that could be used to calculate ESs (e.g., t-tests, F-tests, and unstandardized beta coefficients). We note that all studies reported means, standard deviations, and sample sizes at pre- and post-test, with the exception of one study (Kanive et al., 2014), which provided pre–post gain scores. This exception resulted in three fewer coded fields, yielding 1,065 total ratings. Across these coded fields for the 178 effects, we calculated IRR as 98.2% (1,046/1,065), with 19 discrepancies resolved through discussion to arrive at 100% agreement.
Meta-Analytic Procedures
In this section, we describe the meta-analytic procedures, including calculating ESs and their variances, estimating mean effects and heterogeneity, and testing moderators. We also outline the steps taken to evaluate potential publication bias.
ES Calculations
We used Hedges’ g as the primary ES metric, representing the bias-corrected standardized mean difference (SMD) between treatment and control groups. The ESs were first calculated as Cohen’s d and then transformed to Hedges’ g using a small-sample correction to account for bias (Pigott, 2012). ESs were computed as the difference in pre–post change scores between treatment and control groups, divided by the pooled standard deviation (Morris, 2008). For one study that reported only gain scores (Kanive et al., 2014), we used those directly. We used the escalc() function from the metafor R package (Viechtbauer, 2010) to calculate g and its variance.
To aid interpretation of our results, we drew on empirical benchmarks established for educational interventions. Hill et al. (2008) provide context for interpreting ESs in educational research, noting that effects of 0.25 and above represent educationally meaningful impacts in academic interventions. We also reference Cohen’s (1988) conventional benchmarks, where effects of 0.20, 0.50, and 0.80 are considered small, medium, and large, respectively. For educational intervention research specifically, effects in the 0.25 to 0.40 range are often considered practically significant (Hill et al., 2008). Because our meta-analysis focuses on math fact fluency, a specific, trainable skill that can show rapid improvement with targeted practice, time-based learning interpretations may not be appropriate or meaningful for this domain. Therefore, we interpret ESs based on these established statistical and educational frameworks rather than attempting to translate effects into time-based equivalents.
Meta-Analysis Technique
We used robust variance estimation (RVE) with a small-sample adjustment (Fisher et al., 2023) to estimate overall mean ESs and examine moderators while accounting for dependent ESs nested within studies. This approach mitigates inflated Type I error rates that can arise when studies contribute multiple outcomes (Hedges et al., 2010). The RVE also provides valid inference without requiring normally distributed estimates (Fisher et al., 2023). To assess robustness, we varied the assumed correlation between ESs (ρ) from 0.80 to 0.20, with no meaningful impact on the results. We report degrees of freedom (df) for all estimates, treating results with df ≥ 4 as reliable and interpreting those with df below this threshold with caution due to limited power (Vembye et al., 2023).
Mean ES Calculation and Heterogeneity Evaluation
We used an intercept-only model (without predictors) to estimate the mean ES, addressing RQ1. To assess heterogeneity, we calculated a 95% prediction interval, computed as the mean ES ± t * √(τ2 + SE2; Borenstein, 2023), which provides the range in which future effects are likely to fall. Consistent with recent methodological recommendations (Borenstein, 2023), we emphasize prediction intervals over traditional heterogeneity statistics (e.g., τ2), as they offer a more practical and policy-relevant interpretation of variability across contexts.
Moderator Analysis
To address RQ2, examining how dosage indicators, alignment indicators, and study-level confounders contribute to heterogeneity in effects, we incorporated these variables into a single meta-regression model using RVE. We used this forced entry approach to reduce the risk of inflated Type I error rates, which are more likely to arise in traditional methods, such as multiple single-variable meta-regressions and subgroup analyses, compared to approaches that model all moderators jointly (Pigott & Polanin, 2020; Tanner-Smith et al., 2016; Tipton et al., 2023). By including all predictors simultaneously, we estimated the effect of each moderator while controlling for the influence of the others. Because all predictors were categorical, we assigned each a reference group, with the estimated β coefficients representing differences between the reference group and other levels of the moderator, controlling for all other variables.
We conducted subgroup analyses to complement the meta-regression findings by partitioning the data according to dosage and alignment indicator levels, thereby estimating the mean effects for each category. We used intercept-only models to obtain the mean effect specific to each dosage and alignment moderator, allowing for a more direct interpretation of their impact. This approach clarifies how variations in dosage and alignment indicators influence intervention outcomes. However, examining each moderator independently introduces statistical multiplicity, which increases the risk of a Type I error when conducting multiple tests (Li et al., 2017). Therefore, these estimates should be interpreted as supplementary and exploratory in nature. We performed all analyses using R version 4.4.0 (R Core Team, 2024) with the robumeta package (Fisher et al., 2023).
Publication Bias
We assessed publication bias using a modified Egger’s test (Rodgers & Pustejovsky, 2021), the Trim-and-Fill Method (Duval & Tweedie, 2000), and PET-PEESE (Stanley, 2017). Publication bias occurs when studies with significant results are more likely to be published, potentially skewing the evidence base (Pigott & Polanin, 2020). The modified Egger’s test, incorporating RVE, showed no significant asymmetry (alt = 1.05, p > .05), indicating no evidence of publication bias. The Trim-and-Fill Method revealed no imputed studies, further supporting the absence of publication bias. The PET-PEESE method showed some evidence of potential bias, identifying a significant positive relationship between ES and standard error (SE = 5.58, p < .05), suggesting small-study effects. However, this result diverged from other methods, such as the modified Egger’s test and the Trim-and-Fill Method, which identified no evidence of publication bias. In addition, PET-PEESE may be unreliable due to its susceptibility to data heterogeneity (Stanley, 2017). Based on the overall consistency of findings across multiple methods and our inclusion of gray literature, we concluded that publication bias was unlikely to have occurred in our study.
Data Screening and Preparation
Before performing our analyses, we screened the data for outliers and missingness. Statistical tests confirmed the presence of extreme values, particularly at the upper end of the distribution (range = 6.24; min = −0.81; max = 5.43). Skewness was 2.32, and kurtosis was 6.98, exceeding the commonly recommended threshold of ±2 (H. Y. Kim, 2013). However, given that mathematics fluency measures often exhibit high variability due to differences in skill acquisition, large effects are expected, especially among students with MD (Kleinert et al., 2018). Other methods for addressing outliers, specifically winsorizing, were not appropriate, as setting the upper limit at g = 1.66 would have excluded educationally meaningful ESs (e.g., g = 1.75), which are considered typical in intervention studies involving students with MD (Hill et al., 2008). Therefore, we retained all effects in the final dataset. There were no missing data.
Results
We included 35 studies published between 1990 and 2023, representing a comprehensive set of fact fluency interventions spanning three decades. Of these, 19 studies targeted upper elementary to secondary school (Grades 4 to 8), while the remaining 16 examined younger students in lower elementary grades (Grades K to 3). The sample sizes varied substantially: treatment groups ranged from 8 to 416 participants, control groups ranged from 7 to 259 participants, and the total sample sizes ranged from 15 to 675. Table 3 summarizes key study characteristics, organized by the primary moderators of interest: dosage and alignment indicators. Descriptive information for additional study-level variables used as statistical controls to reduce potential confounding has been moved to Supplemental Table S3 to improve readability and maintain analytic transparency. The complete reference list for included studies is also provided in the Supplemental Materials.
Descriptive Summary of the 35 Studies Included in Analysis of Dosage and Alignment Indicators.
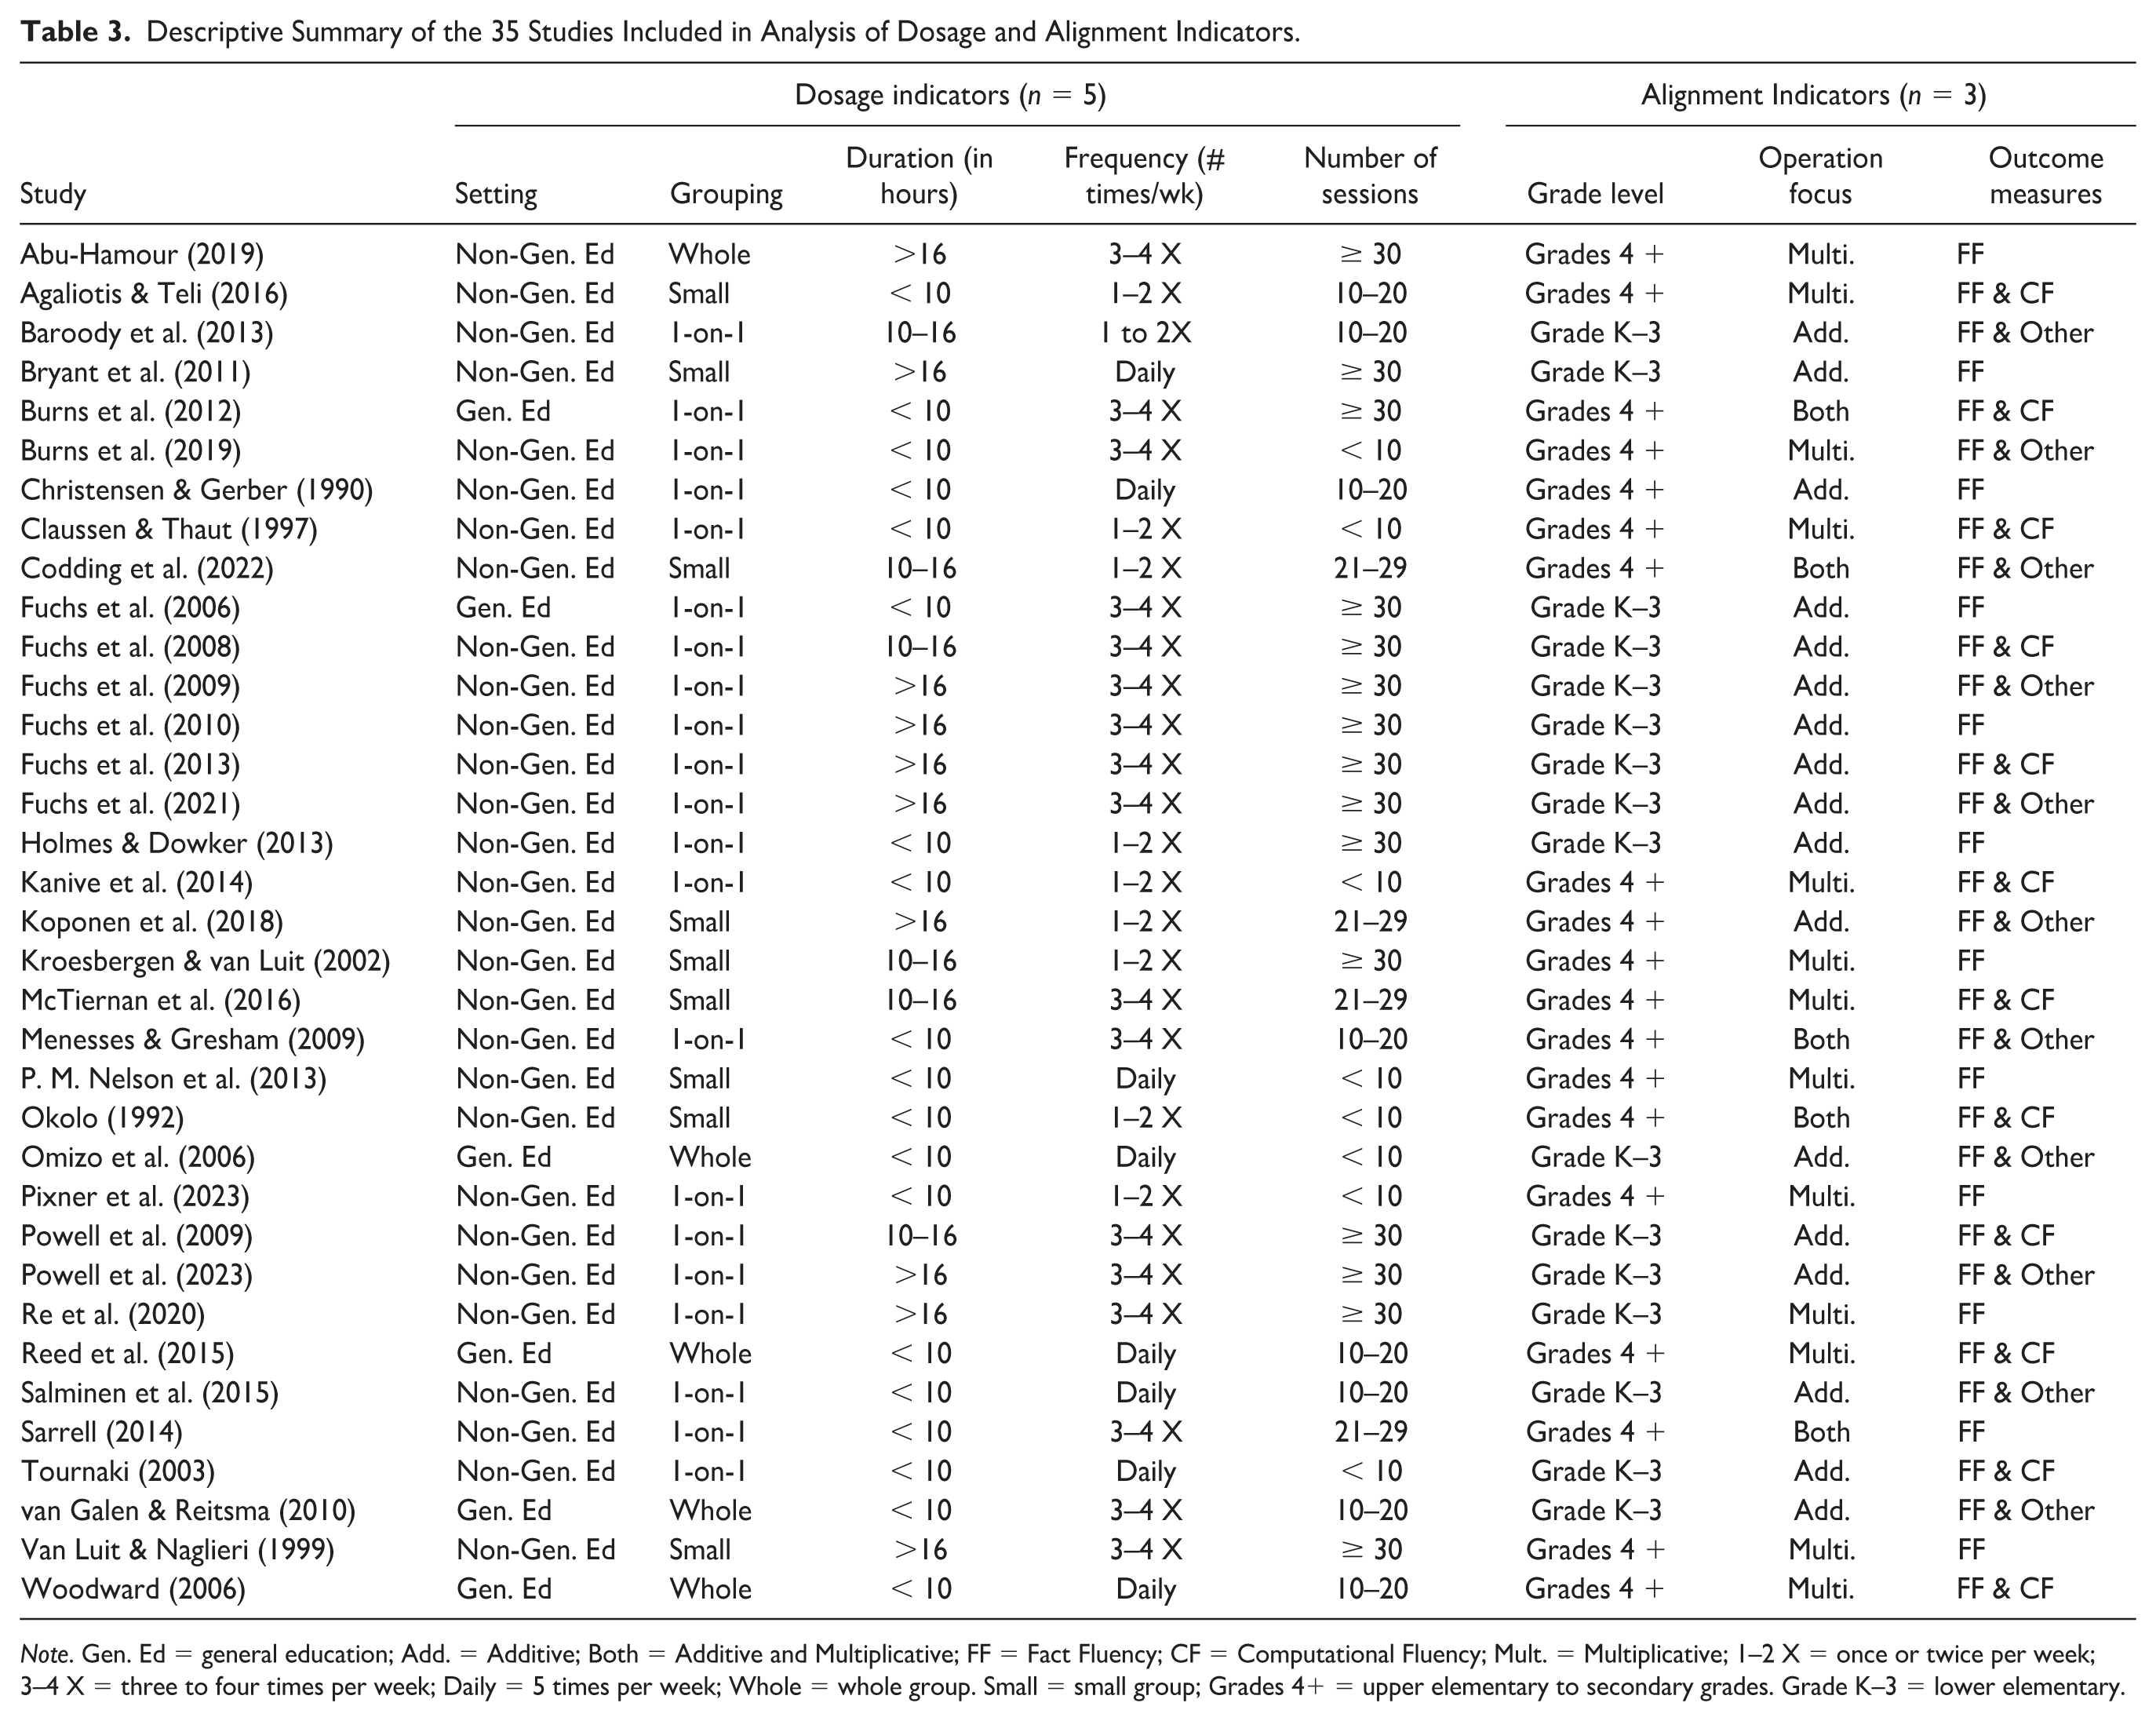
Note. Gen. Ed = general education; Add. = Additive; Both = Additive and Multiplicative; FF = Fact Fluency; CF = Computational Fluency; Mult. = Multiplicative; 1–2 X = once or twice per week; 3–4 X = three to four times per week; Daily = 5 times per week; Whole = whole group. Small = small group; Grades 4+ = upper elementary to secondary grades. Grade K–3 = lower elementary.
Study Quality Summary
Table 4 presents the results of the quality appraisal across the 35 included studies, based on the 24 quality standards (QI) outlined by the CEC (Cook et al., 2015). Overall, the studies demonstrated strong methodological rigor, with all meeting core indicators related to the definition of disability or risk status (QI-3), specification of intervention procedures (QI-6), appropriate statistical analyses (QI-23), and reporting of ESs (QI-24). Indicators related to study design, such as group assignment procedures (QI-14) and descriptions of the comparison group (QI-12), were also consistently met. Although participant demographic characteristics (QI-2) were reported in all studies, the level of detail varied considerably. While gender was consistently documented, 16 studies did not provide information on race or ethnicity. This incomplete reporting limits the extent to which findings can be generalized to diverse populations and constrains the ability to examine demographic moderators of intervention effects, a crucial consideration given the known sources of heterogeneity in educational outcomes (Cheema & Galluzzo, 2013).
Adherence to Council for Exceptional Children Group Design Quality Indicators Across the 35 Included Studies.
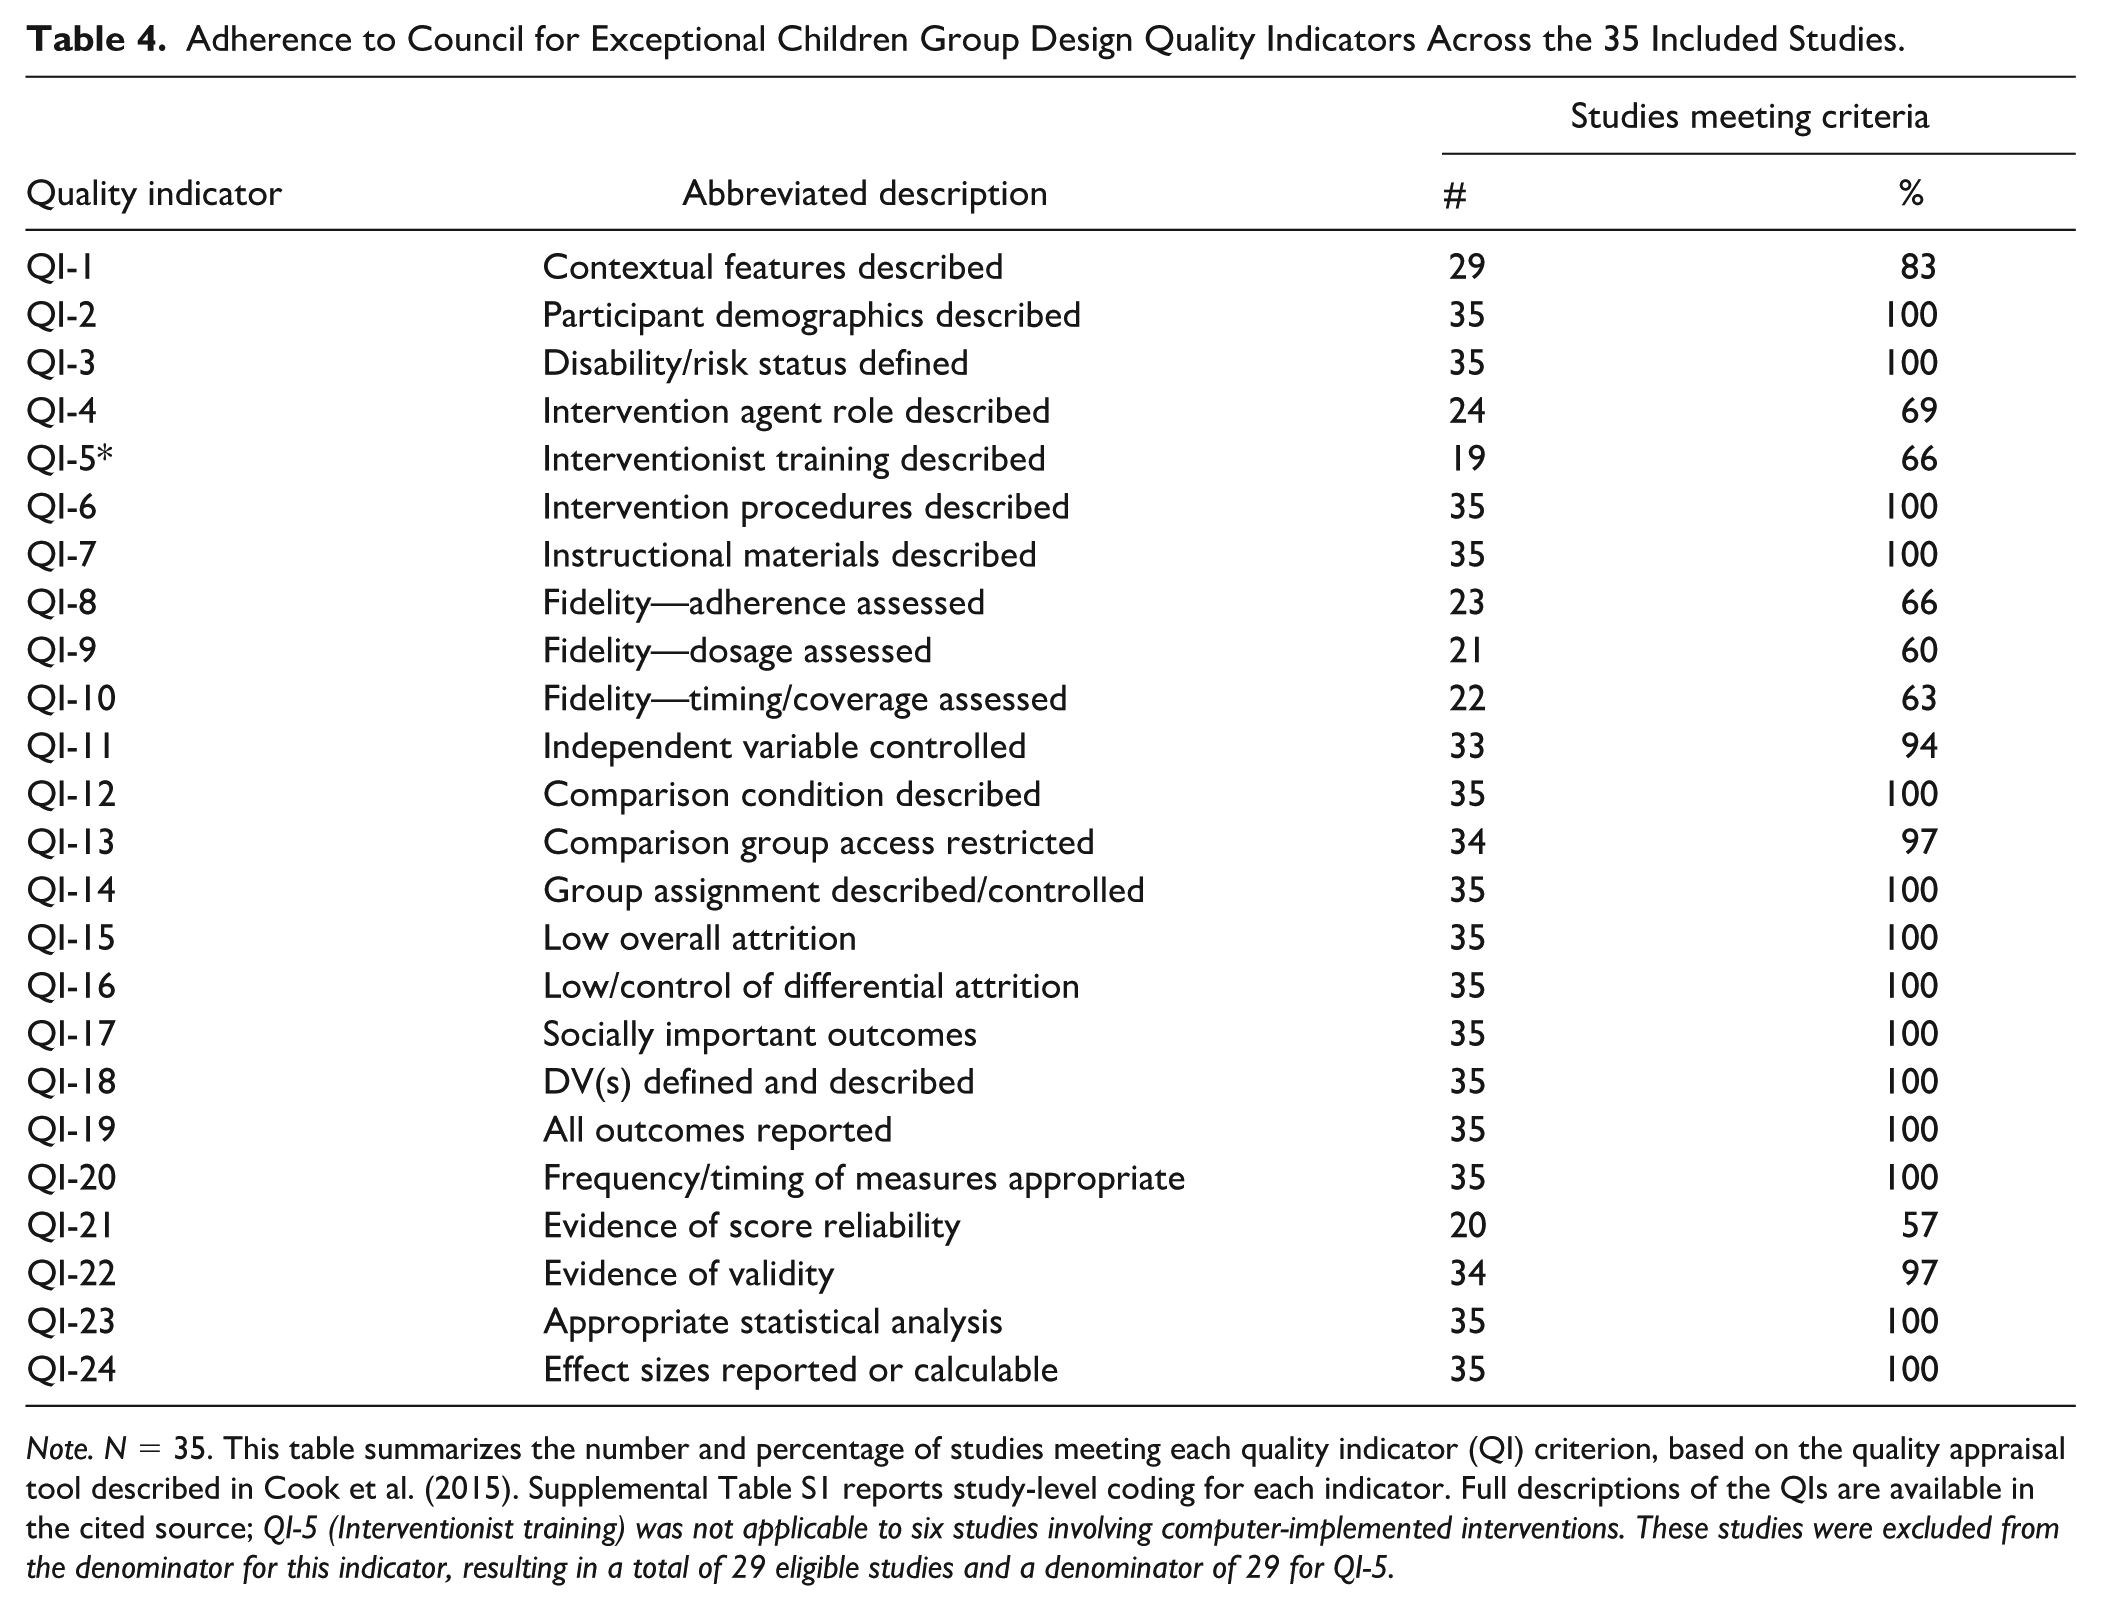
Note. N = 35. This table summarizes the number and percentage of studies meeting each quality indicator (QI) criterion, based on the quality appraisal tool described in Cook et al. (2015). Supplemental Table S1 reports study-level coding for each indicator. Full descriptions of the QIs are available in the cited source; QI-5 (Interventionist training) was not applicable to six studies involving computer-implemented interventions. These studies were excluded from the denominator for this indicator, resulting in a total of 29 eligible studies and a denominator of 29 for QI-5.
Indicators related to implementation fidelity were met less frequently. Fidelity of dosage (QI-9) and timing or coverage (QI-10) were reported in only 60% and 63% of studies, respectively, while adherence-related fidelity data (QI-8) appeared in just 66%. In addition, only 57% of studies provided evidence of score reliability (QI-21), highlighting persistent gaps in measurement rigor. Detailed, study-level quality scores are presented in Supplemental Table S1, which offers a comprehensive breakdown of each study’s adherence to QIs. Despite these limitations, the overall high quality of the included studies supports the validity of the meta-analytic findings.
Overall Mean Effect of Fact Fluency Interventions
The intercept-only model using RVE indicated a positive and significant average treatment effect (g = 0.76, 95% CI = [0.46, 1.06], p < .001) across 35 studies contributing 178 ESs. However, heterogeneity was substantial. The 95% prediction interval was wide (PI = −0.60 to 2.12), indicating that the true effect of a new, similar study could plausibly range from moderately negative to highly positive (Borenstein, 2023). This considerable spread suggests that intervention outcomes are meaningfully influenced by malleable factors, such as dosage and implementation alignment, as well as study-level characteristics (e.g., student demographics, research design). These findings underscore the critical importance of investigating these potential moderators via meta-regression analysis.
Meta-Regression Analysis
Tables 5 and 6 present complementary perspectives on the moderator analyses. Table 5 provides descriptive mean ESs for each level of the malleable factors, with significant indicators highlighted for clarity. These estimates are exploratory and should be interpreted cautiously, as they do not account for overlap among moderators and carry an increased risk of Type I error from multiple comparisons. Table 6 reports the results of the meta-regression model, which simultaneously tested malleable intervention factors (i.e., dosage and alignment indicators) alongside study-level confounders. In this model, two dosage indicators (grouping and total sessions) and two alignment indicators (operation focus and outcome measure) emerged as significant moderators. However, their effects were potentially confounded by three study-level variables (MD identification method, ethnicity, and publication era), suggesting that contextual features may have influenced the observed relationships. For the full set of results, including all moderators (both malleable and study-level confounders), see the Supplemental Materials (see Tables S2A and S2B).
Descriptive Statistics: Mean Effect of Categories Within Each Dosage and Alignment Indicator.
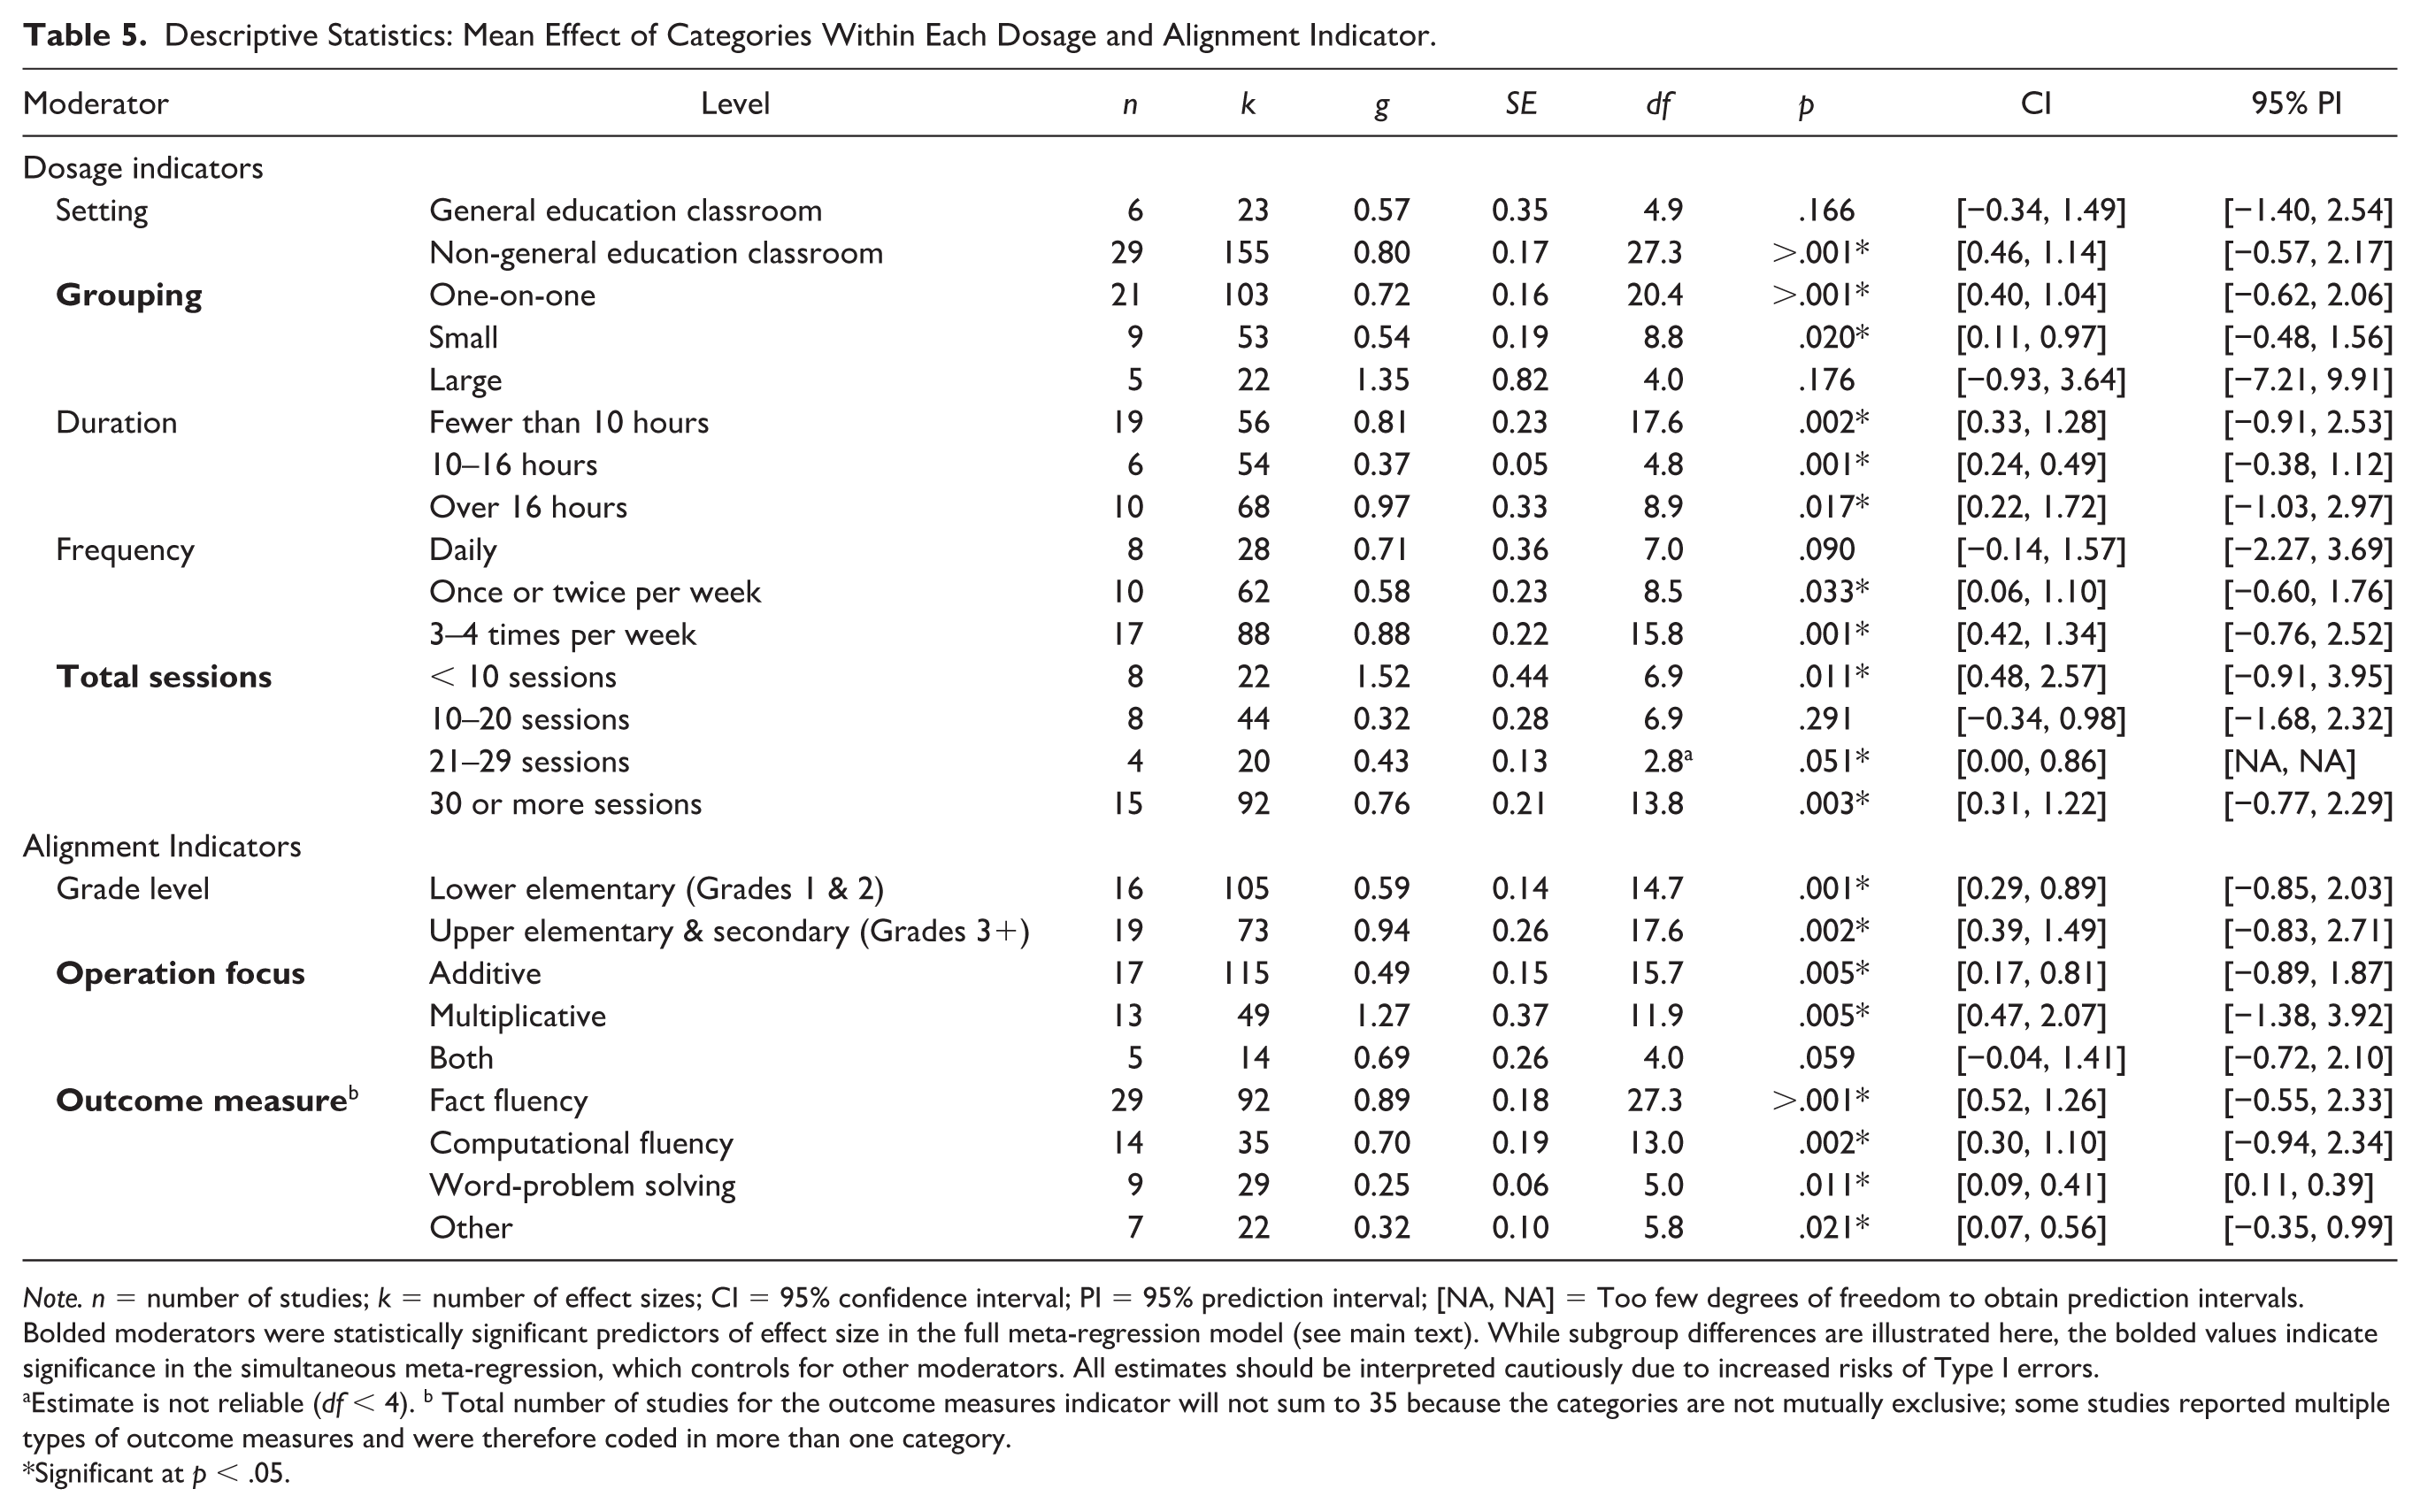
Note. n = number of studies; k = number of effect sizes; CI = 95% confidence interval; PI = 95% prediction interval; [NA, NA] = Too few degrees of freedom to obtain prediction intervals. Bolded moderators were statistically significant predictors of effect size in the full meta-regression model (see main text). While subgroup differences are illustrated here, the bolded values indicate significance in the simultaneous meta-regression, which controls for other moderators. All estimates should be interpreted cautiously due to increased risks of Type I errors.
Estimate is not reliable (df < 4). b Total number of studies for the outcome measures indicator will not sum to 35 because the categories are not mutually exclusive; some studies reported multiple types of outcome measures and were therefore coded in more than one category.
Significant at p < .05.
Meta-Regression Results: Dosage and Alignment Indicators Only.
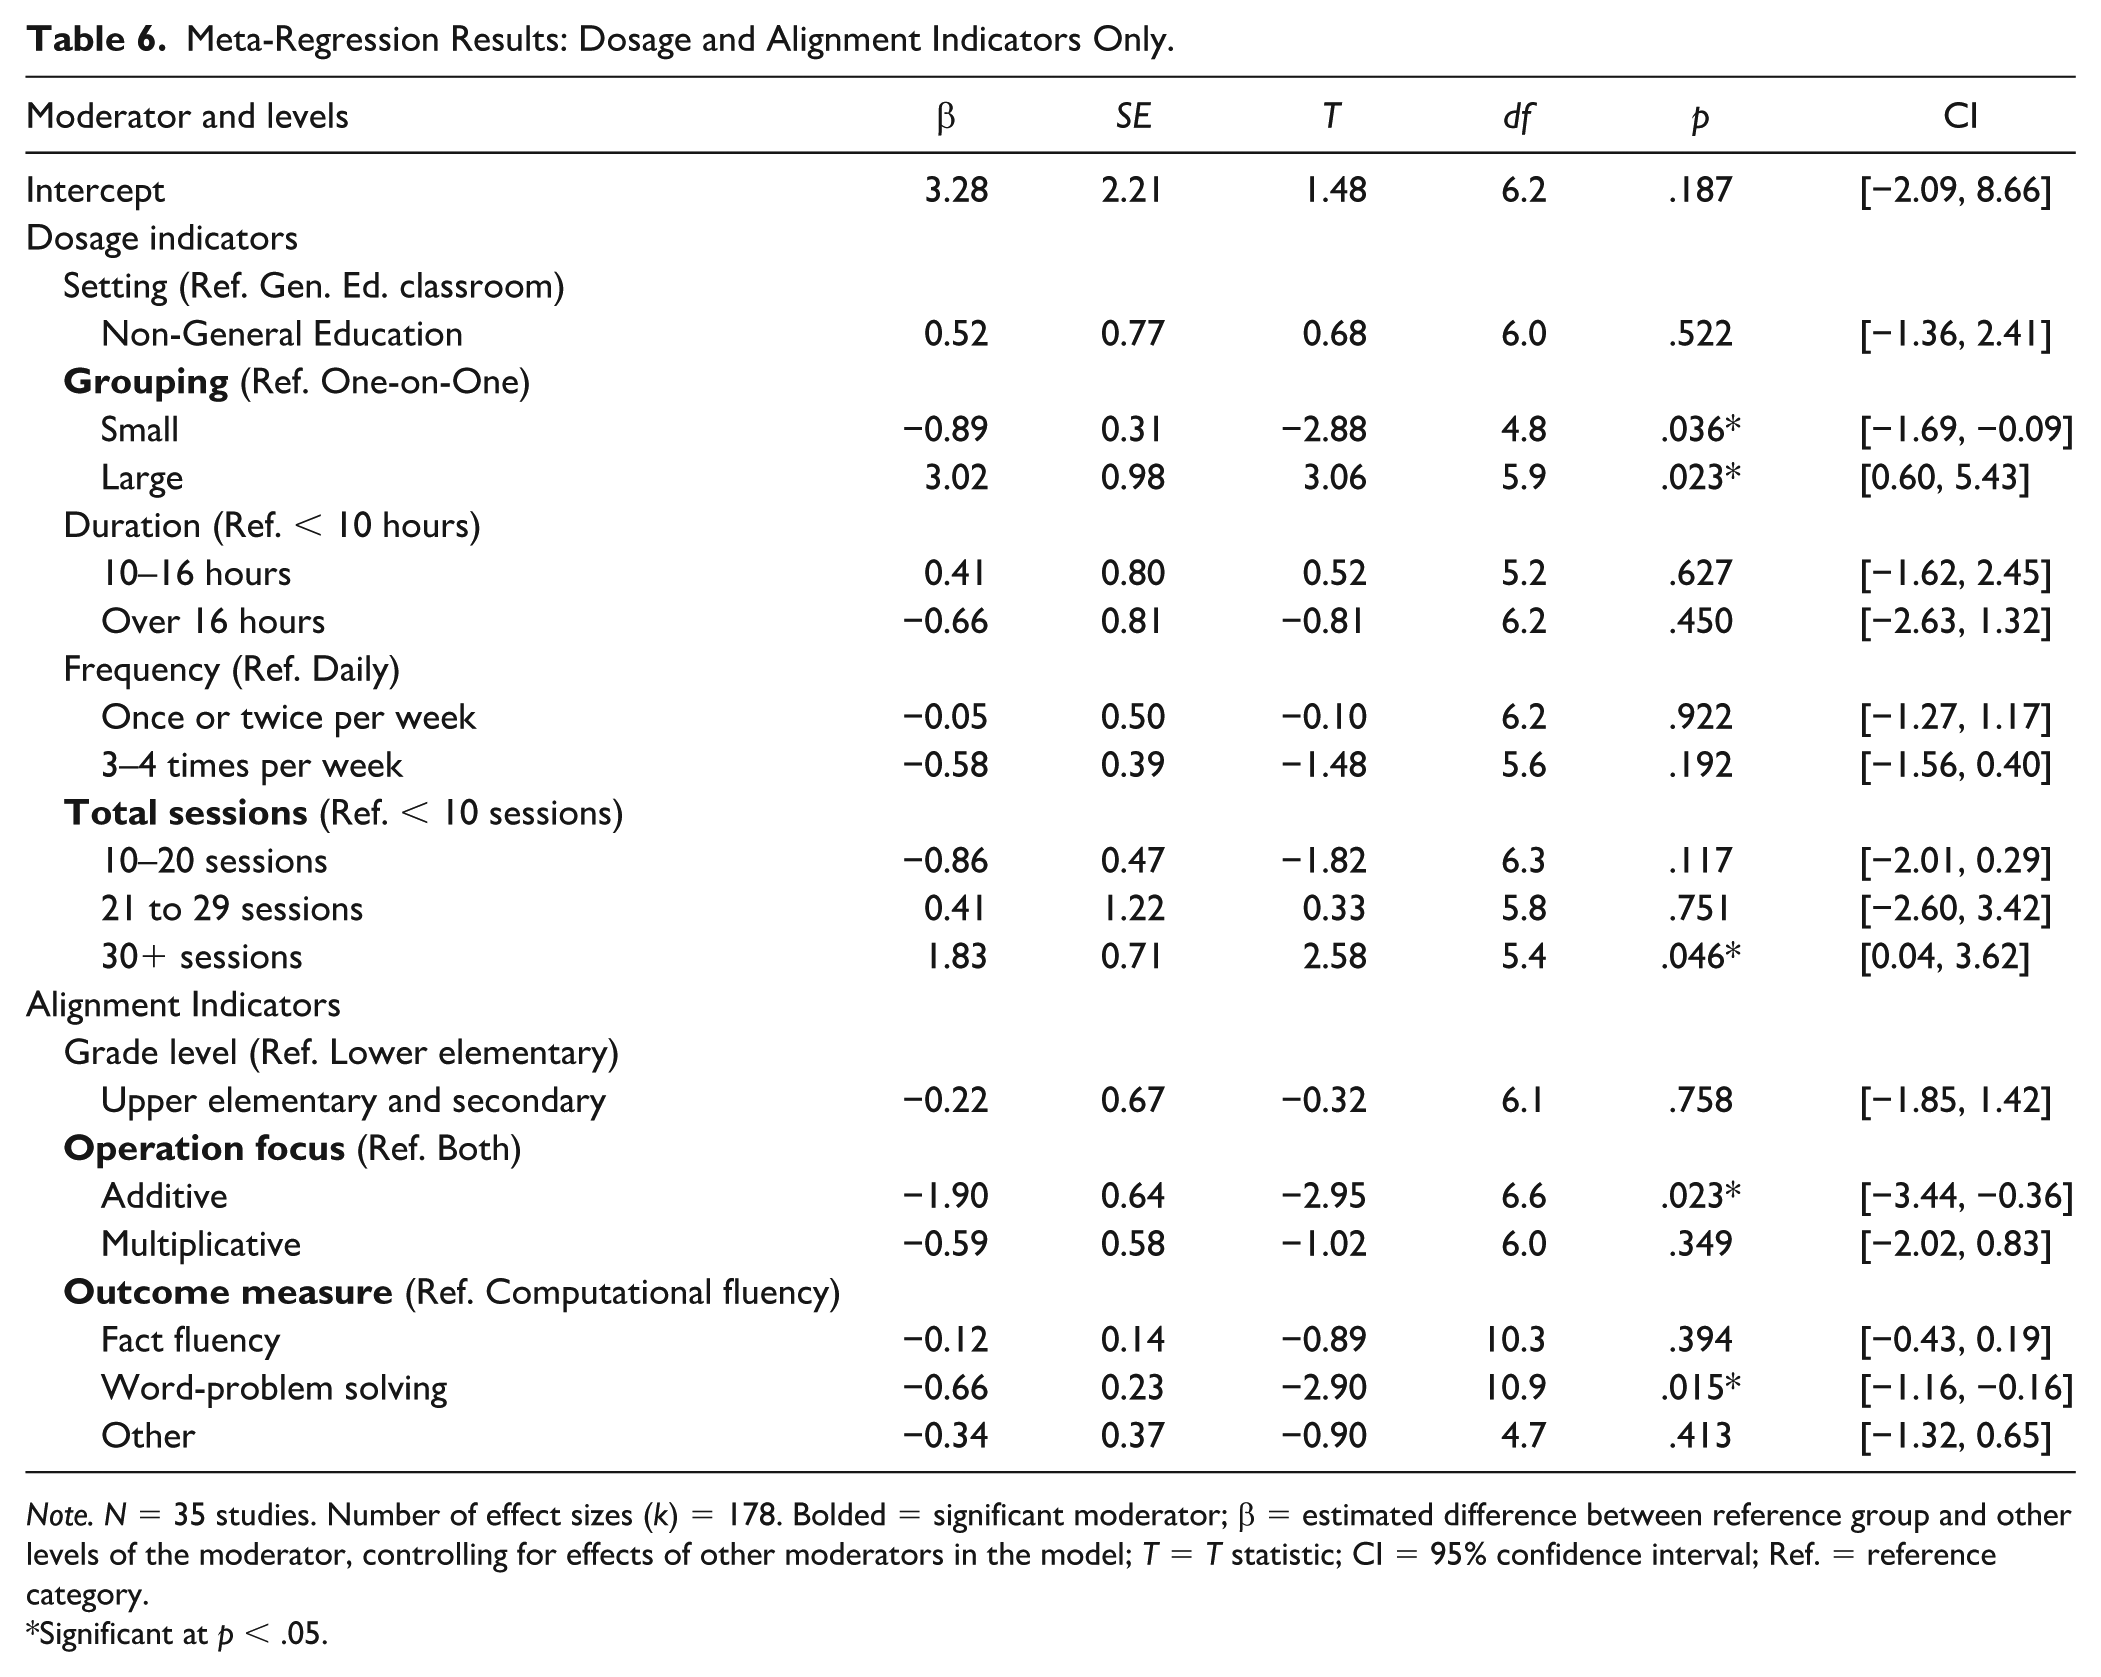
Note. N = 35 studies. Number of effect sizes (k) = 178. Bolded = significant moderator; β = estimated difference between reference group and other levels of the moderator, controlling for effects of other moderators in the model; T = T statistic; CI = 95% confidence interval; Ref. = reference category.
Significant at p < .05.
Intervention Dosage
Two of the five dosage indicators (grouping and total sessions) were significantly associated with the effects, while the remaining variables (frequency, setting, and duration) were not. For grouping, we classified studies based on the size of the instructional groups used in the intervention: one-on-one, small-group, and large-group. Results revealed that interventions delivered in small groups were associated with lower ESs (β = −0.89, p = .036) compared to one-on-one instruction, the reference group. In addition, interventions delivered to large groups were associated with larger ESs than one-on-one instruction (β = 3.02; p = .023).
For total sessions, we compared the number of intervention sessions across four categories: fewer than 10 sessions, 10–20 sessions, 21–29 sessions, and 30 or more sessions. Results indicated that interventions with 30 or more sessions produced higher effects than those with fewer than 10 sessions (β = 1.83, p = .046), the reference category. Estimates for the other comparisons (10–20 sessions and 21–29 sessions) were not significant.
Intervention Alignment
Two alignment indicators, representing alignment with the curriculum (operation focus and outcome measure), influenced intervention effects. However, the student alignment indicator examined (grade level) was not a significant moderator. For operation focus, we grouped studies based on whether interventions targeted addition/subtraction (additive), multiplication/division (multiplicative), or both. Estimates revealed that the only significant difference in effect was for interventions targeting addition and subtraction (β = −1.90, p = .023), which were associated with smaller ESs compared to interventions addressing both additive and multiplicative operations, the reference category. To examine the impact of outcome measures, we grouped studies into four categories: fact fluency, computational fluency, word-problem solving (assessing multi- or single-digit operations embedded in word problems), and “other” (targeting additional skills such as number sense and numeracy). Results indicated that interventions measuring word-problem solving produced significantly smaller effects than those measuring computational fluency, the reference category (β = −0.66, p = .015). None of the remaining comparisons were significant.
Discussion
Students’ fact fluency forms a foundation for success in more advanced mathematics, including algebra and fractions (Powell et al., 2025; Witzel, 2016). However, many students with MD find it challenging to develop fluency and need focused, intensive instruction (Burns et al., 2010; Codding et al., 2011). To strengthen instructional decision-making, it is essential to identify which fact fluency interventions are most effective for students with MD and to determine the instructional conditions, such as grouping, frequency, and alignment with students’ grade level and operation focus, that influence their success. This meta-analysis is the first to focus exclusively on group-design studies aimed at improving fact fluency among students with MD. We applied a rigorous methodological framework and statistical controls for 12 study-level confounders to investigate the moderating effects of five dosage and three alignment indicators. This design enabled us to identify conditions associated with stronger intervention effects and to provide evidence that supports more tailored and practical instruction for students with MD.
RQ1: Mean Effect Across Interventions
Our findings indicate that mathematics fact fluency interventions yield substantial and significant benefits for students with MD (g = 0.76). According to Lipsey et al. (2012), this estimate suggests that approximately 78% of students in the treatment group would score above the mean of students in the comparison group (as distinct from other ES interpretations such as distributional overlap), providing compelling evidence of educational impact. Our estimate exceeds conventional benchmarks for educational interventions (Hill et al., 2008) and represents a large effect according to Cohen’s (1988) standards. This magnitude of effect is particularly meaningful for students with MD, who often struggle with persistent difficulties in mathematics despite receiving typical classroom instruction. These findings underscore the practical value of targeted fluency-focused interventions for this population, demonstrating that focused intervention can produce substantial improvements in foundational mathematical skills that are critical for broader mathematical competence. Although our analysis focuses specifically on fact fluency, the average effect aligns with findings from broader mathematics intervention research. For example, Myers et al. (2022) reported an ES of g = 1.01 (g = 0.81 after outlier removal) for word-problem interventions among students with MD, and Stevens et al. (2018) reported comparable impacts across other mathematics domains. These parallels reinforce the robustness and generalizability of our findings. While substantial heterogeneity remains, the overall findings provide robust evidence of the benefits of fluency interventions, supported by the strong methodological quality of the included studies and the appropriate modeling of dependent effects.
The wide prediction interval (−0.60 to 2.12) indicates substantial variation in effects across studies. This variability likely reflects differences in malleable instructional features, such as group size, frequency, and other dosage and alignment indicators, as well as broader contextual factors. To account for these sources of variability and reduce potential bias, we examined all 20 moderators in our meta-regression model, encompassing dosage indicators, alignment indicators, and study-level confounders. Although study-level confounders were not the central focus of our analysis, one notable finding was that publication era emerged as a significant moderator. Studies conducted prior to the release of the NCTM Standards yielded larger ESs than those from the NCTM era (2000–2009) or the CCSS-M era (2010–2024). However, this difference was significant only when comparing the pre-NCTM era to the CCSS-M era (see Supplemental Tables S2A and S2B). It is important to note that the number of pre-NCTM studies was small (n = 4) relative to the NCTM (n = 22) and CCSS-M (n = 9) eras, which limits the confidence in this finding. Nonetheless, the observed pattern is consistent with major shifts in mathematics education: the NCTM Standards (2000) emphasized conceptual understanding, reasoning, and problem-solving over rote fluency (Schoenfeld, 2004), a shift that often led to reduced time for systematic fluency practice. Later reforms, including the Common Core State Standards, reinstated fluency as a foundational goal but embedded it within broader reasoning objectives. Therefore, accounting for publication era in math intervention research may be necessary to disentangle intervention effects from historical changes in curricular emphasis (Lein et al., 2020; Myers et al., 2022). More research is needed to clarify how such large-scale policy shifts have shaped both opportunities for fluency instruction and the effectiveness of interventions over time.
RQ2: Moderating Effect of Dosage and Alignment Indicators
To investigate sources of variation in intervention effects, we conducted a meta-regression focused on malleable instructional features, specifically, dosage and alignment indicators. We also included a comprehensive set of study-level covariates identified in prior research as potential confounders, which helped isolate the effects of the focal moderators and reduce bias due to omitted variables (Tipton et al., 2023). Our analysis revealed that grouping and number of sessions significantly moderated intervention effects among the dosage indicators, while operation focus and outcome measure were significant among the alignment indicators. In addition, three study-level covariates (MD identification method, student ethnicity, and publication era) were associated with variations in ESs. These findings suggest that both modifiable instructional features and broader study characteristics influence the efficacy of fact fluency interventions, with implications for research and practice.
Intervention Dosage
We assessed how intervention effects varied across five indicators related to dosage (Myers et al., 2024), including setting, grouping, duration, frequency, and total sessions. Our analysis revealed significant moderating effects for two: grouping and total sessions.
Grouping
Our analysis identified the grouping format as a significant moderator of intervention effects. Interventions delivered in large-group formats yielded larger effects than those delivered in one-on-one and small-group formats, with the latter producing the smallest effects. This pattern is consistent with findings from Myers et al. (2022), who reported similarly higher effects for large-group formats in a meta-analysis of word-problem interventions, and with work by Barrett and VanderHeyden (2020), which demonstrates the effectiveness and cost efficiency of classwide math interventions. Although counterintuitive given the emphasis on individualized instruction for students with MD, these findings suggest that group size may interact with other features (e.g., peer dynamics, instructional structure) in ways that warrant further investigation. However, because only five studies in our sample used large-group formats, these results should be interpreted cautiously and replicated in future research.
Total Sessions
Among the three dosage indicators we examined, only the total number of intervention sessions significantly moderated ESs, although these findings require nuanced interpretation given the complexity revealed in our data. When controlling for other moderators in our meta-regression analysis, interventions implemented for 30 or more sessions produced significantly larger effects than those with fewer than 10 sessions (β = 1.83, p = .046). However, our descriptive statistics revealed a seemingly contradictory pattern, with interventions of fewer than 10 sessions showing the highest raw ES (g = 1.52). This apparent contradiction underscores important complexities in dosage research that align with findings from Codding et al. (2016), who directly examined intervention frequency while holding total dosage constant. Their study found that four-times-weekly sessions (resulting in fewer total sessions) outperformed less frequent but longer interventions, particularly for basic computation skills, supporting the use of distributed over massed practice for simple mathematical tasks.
These patterns suggest that the relationship between session count and effectiveness is not straightforward. Short-duration interventions may appear highly effective because students reached mastery criteria and the intervention was appropriately discontinued, rather than because brief interventions are inherently superior. In addition, the optimal dosage likely varies across students; some may benefit from sustained practice over multiple sessions, while others may require more intensive modeling before engaging in extended practice. Given these complexities, our findings on total session counts should be interpreted with considerable caution. Future research should directly manipulate the total number of sessions to develop more precise dosage recommendations for mathematics fluency interventions for students with MD. Until such evidence accumulates, our findings on total session counts should be regarded as tentative rather than as prescriptive guidance for practice.
Intervention Alignment
We examined three alignment indicators categorized into student alignment (grade level) and content alignment (operation focus and outcome measure; Myers et al., 2024). Meta-regression results demonstrated that the content alignment indicators significantly influenced intervention effects, emphasizing the importance of aligning instructional content with the type of mathematical operation targeted and the outcome being assessed.
Operation Focus
Regarding the operation focus, estimates indicated that interventions addressing both additive (i.e., addition or subtraction) and multiplicative (i.e., multiplication or division) tasks produced significantly larger effects than those focused solely on additive operations. No significant difference emerged between interventions targeting only multiplicative operations and those that addressed both. These findings are consistent with prior work (S. A. Kim et al., 2023) and suggest that interventions integrating multiple operation types may promote broader fluency development. However, due to the small number of studies addressing both additive and multiplicative operations (n = 5, k = 14), these results should be interpreted with caution. More research is needed to clarify whether combining operation types consistently enhances the effectiveness of mathematics fluency interventions for students with MD.
Outcome Measure
For the type of outcome, results showed that measures evaluating students’ word-problem-solving performance yielded significantly smaller effects than those assessing computational fluency. This pattern likely reflects the increased complexity and linguistic demands of word problems, which often require integrating reading comprehension, vocabulary, problem representation, and multistep reasoning, skills that are particularly challenging for students with MD (Benz & Powell, 2020; Cirino et al., 2015; Fuchs et al., 2006). Still, the significant average effect observed for word-problem outcomes (g = 0.25) suggests that fact fluency interventions may support transfer to more complex mathematical applications (Powell et al., 2023).
Estimates indicated no significant difference between fact fluency and computational fluency outcomes. This lack of difference may not be surprising, as both rely on foundational number sense, arithmetic, and procedural strategies (Burns et al., 2010; Geary, 2013; Witzel, 2016) and often incorporate similar instructional approaches such as mental math techniques and number decomposition. A small number of studies (n = 7) assessed outcomes classified as “other” (e.g., number line tasks, place value), and these also did not significantly differ from fluency or computation outcomes. However, given the limited number of studies in this category, further research is needed to clarify how the nature of the outcome assessed influences the observed effects of fluency interventions.
Limitations and Caveats
Our meta-analysis examining fact fluency interventions for students with MD offers valuable insights but is subject to several limitations. First, the limited sample size, comprising 35 studies that contributed 178 ESs, restricted the scope and precision of our moderator analyses. In some cases, sparse data within moderator categories necessitated collapsing levels (e.g., merging multiple outcome measures into an “Other” category), which reduced the specificity of our findings. In addition, the modest sample size prohibited us from testing other potentially important moderators, such as instructional features (e.g., modeling, feedback, or use of representations), which may influence intervention effects (Dennis et al., 2016; Jitendra et al., 2018). While degrees of freedom for malleable moderators in our meta-regression met the threshold for statistical reliability (df ≥ 4), the breadth and granularity of moderator analyses were still constrained by the available data.
Second, it is essential to recognize that RVE generally has lower statistical power compared to traditional meta-analytic approaches. This reduced power may have limited our ability to detect some meaningful differences between moderator categories, particularly for variables that showed non-significant effects (Pigott, 2012). However, given that most of our key moderators achieved adequate degrees of freedom as noted above, this power limitation is less concerning for our primary findings. The power limitations are most relevant when interpreting null findings, where the absence of significant effects could reflect either a true lack of association or insufficient power to detect existing differences.
Third, we restricted the analysis to group-design studies and excluded SCD studies due to conceptual differences in comparison conditions (Ledford & Gast, 2018). While this improved internal consistency, it limits the generalizability of findings across research designs (Kratochwill & Levin, 2010). Fourth, although we made efforts to include gray literature (e.g., dissertations and theses), most included studies were peer-reviewed, which introduces potential publication bias (Pigott & Polanin, 2020). This imbalance may have led to the underrepresentation of null or negative results. Fifth, demographic reporting was inconsistent across studies, particularly for ethnicity, which was not reported in 16 studies. This omission limited our ability to evaluate the efficacy of the intervention across diverse populations. Finally, although we included a broad set of study-level covariates to mitigate omitted variable bias, we did not fully explore or interpret their effects, potentially overlooking meaningful patterns, such as those related to publication era (Lein et al., 2020; Myers et al., 2022).
Implications for Research
Addressing the limitations outlined above is essential for advancing the evidence base on fact fluency interventions for students with MD. First, the limited number of group-design studies restricts the precision and scope of moderator analyses. Expanding the volume of high-quality, group-based experimental and quasi-experimental research is critical for enabling more granular moderator testing, particularly for instructional features such as modeling, feedback, and the use of representations, components that remain underexamined due to current sample size constraints (Dennis et al., 2016; Jitendra et al., 2018). Future studies should be adequately powered to detect moderator effects and explore their interactions with confounding variables, thereby informing how interventions can be more precisely tailored to meet student needs.
Second, future research should incorporate more advanced statistical techniques to address the challenges posed by high heterogeneity and limited sample sizes. Non-parametric, machine learning-based methods such as random forests and MetaForest offer a promising solution because they do not rely on traditional distributional assumptions or large sample sizes (Van Lissa, 2017). These approaches are particularly well-suited for meta-analyses with numerous potential moderators and complex interaction structures, as they can detect nonlinear effects and interactions that may be overlooked by conventional meta-regression. Applying these flexible analytic tools could help uncover more nuanced patterns in intervention effectiveness and support the design of more tailored, data-driven educational strategies.
Third, given the conceptual and methodological differences between group-design studies and SCDs, future research is advised to examine and report findings from each design type separately. Analyzing them independently will enable clearer, context-specific conclusions without conflating fundamentally different comparison structures. Moreover, SCDs often include more detailed demographic information (e.g., ethnicity), which can enhance understanding of intervention effects for specific subgroups of students with MD. Finally, future research should prioritize consistent and transparent reporting of demographic characteristics, particularly ethnicity. As noted by G. Nelson et al. (2023) and reflected in our quality analysis, many studies failed to report participants’ ethnicity, limiting the ability to assess the generalizability of their findings to diverse populations. This omission restricts efforts to examine the potential moderating effects of ethnicity on intervention outcomes, an important consideration given the known sources of heterogeneity in educational achievement. Addressing these gaps will enhance the field’s capacity to evaluate the efficacy of interventions across student subgroups with MD.
Implications for Practice
Despite the limitations outlined above, this meta-analysis provides valuable insights into how intervention dosage and content alignment can be used to enhance math fact fluency instruction for students with MD (Fuchs et al., 2017). The large, positive, and statistically significant mean effect indicates that fact fluency interventions are linked to broader improvements in skills such as multidigit computation and word-problem solving. Effective interventions typically included strategies, such as CCC, computer-based programs, incremental rehearsal, and other structured approaches aimed at building fluency. These methods focus on repeated, distributed practice to foster automaticity in foundational operations, a crucial aspect of mathematical development (Geary, 2013). Incorporating such strategies into regular instruction may improve students’ accuracy, speed, and confidence in fact retrieval (Burns et al., 2010; Codding et al., 2022).
Intervention Dosage: Session Quantity and Grouping
Although our regression analysis indicated that interventions with 30 or more sessions produced the largest effects once other moderators were controlled, the practice-facing results point to a different pattern: shorter, mastery-based interventions sometimes yielded especially large effects. Importantly, large-group (classwide) formats consistently emerged as the most effective grouping condition across both descriptive and regression analyses. At the same time, one-on-one and small-group formats also produced positive effects, underscoring that multiple grouping structures can be beneficial when fluency instruction is structured and responsive to student needs. In practice, grouping decisions should be responsive to students’ individual learning profiles and behavioral needs (Benz & Powell, 2020), as placing students with substantial behavioral challenges in large groups or extending instruction for too many sessions may be counterproductive. Taken together, these results suggest that teachers may be able to deliver fluency instruction efficiently in classwide settings and, in some cases, over relatively few sessions, provided instruction is mastery-based (Burns et al., 2010; Codding et al., 2016) and student progress is carefully monitored across both academic and behavioral domains (Benz & Powell, 2020). Ultimately, the ideal number of sessions and grouping format should be determined by ongoing progress monitoring, ensuring instruction continues only as long as necessary for students to reach mastery.
Content Intervention Alignment: Operation Focus and Task Type
Our results underscore the importance of content alignment in enhancing fluency instruction. Interventions targeting both additive and multiplicative content yielded larger effects than those focused solely on addition and subtraction. This pattern suggests that addressing a broader range of operations may support greater computational flexibility and facilitate transfer across mathematical tasks, particularly as students advance beyond basic arithmetic. Although relatively few studies incorporated both operation types, the consistency of this effect points to a promising direction for designing fluency instruction that builds across domains.
Differences in effects also emerged based on the outcome assessed. Interventions evaluated with computational fluency measures showed stronger effects than those assessed with word-problem solving, which often involve higher cognitive and linguistic demands and may be particularly challenging for students with MD, especially those with co-occurring reading difficulties (Cirino et al., 2015; Powell et al., 2009). While fact fluency provides an essential foundation, interventions focused solely on fluency may not fully support students in solving more complex applied problems. These findings highlight the importance of aligning instructional goals with the intended learning outcomes. When targeting broader mathematical competencies, fluency-building efforts may need to be paired with more comprehensive supports to ensure that gains in foundational skills extend to more complex mathematical reasoning.
Conclusion
Our findings underscore the importance of intensifying fluency interventions for students with MD by making strategic adjustments to intervention dosage and aligning content (Fuchs et al., 2017). Increasing the number of sessions and optimizing grouping structures enhance instructional intensity by providing more opportunities for distributed practice and retrieval of facts. In addition, aligning intervention content with students’ specific learning needs, particularly by targeting suitable operations and emphasizing computational fluency over complex word problems, may improve efficacy (Myers et al., 2022; Powell et al., 2009). These results suggest that reducing cognitive demands and focusing on foundational fluency skills can strengthen instructional impact. However, findings should be interpreted with caution given sample limitations and the potential influence of unmeasured confounding variables. Further research with larger and more diverse samples is needed to confirm and extend these conclusions.
Supplemental Material
sj-docx-1-ldx-10.1177_00222194261424914 – Supplemental material for A Meta-Analysis of Mathematics Fact Fluency Interventions for Students With Mathematics Difficulties (MD)
Supplemental material, sj-docx-1-ldx-10.1177_00222194261424914 for A Meta-Analysis of Mathematics Fact Fluency Interventions for Students With Mathematics Difficulties (MD) by Grace P. Douglas, Jonté A. Myers, Kathleen K. Mason, Sarah R. Powell and Danielle O. Lariviere in Journal of Learning Disabilities
Supplemental Material
sj-docx-2-ldx-10.1177_00222194261424914 – Supplemental material for A Meta-Analysis of Mathematics Fact Fluency Interventions for Students With Mathematics Difficulties (MD)
Supplemental material, sj-docx-2-ldx-10.1177_00222194261424914 for A Meta-Analysis of Mathematics Fact Fluency Interventions for Students With Mathematics Difficulties (MD) by Grace P. Douglas, Jonté A. Myers, Kathleen K. Mason, Sarah R. Powell and Danielle O. Lariviere in Journal of Learning Disabilities
Supplemental Material
sj-docx-3-ldx-10.1177_00222194261424914 – Supplemental material for A Meta-Analysis of Mathematics Fact Fluency Interventions for Students With Mathematics Difficulties (MD)
Supplemental material, sj-docx-3-ldx-10.1177_00222194261424914 for A Meta-Analysis of Mathematics Fact Fluency Interventions for Students With Mathematics Difficulties (MD) by Grace P. Douglas, Jonté A. Myers, Kathleen K. Mason, Sarah R. Powell and Danielle O. Lariviere in Journal of Learning Disabilities
Footnotes
Declaration of Conflicting Interests
The authors declared no potential conflicts of interest with respect to the research, authorship, and/or publication of this article.
Funding
The authors received no financial support for the research, authorship, and/or publication of this article.
References
Supplementary Material
Please find the following supplemental material available below.
For Open Access articles published under a Creative Commons License, all supplemental material carries the same license as the article it is associated with.
For non-Open Access articles published, all supplemental material carries a non-exclusive license, and permission requests for re-use of supplemental material or any part of supplemental material shall be sent directly to the copyright owner as specified in the copyright notice associated with the article.