
Abstract
This study examined the effects of socioeconomic status (SES) and specific learning disability (SLD) on reading and math developmental trajectories from kindergarten through fifth grade in the ECLS-K:2011 dataset. Using a retrospective classification based on SLD status at the end of fifth grade, we compared reading and math skills at school entry and growth over time between children with SLD (N = 540) and their peers without disabilities (N = 8,650). Although most children with SLD were not identified until third grade or later, this group exhibited significantly lower academic skills at kindergarten entry and relatively stable group differences over time. Similarly, children from lower-SES backgrounds had lower reading and math skills at school entry and their growth trajectories were largely parallel to their higher-SES peers. There were few significant interactions between SLD and SES in reading: The effect of SES on reading growth was evident only at the start of schooling, and was larger for students without disabilities than students with SLD. There were no significant SLD × SES interactions in math. Thus, although SLD and low SES were both risk factors for low performance, the intersection of risk did not qualitatively reshape developmental trajectories.
Introduction
Students’ academic performance can be influenced by many intersecting factors. Two types of potential vulnerability for academic development include low socioeconomic status (SES) and experiencing specific learning disabilities or difficulties (SLD). Independently, both SLD and lower SES are associated with below-average academic performance. Yet while many students experience multiple risk factors for low achievement, research has often addressed gaps in reading or math scores related to SES or SLD separately (e.g., SES: Workman, 2022; SLD: Mattison et al., 2022). Here we examine the intersection of SES and SLD toward a more comprehensive understanding of vulnerable students.
Achievement Gaps Over Time for Students With SLD
Students with SLD struggle to acquire academic skills relative to their peers without SLD. Even prior to the start of schooling, children who are later identified with a learning disability demonstrate vulnerable academic and cognitive skills (e.g., Chu et al., 2019; Leppänen et al., 2011; Van Zuijen et al., 2013). Furthermore, children who are later identified with co-occurring learning disabilities show the lowest scores on cognitive measures prior to kindergarten compared with those with a single SLD and those who are not at risk (Barnes et al., 2019), resulting in achievement gaps at school entry.
Gaps in achievement are well-documented in nationally representative U.S. samples such as the Early Childhood Longitudinal Study, Kindergarten Class of 1998 (ECLS-K:1998) dataset, which tracked U.S. children from kindergarten through eighth grade (Tourangeau et al., 2009). These studies generally categorize students based on whether or not they have an Individualized Education Program (also referred to as Plan), or IEP, which is a provision of the U.S. Individuals with Disabilities Education Act (IDEA, 2004) for qualifying children with a learning disability to receive specific services and accommodations. In the ECLS-K datasets, researchers may identify children who have an IEP for SLD specifically (as opposed to other disabilities that may also warrant an individualized program); however, the category does not further differentiate whether a child’s SLD is specific to reading, writing, and/or mathematics. Nevertheless, students with SLD in any domain show lower initial achievement in both reading (Judge & Bell, 2011) and mathematics (Judge & Watson, 2011) measured at the beginning of kindergarten, and demonstrate slower growth through fifth grade across SES. Similarly, students with SLD have the lowest reading ability at the beginning of second grade and the slowest rate of growth through the end of third grade, as compared with both students in general education settings and those with an emotional disturbance such as a conduct disorder (Wanzek et al., 2014). Both in the ECLS-K and in other large-scale datasets, gaps in reading (Schulte et al., 2016; Sullivan et al., 2017) and math achievement (Nelson & Powell, 2018; Stevens et al., 2015; Wei et al., 2012) between students with SLD and students without disabilities (SWOD) are relatively stable over time, and difficult to overcome.
One notable methodological difference across prior studies is how participants with SLD are characterized. Some studies of the ECLS-K:1998 dataset have identified children with an IEP in kindergarten (e.g., Morgan et al., 2011; Wu et al., 2014). However, many learning disorders are not identified until a child has failed to make expected progress over multiple years of schooling. Others have characterized students retrospectively (e.g., Mattison et al., 2022), using IEP receipt later in schooling to designate SLD and SWOD groups. Studies have also differed in their approach to modeling growth trajectories, often using quadratic or piecewise functional forms. These models reflect an initial steep increase at the start of schooling as foundational skills develop quickly, followed by a slowing rate of change (e.g., Kieffer, 2012; Kohli et al., 2015; Sullivan et al., 2017). Yet there is also evidence that students with SLD may demonstrate later acceleration in their growth compared with their typically developing peers. For instance, Sullivan and colleagues (2017) found that students with an IEP at any time had lower initial reading scores in kindergarten and slower rates of growth through third grade, compounding deficits over time. However, growth for students with SLD accelerated from fourth through eighth grade, such that their learning trajectory was slightly steeper than that of their peers without disabilities. Similarly in mathematics, kindergarteners later identified with SLD in reading, writing, and/or math demonstrated lower initial scores and slower growth through fourth grade, but this was followed by a slight acceleration in growth in upper elementary school (Kohli et al., 2015). It is possible that this later acceleration may be better captured by a cubic growth form.
The diversity among children with SLD necessitates a deeper understanding of the factors that shape learning trajectories. Parallel growth mixture modeling using the ECLS-K:1998 dataset has revealed heterogeneity in the reading and mathematics trajectories of students with SLD (Mattison et al., 2022). Approximately 54% of students with SLD showed initial low achievement that further declined over time; however, 13% of students narrowed gaps in both math and reading between first and eighth grade. Post hoc exploration of demographic predictors revealed that SES was associated with longitudinal trajectories. Children with SLD from higher-SES backgrounds were more likely to have had earlier intervention and show higher achievement, while lower-SES children with SLD were more likely to have consistently lower math and reading achievement compared to their peers (Mattison et al., 2022). This incidental discovery highlights the need to directly examine intersecting risk factors, such as SES and SLD, associated with achievement gaps over time.
Achievement Gaps Over Time Related to Socioeconomic Background
Gaps in achievement between students from higher and lower socioeconomic backgrounds are well-documented among U.S. school children (Hanushek et al., 2019; Reardon, 2013). One common interpretation is that SES influences a child’s access to the linguistic and educational resources that will help them to build foundational skills for school success. The “Achievement Gap” is thus often reframed in terms of an “Opportunity Gap.” Children from historically disenfranchised social groups face structural barriers that limit educational opportunities, while children from higher-SES homes reap the cumulative benefits of access and cultural capital over time (Ladson-Billings, 2013; Welner & Carter, 2013). Socioeconomic status may influence learning via broad structural inequalities (i.e., environmental stress or chaotic environments), neighborhood features (access to libraries, learning resources, healthy food, healthcare), school resources and services, home literacy environment, and perception of family standing (Romeo et al., 2022).
Like achievement gaps related to SLD, achievement gaps for students from higher versus lower SES are apparent prior to school entry, and generally remain consistent over the course of schooling (e.g., Reardon, 2013). Initial SES gaps in academic skills at the start of schooling are apparent in both reading (Aikens & Barbarin, 2008; Chatterji, 2006; McCoach et al., 2006) and math (Galindo & Sonnenschein, 2015; Muñez et al., 2021). Lower SES children often enter school with lower scores on measures of vocabulary knowledge, phonological awareness, and other language skills (Fernald et al., 2013; Levine et al., 2020; McDowell et al., 2007) as well as weaker foundational numeracy skills such as counting and judging differences in quantities (Jordan & Levine, 2009). Even within groups of low-SES children, subtle differences in family income are associated with children’s behavioral approaches to learning in preschool, which are, in turn, associated with their kindergarten readiness, literacy skills, and math skills (Gullo, 2018).
Findings regarding differences in growth trajectories by SES have been somewhat mixed. Chatterji (2006) reported that the gap in reading performance between high- and low-income students grew between kindergarten entry and the end of first grade. Lower SES has also been associated with slower growth from first through fifth grade in both reading and math (Scammacca et al., 2020). However, others have revealed more nuanced effects of SES across development. In a study of literacy achievement, children from lower-SES backgrounds grew at a faster rate than their higher-SES peers in the early stages of learning to read (kindergarten through third grade), but at a slower rate in third through eighth grade (Kieffer, 2012). One possibility is that early reading instruction may begin to equalize achievement gaps as basic skills are taught; however, less explicit instruction and greater emphasis on oral language proficiency and background knowledge allow this gap to widen again as children transition from “learning to read” to “reading to learn” without sufficient support (Chall, 1983). Similarly, gaps between higher- and lower-SES students in math achievement remain relatively stable throughout middle-to-late childhood but widen substantially in early adolescence (Caro et al., 2009), compounding relative (dis)advantage over time. There are also important nuances in the associations between various indicators of family SES and different cognitive skill growth across contexts. For instance, maternal education in a Singaporean sample has been associated with kindergarten growth trajectories in reading but not math or working memory (Muñez et al., 2021). Different aspects of SES (i.e., income, familial resources, school context, home environment) may thus have different associations with reading trajectories as opposed to math trajectories (Muñez et al., 2022).
The Intersection of SLD and SES
All individuals belong to multiple social categories, and these identities intersect with and influence one another (Cole, 2009). Interactions between economic advantage and achievement are critical to understand within the context of broader power structures. U.S.-based research has historically centered the development of white, middle-class children as the societal norm. As learning difficulties are often defined as deviations from this norm, minority and low-SES students are placed at greater risk for being identified with SLD or referred for special education services that may or may not suit their needs (Connor & Fernandez, 2006). This is not to say that socioeconomic disadvantage causes SLD, or that children from under-resourced backgrounds are more likely to have a learning disorder. Qualifying for and receiving special education services in a given developmental context is quite distinct from the neurocognitive differences that underlie learning difficulties. Because teaching, learning, and development take place in context, it is essential to examine the intersection between disability and socioeconomic environment as they influence learning trajectories.
The present study centers SES as a key variable in understanding learning trajectories for students with and without SLD. While “additive” approaches (Hancock, 2007) suggest that negative associations with both socioeconomic disadvantage and SLD may simply equal the sum of their parts, intersectionality frameworks allow for a more nuanced understanding of how one identity might amplify or lighten the challenges associated with another. One possibility, consistent with a multiple marginalization framework, is that students who are both of lower-SES and have SLD may be further disadvantaged than students who belong to only one marginalized group (Shifrer, 2023). For instance, one study of state-wide math achievement from third through seventh grade (Stevens & Schulte, 2016) revealed significant interactions between learning disability and some sociodemographic factors (i.e., sex, race, SES), but not others (i.e., ethnicity, English language learner status). Alternatively, negative associations with SLD might be greater for higher-SES youth. For instance, greater stigma around SLD in high-SES communities might be associated with greater resistance to accessing necessary resources (i.e., increased liability; Shifrer, 2023).
The current study seeks to capture the nuanced effects of intersecting risk factors toward a more comprehensive understanding of how SES and SLD shape academic outcomes. To this end, we examined reading and math developmental trajectories from kindergarten through fifth grade in the nationally representative Early Childhood Longitudinal Study (ECLS-K:2011; Tourangeau et al., 2019). First, we asked whether students with SLD differ from students without disabilities (SWOD) in their reading and math ability, evaluating both initial performance at kindergarten entry and academic trajectories through fifth grade. Second, we investigated the intersection of SLD diagnosis and low SES as potentially cumulative factors that may influence reading and math achievement over time. We hypothesized that the convergence of lower SES with an SLD diagnosis would be associated with lower achievement over time versus having a single risk factor, consistent with multiple marginalization (Shifrer, 2023).
Method
We performed a secondary analysis of the ECLS-K:2011 dataset (Tourangeau et al., 2019), a nationally representative longitudinal study that followed children beginning in their kindergarten year in 2010–2011. Students completed cognitive assessments during one-on-one testing sessions. Parents additionally completed phone interviews during some waves of data collection, and school personnel completed self-administered questionnaires. We analyzed data from the fall and spring of kindergarten and the spring of first through fifth grades. This study was exempt from institutional review board (IRB) approval and was not preregistered. The data analyzed in the current study are restricted, but analytic code is available at https://osf.io/hg7p2/.
Measures
Reading and Math Assessment
The outcomes of interest were students’ reading and math achievement, operationalized using the ECLS-K:2011 item response theory (IRT) generated theta scores (Tourangeau et al., 2019). IRT is a framework for assessment that allows researchers to administer a subset of test items aligned with an individual’s skill level. All participants completed some common “routing” items which were then used to determine the difficulty level of the subsequent test items. This approach allowed ECLS-K researchers to generate scores that measured longitudinal achievement gains, even when students were not administered the identical test items at each point in time (Tourangeau et al., 2019). The theta scores are an estimate of reading and math ability level that are specifically recommended for multivariate analyses (Tourangeau et al., 2019). They were re-scaled after the final round of data collection in fifth grade to accurately represent growth over time and range from −4 to 4, with higher scores representing higher achievement.
Reading ability was measured by a test that sampled basic reading skills, vocabulary, and reading comprehension. In kindergarten, the assessor asked each child questions one-on-one related to images presented on an easel, probing letter recognition, phonological awareness, familiarity with print, and knowledge of sight words. In later grades, reading assessment focused on comprehension, asking children to identify information, interpret, and evaluate both literary and informational text. Math ability was measured by a test that sampled skills such as number sense, operations (addition, subtraction, multiplication, division), and measurement. In kindergarten, children demonstrated knowledge of written numerals and shapes as well as basic addition, subtraction, and pattern recognition. In later grades, math assessment included fraction comparison, data analysis, probability, and simple algebraic equations among other more advanced math skills (Najarian et al., 2020).
Specific Learning Disability
We relied on fifth-grade reports from special educators to identify students with SLD. Participants were assigned to the SLD group if they were reported to be receiving services for an SLD in fifth grade. Students were excluded if they were also receiving services for a visual or hearing impairment, autism, or an intellectual disability. This retrospective characterization allowed us to investigate possible differences in achievement at school entry among students who later went on to receive an SLD diagnosis.
To identify students without disabilities (SWOD), we relied on teacher and parent reports across all time points. A student was assigned to the SWOD group if their teacher indicated that they were not receiving special education services at each time point, and their parent did not report that the child had a disability at any time point. These inclusion criteria resulted in a final analytic sample of approximately N = 540 SLD and N = 8,650 SWOD (reported Ns rounded to the nearest ten in compliance with the restricted-use data policies).
Socioeconomic Status
Socioeconomic status was operationalized as a continuous variable calculated by the ECLS-K:2011 study team, reflecting a composite of parental education, parental occupational prestige, and household income range as reported by parents during their child’s kindergarten year. The SES variable missingness ranged from approximately 2% for parental occupation to 15% for household income. Missing data were imputed by the ECLS team for each component variable to calculate a normalized composite score with a mean of 0 and standard deviation of 1.
Model Building and Selection
We modeled growth in reading and math from kindergarten through fifth grade using the mixed command in Stata 14 (StataCorp, 2015). Time was represented as the fall or spring of each grade (0 = fall kindergarten, 0.5 = spring kindergarten, 1 = fall first grade, . . . 5.5 = spring of fifth grade). Missing data were low in our analytic sample: Our key variable, SLD, had no data missing, and 81% of participants had complete cases across all covariates and variables of interest. Additional details about variable-level missingness are available in Supplement B. Participants excluded due to missingness were less likely to be White and more likely to be Hispanic or Asian; more likely to speak a language other than English in the home; experienced more socioeconomic disadvantage; and had lower reading and math scores in the fall of kindergarten than participants in our analytic sample. Children from these populations are thus underrepresented in our analysis, and results should be considered accordingly.
To identify the best fitting model, we began with fully unconditional models (i.e., including no predictors) of reading and math. One methodological challenge when working with large datasets is the risk of “overfitting” the data, as even small effects might be statistically significant (i.e., p values below a threshold of 0.05). We, therefore, tested a hierarchy of models and examined multiple statistical indicators to identify the best functional form to describe growth over time.
When variables characterizing time were included as predictors, models of reading and math differed significantly up to a sextic model fit (i.e., including terms that model time up to a power of 6). Using multiple indicators—including the change in Bayesian information criterion (BIC) values, visual inspection of the data (see Supplemental Figures SB-1, SB-2, SB-3), and theoretical plausibility of interpretation—we determined that a cubic form was the most appropriate. A quadratic form, which has been employed frequently in the literature, may only capture an initially steep rate of growth which later slows down. A cubic form can reflect growth that later accelerates again after a plateau, a pattern previously demonstrated in reading and math among students with SLD (Kohli et al., 2015; Sullivan et al., 2017). Cubic modeling may more clearly reveal specific time frames associated with changing growth rates, and illuminate how they may differ in relation to age, SES, and SLD status. We thus present the results of the cubic functional form below, but note that we replicated the current findings using a quadratic form as well.
Statistical Analyses
After determining that growth in reading and math was best captured by a cubic functional form, we fit a taxonomy of multilevel growth models with time of assessment (Level 1) nested within student (Level 2). At Level 1, the coefficients represented the average reading or math ability of U.S. children at kindergarten entry, the average linear growth rate, the average quadratic growth rate, the average cubic growth rate, and the occasion-level residual. At Level 2, the Level 1 intercept and growth terms were each composed of an intercept and slope associated with SLD (0 = SWOD, 1 = SLD), an intercept and slope associated with SES (continuous), an intercept and slope associated with the interaction between SLD and SES, and an intercept and slope associated with each student-level covariate (C) included in the analysis. At Level 2, the Level 1 intercept and linear growth term also included a student-level residual. Because we had no predictors at the school level, we did not include a third level; instead, standard errors were clustered by schools (N = 879) at Level 2. Full model fit information is presented in Supplemental Table SB-1.
The addition of each “time” term (linear, quadratic, cubic growth) significantly improved model fit. Random effects for quadratic and cubic models were not significant and led to model non-convergence so they were removed for parsimony. We then added the SLD x SES x Time interactions and sociodemographic covariates (gender, race, ethnicity, home language other than English, history of repeating kindergarten), all of which significantly improved model fit. The full model explained an additional 33% and 35% of the variance in the intercept for reading and math, respectively, and 16% and 11% of the variance in the slope over the fully unconditional cubic model.
Results
Descriptive Comparison of Participants
Table 1 presents demographic and context-level variables for N = 540 participants with SLD compared with N = 8,650 SWOD. The groups differed significantly in their reading and math achievement at all time points, with effect sizes ranging from d = 1.11–2.26. Students in the SLD group were significantly more likely to be male, non-White, living below the poverty line, receiving free/reduced price lunch, and have parents with lower educational attainment (see Table 1).
Descriptive Statistics for Students With SLD Diagnosis in Fifth Grade (N = 540) and SWOD Who Have Never Received Special Education Services (N = 8,650).
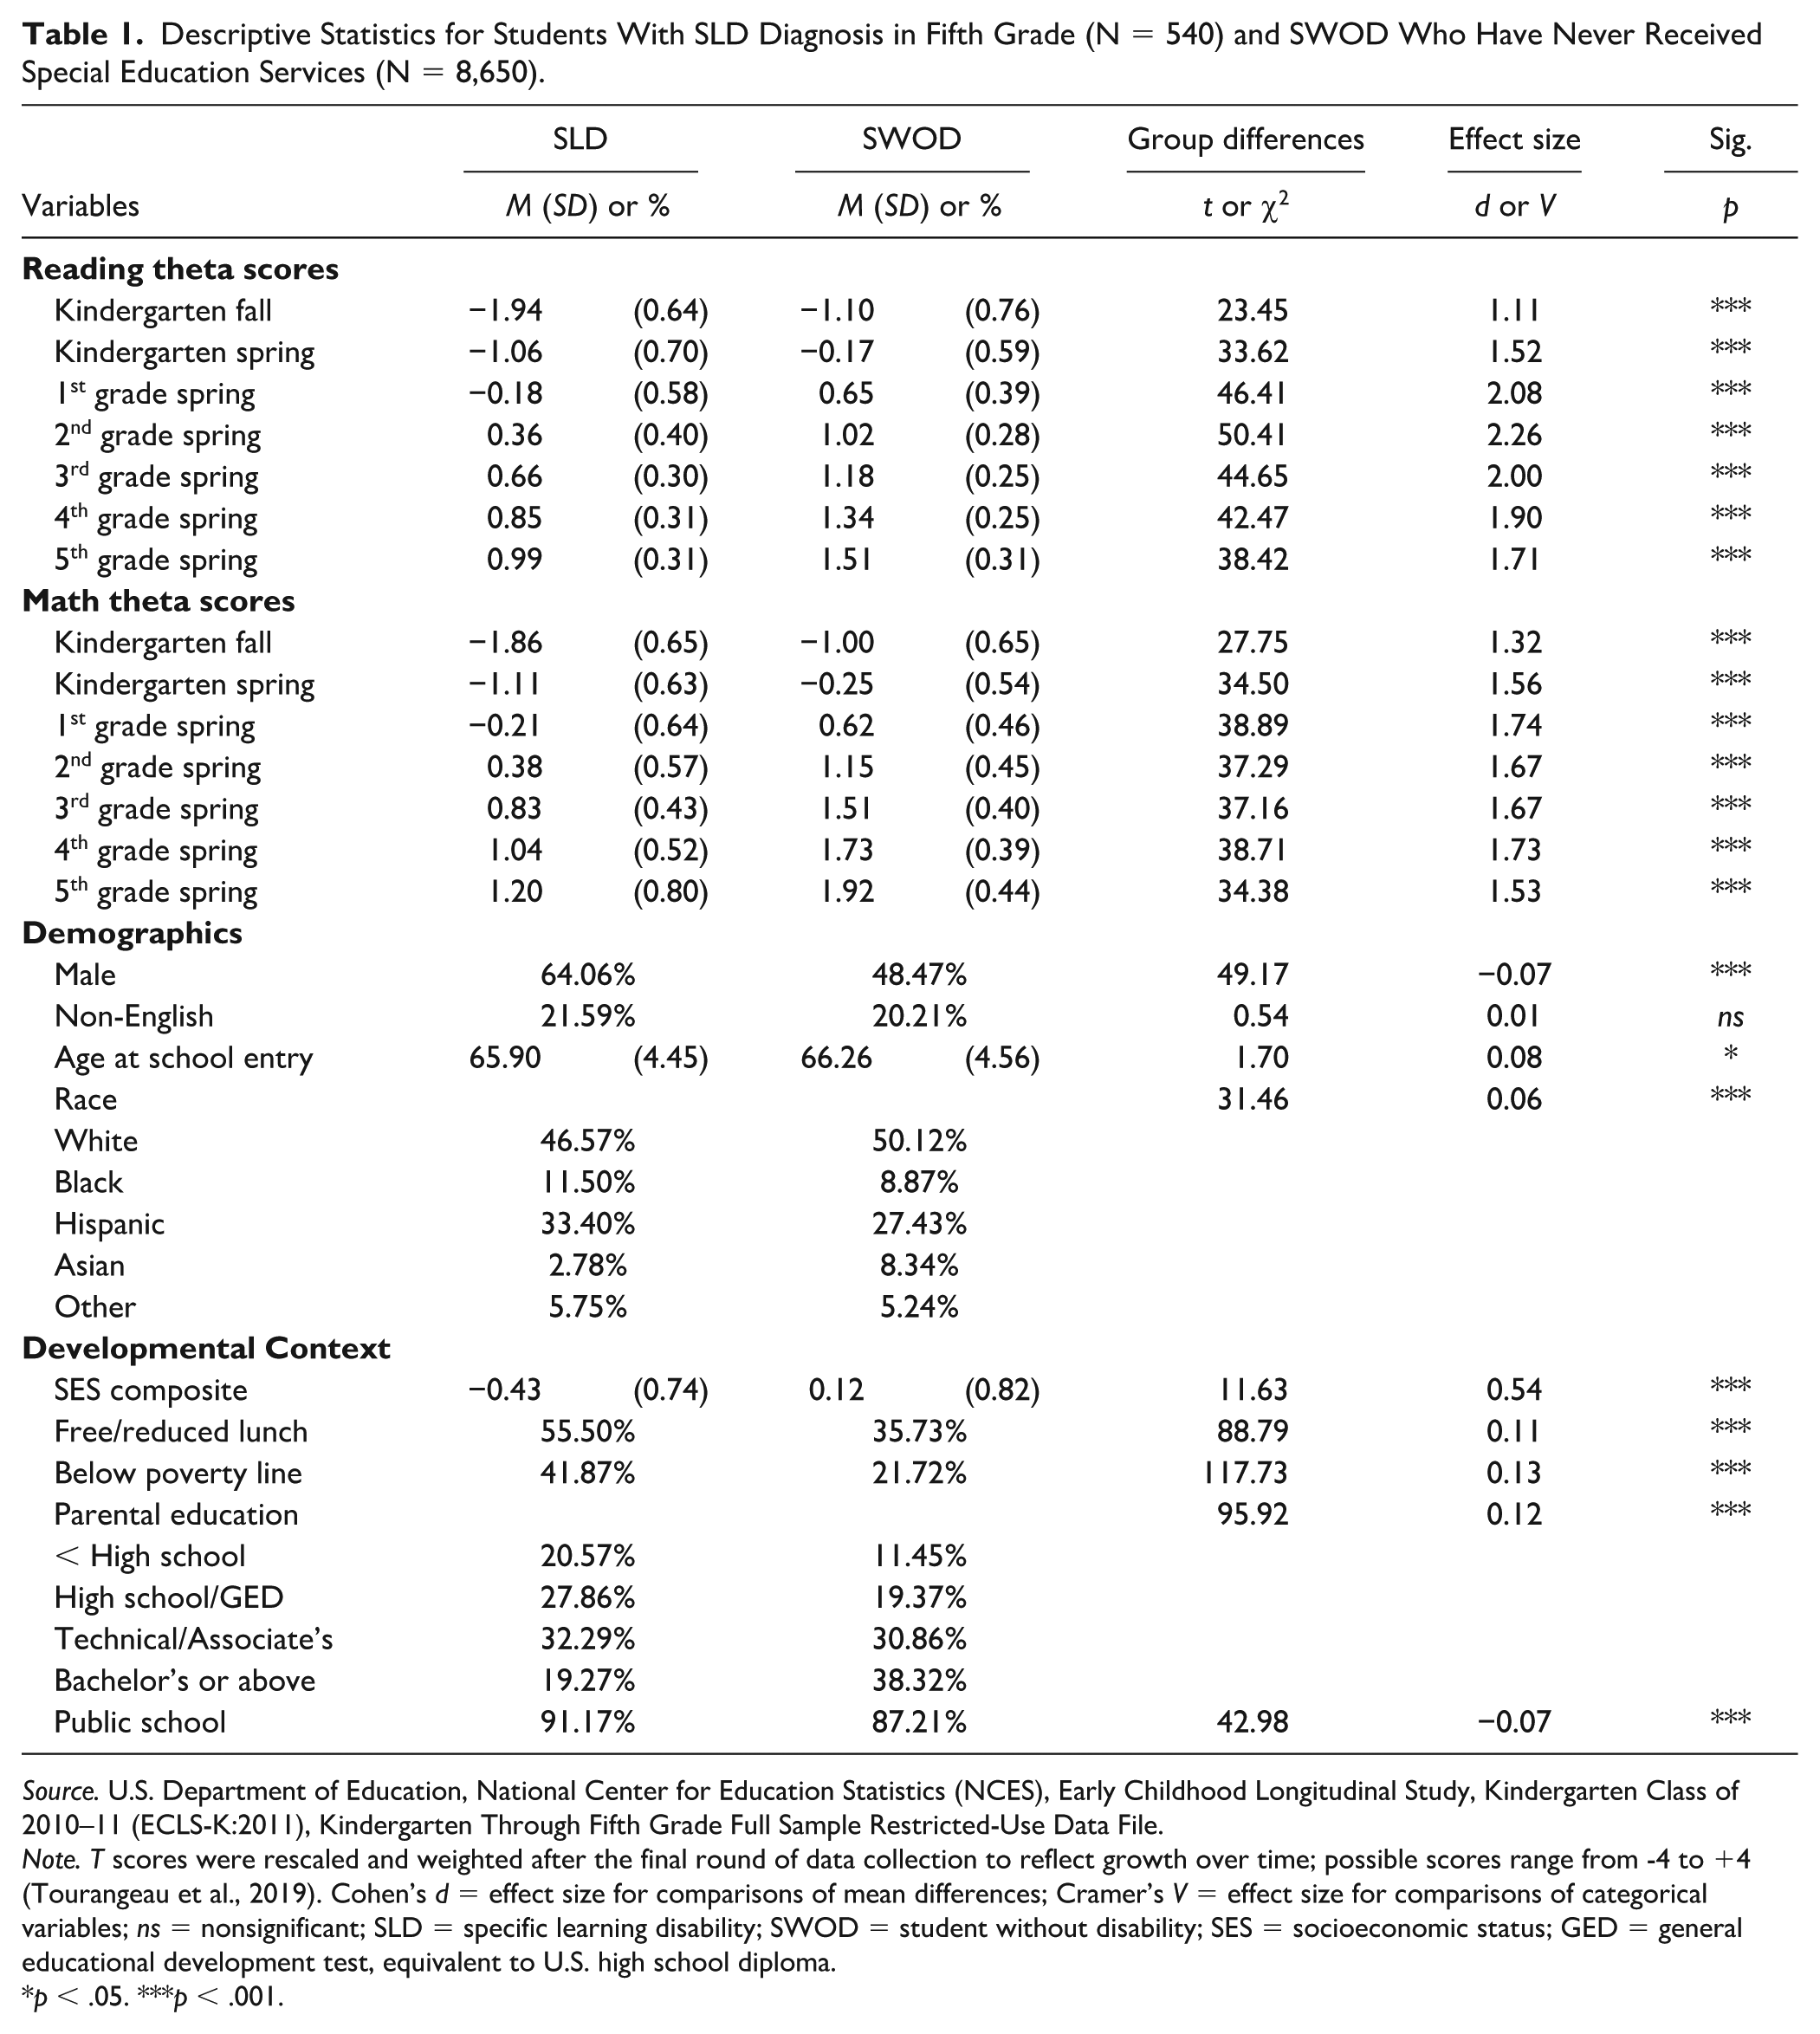
Source. U.S. Department of Education, National Center for Education Statistics (NCES), Early Childhood Longitudinal Study, Kindergarten Class of 2010–11 (ECLS-K:2011), Kindergarten Through Fifth Grade Full Sample Restricted-Use Data File.
Note. T scores were rescaled and weighted after the final round of data collection to reflect growth over time; possible scores range from -4 to +4 (Tourangeau et al., 2019). Cohen’s d = effect size for comparisons of mean differences; Cramer’s V = effect size for comparisons of categorical variables; ns = nonsignificant; SLD = specific learning disability; SWOD = student without disability; SES = socioeconomic status; GED = general educational development test, equivalent to U.S. high school diploma.
p < .05. ***p < .001.
Because we retrospectively defined participant groups based on fifth grade reports from special educators, we next examined the timing of IEP receipt within the SLD group. Approximately 70% of students with SLD first received their IEP in third grade or later (see Figure 1). We then compared achievement among children with SLD who received their IEP early (in kindergarten through second grade) vs. late (in third grade or later; see Supplemental Table S1). T tests revealed that early IEP recipients had significantly lower reading performance at only one time point, and with a small effect size: in the spring of kindergarten (d = −0.21, p = .030). Math achievement did not differ significantly at any time point. Late IEP recipients were also of slightly lower SES, but the effect size was small and not statistically significant (d = 0.16, p = .104).
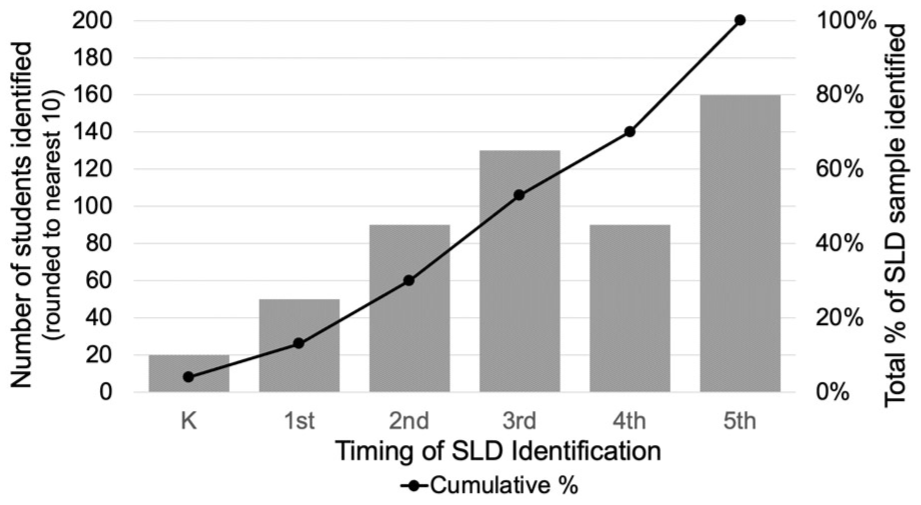
Number and Cumulative Percentage of Students in Final SLD Group Identified at Each Grade Level
Differences in Reading and Math Trajectories by SLD Status
Our first question asked whether students with SLD differ on average from SWOD in reading and math achievement (a) at school entry, or (b) in their growth trajectories through fifth grade. We ran two multilevel models to investigate reading and math ability separately. Results are presented in Supplemental Tables SA-2 and SA-3 and are visualized in Figure 2. These initial models included N = 9,190 participants (rounded) and did not include any covariates to maximize sample size. We present standardized betas (β) below to quantify effect sizes and allow the reader to compare magnitudes across variables and models.
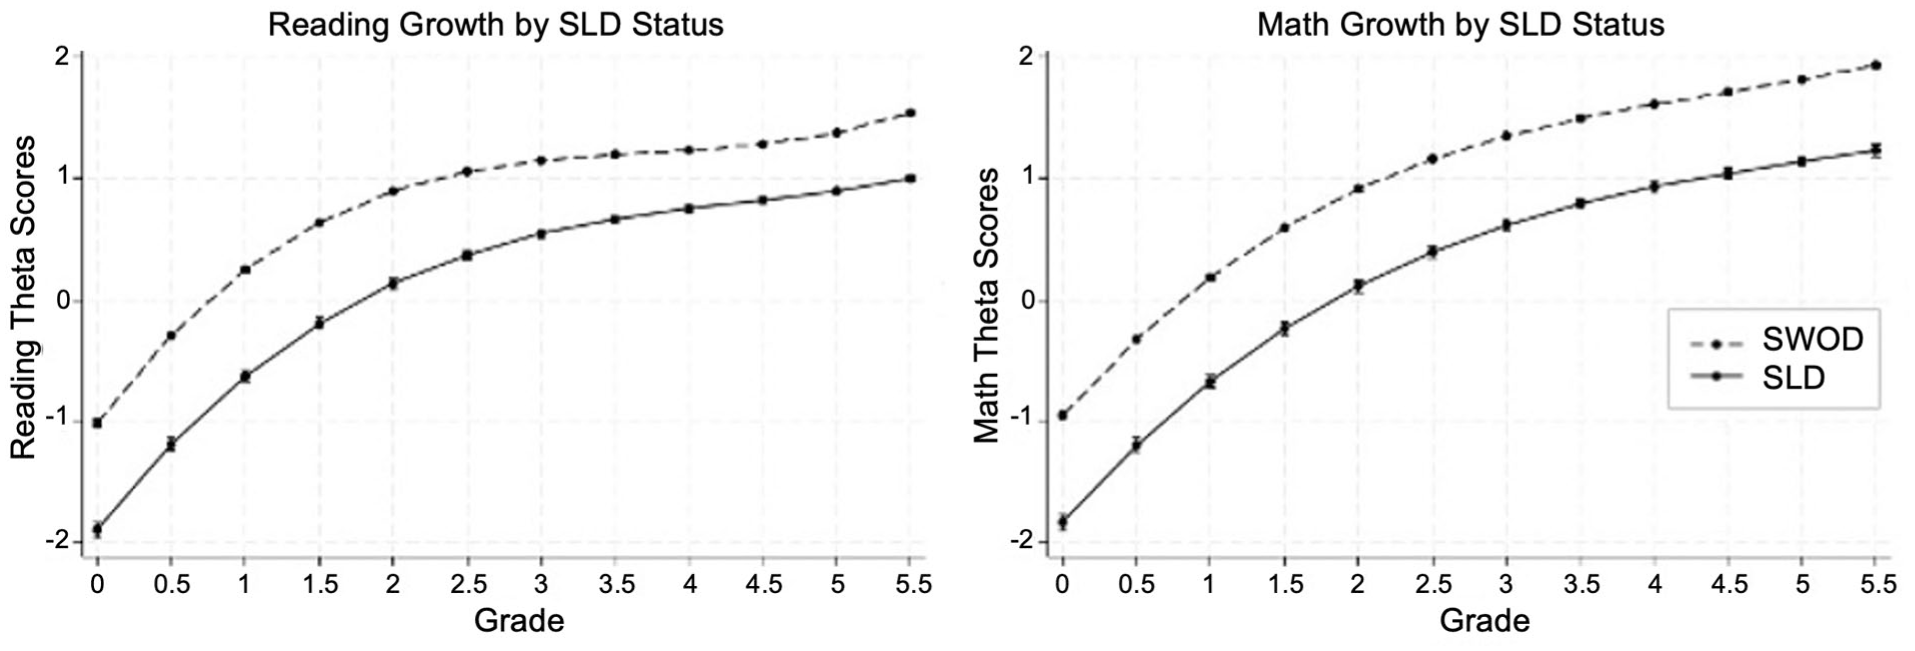
Reading and Math Growth Trajectories by SLD Status
Students who were identified with SLD by fifth grade entered school performing almost a full standard deviation behind their peers without SLD in both reading (SLD Status β = −0.92) and math (SLD Status β = −0.81). Students without SLD had steeper initial growth in kindergarten and first grade, Time (Linear) β = 1.74, followed by a slow-down in second and third grade, Time (Quadratic) β = −0.45. In contrast, reading growth in the SLD group was initially less steep, but did not slow as much in subsequent years. These differences in curvature result in the largest relative gaps in reading between the SLD and SWOD groups in second grade (Cohen’s d = 2.26, see Table 1). Growth curves begin to diverge again in fifth grade: SWOD demonstrate new acceleration in reading growth, while growth for students with SLD is less pronounced, Time (Cubic) x SLD β = −0.01.
We observed significant reading growth over time for both SLD and SWOD groups as well as significant interactions between the linear, quadratic, and cubic effects of time with SLD status. However, we did not observe a statistically significant or clinically relevant difference between SLD and SWOD trajectories in math over time. Although the growth curvature of the models differed statistically between SLD and SWOD groups, the effect sizes are small (βs < 0.03, where β = 0 would indicate parallel math trajectories).
Interaction Between SLD Status and SES
Our second research question investigated whether SLD-related achievement gaps differed by SES (a) at school entry, or (b) in growth trajectories, after adjusting for other relevant sociodemographic factors. These final models included approximately N = 7,540 participants (rounded) due to item-level missingness.
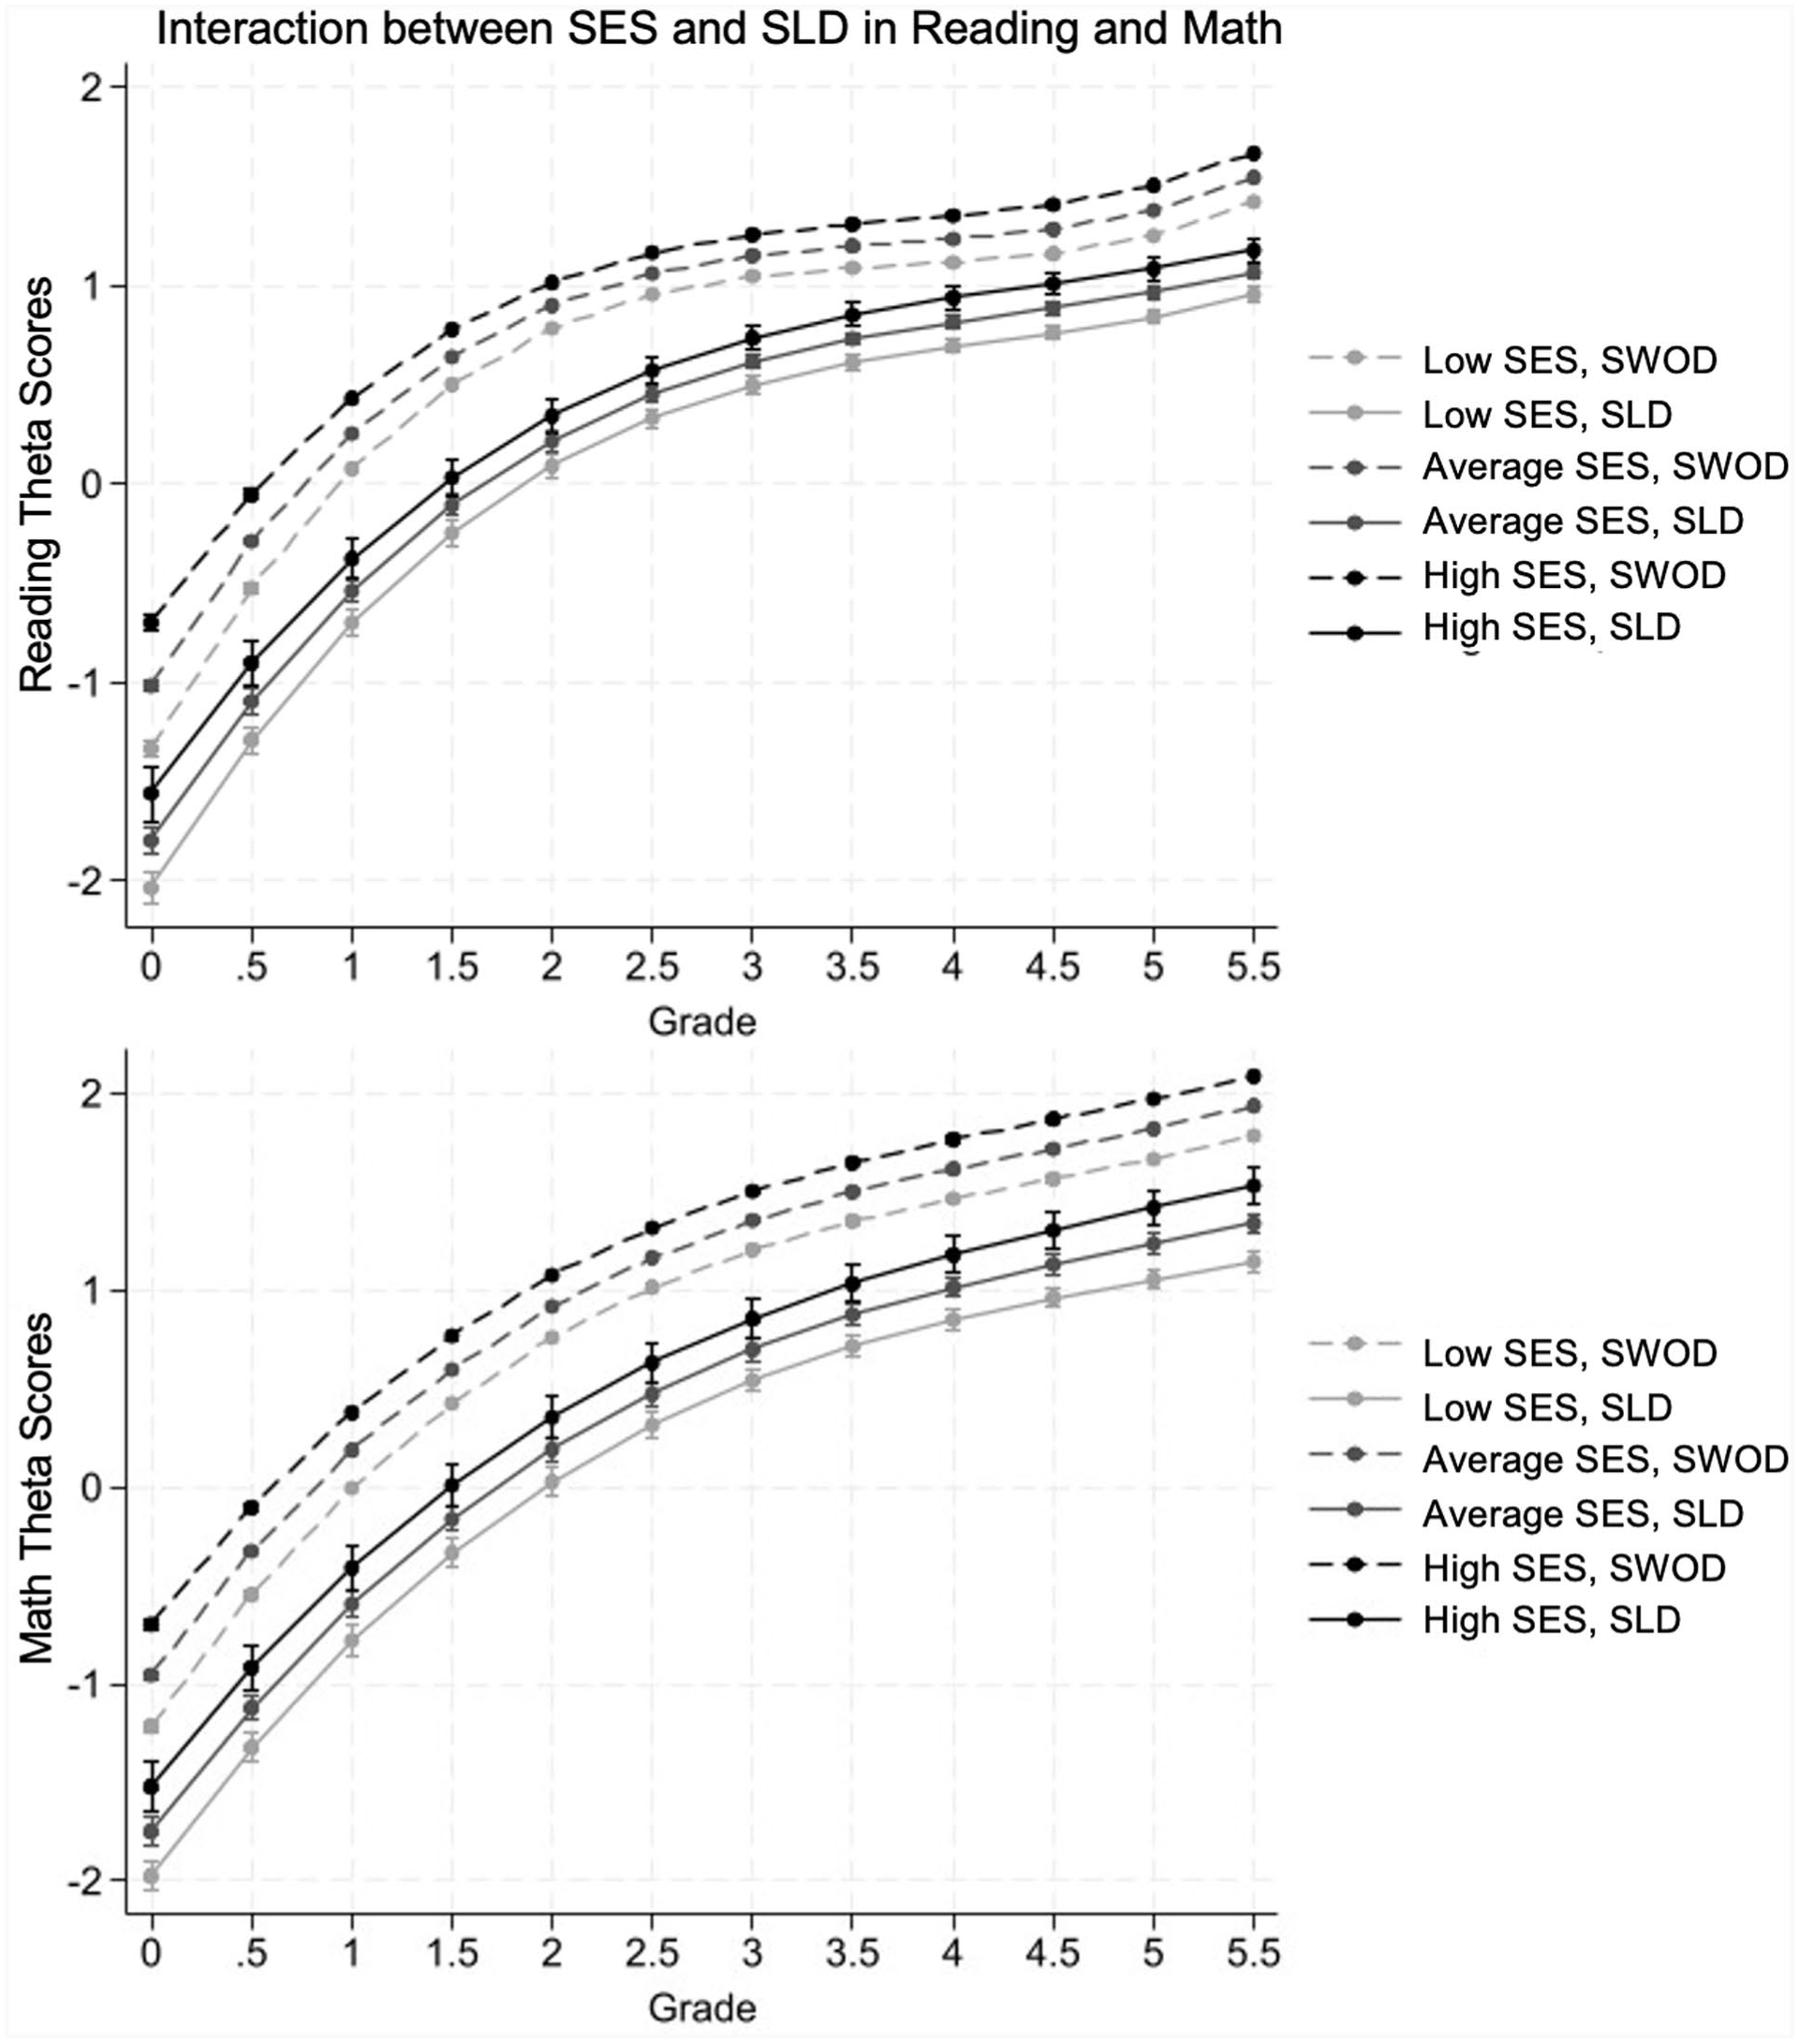
Growth curves by SLD status and SES are visualized in Figure 3 and presented in Tables 2 (reading) and 3 (math). In both models, SLD status and SES were each independently associated with differences in initial achievement and change over time after controlling for additional explanatory factors. The SLD × SES interaction was statistically significant for reading but not for math. Supplement A discusses the impact of covariates on reading and math trajectories. We also conducted post-hoc simple slopes analysis to explore the nature of the three-way interactions between SES, SLD status, and time. These post-hoc results are available in Supplemental Tables SA-4, SA-5, and SA-6.
Reading and Math SES × SLD Trajectories
Differences in Reading Trajectories SLD Status, SES, and SLD × SES Interaction.
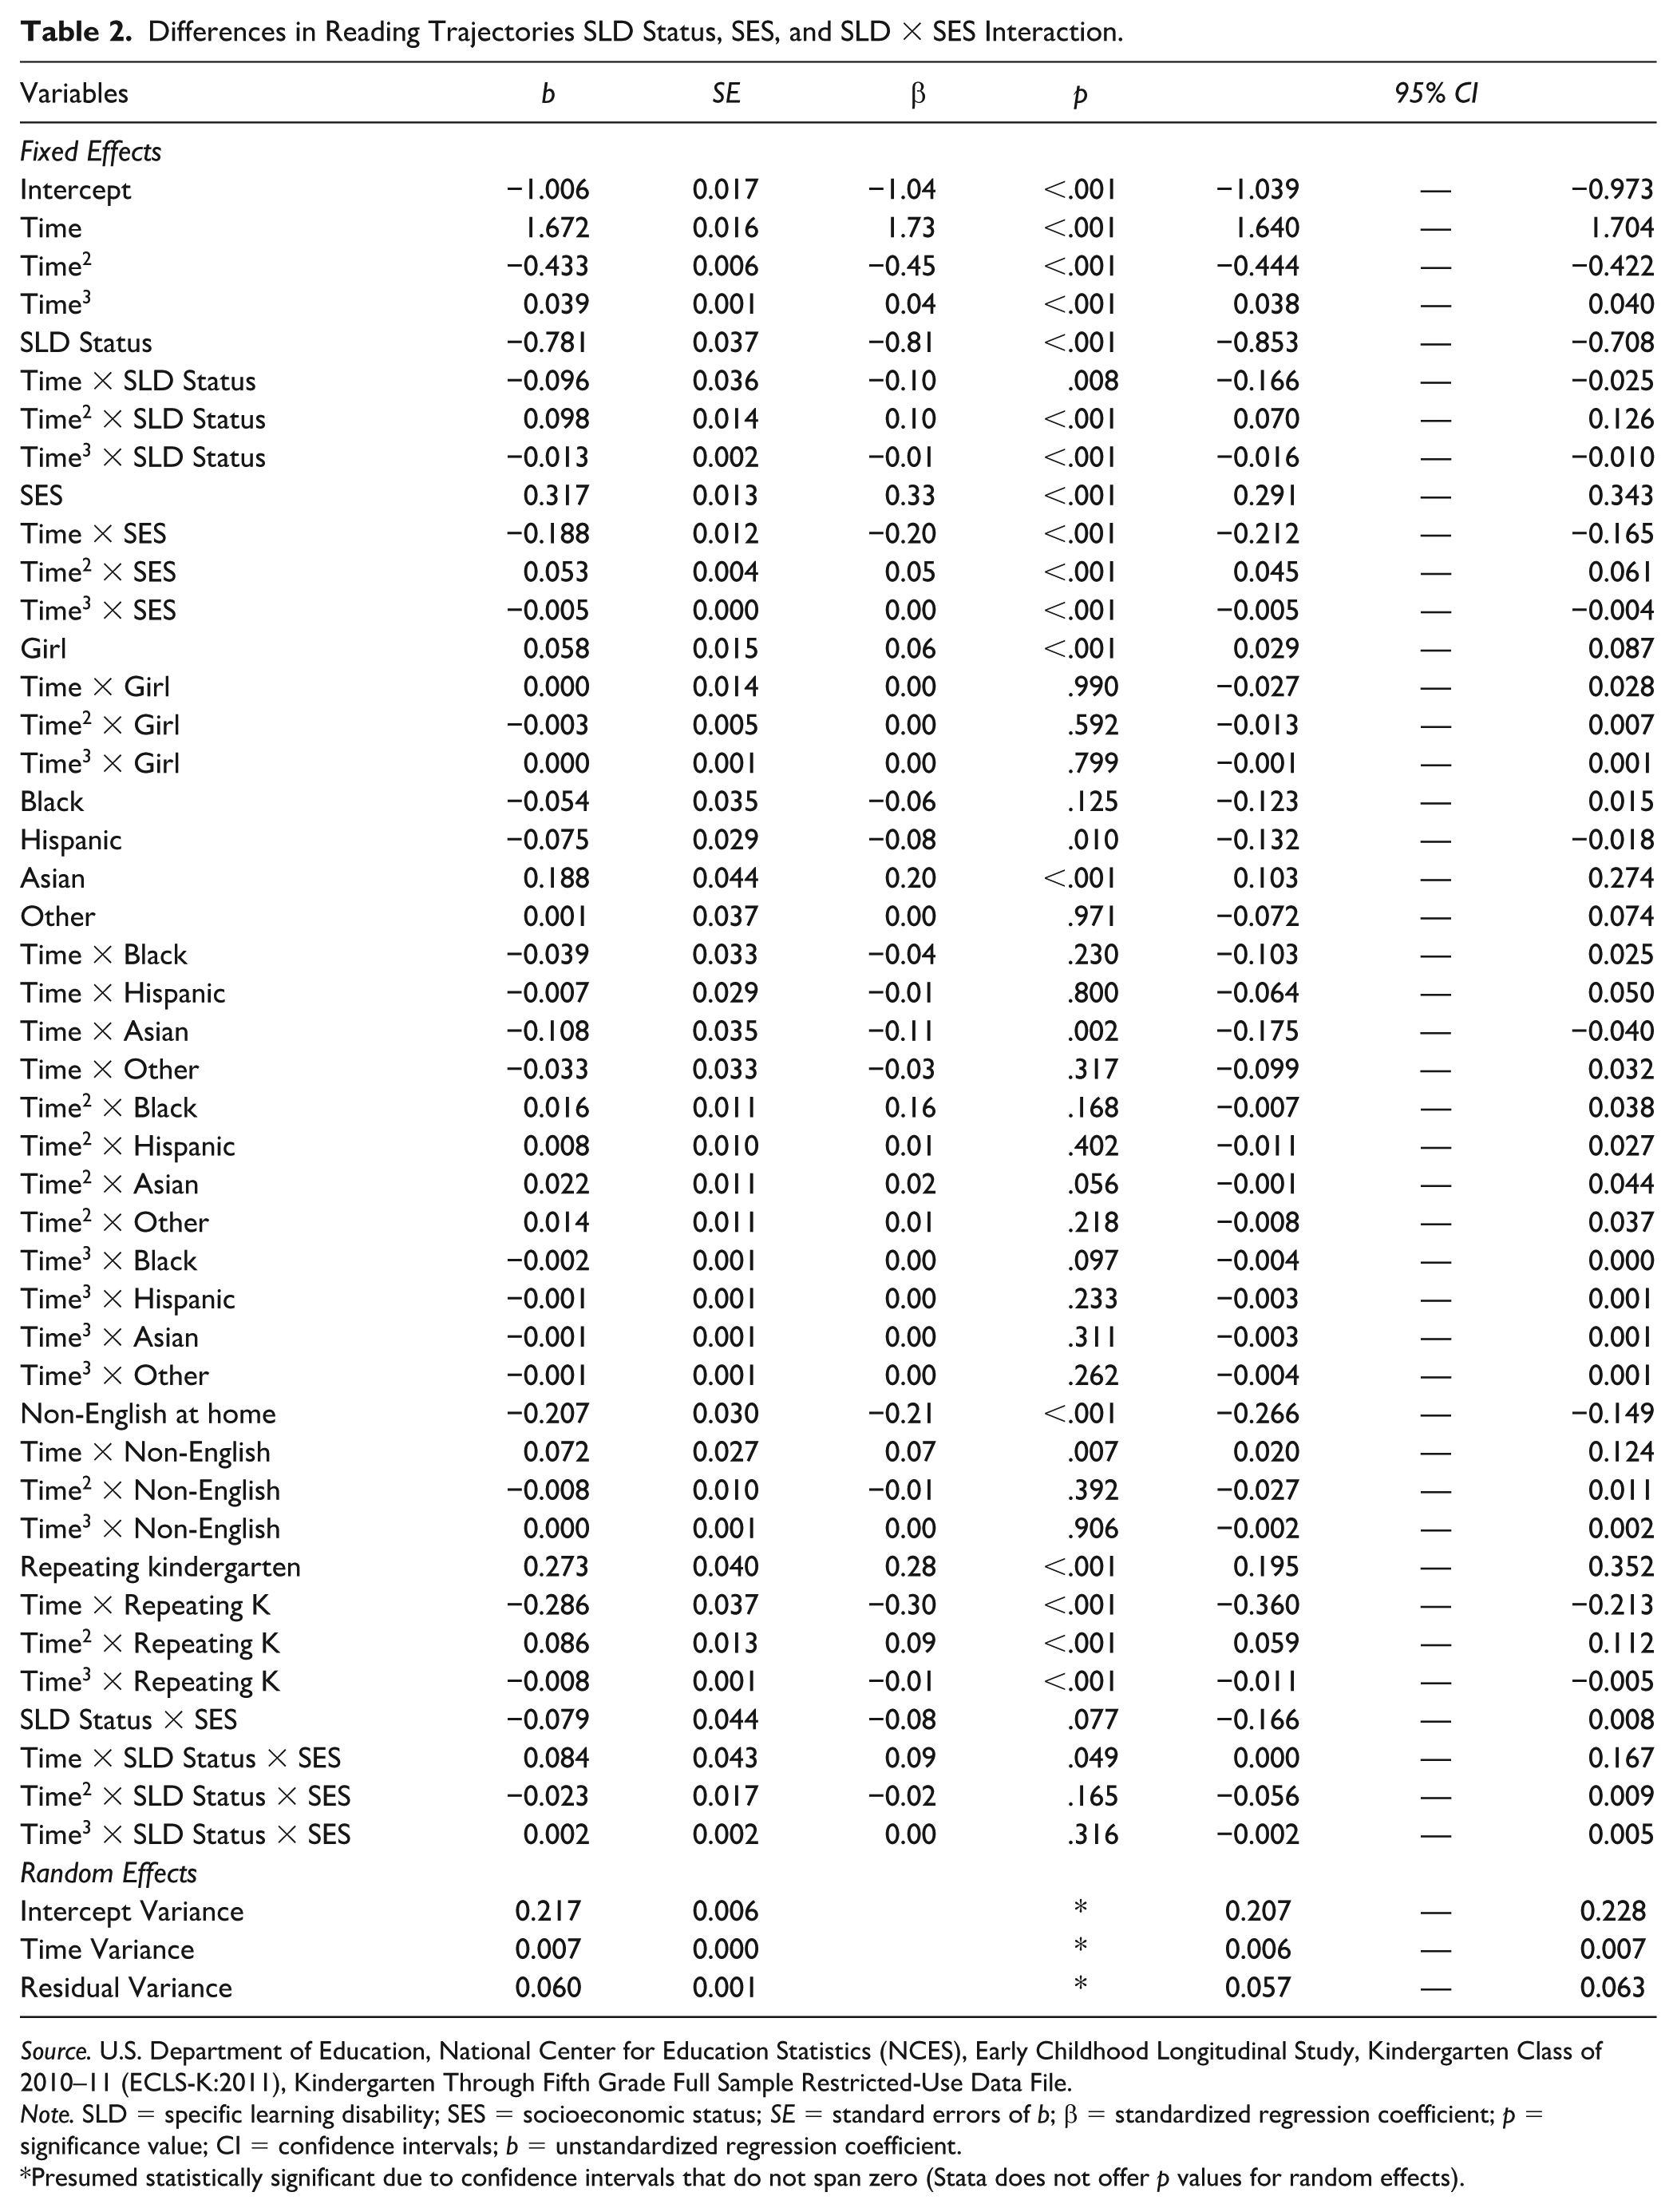
Source. U.S. Department of Education, National Center for Education Statistics (NCES), Early Childhood Longitudinal Study, Kindergarten Class of 2010–11 (ECLS-K:2011), Kindergarten Through Fifth Grade Full Sample Restricted-Use Data File.
Note. SLD = specific learning disability; SES = socioeconomic status; SE = standard errors of b; β = standardized regression coefficient; p = significance value; CI = confidence intervals; b = unstandardized regression coefficient.
Presumed statistically significant due to confidence intervals that do not span zero (Stata does not offer p values for random effects).
Reading
After controlling for additional explanatory factors, children with SLD still entered school performing more than three-quarters of a standard deviation lower than their peers without SLD (SLD Status: β = −0.81; see Table 2). SES differences in reading performance, regardless of SLD status, were relatively largest at the transition to schooling in kindergarten (SES β = 0.33, p < .001) and diminished thereafter, Time (Linear) × SES: β = −0.20; Time (Quadratic) × SES: β = 0.05; Time (Cubic) × SES: β = 0.00; all p < .001; see also Figure 3.
The two-way interaction between SLD and SES was marginally significant (β = −0.08, p = .077). In other words, there was limited evidence of differences in initial reading performance between students with and without disabilities as a function of SES. Post hoc analyses revealed that the gap between students from higher- and lower-SES backgrounds in the fall of kindergarten was slightly larger for SWOD (0.83 SD) than for students with SLD (0.75 SD; see Supplemental Table SA-4).
There was also a significant three-way interaction between SLD, SES, and linear time (β = 0.09, p = .049; see Table 2). Simple slopes analyses revealed that the rate of change in reading scores at the transition to schooling as a function of SES (i.e., the degree to which a one-unit incremental increase in SES was associated with an increase in reading theta scores at a given timepoint) was lower for children with SLD than SWOD (difference = −0.13 SD) and was marginally significant after adjusting for all possible timewise comparisons (see Supplemental Table SA-5). In other words, SES had a marginal effect on reading growth slopes at kindergarten entry. Thereafter, these differences in rates of change in reading diminished in magnitude and statistical significance between children with and without SLD.
Post hoc testing (see Supplemental Table SA-6) further examined the gap between higher-SES children with SLD (i.e., those with SES one standard deviation above the mean) and lower-SES children without disabilities (i.e., SES one standard deviation below the mean). This gap was the smallest at the transition to kindergarten (fall K: 0.26 SD), widened, and then narrowed again at the spring of fourth grade (0.29 SD). This timing coincided with the grades at which SES gaps were the largest with students with SLD and within SWOD (see Supplemental Table SA-4).
Math
Growth curves for mathematics revealed main effects of SLD and SES but no significant interaction effects (see Table 3). As expected, having an SLD was associated with lower math scores at kindergarten entry, while higher SES had a positive effect on math scores for SWOD at kindergarten entry. However, SES was not differentially associated with kindergarten entry math scores among students with and without SLD. Furthermore, there was no significant three-way interaction between SLD, SES, and time, indicating similar trajectories of growth regardless of SES. Post hoc simple slopes comparisons are available in Supplement A.
Differences in Math Trajectories by SLD Status, SES, and SLD × SES Interaction.
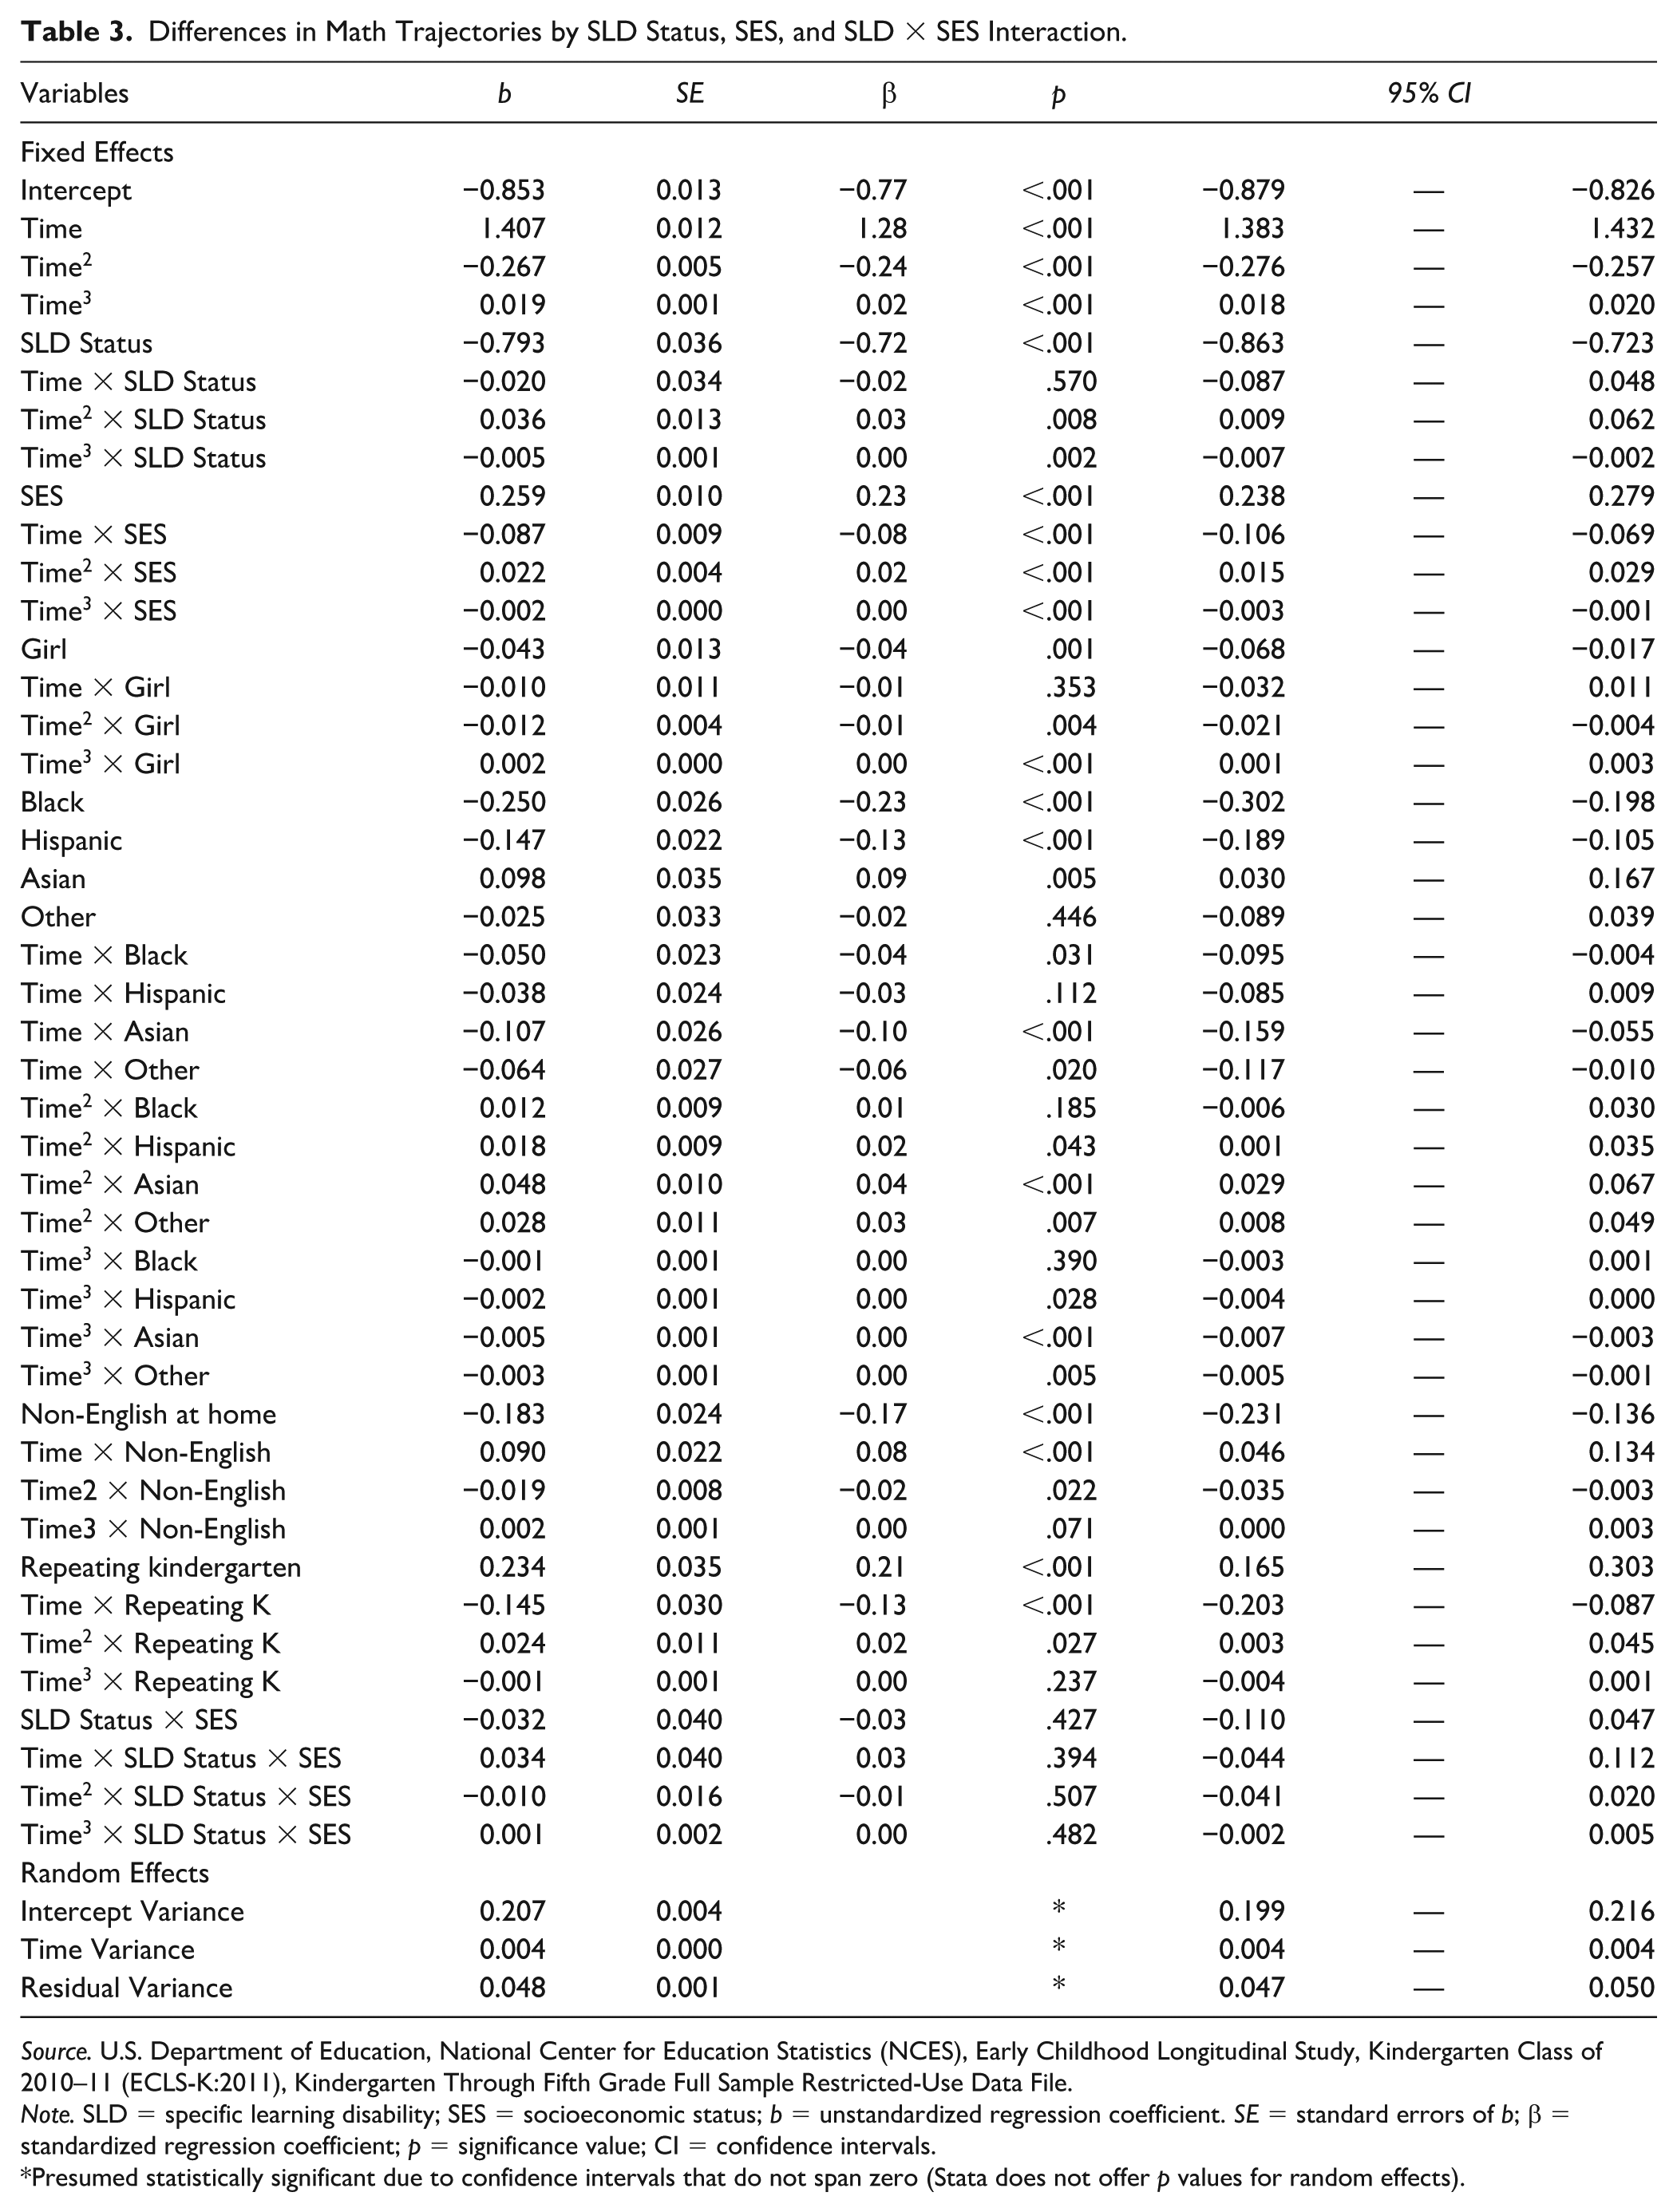
Source. U.S. Department of Education, National Center for Education Statistics (NCES), Early Childhood Longitudinal Study, Kindergarten Class of 2010–11 (ECLS-K:2011), Kindergarten Through Fifth Grade Full Sample Restricted-Use Data File.
Note. SLD = specific learning disability; SES = socioeconomic status; b = unstandardized regression coefficient. SE = standard errors of b; β = standardized regression coefficient; p = significance value; CI = confidence intervals.
Presumed statistically significant due to confidence intervals that do not span zero (Stata does not offer p values for random effects).
Discussion
The current study explored reading and math development in students with SLD as compared with students without learning disabilities from kindergarten through fifth grade using the nationally representative Early Childhood Longitudinal Study (ECLS-K:2011) dataset. Specific learning disability status at fifth grade and lower SES were each associated with lower achievement in reading and math at the start of kindergarten. However, the effect of SES on reading and math achievement largely did not differ as a function of SLD status. Put another way, findings indicated that having a learning disability and growing up with limited socioeconomic resources were each independent risk factors for reduced achievement. These risk factors were additive: students from lower-SES backgrounds who also had SLD were further disadvantaged than students from a single marginalized group (Hancock, 2007; Shifrer, 2023). However, the intersection of SLD and low SES did not result in a qualitatively different development trajectory than would be expected from either risk factor in isolation.
Achievement Gaps Are Present at Kindergarten Entry, Long Before SLD Diagnosis
Students who were identified with SLD by fifth grade performed substantially below their peers without disabilities in both reading and math at the start of formal schooling. This finding replicates and extends prior work with the earlier, nationally representative ECLS-K:1998 sample (Judge & Bell, 2011; Mattison et al., 2022; Sullivan et al., 2017) as well as other studies using state-wide data (Judge & Watson, 2011; Scammacca et al., 2020). Indeed, children’s average math and reading scores at kindergarten entry are a strong predictor of special education placement by fifth grade (Hibel et al., 2010).
This study differs from prior work in its retrospective characterization of SLD. Prior studies have used disparate methods for identifying students with a learning disability in nationally representative datasets. Morgan and colleagues (2011) studied students with SLD or a speech-language impairment as reported in kindergarten and subsequently examined reading and math growth over time. A challenge this poses is that SLDs in reading—the most commonly diagnosed SLD—are rarely identified prior to second or third grade, when a child has failed to make appropriate reading progress. Another approach was used by Mattison et al. (2022), who examined longitudinal trajectories among ECLS-K:1998 students identified with an SLD at any point by eighth grade, including those who had discontinued special education services. In contrast, the present study used a retrospective analysis of children who were receiving (and had not discontinued) special education services for SLD in fifth grade. The retrospective classification method allowed us to capture a representative sample of students with current and persistent learning difficulties.
Within our SLD sample, only 13% of students were identified in kindergarten or first grade, while the vast majority were identified for special education services in third grade or later. A comparison of early vs. late IEP receipt revealed no differences in mathematics trajectories, and a difference in reading trajectories at only one time point. Notably, we still observed stark differences in both math and reading skills between our SLD and SWOD samples at kindergarten entry and in each subsequent grade. These findings indicate persistent achievement differences that are measurable long before children begin to receive special education services.
Growth Trajectories Differ Between Students With and Without SLD
Growth in reading and math across elementary school is not linear. Prior studies have generally characterized growth trajectories with quadratic or piecewise functional forms, reflecting an initial steep increase at the start of schooling followed by a slowing rate of change (e.g., Kieffer, 2012; Kohli et al., 2015; Sullivan et al., 2017). Model testing in the present study revealed that growth in theta scores was better captured by a cubic functional form than a quadratic form (see Supplement B; Supplemental Figures SB1-SB3, Supplemental Table SB1). The cubic effect is most pronounced among SWOD, specifically for reading development, while the functional form for SLD appears more quadratic. Math development is also best captured by a cubic form, though the curvature is more subtle. We note again that our findings were consistent when using a quadratic functional form in both reading and math.
To illustrate the differences in reading growth trajectories between students with and without SLD, consider Aesop’s fable The Tortoise and the Hare. Students without SLD experienced steeper initial growth in reading (i.e., the Hare) than students with SLD. This rate of growth slowed for SWOD in the middle of elementary school before accelerating again around fifth grade. In contrast, students with SLD seemed to make slower but steadier progress in reading throughout fifth grade (i.e., the Tortoise). This, however, is where we diverge from Aesop’s fable: while reading growth “leveled off” less for students with SLD than for SWOD, this was not sufficient to fully close the gap between students with and without disabilities.
This growth pattern in reading aligns with important transitions in the literacy skills expected at each grade level. There is often a transition around third grade from an emphasis on word decoding (learning to read) toward a new emphasis on comprehension and acquiring academic knowledge through text (reading to learn; Chall, 1983). Students without learning disabilities demonstrate rapid growth in foundational reading skills in early elementary school. In contrast, students with SLD may require more explicit instruction and more practice to absorb new knowledge compared with their peers without learning disabilities (Hughes et al., 2017). Slower initial growth in this group may reflect their greater challenges in gaining basic decoding skills. However, students with SLD also make continued progress with less deceleration over time.
Strong foundational reading skills serve as a literacy “launch pad” as expectations increase. The growth curve for SWOD re-accelerates in fifth grade; this is also when reading instruction and assessment begin to focus more heavily on comprehension, particularly of nonfiction or informational text. Students with learning disabilities, on the contrary, may have a less stable “launch pad,” or experience a mismatch between their skill set and new curricular expectations.
Because the data collection period for the ECLS-K: 2011 ended at fifth grade, one open question is whether we might see this same acceleration occur later from students with SLD. Meta-analytic findings suggest that, on average, students with disabilities lag approximately 3 years behind SWOD in reading achievement (Gilmour et al., 2019). Future work with longitudinal data that continues into early adolescence could help to clarify whether, and to what extent, the gap between students with and without disabilities continues to widen after fifth grade, as well as whether students with SLD continue to make “slow but steady” progress in the transition to “reading to learn” and beyond.
SLD and SES Do Not Interact to Qualitatively Reshape Developmental Trajectories
Lower SES and SLD identification are two risk factors for low academic achievement that have generally been studied separately. Although both SLD diagnosis and low-SES background are independently associated with achievement gaps, it is still an open question as to whether the intersection of SLD and low SES may have a disproportionately negative impact on a given student. Is the combined risk greater than the sum of its parts?
We find limited evidence for an interaction between SLD status and SES in reading, and no evidence for an interaction in math. Students with SLD, even those from a higher-SES background, score significantly lower at all timepoints than SWOD, even relative to SWOD from lower-SES backgrounds. However, there is limited evidence to suggest that reading performance may be differentially affected by SES at the transition to schooling for students without disabilities. That is, the SES gap in reading is slightly larger in the fall of kindergarten for SWOD than for students with SLD. Moreover, SES is marginally associated with greater reading growth in the fall of kindergarten for SWOD than for students with SLD. After the initial transition to schooling, SES has a similar effect on the rate of change in the reading skills of students with and without disabilities.
Prior work, including numerous studies using the earlier ECLS-K:1998, have suggested SES differences in initial learning trajectories may narrow the socioeconomic achievement gap in early elementary school (Kieffer, 2012; Woods et al., 2023; Wu et al., 2014). The present study similarly observes a narrowing of the SES gap across timepoints. Building on this prior work, our results suggest that this effect may be driven by SWOD. One possible interpretation is that high SES is initially more protective in reading for SWOD than for students with SLD. In other words, higher SES, leading up to the start of school in particular, confers a larger advantage to SWOD compared with students with SLD (though we do not have data to evaluate home language or literacy environment to further explore mechanisms). Alternatively, the consequences of socioeconomic disadvantage may be less impactful for reading development at the transition to schooling among students with SLD. Nevertheless, the steeper initial growth for lower-SES SWOD is not sufficient to close the reading gap with their higher-SES peers, nor is the slow but steady progress made by students with SLD sufficient to close the gap with SWOD. Future research should further investigate drivers of this interaction.
Broader Implications
Gaps in achievement—and in particular, lower academic performance from vulnerable students—are a major societal, educational, and familial concern. In the United States, the federal Individuals with Disabilities Education Act (IDEA, 2004) ensures educational support for students with disabilities to have access to free and appropriate public education. It is critically important that community members including researchers, educators, and policy makers understand both initial differences at school entry and learning trajectories over time to assess the success of these programs. Furthermore, we must understand the intersection of risk factors that may inform where additional identification, assessment, and/or intervention is warranted.
The current study reveals early gaps in reading and math achievement in relation to both SLD and SES that are persistent over the course of elementary school. Our findings are consistent with prior work that has revealed that initial gaps are difficult to overcome, and remain relatively stable over time, on average (e.g., Schulte et al., 2016; Stevens et al., 2015). The achievement gaps present in the fall of kindergarten are a powerful reminder that children’s risk for academic challenges precedes formal schooling. Risk factors may be genetic (i.e., high heritability of reading disorders; Church et al., 2021; Snowling & Melby-Lervåg, 2016; Willcutt et al., 2010) and/or environmental (i.e., differences in children’s access to learning resources; Catts & Petscher, 2022; Grigorenko et al., 2020). These findings point to the importance of early academic screening, and broader supports for students who are underserved within current educational systems. Targeted early intervention and well-designed summer programming (Christodoulou et al., 2017, 2024) for students at risk for low achievement could potentially help to reduce gaps in achievement at school entry and beyond. Early intervention for at-risk learners is associated with optimal long-term outcomes (Lovett et al., 2017); importantly, early entry into special education seems to be equivalently advantageous for high- and low-SES students (Ehrhardt et al., 2013). At the same time, there is often a substantial gap between when a student is flagged with learning difficulties to when they receive changes to their education plan. On average, 13.5 months pass between the time a child is identified with reading challenges to the time that IEP-based changes to the child’s education are implemented, resulting in critical learning time lost (Al Dahhan et al., 2021). Additional research-practice partnerships that center around the strengths of underserved learners are needed to further explore the intersection of risk and inform targeted assessment strategies and educational interventions.
Limitations
An important limitation of the current study is that the SLD label in the ECLS-K:2011 dataset does not specify whether a child had learning difficulties in literacy, mathematics, written expression, or more than one academic domain. This label is based on a special educator report and not on school records or test scores. We thus cannot disaggregate results for students with reading- or math-specific challenges. This limitation would be of greater concern if we had discovered significant differences between our growth models for reading versus math. Nevertheless, it will be important for future work to disaggregate SLD labels, particularly given that reading and math follow distinct, domain-specific developmental trajectories (e.g., Little et al., 2021, 2022).
It may also be valuable to consider growth trajectories of children with a single disorder as compared with multiple learning challenges or neurodevelopmental differences. Children with co-occurring SLD in reading and developmental language disorder (DLD) exhibit math performance significantly below their peers with a single disorder (Duff et al., 2023). Relatedly, reading performance is lower in children with co-occurring SLDs in reading and math than in children with a reading disorder alone (Marks et al., 2024). We might therefore anticipate substantial variability within the SLD group independent of SES. Guided by prior work (e.g., Connors et al., 2025; Duff et al., 2023), we might expect higher achievement (but similar growth trajectories) among students with SLD in math only as compared with students with SLD in reading only, and the lowest achievement in students with co-occurring SLDs across domains. It remains an open question whether interactions between SLD and SES may be more pronounced specifically in an individual’s area of weakness.
Another possible limitation is that the composite SES variable may inadvertently mask nuanced differences in how specific components of SES (e.g., household income, parent education, etc.) uniquely relate to reading or math trajectories. Furthermore, the distribution of SES varies slightly between the SWOD and SLD groups (see Supplemental Figure SB-4). Although the distribution of “lower SES” is comparable between the SWOD and SLD groups, the spread of values at the top of the distribution is wider among the SWOD group. Future research should strive to illuminate the specific roles of income, parental education, familial resources, and school resources as they influence academic development over time. Finally, we note that our model did not include random effects for quadratic or cubic time, as including these terms prevented convergence. These terms might be informative in future studies.
Conclusion
Vulnerable learners may start school at risk for low achievement due to numerous intersecting factors. The current study examined how the interaction of two of these factors—SLD and SES—influenced children’s reading and math development. Results indicate significant main effects of both SLD and SES, but limited evidence of an interaction. The combination of SLD diagnosis and limited socioeconomic resources did not lead to significantly different growth trajectories in reading or math, resulting in largely parallel achievement gaps from kindergarten entry through fifth grade.
Supplemental Material
sj-docx-1-ldx-10.1177_00222194251391828 – Supplemental material for Early Reading and Math Developmental Trajectories: Examining Influences of Specific Learning Disabilities and Socioeconomic Status
Supplemental material, sj-docx-1-ldx-10.1177_00222194251391828 for Early Reading and Math Developmental Trajectories: Examining Influences of Specific Learning Disabilities and Socioeconomic Status by Rebecca A. Marks, Adrienne D. Woods, Laura Mesite, Annie B. Fox and Joanna A. Christodoulou in Journal of Learning Disabilities
Supplemental Material
sj-docx-2-ldx-10.1177_00222194251391828 – Supplemental material for Early Reading and Math Developmental Trajectories: Examining Influences of Specific Learning Disabilities and Socioeconomic Status
Supplemental material, sj-docx-2-ldx-10.1177_00222194251391828 for Early Reading and Math Developmental Trajectories: Examining Influences of Specific Learning Disabilities and Socioeconomic Status by Rebecca A. Marks, Adrienne D. Woods, Laura Mesite, Annie B. Fox and Joanna A. Christodoulou in Journal of Learning Disabilities
Footnotes
Acknowledgements
We thank Dr. Joseph McIntyre for his support of this project and Dr. Michael Medina for his critical reading of the manuscript.
CRediT Author Statement
RAM: Writing—original draft (lead), Writing—review & editing (lead); ADW: Methodology (supporting), Formal analysis (equal), Review & editing (supporting); LM: Conceptualization (equal), Methodology (lead), Formal analysis (equal), Writing—original draft (supporting), Writing—review & editing (supporting); ABF: Methodology (supporting), Formal analysis (equal), Visualization (lead), Writing—review & editing (supporting); JAC: Conceptualization (equal), Resources (lead), Methodology (supporting), Writing—original draft (supporting), Writing—review & editing (supporting), Supervision (lead).
Declaration of Conflicting Interests
The authors declared no potential conflicts of interest with respect to the research, authorship, and/or publication of this article.
Funding
Authors R.A.M. and J.A.C. were funded by NSF Division of Research on Learning Award #1644540. R.A.M. was additionally supported by the Chan Zuckerberg Initiative’s Reach Every Reader grant and NIH F32 HD110967. J.A.C was supported by NIH R15 HD102881.
Data Availability Statement
References
Supplementary Material
Please find the following supplemental material available below.
For Open Access articles published under a Creative Commons License, all supplemental material carries the same license as the article it is associated with.
For non-Open Access articles published, all supplemental material carries a non-exclusive license, and permission requests for re-use of supplemental material or any part of supplemental material shall be sent directly to the copyright owner as specified in the copyright notice associated with the article.