
Abstract
Data-based instruction (DBI) is a process in which teachers use progress data to make ongoing instructional decisions for students with learning disabilities. Curriculum-based measurement (CBM) is a common form of progress monitoring, and CBM data are placed on a graph to guide decision-making. Despite the central role that graph interpretation plays in the successful implementation of DBI, relatively little attention has been devoted to investigating this skill among special education teachers. In the present study, we examined the data decisions of 32 U.S. pre-service special education teachers (29 females and 3 males). Participants viewed data presented sequentially on CBM progress graphs and used a think-aloud procedure to explain their reasoning each time they indicated they would make instructional changes. We also asked participants to make the same type of decisions in response to static CBM progress graphs depicting 10 weeks of data. Overall, there was inconsistency in pre-service teachers’ responses related to when or why they would make an instructional change. Decisions were often influenced by graph-related features, such as variability in the data. Furthermore, responses suggested misunderstandings that led to premature instructional change decisions and reliance on individual data points.
Keywords
Students with or at risk for learning disabilities (LD) often require intervention supports that are more intensive and individualized than their peers without disabilities. Data-based instruction (DBI) is an approach in which teachers collect and use student progress data to evaluate the effects of instruction and guide decisions about when to adjust instruction (Deno, 1985; National Center on Intensive Intervention [NCII], 2013). Also referred to as data-based individualization (NCII, 2013) or data-based program modification (Deno, 1985), research has demonstrated that DBI results in significant improvements in the academic performance of students with LD (Filderman et al., 2018; Jung et al., 2018) and even larger effects associated with greater use of data (Fuchs et al., 2021).
Concerningly, investigations of teachers’ data use have suggested that they struggle with the essential element of DBI—making instructional decisions based on data. In particular, teachers often have difficulty interpreting graphs that display student progress data (Espin et al., 2017; van den Bosch et al., 2017; Wagner et al., 2017; Zeuch et al., 2017). Despite the central role that graph interpretation plays in the successful implementation of DBI (NCII, 2013), relatively little attention has been devoted to investigating special education teachers’ graph interpretation and associated decision-making. In the present study, we sought to explore the data decisions of pre-service special education teachers in response to simulated progress graphs.
Student Progress Data
The most common form of assessment data used within DBI is curriculum-based measurement (CBM; Deno, 1985). CBM is an ongoing progress monitoring framework used to evaluate the effectiveness of instruction for students with LD or those receiving intensive forms of support (Deno, 1985; Deno & Fuchs, 1987). Extensive research on CBM has indicated that when teachers regularly collect CBM data and use a structured set of decision rules to interpret the data, students demonstrate stronger achievement compared with students of teachers do not use such a process (Stecker et al., 2005). Additionally, teachers who used CBM data are more aware of students’ progress and demonstrate greater structure in their teaching, write more specific instructional plans, and tend to set more ambitious goals for their students (Fuchs & Fuchs, 1989; Stecker et al., 2005).
To implement CBM, teachers measure student progress on a frequent (e.g., weekly) basis and place scores on a graph to depict progress. The CBM graph guides teachers’ data-based decision-making (see procedures described in Filderman & Toste, 2018; Stecker & Lembke, 2011). To use a graph to make instructional decisions, the teacher first implements an instructional program and then begins collecting data. The teacher regularly inspects the graph to compare the student’s actual rate of growth to their expected rate of growth. A student’s trend line that is consistent with the goal line suggests the intervention is having its intended effect and should continue. On the contrary, if the students’ rate of growth is lower than expected, it signals a need for an instructional change. The teacher then adjusts the intervention and continues to collect data to evaluate the effects. Other types of decisions might include continuing to collect data because not enough data points have been collected or data are too variable to confidently make a decision; adjusting a goal either because it was too ambitious or not ambitious enough; or reducing the intensity of an intervention because a student has met their goal. By using CBM data to continuously evaluate and adjust instruction, teachers can ensure that students are receiving appropriately aligned and intensified intervention support.
Two types of decision frameworks have been traditionally recommended for making instructional decisions with CBM data: point rules and slope rules (Ardoin et al., 2013; NCII, 2013). When using a point rule approach, the student’s most recent three or four consecutive data points are compared with the goal line. All of these consecutive data points being below the goal line suggests the need for an instructional change. The slope rule approach involves comparing the steepness of the student’s trend line (i.e., slope) to the goal line. A trend line that is less steep than the goal line suggests an instructional change is needed because the student’s rate of growth is such that they will fall short of their goal. On the contrary, when the trend line is as steep or steeper than the goal line, it is an indication the current intervention is adequately supporting the student’s growth.
In short, the use of CBM data to adjust instruction to meet students’ needs is an essential part of DBI. There are two key decision points in DBI: (a) deciding whether to adjust instruction, and (b) deciding how to adjust instruction. To determine whether to adjust instruction, teachers must accurately evaluate CBM progress graphs. Then, to determine how to adjust instruction, teachers must identify appropriate adjustments by analyzing the student’s instructional program and learning characteristics. However, before this can happen, teachers must be able to accurately identify whether an instructional change is necessary—this requires proficiency in using data to inform decision-making. In other words, they must accurately read and interpret CBM progress graphs.
Graph Interpretation for Instructional Decision-Making
On the face of it, CBM progress graphs are simple; however, research on graph comprehension in general reveals that even simple graphs can be challenging for adults to read and interpret (Friel et al., 2001). Previous research has indicated that teachers often are unable to produce complete and coherent descriptions of CBM graphs, do not inspect CBM graphs in a sequential manner, and often fail to attend to relevant features of the graph (Espin et al., 2017; van den Bosch et al., 2017; Wagner et al., 2017; Zeuch et al., 2017).
Toste and colleagues (2024) conducted a systematic review of studies focused on individuals’ interpretation of graphs that display individual student data collected from academic program monitoring measures. More than 60% of the participants across the 21 included studies were teachers. In studies wherein participants were asked to examine a graph and determine whether a student was making adequate progress, graphs that were more difficult to interpret were those that included fewer data points, more variability in the data, extreme values, shifts in data, and small differences in slope values (Espin et al., 2018; Klapproth, 2018; Newell & Christ, 2017; Van Norman & Christ, 2016). Therefore, the common characteristics of students with LD and their responsiveness to intervention, including slow or inconsistent progress (Christ et al., 2010; Deno et al., 2001; Nese et al., 2012), and variability in performance over time (Ardoin et al., 2013), are factors that make graphs more difficult for teachers to interpret correctly.
In previous research, graph interpretation skills have been typically investigated by asking participants to evaluate and make decisions based on a complete, static CBM progress graph (i.e., a graph containing at least 8 data points, reflecting approximately 8 weeks of instruction). Indeed, Toste et al. (2024) found that all but one of the 21 studies included in their review displayed static graphs as stimuli for participants, with graphs displaying anywhere from 4 to 60 data points. One study manipulated the display condition so that participants were shown either a static graph or a graph wherein the data appeared sequentially with multiple data points collected each week (Gotcher, 2011). The use of static graphs potentially limits our understanding of how individuals make data decisions; it does not reflect how progress data are used in real practice, wherein teachers collect, graph, and interpret data on an ongoing basis. Thus, our understanding of special education teachers’ decision-making skills is limited by a lack of studies that have simulated the conditions under which CBM data are actually used.
Purpose of the Present Study
This study investigated special education pre-service teachers’ interpretations of CBM reading progress graphs. Across previous studies of graph interpretation, less than 2% of the total participants were special education teachers (Toste et al., 2024)—although this is the group most commonly responsible for the delivery of intensive interventions for students with disabilities. Although CBM data may serve various purposes, we focus on decision-making within DBI wherein teachers engage in an ongoing process of using CBM progress data to inform instruction.
Thus, participants were asked to make data-based decisions in response to sequential progress data and displayed one data point at a time, similar to how they would collect and view data in real life. We focused on the decision of whether to continue or change instruction as each data point was added to the graph. When a participant indicated that they would make an instructional change, we asked them to use a think-aloud procedure similar to the method used by van den Bosch et al. (2017) to explain the reasoning behind their decision. Finally, we asked participants to make the same type of decisions in response to static CBM progress graphs depicting ten weeks of complete data. In sum, we sought to address the following three research questions:
Method
Participants
Data were collected from 32 pre-service teachers recruited from across the United States. All participants were enrolled in university-based special education teacher preparation programs, with the majority in undergraduate programs (n = 30). Participants reported their current year in their training program: 12 juniors (third year of undergraduate program), 9 seniors (fourth year), 9 sophomores (second year), and 2 graduate teacher preparation program. The majority of participants identified as female (n = 29; 90.6%). Participants identified as White (n = 13; 40.6%), Hispanic/Latinx (n = 11; 34.4%), Black or African American (n = 6; 18.8%), and one person identified each as Asian and multiracial (n = 2; 6.2%). Although participants were recruited from across the United States, the majority resided in Texas (n = 29) distributed between two institutions (22 from one and 7 from the other). The remaining three participants resided in Oregon, Pennsylvania, and Virginia.
With regard to prior training, participants were asked to report whether they had completed coursework that included a focus on (a) how to use student assessment data to make instructional decisions or (b) CBM, specifically. Most participants reported having taken at least one course on using data to inform instructional decisions (87.5%; M = 1.77 courses, SD = 2.07) and at least one course that explicitly covered CBM (90.1%; M = 1.41 courses, SD = 1.01).
Procedures
Participants were recruited through special education listservs, social media, and professional networks (e.g., teacher preparation program coordinators). Respondents’ information was screened by the primary author to ensure that they were pre-service teachers enrolled in university-based programs in the United States. Each participant was sent an electronic version of the consent letter and a link to schedule their individual study session.
Due to the onset of the COVID-19 pandemic, the majority of sessions were conducted via videoconference (n = 26; 81.3%), although six sessions with local participants had already been conducted in person in a quiet meeting room on campus. All sessions were audio-recorded for the purpose of transcription and coding reliability. Each study session began with a verbal explanation of the study procedures and obtaining informed consent, followed by a simulation activity wherein participants were asked to view and interpret student progress graphs.
The simulation activity is further described in the next section. Finally, participants were provided with a link to a Qualtrics survey wherein they provided demographic information. Total session times ranged from 14:50 to 33:06 min, with an average length of 20:42 min across participants.
Graph Interpretation Simulation Activity
Creation of Materials
We created four datasets for hypothetical student cases. The graphs displayed oral reading fluency (ORF) data (i.e., words read correct per minute [WCPM]). We held the initial score, target rate of growth, and year-end goal constant; all cases began intervention with a baseline score of 40 WCPM, and all had an expected rate of growth of 2 WCPM each week, resulting in a target end-of-year goal of 112 WCPM across 35 weeks of intervention. From this dataset, we generated CBM progress graphs for the four different student cases.
Data points for the four student cases were randomly generated based on a pre-defined rate of growth (i.e., on track or not on track to meet goal) and degree of variability (i.e., low or more typical variability). We modeled “typical” variability for this study as ±12 points around a linear slope. We based this decision on previous research that observed standard errors generally ranging from 10 to 15 points per occasion on commercial CBM ORF passage sets with students in middle to late elementary grades (Ardoin & Christ, 2009; Christ & Silberglitt, 2007), and differences in average scores between probes in a grade-level set (i.e., passage with highest mean WCPM minus passage with lowest WCPM) ranging up to 27 WCPM (Cummings et al., 2013). In contrast to typical variability, we modeled “low” variability as ±6 points around a linear slope. This low level of variability is not common in practice but is frequent in examples used in CBM and progress monitoring training materials (e.g., The IRIS Center, 2015; NCII, n.d.).
Case 1 depicted a student who was on track to meet their end-of-year goal and with low variability in the data. Data were generated to represent an average of 2 WCPM gain per week with ±6 points around a linear slope. This case also included one outlying extreme low data point. Case 2 represented a student who was not on track to meet their end-of-year goal and data reflected a typical degree of variability. In this case, the student had a rate of growth that averaged 0.5 WCPM gain per week with ±12 points around a linear slope. Case 3 depicted a student who was on track to meet their goal, and their data showed a typical range of variability. This student had an average rate of growth of 2 WCPM gain per week and ±12 points around a linear slope. Finally, Case 4 represented a student who was not on track to meet their goal, and variability in the data was low; this student had an average rate of growth of 0.5 WCPM of gain per week and variability of ±6 points around linear slope.
Tutorial
Participants were informed that they were going to look at four student cases, and all students were third grade boys identified with a reading disability who had similar academic profiles and were receiving supplemental reading intervention (e.g., Tier 2) at school. They were told that the progress of each student was being monitored once per week with CBM ORF, and each case would represent a total of 10 weeks of student progress data.
Next, participants were provided with a brief tutorial on the elements of a CBM progress graph to ensure that they had access to consistent terminology when describing the graphs and explaining the rationale for their decisions. The tutorial began by displaying a sample graph with a full year of progress data and participants were told “you will be asked to look at student progress data on a graph like this one.” They were told that each data point represented a student’s score, measured as words read correct per minute (WCPM), on a CBM ORF. The researcher then displayed a series of animated slides to identify and label the various components of the graph: baseline score (e.g., data collected to measure performance prior to the start of the intervention); data points (e.g., weekly ORF assessment scored as WCPM); the student’s goal (e.g., calculated end-of-year target); goal line (e.g., expected rate of growth for student will reach goal); and the student’s trend line (e.g., observed or actual rate of growth). It was then explained that participants would see a series of slides in which data points will appear as they are being collected—week by week.
Graph Interpretation
First, participants viewed graphs for the four student cases with data presented sequentially; cases were always presented in the same order (i.e., Case 1 to Case 4) to hold constant any potential influence of previous cases on participants’ responses. Participants were shown the graph with one data point, followed by two data points on the next slide, and so forth. After each new data point, we asked participants how they might interpret the data. They were given three response options: (a) continue with the intervention; (b) make a change to the intervention; or (c) I don’t know, which they were asked to select only if they were not sure how to interpret the graph to inform their decision. Participants were also told that, for each new data point, they should consider the new data point together with the previous data collected—that is, ignoring any previous decisions, consider their response based on the currently displayed data points. If the participants responded that they would make a change, they were asked to explain what led them to make this decision.
Finally, participants were shown four static graphs with 10 weeks of data (see Figure 1). These graphs included the same generated data for Cases 1 through 4 described earlier; however, participants were not informed that these complete graphs were the same as those that they had been viewing sequentially. The researcher explained that each graph included individual student data that a teacher had collected weekly, but only viewed after 10 weeks. Based on the displayed graph, participants were asked whether they would have made an instructional change for this student—and if so, to indicate the date when that instructional change should have happened.
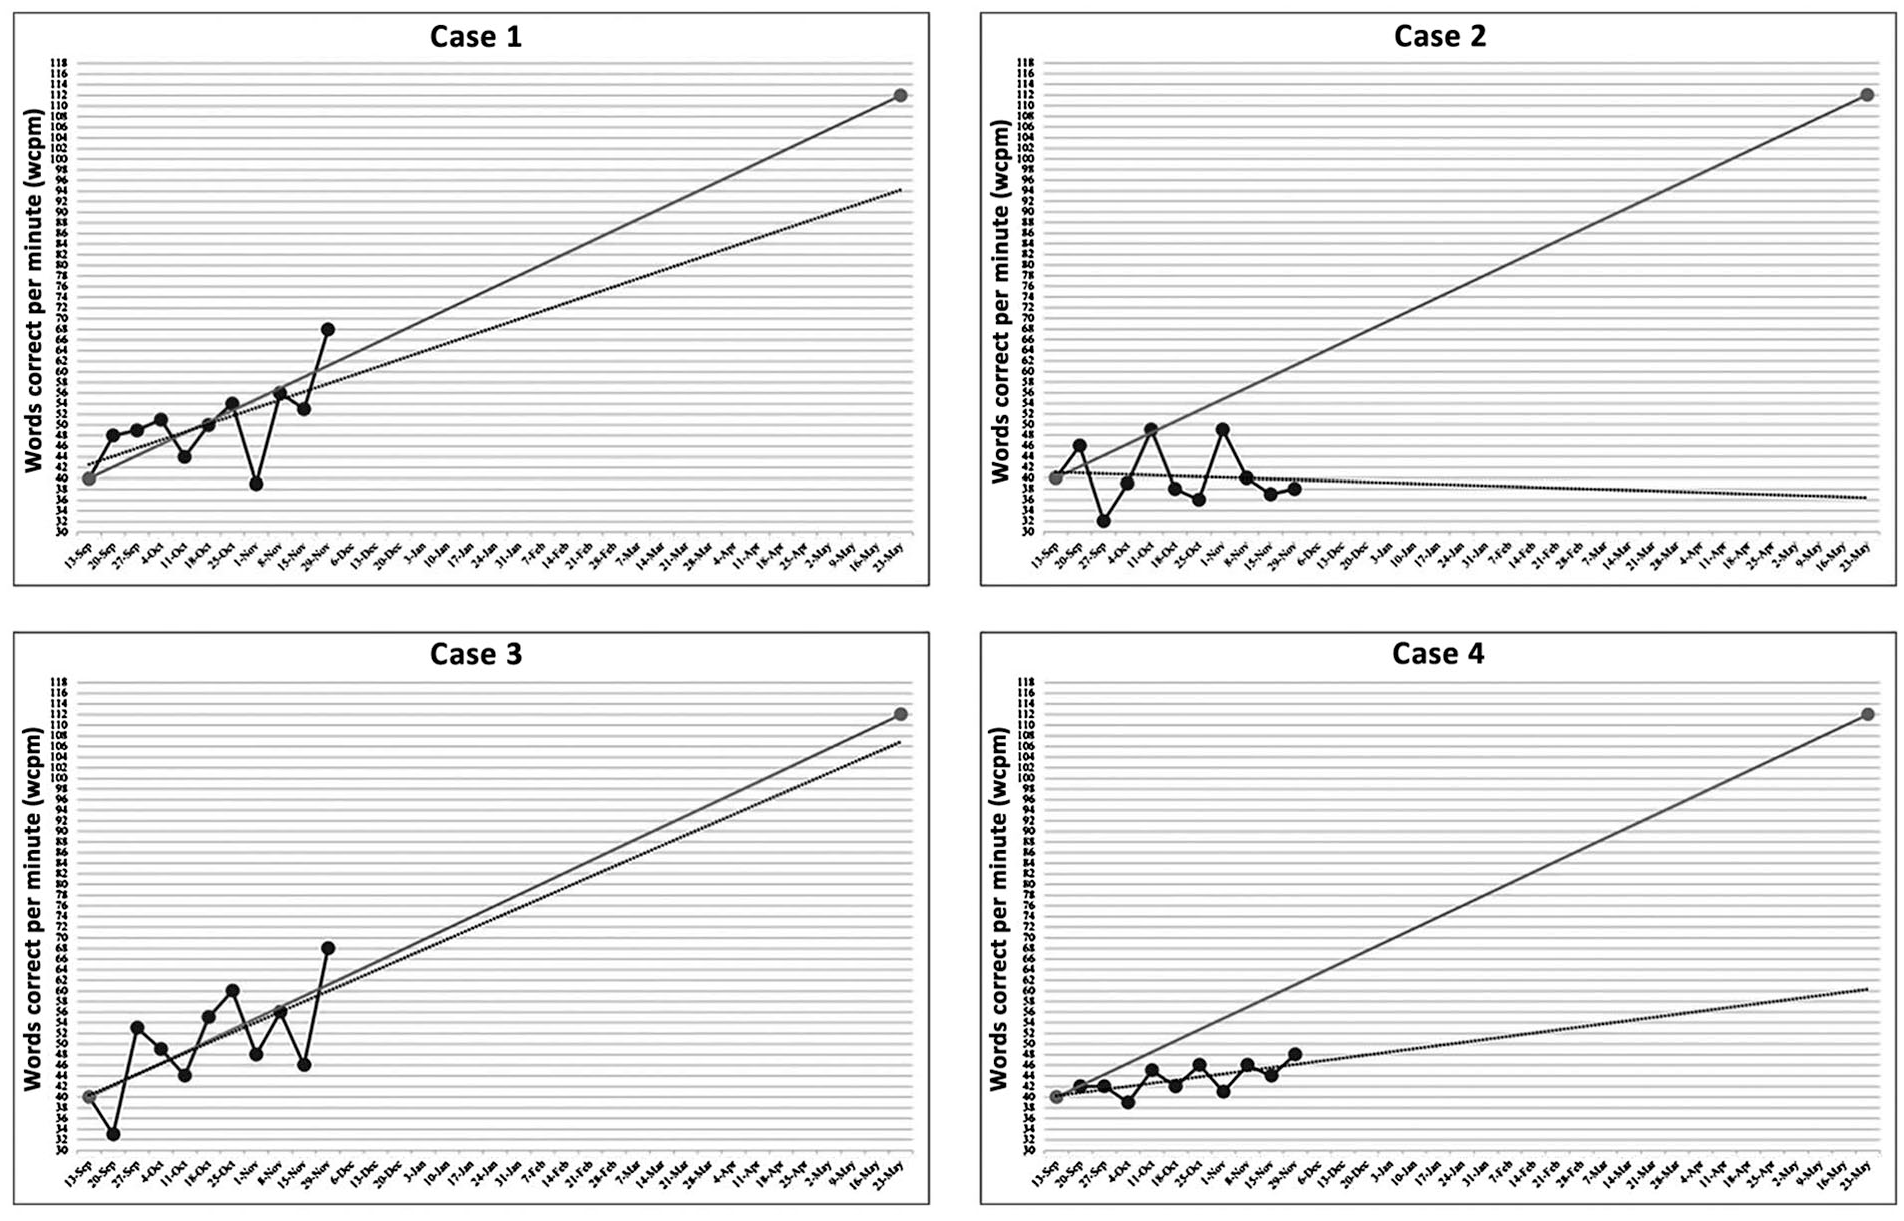
Curriculum-Based Measurement Progress Graphs Generated for Four Hypothetical Cases (10 Weeks)
Data Sources
We collected three sources of data based on participants’ completion of the simulation activity. First, we examined participant responses for each data point during the sequential graph interpretation. This included 40 responses per participant (i.e., 10 data points for each of the four cases). Second, we coded all think-aloud responses provided during sequential graph interpretation. Participants provided a think-aloud response only when they indicated that they would make a change in response to one of the 40 data points (4 cases × 10 weeks) in the sequential graph interpretation activity. For example, responses may have included rationale such as “Now it’s dropped way further down under the orange line.” Finally, we examined participant graph interpretation responses when shown the four complete, static graphs.
Coding Procedures
Think-aloud responses were transcribed verbatim from audio recordings. The transcribed text was then coded by three members of the author team, informed by coding procedures used in previous graph interpretation work (i.e., Espin et al., 2017; van den Bosch et al., 2017). Led by the primary author, the initial codebook was developed collaboratively while coding two participant responses. We established reliability through a two-step process with the same three researchers. First, we independently coded two participant responses and then came together to compare coding decisions. We divided the number of agreements by the number of total possible decisions, resulting in 94% agreement across all codes. The codebook was further refined at this point, which included merging or adding codes, expanding variable descriptions, and documenting examples for each code. Next, we independently coded two additional participant responses and obtained 96.7% agreement; we met to reach a consensus on any discrepancies (e.g., codes that did not have agreement across all three researchers). Finally, each of the remaining 28 participant think-aloud responses were independently coded by two researchers and any discrepancies were discussed to reach consensus.
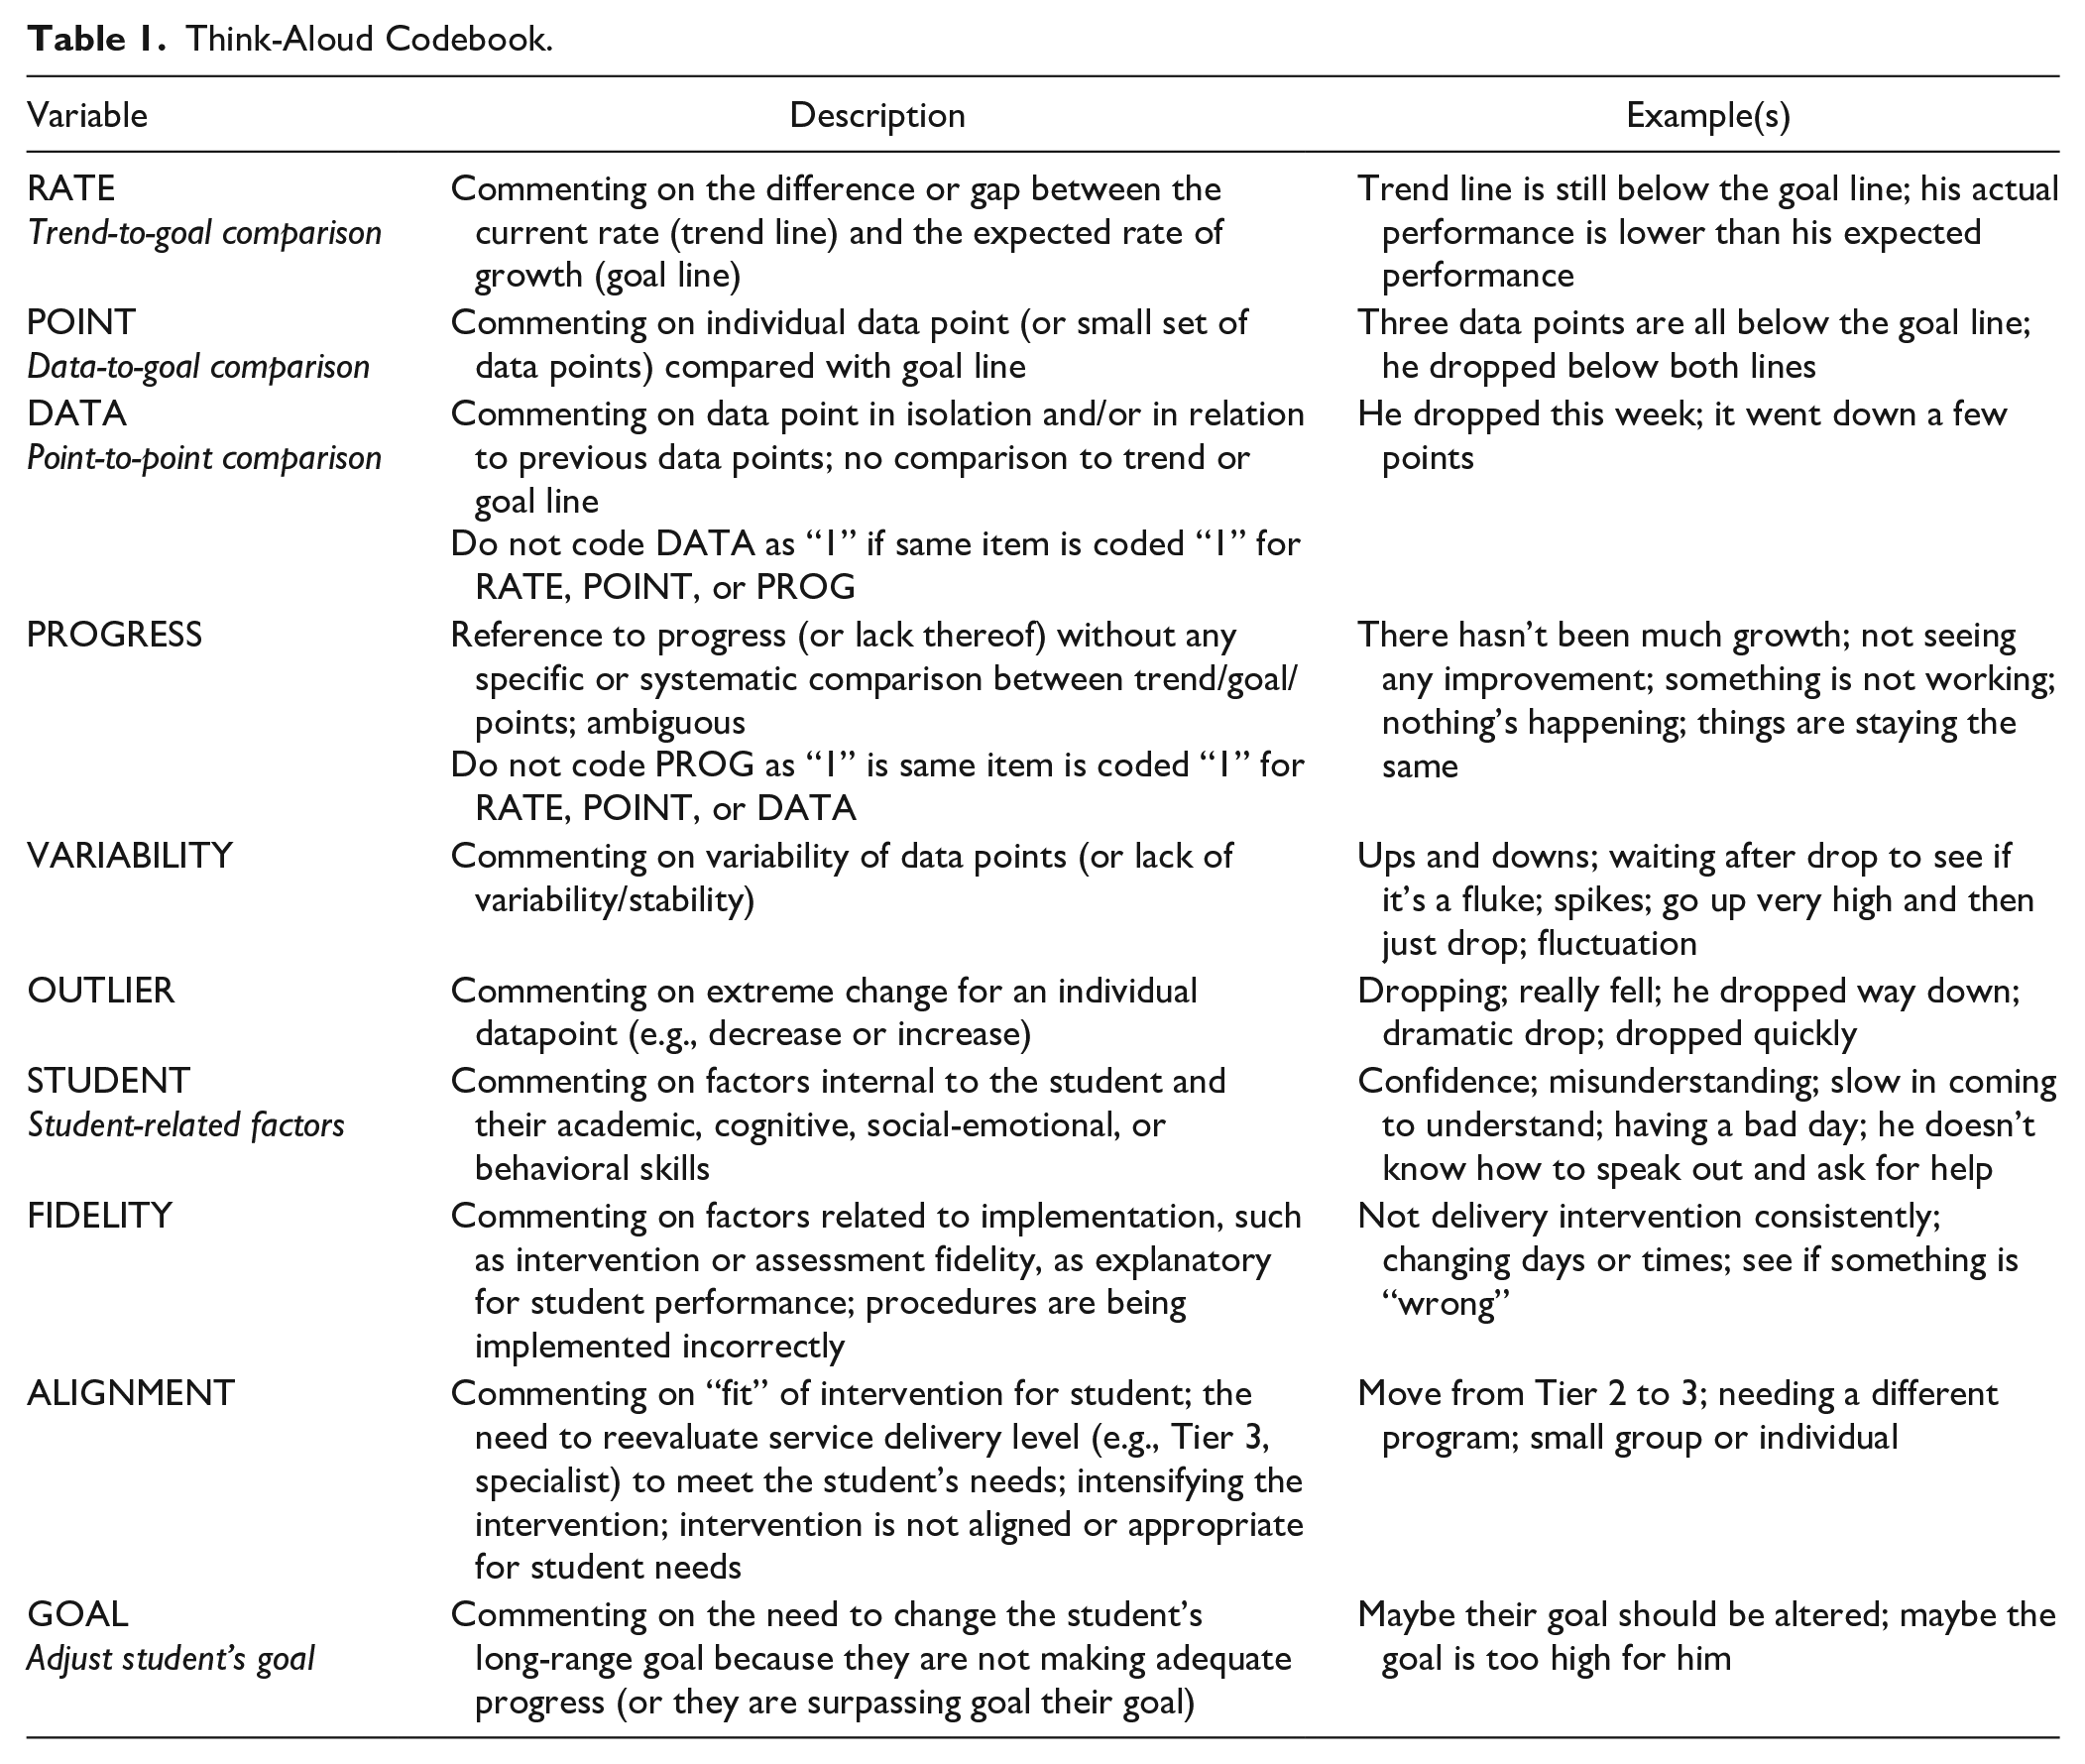
The final codebook included 10 variables related to participants’ interpretations of student progress graphs and data-based decision-making. Each individual response was coded as present (1) or not present (0) for each of the 10 variables and could be given multiple codes. Table 1 includes a summary of the codebook variables with descriptions and examples.
Think-Aloud Codebook.
Results
Interpretation of Sequentially Presented Graph
To examine RQ1, we were interested in the decisions pre-service special education teachers made in response to sequentially presented CBM progress graphs and how these decisions may be related to different CBM data patterns. We calculated the total number of change decisions for each data point across the four student cases. We use the term “change decision” to refer to an instance in which a participant indicated that they would make a change to the intervention. Table 2 summarizes the total number of change decisions made across each case and for each data point within the cases.
Number of Change Decisions at Each Data Point Across Participants (n = 32).
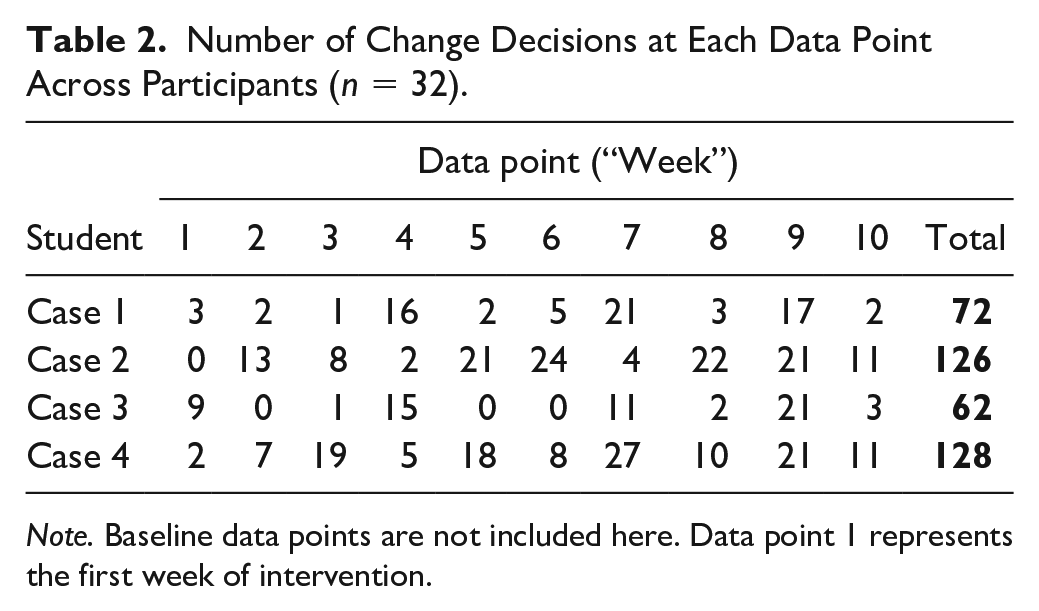
Note. Baseline data points are not included here. Data point 1 represents the first week of intervention.
Participants suggested the greatest number of changes for the cases that represented students who were not on track to meet their end-of-year goals. Specifically, there were 126 change decisions across participants for Case 2 (not on track, data typically variable) and 128 change decisions for Case 4 (not on track, data less variable), compared with 72 and 62 for Case 1 (on track, data less variable) and Case 3 (on track, data typically variable), respectively.
Across all four cases, there was an average of 12.78 change decisions (SD = 7.04), ranging from 4 to 31 changes across these 40 data points. Within participants, change decisions ranged from 0 to 7 for Case 1 (M = 2.41, SD = 1.86), 1 to 10 for Case 2 (M = 4.22, SD = 2.45), 0 to 7 for Case 3 (M = 1.94, SD = 1.70), and 1 to 10 for Case 4 (M = 4.22, SD = 2.35). This was similar to the pattern of responses across participants—a greater number of change decisions for the cases representing students not on track to meet their goals.
The majority of participants (n = 21; 65.6%) indicated that they would make an instructional change in response to the outlier or extreme data point in Case 1 (Week 7). The tendency to respond to variability between one, single data point to next was a common pattern. For instance, there was a surprising number of participants who indicated that they would make an instructional change within the first 3 weeks of data collection (see Table 2), which represented only 3 weeks of intervention in the cases. Nine (28.1%) participants responded that they would change instruction after viewing the first data point after baseline (Week 1) for Case 3. Thirteen (40.6%) participants responded with a change decision after viewing Week 2 data for Case 2 as there was a noticeable decrease in the student’s WCPM score from Week 1 to 2. Notably, half of the participants (n = 19; 59.4%) made a change decision at Week 3 for Case 4 although the decrease in WCPM from the previous week was minimal. Overall, across the four cases, there were 65 change decisions made in response to the first three data points.
Decision-Making Think-Alouds
Next, to address RQ2, we coded participants’ think-aloud responses when asked to explain their reasons for making a change in response to the graphed data. These responses allowed us to better understand the ways in which graphs were being interpreted to guide instructional decision-making. As previously described, we coded for ten reasons that could potentially be present in participants’ decision-making (see Table 1). The percentage of participant responses that referenced each of the reasons for making an instructional change, within and across cases, are reported in Table 3.
Reasons for Making Instructional Change Based on Coding of Think-Aloud Responses.
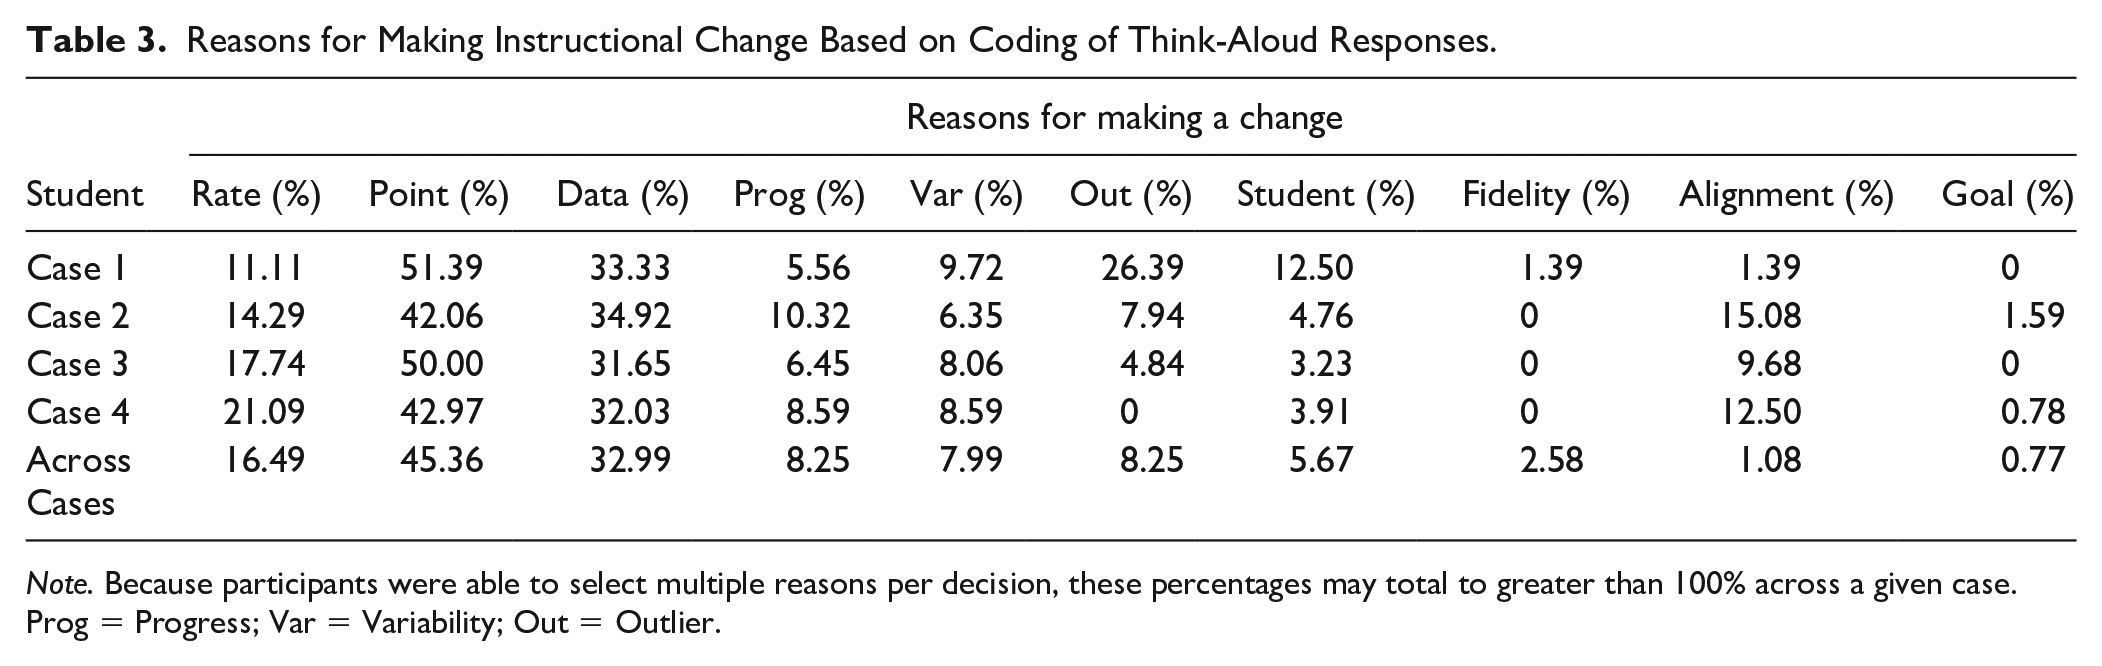
Note. Because participants were able to select multiple reasons per decision, these percentages may total to greater than 100% across a given case. Prog = Progress; Var = Variability; Out = Outlier.
Participants’ reasons for making an instructional change were most commonly based on comparing student data to their goal line. Across cases, 45.36% of participants’ think-aloud responses referenced an individual data point, or a small set of data points, in relation to the goal line (i.e., data-to-goal comparison). Responses sometimes included reasons such as “That is now three points [below the goal line] that we’ve gotten, we have a lot of data and it’s not getting better,” but they were more likely to consider points below the goal line without a specific decision rule in place (e.g., “The data is still dropping below”).
The second most common reason for making a change, referenced in 32.99% of responses, relied on analysis of individual data points in isolation or in relation to previous data points—without any type of comparison to the trend or goal line (i.e., point-to-point comparison). For example, when participants indicated they would make an instructional change after viewing Week 2 data for Case 2, they made comments such as “They started off doing good and now they declined,” “I guess he dropped about 16 words,” and “It dropped really quickly. Really, really suddenly.” Trend-to-goal comparisons were referenced in only 16.49% of responses across cases, ranging from 11.11% of responses in Case 1% to 21.09% of responses in Case 4. Participants made comments here such as: “The trend line is really low and it doesn’t. . . it’s nowhere near the goal. Like, it’s really a huge gap.” The greatest number of change decisions were made in response to Week 7 data for Case 4 (n = 27), and 12 participants referenced data-to-goal comparisons and 10 referenced point-to-point comparisons.
Across cases, 5.67% of responses referenced factors internal to the student and their academic, cognitive, social-emotional, or behavioral skills—despite there being no student information provided with the case. For example, “He has to be like scared to ask for help and just doesn’t wanna probably, some students feel like they don’t know how to speak out and ask if they need some help” or “Maybe pick up his confidence to be able to get above the goal line.”
Compared with the other cases, Case 1 had the greatest percentage of responses (26.39%) that referred to an outlier or extreme data point. Participants also commented on the variability of the data, ranging from 6.35% in Case 2% to 9.72% in Case 1. Although variability was indirectly referenced in responses that we coded as point-to-point comparisons, these were instances when participants explicitly remarked on the variability—or lack of stability—in the data and identified this as the reason to change instruction. For example, “He’s not really increasing. He’ll increase for one session, but the next he’s not any better.”
Comparison to Interpretation of Static Progress Graph
Finally, to address RQ3, we compared the decisions made while viewing a graph with data presented week-by-week for 10 weeks (i.e., sequentially presented graphs) to decisions made while viewing a graph with 10 weeks of complete data (i.e., static CBM progress graph). The same four cases were used. When viewing the complete graphs, participants were asked whether they would have made an instructional change and, if so, what week they would have implemented the change. Table 4 presents a summary of change decisions for the four cases.
Participants’ Change Decisions Based on Interpretation of Static Graphs.
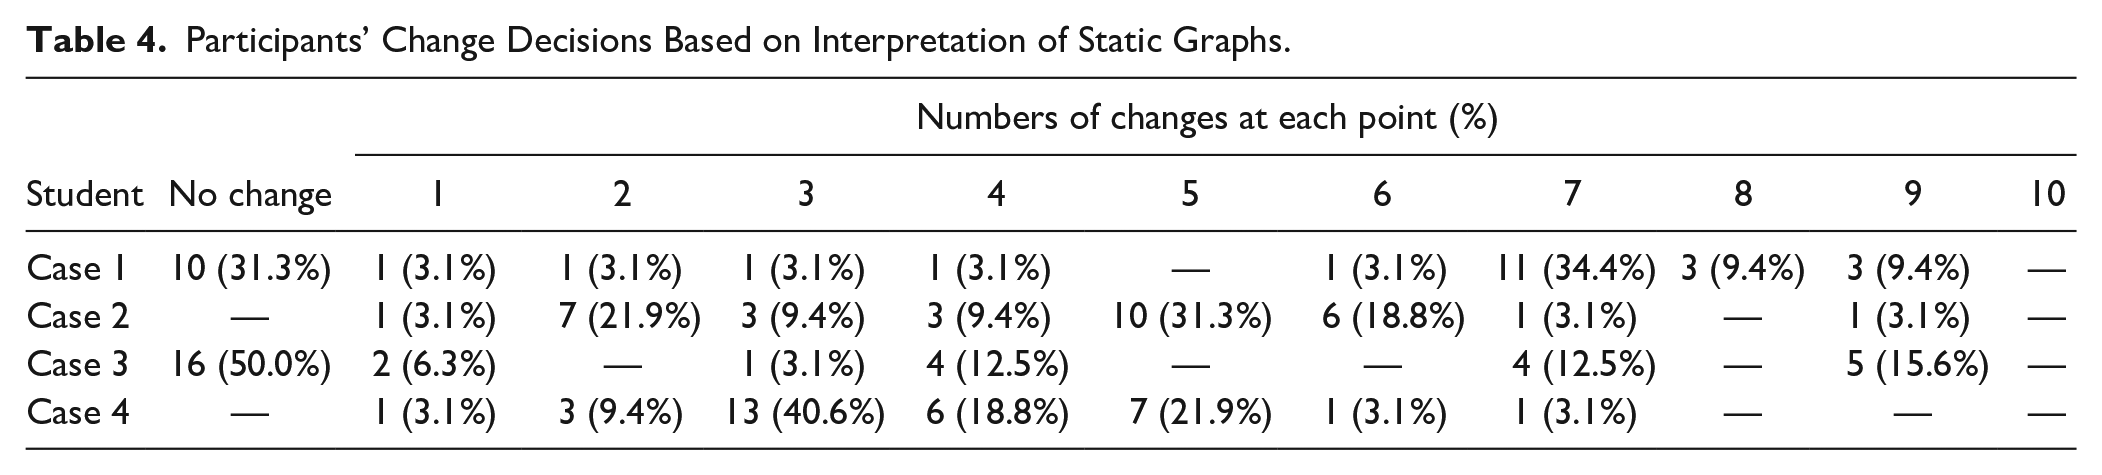
For the two cases that represented students who were on track to meet their end-of-year goal (i.e., Cases 1 and 3), many participants indicated that they would not have made an instructional change. Specifically, almost one-third of respondents (n = 10; 31.3%) for Case 1 and half of respondents (n = 16; 50%) for Case 3 indicated that they would not make an instructional change at any point. This contrasted responses when participants viewed the sequentially presented graphs wherein the number of participants that indicated that they would not have made an instructional change was only three participants (9.3%) for Case 1 and seven participants for Case 3 (21.9%).
For Case 1, with low variability, those who made a change decision most commonly indicated that they would have made a change at Week 7 (n = 11; 34.4%), and the remaining eleven responses (34.4%) were across every data point except for Week 3 and 5, both of which showed a slight increase in the student’s WCPM score from the previous week. Only half of the participants responded with a change decision for Case 3, the case with typical variability in the data, and there did not appear to be any consistency in their reports of when they would have made this instructional change.
For the two cases where the students were not on track to meet their goal (i.e., Cases 2 and 4), every participant indicated that they would have made an instructional change at some point. This was true for both the sequential and static presentation of the graphed data for these cases. For Case 2, the student with typical variability in their data, all participants indicated that they would have made an instructional change. Most commonly, these changes were made at Week 2 (n = 7; 21.9%), Week 5 (n = 10; 31.3%), and Week 6 (n = 6; 18.8%), with the remaining responses scattered across weeks. Similarly, all participants responded with a change decision for Case 4 (low variability). Forty percent (n = 13) indicated that they would have made this change at Week 3, 18.8% (n = 6) at Week 4, and 21.9% (n = 7) at Week 5. There were no changes indicated after Week 7.
Discussion
The purpose of this study was to contribute to our understanding of the ways in which teachers evaluate CBM progress graphs and the factors that influence their decision-making. Among a group of pre-service special education teachers, over 90% of which reported taking coursework that included CBM, we observed little consistency in decisions about when to adjust instruction. Think-aloud responses reflected erroneous information about instructional decision-making and typical student performance on CBM reading assessments. Consistent with other studies that observed problems in pre- and in-service teachers’ ability to interpret graphed CBM data (e.g., Espin et al., 2018; Shepley et al., 2023 van den Bosch et al., 2017; Wagner et al., 2017) change decisions appeared to be influenced by graph-related features, including the specific pattern of student progress (i.e., on track or not on track to meet goal) and variability in the data (i.e., low or more typical variability). Furthermore, responses indicated misunderstandings of progress graphs and data-based decision-making, which led to premature instructional change decisions and reliance on individual data points. We expand on each of these findings in the sections below.
Graph-Related Factors That Influence Interpretation
Patterns of Student Progress
Of the four hypothetical student cases, two cases presented data for students who were on track to meet their end-of-year goal and two cases presented data for students who were not on track; but within each set, one case had very low variability in the data and one had typical variability across data points. We found that participants appeared to have an easier time interpreting graphs wherein the data clearly indicated the student was not making progress. This was true for both sequentially presented graphs and static progress graphs. Past research has indicated that the magnitude of the slope, in either positive or negative directions, tends to lead to the highest accuracy in graph reading (Espin et al., 2018).
That said, many participants still said they would make changes when viewing a static graph that showed expected growth—two-thirds for Case 1, and one-half for Case 3. The static graphs for these cases depicted trend lines that closely approximated the goal line. This offers some evidence that participants were influenced by individual data points and not accustomed to basing their decisions on the data in aggregate or the students’ trend lines. It is also possible that some participants felt that they were expected to respond with an instructional change, even though our directions did not communicate such an expectation.
Variability in the Data
We purposefully developed our four student cases to reflect two levels of variability in the data based on prior research with CBM ORF passage sets (Ardoin & Christ, 2009; Christ et al., 2013; Christ & Silberglitt, 2007; Cummings et al., 2013); a very low level of variability (±6 points around the average rate of growth) that is often depicted in training examples (e.g., The IRIS Center, 2015; NCII, n.d.) but seldom observed in practice, and a level of variability that is more commonly observed with commercial CBM passage sets (±12 points around the average rate of growth). Consistent with prior work (e.g., Shepley et al., 2023), when data were more variable, participants were less clear and less consistent on when they would make an instructional change. Many participants noted variability in the data but interpreted this as the intervention being ineffective rather than recognizing the variation that is typically observed in students’ scores over time. When responding to cases with typical variability (Cases 2 and 3), participants repeatedly identified a need to change intervention based on a single data point that was lower than a previous one, although the data point was within the typical standard error observed across commercial passage sets. In contrast, participants demonstrated greater consistency in their decisions pertaining to the cases with less variable data (Cases 1 and 4). Again, we note that the data used for these cases were atypically low in variability relative to true CBM ORF data—especially for students who are experiencing struggles with reading (e.g., Deno et al., 2001).
Thus, while participants’ think-aloud responses recognized the variability in the data (e.g., “They are going up and they’re going down. They’re going up and they’re going down.”), they failed to recognize that this should be expected when collecting progress monitoring data. It is possible that the pre-service teachers had not been exposed to (a) data on the typical level of score variability observed in commercial CBM ORF passage sets; (b) case example graphs that reflected typical variability (and instead depicted scores tightly clustered around an average rate of growth); (c) the multiple factors that can cause ORF score variability; and (d) the importance of considering performance and trend using multiple data points.
(Mis)Understanding of CBM Progress Graphs for Decision-Making
Premature Instructional Change Decisions
In this study, we made a purposeful choice not to specify “correct” decisions across all the student progress graphs. The decision-making process is complex; thus, our goal was to capture and describe pre-service teachers’ data decisions. That said, there are some decisions that are clearly incorrect and suggest a lack of knowledge from the decision-maker. Most notable here was the alarming number of participants who indicated that they would make an instructional change based on only three or fewer data points—that is, they made a decision to change instruction too soon or “prematurely.” Across cases, 10.9% of participants made a change decision in response to the Week 1 data point, 17.2% made a change decision in Week 2, and 22.7% made a change decision in Week 3. During the tutorial, participants were explicitly informed that each new data point was collected during each new week of intervention; thus, these decisions may suggest a misunderstanding of how to interpret CBM progress monitoring.
It is possible that these premature decisions were due to misperceptions or a lack of understanding of what the construct of oral reading fluency represents, and the extent and speed to which interventions can affect students’ reading fluency. Although CBM ORF scores are relatively simple to collect (i.e., recording the number of WCPM), the actual skill of reading connected text with efficiency represents a complex and sophisticated orchestration of skills in word reading and reading comprehension (Jenkins et al., 2003). Reading fluency can be improved through intervention, but improvements are generally not observed as readily as some other reading-related skills, such as letter-sound correspondence, pseudoword decoding, or isolated word reading (e.g., Flynn et al., 2012; Hall et al., 2023; Torgesen, 2006). Typical rates of growth for typically achieving students in middle elementary grades generally range from 1 to 2 correct words per minute gained per week, but rates of growth decline as grade levels increase and lower achieving readers can demonstrate growth rates more than 50% lower than the overall average (Hasbrouck & Tindal, 2017; Nese et al., 2012, 2013). A complex, multifaceted skill like ORF does not improve dramatically within 1 week, nor does it decline as rapidly in the same amount of time. Actual “loss” of reading fluency would require a significant period of time in which reading was not practiced. In short, participants’ premature decisions to change instruction within the first three weeks of intervention were likely due to inadequate training, experience, and knowledge of what ORF represents and how quickly it can be expected to change.
Reliance on Individual Data Points
Related to our previous comments on the expected variability in CBM ORF data, even when holding students’ reading skills constant, there should be an expectation of fluctuation in scores. Variability in CBM ORF performance across occasions can be caused by differences in passage difficulty across a passage set, individual differences in student background knowledge that can make the topics of some passages more familiar than others, fluctuations in a student’s mood or attention across testing occasions, and variations in the testing environment (i.e., more or less distracting from week to week) or examiner that affect student performance. Variability in scores should be viewed as the norm rather than an exception. As such, reliance on single data points for decision-making rather than overall trend or larger groups of data points in aggregate likely represents a knowledge gap that had not been previously addressed by coursework and other CBM training resources.
In the current study, the number of participants who recommended instructional changes based on one single data point was concerning. Among reasons for making an instructional change, data point-to-goal comparison was most referenced (45.36% of all think-aloud responses). These were instances wherein participants commented on an individual or small set of data points compared with the goal line. Some participants’ responses indicated they applied the point rule to their decision-making; however, only 13 of 176 data-to-goal comparisons referred to the most recent three or four consecutive data points compared to the goal line. Furthermore, point-to-point comparison was the second most common reason for making an instructional change (32.99%). These were instances when the participant commented on an individual data point in isolation without comparison to the trend or goal line.
Limitations and Future Directions
We note potential limitations associated with the current study. Each of these offer pathways for future research to expand this work. First, due to the small sample size and restricted geographic representation, it is unclear to what extent these results can be generalized to a broader population of pre-service special education teachers. Furthermore, although we asked participants about their prior coursework and training, we do not have information about the content or quality of these professional learning experiences. In this sample, 87.5% of participants reported completing at least one course on using assessment data to inform instructional decisions and 90.1% reported completing at least one course that covered CBM. Recent reviews of CBM materials developed for practitioner audiences indicate that a woefully low proportion of the content is devoted to the decision-making aspects of CBM. For example, Espin et al. (2021) analyzed CBM professional development materials and found that only 12% of the content in presentations and 14% in manuals/books focused on data-based decision-making. Similarly, Fry et al. (2023) replicated Espin and colleague’s analysis with articles published in practitioner journals and found that only 18% of the content focused on decision-making.
It is worth noting that the type of decision we focused on is not fully representative of the data-based decision-making process that takes place in schools. Participants were asked to make a decision about whether there was a need to continue or adjust instruction based on students’ progress data but were not asked to decide how instruction would be changed. The former decision relies on graph interpretation, while the latter decision must be informed by context and the student’s unique needs. We held all student information constant across the four cases so that we could isolate and independently evaluate participants’ decision-making as they interpreted progress graphs. Although this strengthened our design from the standpoint of studying graph interpretation, it highlights a need to investigate the extent to which variables such as student characteristics and instructional history affect teachers’ data-based decision-making.
We asked teachers to respond to graphs after the addition of each individual data point. Although this is consistent with practice situations in which teachers collect and graph one data point at a time (e.g., once per week), future research might evaluate differences in respondents’ decisions when they periodically consider graphs after groups of data points have been entered (e.g., 3 or 4) as compared with one data point at a time.
Graph interpretation may also involve decisions about when to raise a goal (e.g., when a student meets their predetermined goal) or when to decide to reduce the intensity of an intervention when a student has met their goal. Subsequent studies might use the sequential methodology employed in this study to investigate the quality of teachers’ decisions around goal attainment or goal adjustment. We believe there is potential for think-aloud procedures to be used in future studies that examine teachers’ data use to better understand processes related to and potential influences on decision-making.
Conclusion
Special education teachers must effectively use student progress data to guide and inform instructional decision-making, but this can often be challenging. To date, systematic efforts to improve the quality and effectiveness of teachers’ data use have had lackluster results (e.g., Gleason et al., 2019), and other studies have revealed problems in the accuracy with which teachers interpret progress graphs and the quality of the decisions they make based on data. Overall, our findings suggested little consistency in pre-service teachers’ responses related to when or why they would make an instructional change. The results also revealed problematic decision-making trends including decisions based on very little data, reliance on single data points, and a lack of awareness of typical variability in reading CBM data. This was true across participants, as well as within participants from case to case. DBI assumes that teachers can and will use student progress data to guide instructional decision-making; however, findings from the current study indicate that teachers—and particularly pre-service teachers who will be taking on special education roles—may need ongoing support in using data to inform instruction. Teacher training programs should include more hands-on practice with CBM progress graphs to support future special education teachers in understanding natural variability in data, trends in data, and expected growth in students’ reading skills over time. Training content should continue to be informed by ongoing scientific inquiry into teachers’ data-based decision-making processes.
Footnotes
Declaration of Conflicting Interests
The author(s) declared no potential conflicts of interest with respect to the research, authorship, and/or publication of this article.
Funding
This research was supported in part by the U.S. Department of Education, Institute of Education Sciences, through grant R324A190126 to The University of Texas at Austin. Nothing in this paper necessarily reflects the positions or policies of the agency and no endorsement by it should be inferred.