
Abstract
Analyses were conducted with second graders, drawn from an ongoing multi-cohort randomized controlled trial (RCT), who had been identified for RCT entry based on comorbid reading comprehension and word-problem solving difficulty. To estimate pandemic learning loss, we contrasted fall performance for 3 cohorts: fall of 2019 (pre-pandemic; n = 47), 2020 (early pandemic, when performance was affected by the truncated preceding school year; n = 35), and 2021 (later pandemic, when performance was affected by the truncated 2019 to 2020 school year plus the subsequent year’s ongoing interruptions; n = 75). Across the 2 years, declines (standard deviations below expected growth) were approximately 3 times larger than those reported for the general population and for students in high-poverty schools. To estimate the promise of structured remote intervention for addressing such learning loss during extended school closures, we contrasted effects in the RCT’s 2018 to 2019 cohort (entirely in-person intervention delivery; n = 66) against the same intervention’s effects in the 2020 to 2021 cohort (alternating periods of remote and in-person delivery; n = 29). Large intervention effects were not moderated by pandemic status, suggesting potential for structured remote intervention to address student needs during extended school closures.
Academic learning during the pandemic suffered in the United States, and subgroups of the student population were affected differentially. Yet, little is known about the extent of learning loss in highly vulnerable subgroups, especially students with learning difficulties, or about methods for mitigating risk of severe learning loss during extended school closures in highly vulnerable students. In the present set of analyses, our purpose was to provide insight on these issues by focusing on a highly vulnerable subgroup of students: those with comorbid learning difficulty across reading comprehension (RC) and mathematics word-problem solving. In this report, we use students with comorbid difficulty to refer to this population, pandemic to refer to the COVID-19 pandemic, and learning loss to refer to declines in expected rates of academic progress (expressed as standard deviations below performance at the start of the 2019–2020 school year).
Focus on Students With Comorbid Difficulty
Comorbid difficulty represents an especially vulnerable form of learning difficulty for five reasons. First, RC and word-problem solving are strong predictors of quality of life, financial security, and life expectancy (e.g., Murnane et al., 2001; Ritchie & Bates, 2013). Second, developmental trajectories in reading (Shaywitz, 1998) and math (Fuchs et al., 2016) are established early and remain stable over time, as is the case for reading and math comorbidity (Koponen et al., 2018; Landerl & Moll, 2010). Third, reading and math comorbidity occurs frequently; half of children with poor performance in one domain have difficulty in the other (Koponen et al., 2018). Fourth, students with comorbid learning difficulty experience worse outcomes in each area than do peers with difficulty in one domain (Willcutt et al., 2013). Fifth, comorbidity is associated with less adequate response to generally effective intervention (e.g., Fuchs et al., 2013).
Pandemic Learning Loss
In one of the most comprehensive analyses of pandemic learning loss in the general student population, Kuhfeld et al. (2022) compared reading and mathematics performance in fall of 2019, 2020, and 2021 using the Measure of Academic Progress Growth (MAP; NWEA, 2017). Across a sample of 5.4 million U.S. students, math achievement in fall 2020 was −0.12 to −0.18 standard deviations (SDs) lower than in fall 2019; the drop from fall 2019 to fall of 2021 grew to −0.21 to −0.27 SDs (range refers to grade levels ranging from 3 to 8). A different but still concerning pattern emerged in reading: although performance at almost all grades increased from 2019 to 2020 (ranging from a decrease of −0.02 to increases of +0.05), declines of −0.09 to −0.18 SDs were observed by fall 2021. (In this report, effect sizes [ESs] indicating declines from pre-pandemic to early or later pandemic scores are denoted with a minus sign. ESs indicating increases from pre-pandemic to early or later pandemic scores are denoted with a plus sign.)
With respect to differential learning loss, Kuhfeld et al. (2022) found that achievement gaps between students in high- versus low-poverty schools, which already spanned 1 SD in fall of 2019, had widened at fall 2021 by an additional 0.20 SDs in math and 0.13 SDs in reading. At third grade (closest to the present report’s second-grade focus), math scores for students in high-poverty schools decreased −0.11 SDs at fall 2020 and another −0.37 SDs in fall 2021 (in low-poverty schools, figures were −0.11 and −0.15). Reading scores for students in low-poverty schools increased +0.03 SDs at fall 2020 but fell −0.26 SDs 1 year later (in low-poverty schools, an increase of +0.09 at fall 2020 and a decrease of −0.11 1 year later).
Using state assessment data from spring 2021, Connecticut’s State Department of Education (2021) provided a different lens into differential learning loss by disaggregating performance for low- versus high-need learners and as a function of schooling patterns. High-need students represented a broad set of students: emergent bilinguals, students from low-income families, students experiencing homelessness, and students with disabilities. During the 2020 to 2021 school year, one-quarter of the full sample (across high- and low-need students) received fully or mostly in-person instruction; nearly half, hybrid instruction (25%–75% of school days in person); and nearly one-quarter, fully or mostly remote instruction. High-need students were fully remote at higher rates (32.2% vs. 15.7%), and learning loss was more severe for remote learners and for high-need students. Also, the progress of students who fell below pre-pandemic proficiency Levels 1 and 2 was lower than for those at higher pre-pandemic levels. This pattern was not observed prior to pandemic. The report did not, however, disaggregate data on instructional status or learning loss for different types of high-need students.
A report using NWEA MAP scores from Illinois (U.S. Department of Education, 2022a) is one of few data sources disaggregating results for a specific type of high-need students: those with disabilities. At each grade level, students receiving special education had more learning loss than those not receiving special education. These findings should be interpreted with caution, however, because the Illinois analysis was limited to changes in student learning between the pre-pandemic’s onset (March 2020) and start of the 2020 to 2021 school year and based on an unrepresentative sample of 17 districts (3.3% of students) in the state.
As indicated in these and other reports, pandemic school closures, which resulted in no schooling or remote schooling for many students for sustained time starting March 2020 and lasting through the 2020 to 2021 school year, exacted a devastating toll on the learning of this country’s school-age population, but with uneven magnitude (e.g., see Kuhfeld, Soland, et al., 2020; Kuhfeld, Tarasawa, et al., 2020). Also, although reports suggest that students with learning difficulties may have experienced differential rates of remote schooling (Connecticut State Department of Education, 2021) and may have fared less well in terms of learning (U.S. Department of Education, 2022a), disaggregated data on such students are scarce.
Without reliable estimates of the magnitude of learning loss for students with learning difficulties, some have turned to summer break studies for insight into the magnitude of learning loss during the pandemic (Alexander et al., 2007; Cooper et al., 1996; von Hippel & Hamrock, 2019). Allinder and Fuchs (1991) showed that summer declines in academic trajectories are steeper for students with learning disabilities than for students without disabilities. Still, pandemic school closures were more punctuated and frequent than with summer breaks, creating challenges for extrapolating to the pandemic. This leaves important questions about the effects of pandemic school interruptions on learning loss for students with learning difficulties.
Effects of Remote Intervention Delivery
At the same time, little is known about methods for mitigating risk of severe learning loss during extended school closures in vulnerable subgroups. This information is needed to guide schools in preparing to address extended school closures more effectively in the future. For this purpose, databases that accrued during the pandemic are especially valuable. This is because studies conducted under normal circumstances have limited generalizability for extended school closures, when Tier 1 instructional quality is compromised, which may decrease the background skills students need for supplemental intervention effects to accrue (Fuchs et al., 2008).
We located three relevant study reports based on pandemic data, each testing effects of remote delivery of a structured intervention to address the learning needs of students with learning difficulty (e.g., Fuchs et al., 2021; Vaughn et al., 2022). Cruzl et al. (2022) focused on reading fluency intervention with 207 third graders who had been randomly assigned to a control group or to 20, 50-min small-group intervention sessions. Students assigned to intervention were evaluated before intervention began for home technology and parent availability during intervention times. The subset with availability received intervention remotely (n = 76); the others, in-person (n = 45). Fidelity was not reported as a function of delivery mode. Students’ word-level reading accuracy was stronger for intervention than control, without significant differences as a function of delivery mode. On text accuracy and fluency, there were no significant differences among the three conditions. So, intervention effects were mixed, but delivery mode did not moderate those effects. Limitations include significant differences on pretest fluency and the possibility that unobserved systematic differences between remote and in-person intervention conditions were associated with the technology and parental criteria required for participating in remote delivery.
In contrast to Cruzl et al. (2022), Cancer et al. (2021) relied on random assignment to remote and in-person delivery, this time testing a rhythm-based intervention. A single tutor delivered 10, 45-min intervention sessions to all study participants (30 students with dyslexia in Grades 2–7) in their assigned delivery mode. Fidelity was not reported. Reading performance improved in both conditions, with small effects on speed and accuracy and without significant differences between delivery modes. Yet, the absence of a control group raises questions about whether improvement was due to maturation, and effects may be attributable to the single tutor’s quality.
Beach et al. (2021) described reading improvement in response to a remote version of a previously validated summer reading intervention, while reporting strong fidelity, but without a control group. Participants were 35 second and third graders reading below grade level. On the program’s mastery tests, improvement was significant, with large effects, but without transfer to passage reading fluency or accuracy. This suggests efficacy of remote delivery for the previously validated program on proximal outcomes. Here too, the absence of a control group raises questions about whether improvement can be attributed to intervention.
These studies, in which the efficacy of the tested interventions was mixed, suggest an absence of differences in effects as a function of delivery mode. Yet, conclusions about remote intervention’s promise are weakened due to methodological limitations. This argues for the importance of additional analyses based on pandemic databases to broaden knowledge about remote delivery’s promise, especially when effects of intervention are indexed in contrast to a randomly assigned control group.
In such additional analyses, foundational reading skill, a common focus across the three studies, remains important. However, a wider lens is needed, because foundational reading skill may be more conducive to remote delivery than more complex interventions focused on higher order skills. Additionally, we identified no relevant math studies (see Schuck & Lambert, 2020 for teacher case studies in math, without math achievement data).
Present Analyses: Purposes, Questions, and Hypotheses
The purposes of the present analyses were to explore the severity of pandemic learning loss and the promise of remote delivery of complex structured interventions during extended school closures for students with comorbid difficulty. The sample of second graders was drawn from an ongoing multi-cohort randomized controlled trial (RCT), with entry criteria requiring low RC and word-problem solving (WPS) performance (< 25th percentile) and intellectual ability in the broadly average range (>10th percentile).
Severity of pandemic learning loss
The sample for investigating pandemic learning loss severity involved three cohorts from this RCT. To facilitate interpretation of severity, we focused on the time points reported for the general population in Kuhfeld et al. (2022): fall 2019 when performance had not yet been affected by school interruptions (pre-pandemic), fall 2020 when performance had been affected by the truncated preceding school year (early pandemic), and fall 2021 when performance had been affected by the truncated 2019 to 2020 school year and ongoing interruptions to in-person learning during the 2020 to 2021 school (later pandemic).
Our research questions and hypotheses were as follows: What is the magnitude of reading and math learning loss in this subgroup of learners? How does that compare to loss reported in the general population? How does the magnitude of reading and math learning loss compare to learning loss on cognitive measures? We hypothesized more severe learning loss at fall 2020 and fall 2021 for students with learning difficulty compared to Kuhfeld et al.’s (2022) estimates for students generally and for students in high-poverty schools. This was based on a demonstrated association between pre-pandemic academic performance level and learning loss (Connecticut State Department of Education, 2021; U.S. Department of Education, 2022b). We anticipated greater reading and math learning loss on academic than cognitive measures, which are often presumed to demonstrate relative stability over time (e.g., Schneider et al., 2014).
Potential for remote intervention
To investigate the promise of structured complex remote intervention for mitigating the risk of learning loss during extended school closures with vulnerable subgroups, the sample involved two cohorts from the same RCT: (a) the 2018 to 2019 cohort, the most recent cohort unaffected by the pandemic, for which the RCT’s interventions were delivered entirely in-person, and (b) the 2020 to 2021 cohort, for whom the RCT’s interventions involved alternating periods of remote and in-person delivery. (In this report, we refer to this hybrid condition as remote or hybrid. The 2019 to 2020 cohort was lost when schools closed in March 2020 prior to posttesting.)
In the context of contrasting remote against in-person intervention delivery, random assignment to intervention and control groups represents an important extension to Cancer et al. (2021) and Beach et al. (2021). Also, the present analysis did not impose Cruzl et al.’s (2022) requirement for technology and parent availability for inclusion in the remote delivery condition. Instead, remote tutoring occurred with students using school-provided technology in their homes, and whoever was in the household (parents, grandparents, neighbors, older siblings, others) supervised sessions, with varying levels of control and scrutiny. In these ways, the present test of remote delivery better reflected the challenges associated with pandemic remote delivery, enhancing external validity. This report’s other extension was its focus on complex interventions not only in reading but also in math.
In the present analysis, our research questions and hypotheses were as follows: Does fidelity of implementation differ as a function of delivery mode? Are effects favoring structured RC intervention over control and favoring structured WPS intervention over control moderated by intervention delivery mode? We hypothesized comparable levels of fidelity for both delivery modes because the same intervention structure, training, and monitoring was in place across modes. We expected a similar pattern of effects on student outcomes for in-person and remote delivery based on the expectation that fidelity was similar across delivery modes.
In this way, note that the central focus in the present analysis was whether delivery mode moderated each intervention’s effects (RC intervention vs. control; WPS intervention vs. control). The central focus was not intervention efficacy, which awaits completion of the full RCT. To help readers understand intervention complexity when interpreting remote delivery effects, we describe the interventions’ framework, rationale, and methods in the remote intervention delivery method section.
Learning Loss: Method, Data Analysis, and Results
Method
Participants
We recruited participants and collected data in accord with protocols approved by our university’s institutional review board, which is charged with ensuring compliance with ethical and legal standards. We screened students from a large, diverse, urban, and suburban county-wide school district in the southeastern United States and entered students into the RCT who scored (a) below the 25th percentile at start of second grade on Story Problems (Jordan & Hanich, 2000) and Gates–MacGinitie Reading-Comprehension (Gates; MacGinitie et al., 2002) and (b) at or above the 10th percentile on at least one subtest of the Wechsler Abbreviated Scales of Intelligence (WASI; Wechsler, 2011).
Across the three cohorts that provided learning loss data, 237 of screened students met the academic low performance study entry criterion. As per the RCT’s study protocol, 80 of these students were not included in the RCT due to other specifications: 23 did not meet the WASI criterion, 17 had scheduling conflicts, 8 had participated in a previous RCT in which they received related instruction, 6 had very limited or no English (reported by teachers based on school-administered tests), 2 had histories of excessive absences, 2 were enrolled in other research intervention projects; 3 did not provide assent, 10 moved prior to study entry and random assignment, and 9 were randomly selected out of the RCT because our recruitment goal was exceeded.
Thus, 157 entered the study (mean age at start of second grade = 7.53 years, SD = 0.33), all of whom were pretested (there was no attrition for the learning loss sample); 44.6% were White Latino/a, 42.7% African-American, 8.9% White non-Latino/a, 0.6% Asian, and 3.1% other; 54.8% were female; 51.6% qualified for free lunch; 36.9% qualified for English services; and 6.4% qualified for special education.
Measures
Screening measures were as follows. Story Problems (Jordan & Hanich, 2000) comprises 14 word problems representing combine, compare, or change schema, with scenarios involving pennies. Problems require sums and minuends to 12 for solution. The tester reads each item aloud; children have 30 s to construct an answer and can ask for re-reading(s) as needed. The score is the number of correct numerical answers. Sample-based α was .85. Criterion validity with the Iowa Test of Basic Skills—Problem Solving is .71. Gates (Level 2, Form S; MacGinitie et al., 2002) includes 11 narrative or informational passages each with four paragraphs (except the first, with three sentences). Three pictures are shown next to each passage; children select the picture best representing the text. They have 35 min to read and select pictures. Alternate form reliability is .74-.92. Sample-based α was .82.
Wechsler Abbreviated Scales of Intelligence (Wechsler, 2011) is a 2-subtest measure of general cognitive ability, Consisting of Vocabulary and Matrix Reasoning subtests (reliability > .92). Vocabulary assesses expressive vocabulary, verbal knowledge, memory, learning ability, and crystallized and general intelligence. Students identify pictures and define words. Matrix Reasoning measures nonverbal fluid reasoning and general intelligence. Children complete matrices with missing pieces. Sample-based α was .81 and .84, respectively.
To answer questions concerning learning loss, we relied on three reading and two math measures, as well as WASI scores. (We did not use Story Problems or Gates because they had been used to select participants for study inclusion.) Reading measures were as follows. With Wide Range Achievement Test (4th ed.; WRAT4)–Reading (Wilkinson & Robertson, 2006), children name 15 letters and then read from a list with words that increase in difficulty. There is no time limit. Sample-based α was .84. With Test of Word Reading Efficiency, 2–Sight-Word Efficiency (SWE; Torgesen et al., 2012), children have 45 s to read words that increase in difficulty. Sample-based α was .84. With Woodcock-Johnson IV Tests of Achievement (Mather & Schrank, 2014; Schrank et al., 2014), Passage Comprehension (WJIV-PC), children match a pictographic representation of an object with an actual picture from 2 to 5 choices; in the next group of items, they read a phrase and point to a picture representing the phrase’s meaning; in remaining items, they read short cloze paragraphs and restore passage meaning by saying the missing word. Items increase in difficulty by removing pictorial stimuli and increasing passage length, vocabulary level, and syntactic complexity. Sample-based α was .82.
Math measures were as follows. With the WRAT4 subtests Number Knowledge and Calculations (Wilkinson & Robertson, 2006), the 15-item oral portion requires counting objects, identifying Arabic numerals, holding up a specified number of fingers, identifying larger numbers, and solving simple word problems. The written computation section provides children 15 min to complete up to 55 problems of increasing difficulty. Median reliability is .94 for 5- to 12-year-olds. Sample-based α was .86. Arithmetic includes four subtests, each with 25 problems selected from sample units in state standards. Addition 0 to 12 consists of problems with sums from 0 to 12; Addition 5 to 18, problems with sums from 5 to 18; Subtraction 0 to 12, problems with minuends from 1 to 12; Subtraction 5 to 18, problems with minuends from 5 to 18. For each subtest, students have 1 min to write answers. We used total number of correct answers across the four subtests. Sample-based α was .86.
Procedure
Screening measures were administered in early September in large groups for the academic screeners and individually for WASI. Learning loss measures were administered in early October in small groups and individually. In each session, the order of test administration was fixed to minimize carry-over effects. Sessions ranged from 30 to 60 min. Testers had to demonstrate criterion administration accuracy with senior project staff on each measure before testing. Scoring was completed with students’ study condition masked. All test sessions were audio-recorded; 15% were randomly selected, stratifying by tester, and double-scored by independent coders to check for accuracy. Agreement exceeded 99%. See Table 1 for the means and standard deviations for the fall reading, mathematics, and cognition scores by pandemic status.
Fall Reading, Mathematics and Cognition Scores by Pandemic Status (n = 157).
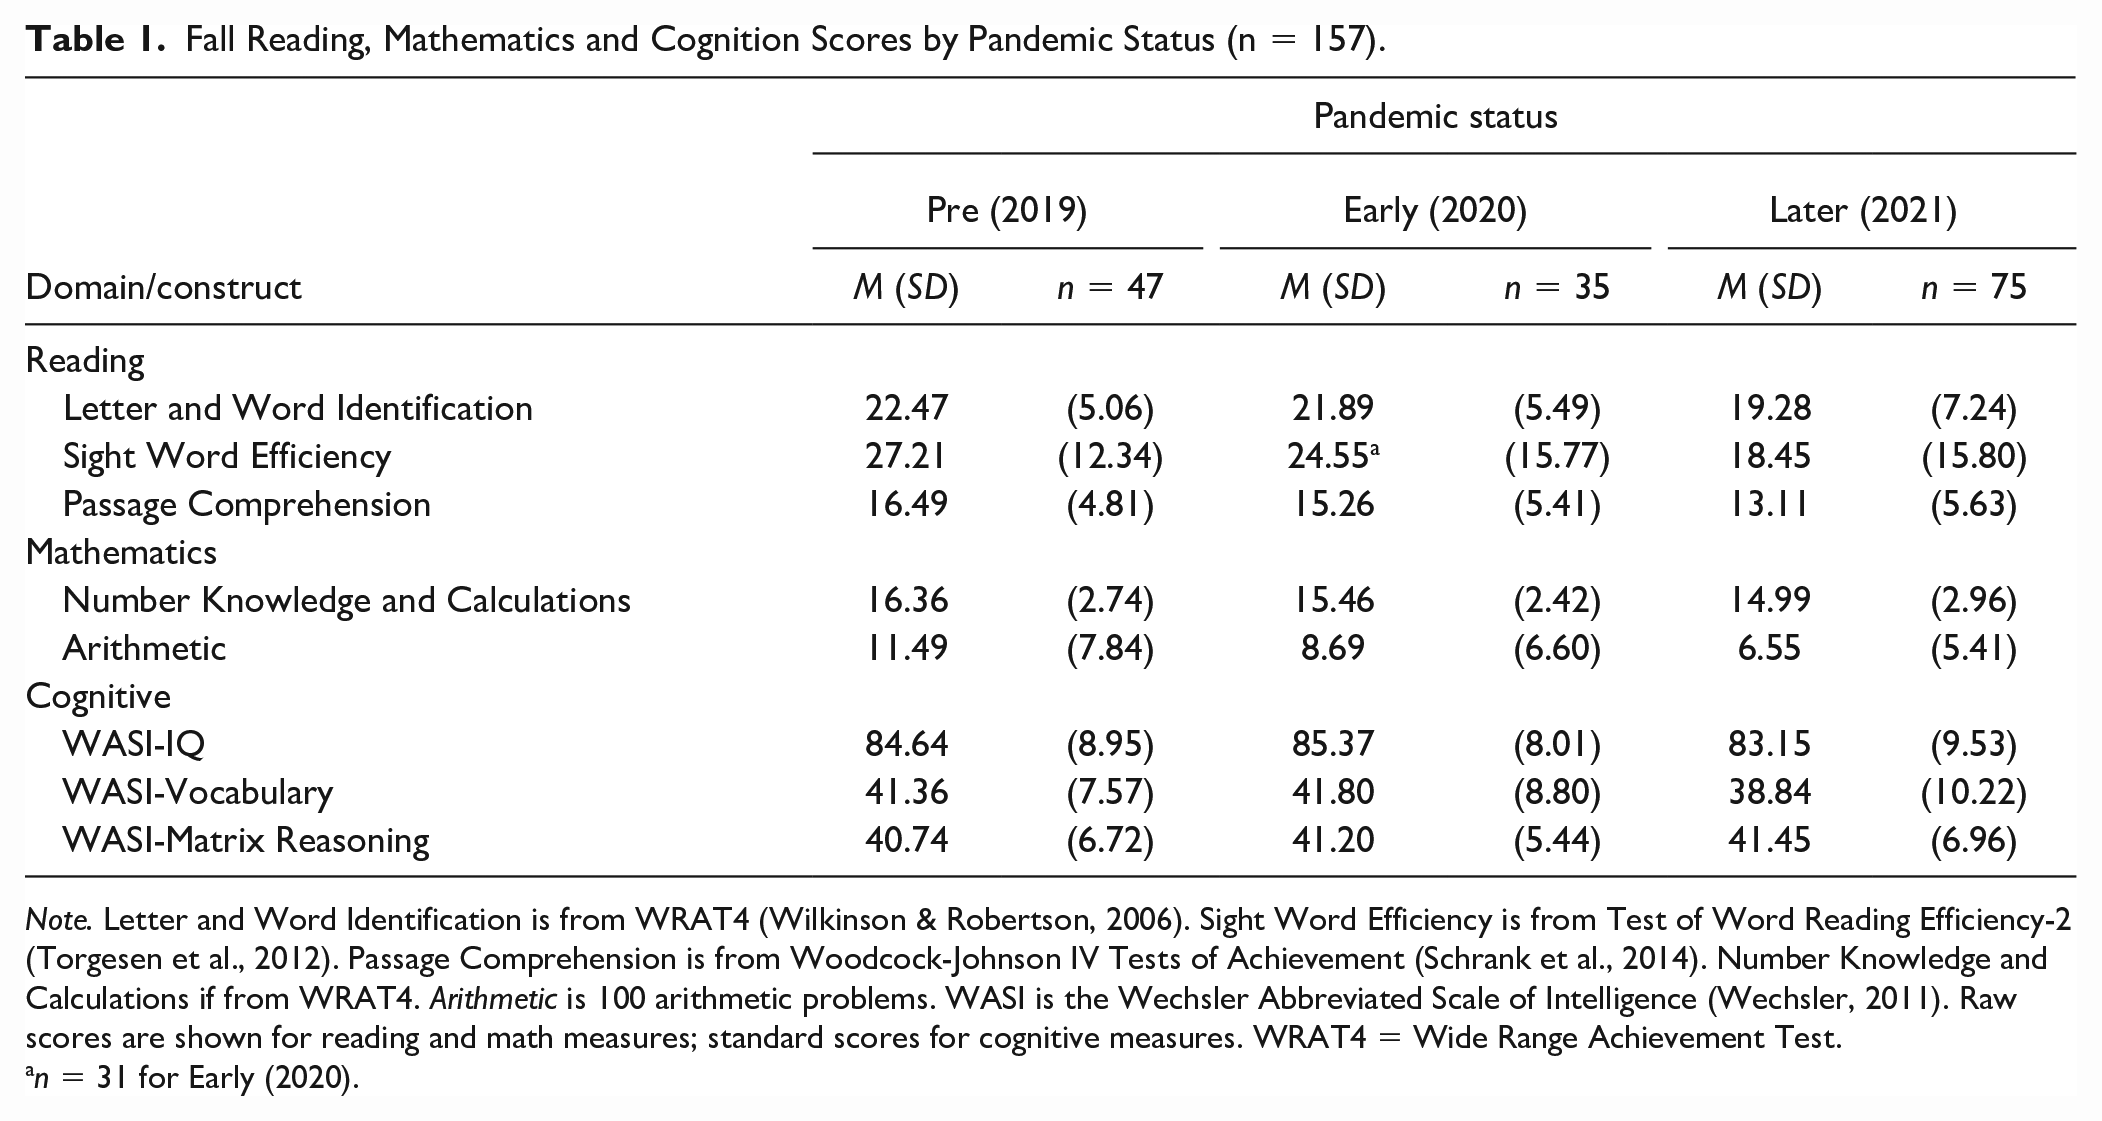
Note. Letter and Word Identification is from WRAT4 (Wilkinson& Robertson, 2006). Sight Word Efficiency is from Test of Word Reading Efficiency-2 (Torgesen et al., 2012). Passage Comprehension is from Woodcock-Johnson IV Tests of Achievement (Schrank et al., 2014). Number Knowledge and Calculations if from WRAT4. Arithmetic is 100 arithmetic problems. WASI is the Wechsler Abbreviated Scale of Intelligence (Wechsler, 2011). Raw scores are shown for reading and math measures; standard scores for cognitive measures. WRAT4 = Wide Range Achievement Test.
n = 31 for Early (2020).
Data Analysis and Results
Four Sight Word Efficiency pretest scores were missing, all from the 2020 to 2021 cohort due to COVID absences. The magnitude of academic declines, expressed as effect sizes (ESs) representing SD units below fall 2019 scores, is shown in Figure 1. At fall 2020 (early pandemic), mean reading declines from the preceding fall were −0.11 to −0.24 SDs (M = −0.18 SDs); at fall 2021 (later pandemic), declines from pre-pandemic status had grown to −0.49 to −0.63 SDs (M = −0.57 SDs). The pattern of math declines was similar, but larger. At fall 2020 (early pandemic), declines from the preceding fall were −0.34 and −0.38 SDs (M = −0.36 SDs); by fall 2021 (later pandemic), declines from pre-pandemic status had grown to −0.48 and −0.77 SDs (M = −0.63 SDs).
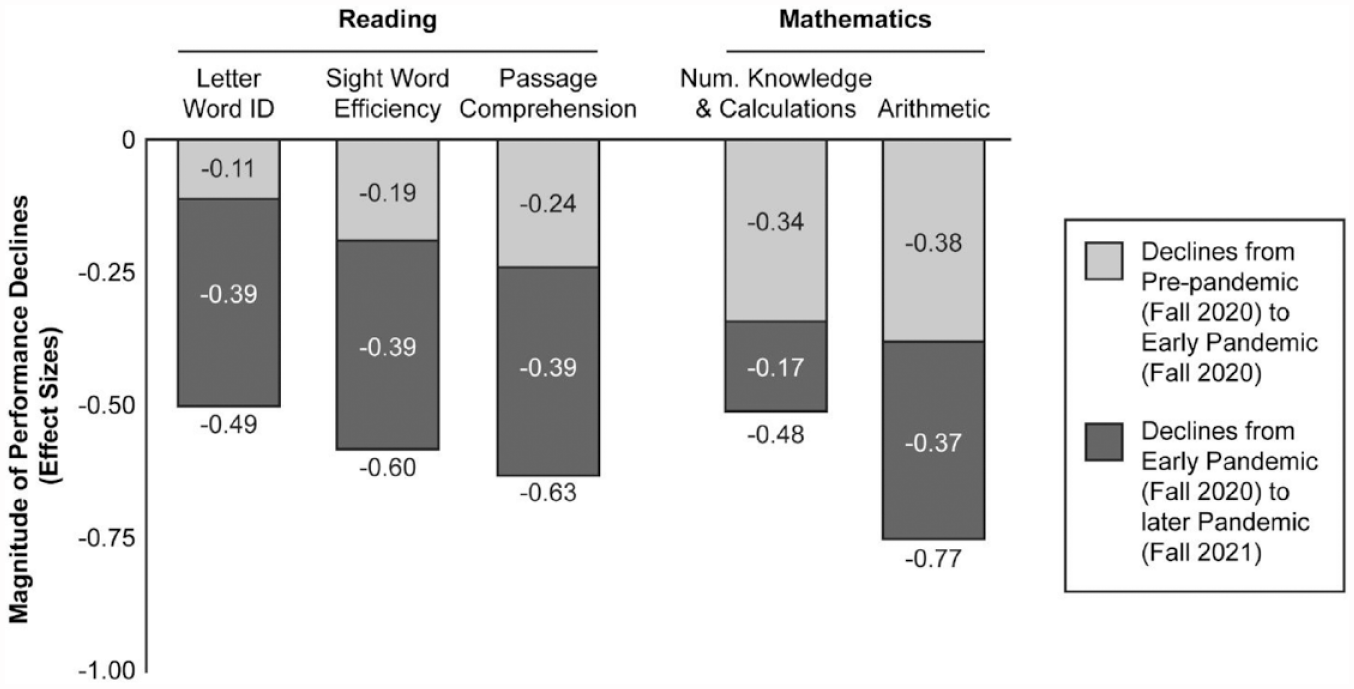
Magnitude of Performance Declines From Fall 2019 to Fall 2020–2021 and From Fall 2019 to 2021 Among Second Graders With Difficulty in Reading Comprehension and Word-Problem Solving.
One-way analysis of variance, with pandemic status as the between-cohorts variable, indicated a statistically significant effect for pandemic status on each reading measure. On Letter-Word Identification, overall F(2, 150) = 4.37, p = .014; follow-up analysis revealed a nonsignificant early pandemic decline (compared to pre-pandemic) (p = .679), whereas later pandemic decline was significant (p = .007). See Figure 1 for graphed ES point estimates. ESs with 95% confidence intervals, provided in brackets, were as follows: for pre-pandemic to early pandemic, −0.11 [−0.55, +0.33]; for early pandemic to later pandemic, −0.39 [−0.79, −0.02]; and for pre-pandemic to later pandemic, −0.49 [−0.79, +0.02]. Similarly, on Sight Word Efficiency, overall F(2, 150) = 5.47, p = .005, with a nonsignificant early pandemic decline (p = .438) but significant later pandemic decline (p = .002). ESs with 95% confidence intervals were as follows: for pandemic to early pandemic, −0.19 [−0.65, +0.26]; for early pandemic to later pandemic −0.39 [−0.81, +0.04]; and for pre-pandemic to later pandemic −0.60 [−0.97, −0.23]. The same pattern occurred for Gates: overall F(2,150) = 6.13, p = .003, with nonsignificant early pandemic decline (p = .304) but significant later pandemic decline (p < .001). ESs with 95% confidence intervals were as follows: for pre-pandemic to early pandemic −0.24 [−0.68, +0.20]; for early pandemic to later pandemic −0.39 [−0.79, +0.02]; and for pre-pandemic to later pandemic −0.63 [−1.00, +0.02].
The pattern was similar in math. On Number Knowledge and Calculations, overall F(2, 150) = 3.54, p = .031; a nonsignificant early pandemic decline (p = .147), but significant later pandemic decline (p = .009). See Figure 1 for graphed ES point estimates. ESs with 95% confidence intervals were as follows: for pre-pandemic to early pandemic, −0.34 [−0.78, +0.10], for early pandemic to later pandemic, −0.17 [−0.57, +0.24], and for pre-pandemic to later pandemic, −0.48 [−0.84, −0.10]. On Arithmetic, overall F(2, 150) = 8.41, p < .001; the early pandemic decline approached significance (p = .055), and the later pandemic decline was significant (p < .001). ESs with 95% confidence intervals were as follows: for pre-pandemic to early pandemic −0.38 [−0.82, +0.06], for early pandemic to later pandemic −0.34 [−0.74, +0.07], and for pre-pandemic to later pandemic −0.77 [−1.14, −0.38].
On cognitive measures, by contrast, there were no significant effects, with smaller ESs. On the estimate of IQ, overall F(2, 150) = 0.85, p = .431; follow-up analysis indicated that early pandemic performance (p = .717; ES = +0.09) and later pandemic performance (p = .376; ES = −0.16) were comparable to pre-pandemic performance. On Vocabulary, overall F(2,150) = 1.73, p = .181, with early pandemic performance (p = .831; ES = +0.05) and later pandemic performance (p = .142; ES = −0.27) comparable to pre-pandemic performance. On Matrix Reasoning, overall F(2, 150) = 0.17, p = .846, with early pandemic performance (p = .757; ES = +0.07) and later pandemic performance (p = .563; ES = +0.10) comparable to pre-pandemic performance.
Potential for Remote Intervention: Method, Data Analysis, and Results
Method
Participants
Participants were screened for study entry as already described. We contrasted participants from the 2018 to 2019 cohort, the most recent cohort for which the RCT’s interventions were delivered entirely in-person, against the 2020 to 2021 cohort, for which the RCT’s interventions involved a combination of in-person and remote delivery. Across the 2 cohorts, 165 met the academic criterion. As per the RCT’s protocol, 58 were not included in the RCT: 14 did not meet the WASI criterion, 12 had scheduling conflicts, 21 were randomly selected out of the RCT once our recruitment goal was exceeded, 3 had very limited or no English (reported by teachers based on school-administered tests), 3 did not provide assent for pretesting, and 5 moved prior to random assignment.
Thus 107 students entered the study and were randomly assigned at the individual level to RC intervention (n = 36), WPS intervention (n = 36), or control (n = 35; the school’s classroom instruction and intervention). During their cohort year, 10 moved, 1 was excluded by the teacher due to behavior, and 1 withdrew assent, leaving 33 in RC intervention, 31 in WP intervention, and 31 in control (respective % attrition: 8.3, 13.9, and 11.4). For the remaining 95 students, mean age was 7.53 years (SD = 0.32); 42.1% were White Latino/a, 36.8% African-American, 12.6% White non-Latino/a, 2.1% Asian, and 6.3% other; 53.7% were female; 51.6% qualified for free lunch; 31.6% received English services; and 5.3% received special education.
RCT’s intervention framework: Improving RC and WPS in coordinated fashion
Existing studies on students with concurrent reading and math difficulty focus the effects of intervention on one or the other domain without an approach for addressing reading and math in coordinated fashion (e.g., Fuchs et al., 2019). This is a troubling omission from the intervention literature because challenging schedules and the costs of supplemental intervention decrease the chances of schools providing more than one intervention per student. Reading intervention usually takes priority over math intervention, leaving many of these students without adequate services. The study’s intervention conditions were designed to improve RC and WPS in coordinated fashion, with a focus on oral language.
Studies of the cognitive, linguistic, and academic predictors of development demonstrate a strong role for oral language comprehension in RC (e.g., Catts et al., 2005; Gough & Tunmer, 1986; Peng et al., 2019) and WPS (e.g., Chow & Ekholm, 2019; Fuchs et al., 2018; Hornburg et al., 2018). This suggests a connection between RC and WPS and the need for focusing on oral language instruction to improve performance in both domains.
For WPS, a strong focus on language includes but is not limited to WPS-specific vocabulary. Such an approach is consistent with calls (Catts & Kamhi, 2017; Ukrainetz, 2017) to connect an instructional focus on oral language to specific RC task demands, and some evidence (Fuchs et al., 2015, 2018) suggests that WPS may be treated as a form of text comprehension. A coordinated approach focused across RC intervention and WPS intervention thus includes embedding language instruction on vocabulary that spans the processing of reading passages and word problems, while including methods to assist students in constructing explicit text-level representations with close reading and text-connecting inferencing (Perfetti et al., 2008; Rapp et al., 2007; Verschaffel & De Corte, 1997; Williams et al., 2016). This serves to build the situation model and problem model (i.e., schema) of reading passages or word-problem statements.
This framework motivated the RCT’s focus: testing whether effects of intervention designed to connect RC, WPS, and oral language comprehension simultaneously improves performance across RC and WPS. This includes, for example, addressing cause-effect informational text structure (a topic typically reserved for RC) in conjunction with change word problems (in which an event increases or decreases a starting amount, thereby creating a new ending amount) and connecting compare-contrast informational text structure (another topic typically reserved for RC) in conjunction with word problems that compare quantities.
In the larger RCT (beyond the two cohorts relevant to the present analysis), a major question is whether such an intervention in one academic domain, with explicit but limited instruction to support transfer to the other domain, produces (a) aligned effects favoring RC intervention over control on RC outcomes and favoring WPS intervention over control on WPS outcomes as well as (b) reciprocal effects favoring RC intervention over control on WPS and favoring WPS intervention over control on RC.
The larger RCT is designed to understand connections between RC and WPS, the role of RC in WPS, and the potential for creating synergy via theoretically coordinated intervention designed to simultaneously improve both outcomes. To assess the potential for remote intervention to mitigate risk of learning loss in the present analysis, we focused exclusively on aligned and reciprocal effects. Other questions posed in the larger RCT were not explored, because they await results on the full sample.
Intervention methods
The RC and WPS intervention conditions each relied on schema-based instruction to teach cause-effect and compare-contrast text structures; embedded instruction on cause-effect and compare-contrast vocabulary; foundational skill instruction (word reading in RC intervention; arithmetic in WPS intervention); a pirate theme for reinforcement and motivation; and a behavior management system. This study’s version of schema-based intervention was based on Vanderbilt Pirate Math (Fuchs et al., 2019), which is validated at second grade (Fuchs et al., 2022). For sample intervention materials representing the special version created for the present study (which is designed to facilitate transfer across from WPS to RC), contact the second author. Each intervention condition included 45 lessons, organized in five units, with three 30-minute lessons per week for 15 weeks. In this RCT, intervention was delivered 1:1.
Units
The five units were structured in parallel fashion in the RC and WPS intervention conditions. Unit 1 (3 weeks) addressed foundational skills required for success in later units. In the RC condition, this included symbolic knowledge (e.g., letters, punctuation), sight-words, decoding, sentence writing, and the vocabulary associated with the intervention’s two passage types. In the WPS condition, this included symbolic knowledge (e.g., meaning of plus sign), counting strategies to add and subtract, 2-digit computation, strategies for solving for missing quantities in the first or second slot of addition and subtraction number sentences, graphs and charts, and vocabulary.
Unit 2 (3 weeks) focused on cause-effect text, which describes a recognizable start event, change event (with clear cause and effect), and end event. Each text included cause-effect vocabulary (i.e., because, since, consequently, as a result, or therefore), which students were taught to understand and use for generating hypotheses about passage type and to interrogate their hypothesis with close reading and systematic strategies for (dis)confirming passage type and building a meaningful, organized representation of the text. The strategies were as follows.
Reading comprehension intervention students relied on a diagram representing a hypothesized cause-effect passage structure, as they re-read the passage. While re-reading, they circled the cause and effect constituting the change and crossed out irrelevant information. Then, they generated notes to capture the text’s cause-effect structure and content (see online supplemental Figures 1 and 2 for the cause-effect diagram and a student’s sample work). Finally, students retold the passage in their own words (while their notes and the passage were covered). They earned points for main ideas about the start, change, and end events and for excluding irrelevant content. In both conditions for both text types, diagrams were faded as soon as the student no longer required them, and students earned points in similar ways.
Word-problem solving intervention students re-read the problem, relying on a different cause-effect diagram (see online supplemental Figures 3 and 4) and a problem-type number sentence (i.e., ST + C = E or ST—C = E for Start amount plus or minus the Change amount equals the End amount) to represent a hypothesized cause-effect structure. (Because the missing quantity could occur in any slot of the number sentences, text type was not synonymous with operation.) While re-reading, they circled start, change, and end quantities; crossed out irrelevant numbers; underlined the word indicating what the word problem question was asking to find; and replaced letters in the problem-type number sentence with numerals to generate a math number sentence and used a blank to represent the missing quantity. Then they solved for the missing information, wrote the numerical answer with a label to answer the word problem’s question, and retold the problem in their own words, including the problem solution and excluding irrelevant information.
Unit 3 (four weeks) focused on compare text, in which two objects are compared in terms of shared and distinguishing features (in passages) and two quantities are compared in word problems in terms of magnitude (how many units in a bigger quantity [e.g., 10] overlap with a smaller quantity [e.g., 7] and how many make the difference [3]). Each text included compare vocabulary (i.e., compare, same, different, alike, both, also, on the other hand, however, but), which students were taught to understand and use in parallel fashion as with cause-effect text.
Reading comprehension condition relied on a chart representing the hypothesized compare text structure, students re-read the passage while they circled the objects being compared and crossed out information irrelevant to the compare-contrast main components. They then generated notes, with a compare chart, to capture shared and distinguishing features (see online supplemental Figures 5 and 6 for a student’s sample work) and retold the passage.
Word-problem solving condition students relied on a compare diagram (see online supplemental Figures 7 and 8) and a problem-type number sentence to represent the hypothesized compare structure (i.e., B—s = D for Bigger amount minus the smaller amount equals Difference amount). They then re-read the problem while they circled bigger, smaller, and difference quantities; crossed out irrelevant numbers; underlined the word indicating what the word-problem question was asking to find; and replaced letters in the problem-type number sentence with numerals to generate a math number sentence and used a blank to represent the missing quantity. Then they solved for the missing number; wrote the numerical answer with a label; and retold the word problem in their own words, including the problem solution and excluding irrelevant information.
Unit 4 (2 weeks) involved explicit instruction to transfer, including the concept of transfer, parallels and distinctions between reading passages and word problems for each text structure, while emphasizing shared vocabulary across domains. Reading comprehension intervention students interpreted and generated work for three cause-effect and three compare word problems; WPS intervention for the same number of cause-effect and compare passages. Unit 5 (3 weeks) provided review and practice on nine passages and nine word problems equally representing text structures, with continued emphasis on parallels across domains.
Activities
Each intervention session consisted of three segments: strategic speeded practice on word reading or arithmetic; the lesson, which introduced or reviewed the content just described within units; and independent work on the day’s and previously introduced content.
With strategic, speeded practice (“Meet or Beat Your Score”), students had 60s to read words or answer arithmetic flash cards (in the RC and WPS conditions, respectively). Students were taught to “know the answer right off the bat” (retrieve from memory) if confident; otherwise, use the taught decoding or counting strategies addressed in Unit 1. Students answered each word or problem correctly because, as soon as an error occurred, they used the taught decoding or counting strategy to correct the error. To discourage guessing or carelessness, seconds elapsed as children executed the strategy as many times as needed to produce the correct answer. In this way, careful but quick responding increased correct responses. Students had a second chance to meet or beat the first score. The day’s higher score was graphed. After speeded practice, tutors conducted the lesson addressing the unit’s content, as just described. In each lesson’s final 5-min practice segment, students completed 2-sided problem sets that included addition and subtraction problems and a word problem (WPS condition) or sentence practice and cloze reading passages (RC condition). Tutors corrected work and provided elaborated feedback on up to three incorrect responses problems to repair solution strategies.
Virtual delivery
All but three pandemic-year students received the RCT’s interventions in accord with the district’s alternating periods of in-person versus remote schooling, reflecting community pandemic levels (see online supplemental Figure 9 for timeline); one control student, 2 RC students, and 1 WPS student received remote schooling for the entire school year due to parent choice. Percentage of RC and WPS intervention lessons delivered in-person was 47.5 and 53.8, respectively. The district supplied students with a laptop, with built-in camera and microphone, internet access, and a video-conferencing platform. The project supplied parents with tutor phone numbers in case of schedule changes or technical difficulties.
All aspects of the intervention remained the same across in-person and remote delivery. For remote delivery, tutors assembled sets of worksheets and small prizes for students, which the school delivered to and collected from parents (along with other schoolwork). During remote delivery, tutors shared their screen, with that lesson’s materials visible. Tutors showed work via the software’s annotate function; students had the option of writing on paper and showing work via the camera, an option rarely used because students enjoyed annotating. For the timed activity, tutors showed each card to the laptop camera, and students responded orally, as in person.
Tutor training and support
Full- or part-time research staff served as tutors. Almost all were university master’s students without teaching certification. Each tutor tutored children in both conditions: six students distributed across the two intervention conditions (three in each condition) or two students (one in each condition). In initial workshops, the second author provided an overview of intervention conditions; explained distinctions and commonalities between conditions and methods to ensure students received their randomly assigned condition; and modeled key activities in both conditions and provided practice in those activities, with corrective feedback.
After the workshop but prior to the first actual lesson, tutors completed a reliability quiz covering major intervention components with at least 90% accuracy and then demonstrated at least 90% accuracy implementing lesson components with a project coordinator. To promote fidelity, tutors studied lesson guides but did not read from guides while working with children.
Tutors attended weekly meetings in which they provided updates on students, discussed learning and behavior challenges, and problem-solved with each other and the first and second authors. Key information on upcoming topics was reviewed and materials were distributed. Every intervention session was audio-recorded. Each week, the project coordinator listened to a randomly selected audio-recording and conducted a live observation of each tutor to identify difficulties, provide corrective feedback, and solve problems.
Measures
We used the same study-entry screening and sample description measures as described above. To answer questions pertaining to remote intervention’s promise, we relied on Sight Word Efficiency and Arithmetic as pretest covariates (see above) and the RCT’s primary outcome measures: experimental tasks aligned with but not used within intervention, designed to be sensitive to the interventions’ focus by requiring children’s engagement in close, analytical reading to build an organized representation of main ideas and schema of text with and without numerals. Toward this end, each measure included two parts.
Reading comprehension experimental task
The RC experimental task includes four passages. Two describe cause-effect events, varying cause-effect vocabulary. One passage is more complex (i.e., a longer sequence of actions with more elaborative explanations for those actions). The more complex passage is narrative and contains no irrelevant information; the less complex passage is informational and contains irrelevant information. Two other passages involve compare-contrast text, varying cause-effect vocabulary. One passage is more complex, describing five features of the objects or people being compared (three features are commonalities; two are distinctions); the simpler passage describes three features (two commonalities; one distinction). The more complex passage is narrative and contains no irrelevant information; the less complex passage is informational and contains irrelevant information.
Testers read each passage aloud while the child reads from a copy, with one re-reading if requested. In Part 1, the child writes notes to capture and organize the passage’s important information. In Part 2, testers cover the passage and notes, and children retell the passage “using their own words.” If the child pauses for 5 s, testers prompt the child to add information; after the second 5 s pause or when 2 min elapse, the retell ends. To ensure all children, regardless of study condition, understand the task, testers read a sample passage aloud; then demonstrate and explain note writing and retelling for that passage.
Audiotapes of retells are transcribed. Scorers (graduate students trained to a scoring criterion of 100% by Ph.D. research staff) applied a rubric to the notes and retells, which awards points for identifying passage type and supporting evidence (4), organization and details (11–16), and the passage’s gist (2). Scores were summed across passages over notes and retells (maximum = 155). Scorers were trained in two 3-hour sessions to .95 agreement. Actual interscorer agreement was 96%. Sample-based α was .82. In pilot work, the correlation with Gates was .66.
Word problem solving experimental task
The WPS experimental task includes 12 problems, 6 cause-effect and 6 compare. Four require addition and eight require subtraction; six include irrelevant information; three provide relevant information in a chart; six place the missing quantity in the final slot of the problem-type number sentence and six in the first or second slot (see WPS intervention description for problem-type number sentences). Testers read each problem aloud while the child reads from a copy, with one re-reading if requested. In Part 1, the child has up to 90 s to solve each word problem, scored for correct math (1 point) and label (1 point) to reflect understanding of the problem’s theme and to transform numerical answers into meaningful solutions.
Part 2 relies on 4 of the 12 problems. Immediately after the child completes work on one of these 4 problems, testers cover the problem and work; then, children retell the problem including its solution in their own words. When a child pauses for 5 s, testers deliver a prompt for more information; after the second 5 s pause or when 90 s elapse, the retell for that problem ends. To ensure all children, regardless of study condition, understand the task, testers explain that the child will retell some problems in their own words, and testers model a retell for a sample problem.
Audiotapes of retells are transcribed. For each problem, scorers (graduate students trained to a scoring criterion of 100% by Ph.D. research staff) assign 1 point for each correct numerical answer and 1 point for a correct label that reflect understanding of the problem’s theme (max score = 24 over 12 problems). Each of the four retells is scored against a rubric, with points awarded for identifying passage type (1), including supporting details without irrelevant information (7) and passage-type vocabulary (1) for each problem. The total WPS score sums across numerical answers (maximum = 12), labels (maximum = 12), and retells (maximum = 40), for a maximum total score of 64. Interscorer agreement was 98%. Sample-based α was .86.
Procedure
Screening measures were administered in early September in large groups and individually. Pretest covariate measures were administered in early October in small groups and individually. Intervention began in late October and continued into March. Within 3 weeks of intervention’s end, posttesting was conducted in small groups and individually. In each session, the order of test administration was fixed to minimize carry-over effects. Sessions ranged from 30 to 60 min. Testers were trained before screening, again before pretesting, and again before posttesting and had to demonstrate criterion administration accuracy with senior project staff on each measure before testing. Scoring was completed with study condition masked. All test sessions were audio-recorded; 15% were randomly selected, stratified by tester, and doubled-scored by independent coders to check for accuracy. Agreement exceeded 99%. In pilot work, the correlation with Story Problems was .63.
Data Analysis and Results
Means and standard deviations on descriptive WRAT-4 reading and mathematics variables are in Table 2, by RCT condition and delivery mode. Missing data consisted of four Sight Word Efficiency pretest scores in the 2020 to 2021 cohort. To retain all cases in reading analysis under missing-at-random assumptions, the covariate was treated as endogenous, with the sample mean, variance, and covariance freely estimated (Sterba, 2014). At pretest, there were no significant main effects for RCT condition and no significant interactions between RCT condition and delivery mode (for WRAT reading or WRAT math, respectively, p = .403 and .563 for RCT condition; .534, and .705, respectively, for interaction).
Pre- and Posttest Reading Comprehension and Mathematics Word-Problem Scores by Delivery Mode and Intervention Condition (n = 95).
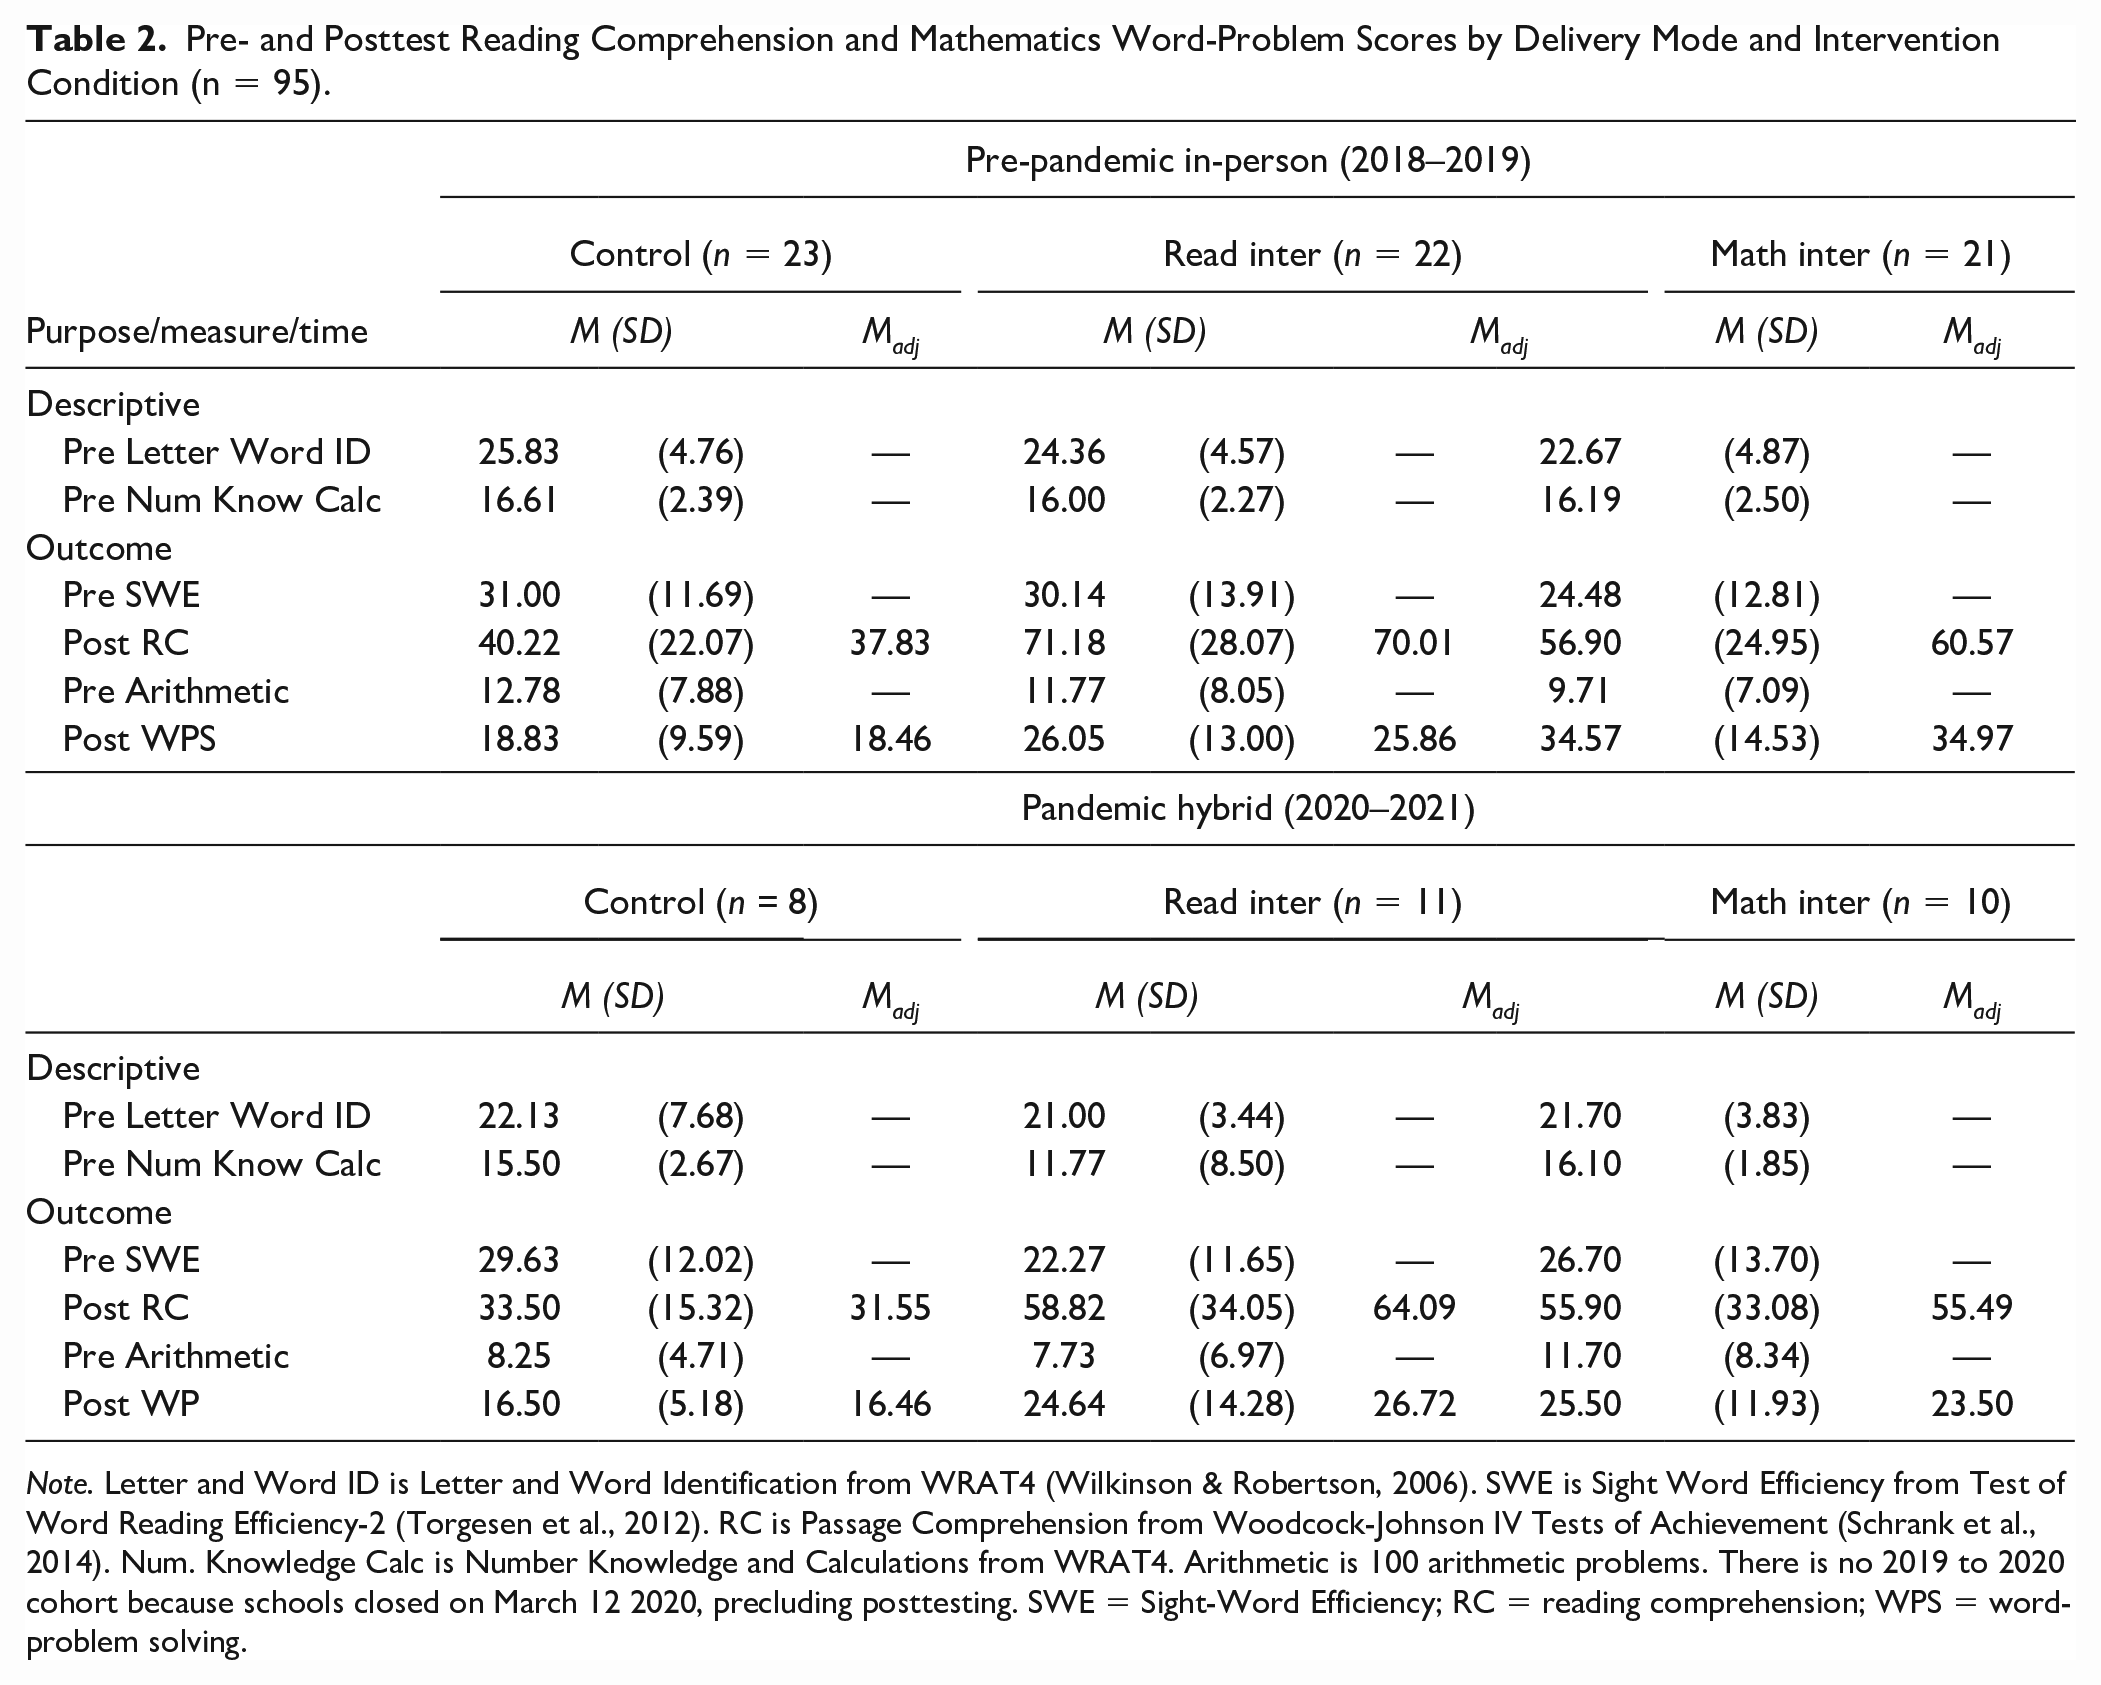
Note. Letter and Word ID is Letter and Word Identification from WRAT4 (Wilkinson & Robertson, 2006). SWE is Sight Word Efficiency from Test of Word Reading Efficiency-2 (Torgesen et al., 2012). RC is Passage Comprehension from Woodcock-Johnson IV Tests of Achievement (Schrank et al., 2014). Num. Knowledge Calc is Number Knowledge and Calculations from WRAT4. Arithmetic is 100 arithmetic problems. There is no 2019 to 2020 cohort because schools closed on March 12 2020, precluding posttesting. SWE = Sight-Word Efficiency; RC = reading comprehension; WPS = word-problem solving.
To evaluate whether intervention effects were moderated by pandemic status, we conducted analyses of variance on posttest RC and WPS with two between-cohorts variables (RCT condition and delivery mode), with foundational skill used as a covariate: pretest Sight Word Efficiency when testing effects on RC; pretest Arithmetic when testing effects on WPS. Means and standard deviations on these variables are shown in Table 2 by delivery mode and RCT condition. As with descriptive measures, there were no significant main effects on either pretest covariate for RCT condition or the interaction between RCT condition and delivery mode: on Sight Word Efficiency and pretest Arithmetic, respectively, p = .421 and .883 for RCT condition effect; p = .379 and .225, respectively, for interaction.
Analyses revealed significant effects of the RCT’s conditions on acquisition and transfer outcomes across delivery modes, without significant interactions between RCT condition and delivery mode. On the RC outcome, RCT condition, F(2, 89) = 7.57, p < .001; delivery mode F(1, 89) = 1.26, p = .264 (i.e., at posttest, controlled for covariate); and RCT condition x delivery mode, = 0.32, p = .726. On WPS outcome, RCT condition, F(2, 89) = 6.55, p = .002; delivery mode F(1, 89) = 2.43, p = .123 (i.e., at posttest, controlled for covariate); and RCT condition x delivery mode, = 0.798, p = .453. Thus, the significant RCT condition effects were robust across delivery modes.
Across delivery modes on the RC outcome, ESs were 1.10 [0.56, 1.61] for RC intervention over control, indicating acquisition of RC intervention skills and strategies, and 0.75 [0.23, 1.24] for WPS intervention condition over control, indicating transfer from WPS intervention to the RC outcome. Across delivery modes on the WPS outcome, ESs were 1.14 [0.59, 1.66] for WPS intervention over control, indicating acquisition of WPS intervention skills and strategies, and 0.66 [0.14, 1.16] for RC intervention condition over control, indicating transfer from WPS intervention to the RC outcome.
Although the interaction was not significant, we provide ESs for reader edification comparing each intervention condition over control on each acquisition and transfer outcome as a function of intervention delivery mode in Figure 2. (The RC outcome represented acquisition for the RC intervention condition but transfer for the WPS intervention condition. The WPS outcome represented acquisition for the WPS intervention condition but transfer for the RC intervention condition.) ESs with 95% confidence intervals for acquisition outcomes were as follows: for read-to-read pre-pandemic, 1.28 [0.62, 1.89]; read-to-read pandemic, 1.17 [0.14, 2.09]; math-to-math pre-pandemic, 1.35 [0.68, 1.98]; and math-to-math pandemic, 0.73 [−0.26, 1.66]. ESs with 95% confidence intervals for transfer were as follows: read-to-math pre-pandemic, 0.65 [0.04, 1.24]; read-to-math pandemic, 0.90 [0.09, 1.81]; math-to-read pre-pandemic, 0.97 [0.33, 1.57]; and math-to-read pandemic, 0.89 [−0.12, 1.82].
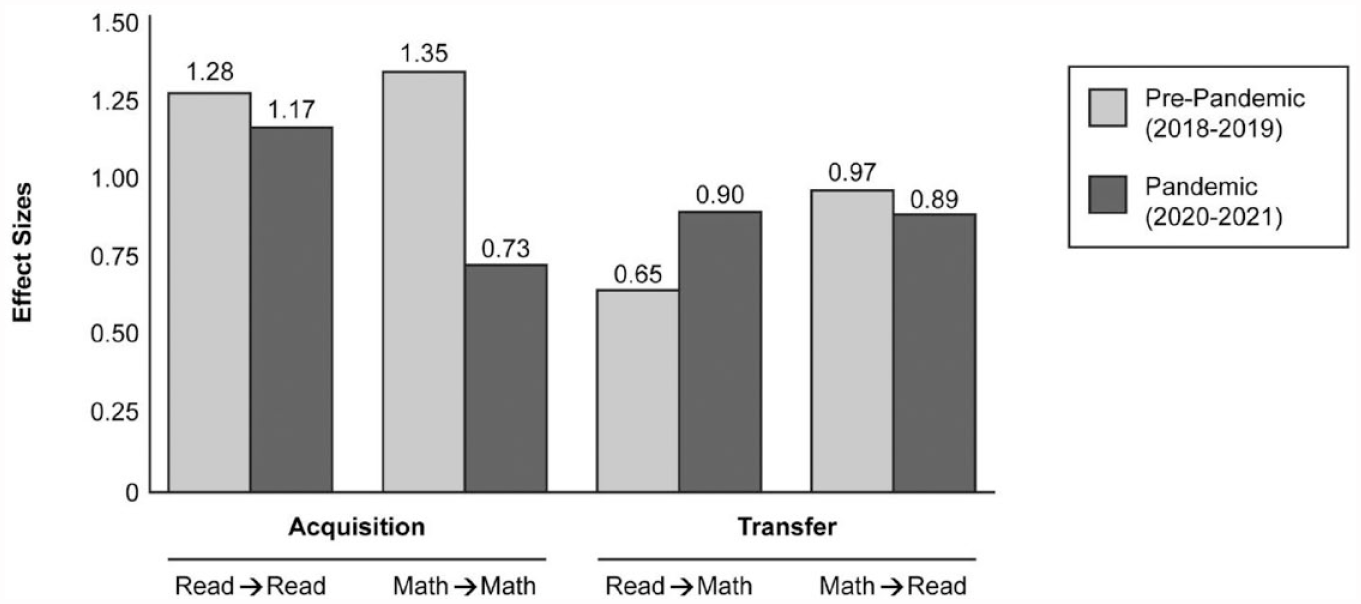
Effect Sizes as a Function of Pandemic Status for Acquisition and Transfer Outcomes
We also examined tutors’ fidelity of implementation as a function of delivery mode. Because we had alternating periods of in-person and remote intervention within the same tutors during the pandemic year, we treated delivery mode as a within-tutor variable during the pandemic year. Each session was audio-recorded. We coded 15% (randomly selected to ensure comparable representation of intervention conditions, tutors, and delivery mode) against a checklist of essential points addressed; percentage agreement between independent coders was 95%. We compared differences in-person versus remote sessions within six tutors in the pandemic sample. The mean percentage of points addressed was 96.66 (SD = 3.09) for in-person sessions; 94.98 (SD = 6.76) for remote sessions; t(5) = 0.45, p = .671 for dependent samples.
Discussion
To estimate the severity of pandemic learning loss among students with comorbid difficulty, we compared three cohorts drawn from an ongoing RCT: fall of 2019, 2020, and 2021. The overall effect of pandemic status (pre-pandemic vs. early pandemic vs. later pandemic) was statistically significant on each reading and math measure. Follow-up analysis on each measure indicated that early pandemic performance (fall 2020) did not significantly differ from pre-pandemic performance (fall 2019). ESs were −0.11 to −0.24 in reading; −0.34 and −0.38 in math. This is in line with Lupas et al. (2021), who reported nonsignificant differences in early pandemic learning loss when comparing 2018 to 2019 against 2019 to 2020 cohorts of students with attention deficit hyperactivity disorder, with smaller effects for reading and spelling than math. In our analysis, which focused on a different population of students with learning difficulty and extended Lupas et al.’s timeframe for indexing pandemic learning loss, effects were statistically significant by fall of 2021, with more declines in reading and math: ESs were −0.49 to −0.63 in reading and −0.48 and −0.77 in math.
To judge the severity of learning loss in our sample of students with comorbid RC and WPS difficulty, it is instructive to compare these ESs against those reported by Kuhfeld et al. (2022), who focused on the same time points but for the general population of students (i.e., not selected for learning difficulty). In reading, their ESs for fall 2019 versus 2020 suggest modest improvement at most grades even though the fall 2020 sample experienced a 3-month lapse in schooling just before summer vacation. At third grade (closest to our second-grade sample), the ES was +0.05 (0.00 at grade 4, −0.02 at Grade 5, +0.03 at Grade 6, +0.05 at Grade 7, and +0.04 at Grade 8). This stands in stark contrast to the declines in expected growth registered between fall 2019 and 2020 for students with comorbid difficulty, with ESs from −0.11 to −0.24. By fall 2021, the contrast was more dramatic: Kuhfeld et al.’s reading loss ES at Grade 3 (−0.18) was larger than any other grade level. Yet, our ESs for students with comorbid difficulty were three times larger, with a mean ES of −0.57. (As we explain in our discussion of study limitations, readers should exercise caution when interpreting our ESs, which necessarily involve large confidence intervals due to small sample size.)
Most reports of the general population indicate greater learning loss in math than reading, as reflected in Kuhfeld et al.’s (2022) report. This may be due to school curricula with numerous strands of math performance within and across grades. For example, in primary school, strands include concepts, numeration, measurement, basic facts, algorithmic computation, and word problems; in intermediate grades, attention shifts to rational numbers, which challenge student understanding of numeration and computation in novel ways; and the high school curriculum comprises a series of loosely connected topics including algebra, geometry, trigonometry, and calculus. By contrast, in reading, five domains of performance, phonological awareness, decoding, fluency, vocabulary, and comprehension, build in a coherent way across grade levels (Mehta et al., 2005). The assumption is that many more component skills comprise mathematics, and it is unclear whether and how strengthening performance on certain strands can be expected to promote competence in others. This creates greater challenges for sustained progress in math when instructional quantity and quality are compromised, as during the pandemic.
Even so, by later pandemic, learning loss for students with comorbid difficulty was of more similar magnitude in reading and math (ESs of −0.49, −0.60, and −0.63 in reading; −0.48 and −0.77 in math) than was the case in the general population. Less even learning loss for the general population may reflect the general population’s greater capacity to profit from unstructured learning opportunities, which is coupled with more naturally occurring learning opportunities in the home environment relevant to reading than math. By contrast, students with learning difficulty need the structured instruction schools provide (Fuchs et al., 2021; Vaughn et al., 2022).
As with reading, however, math learning loss was substantially larger for students with comorbid difficulty than for the general population. Kuhfeld et al.’s ES from fall 2019 to 2020 at third grade was −0.12 (−0.18 at Grade 4, −0.15 at Grade 5, −0.12 at Grade 6, −0.11 at Grade 7, and −0.11 at Grade 8). Math ESs for students with comorbid difficulty, as in reading, were approximately three times larger: −0.34 and −0.38. At fall 2021, Kuhfeld et al.’s third-grade ES was −0.25 (similar at other grades), with ESs for students with comorbid difficulty two and three times larger: −0.48 and −0.77.
The conclusion that students with comorbid difficulty fared worse in both academic domains is also evident even when the reference group is limited to students in high poverty schools. This is the case even though only 50% of students in our sample came from high-poverty households. In reading, Kuhfeld et al.’s ESs for students in high-poverty schools at Grade 3 was −0.24 (−0.17 to −0.25 at other grades) versus −0.49 to −0.63 for second-grade students with comorbid difficulty; in math, −0.37, (0.28 to −0.37 at other grades) versus −0.48 and −0.77 for second-grade students with comorbid difficulty.
To rule out small sample size or unobserved differences among cohorts for the declines between cohorts of students with comorbid difficulty identified in the present analyses, we considered declines as a function of cohort on cognitive measures. Cognitive performance is expected to be more stable and less dependent on schooling than is the case for academic achievement (e.g., Schneider et al., 2014). In contrast to consistently significant overall effects in reading and math, none of the effects on cognitive measures was significant. This lends confidence to the conclusion that declines in reading and math scores for students with comorbid difficulty can be attributed to pandemic interruptions in schooling, despite small sample sizes.
The problem of differential learning loss in a population of learners who entered the pandemic with pre-existing comorbid difficulty across RC and WPS grows more alarming in light of recent results from a special administration of the National Assessment of Educational Progress (NAEP; https://www.nationsreportcard.gove/highlights/ltt/2022/; U.S. Department of Education, 2022b). Focused on 9-year-old students, that report compared winter 2022 scores (well into more normalized schooling) against winter 2020 scores (prior to school closures). Scale score declines at the 90th, 75th, 50th, 25th, and 10th percentiles were 2, 3, 4, 8, and 10 in reading and 3, 5, 8, 11, and 12 in math. The negative association between academic standing and “post-pandemic” declines, along with present-day special educator shortages (National Center for Education Statistics, 2022), raise concern that recovery from differential learning loss for students with comorbid difficulty will prove challenging. Although this finding is based on students with disabilities, it likely generalizes to students with comorbid difficulty.
Differentially severe learning loss for students with comorbid difficulty also suggests that reading and math progress in this population depends more on schooling generally and more on supplemental intervention specifically, than is the case for the general population. As documented, intervention was less available during the pandemic’s school closures for students with disabilities, who experienced differential rates of remote schooling (Connecticut State Department of Education, 2021).
This was also the case for special education intervention services (Jones et al., 2020). And it is also likely for students with comorbid and other forms of learning difficulty, who receive tiered intervention that occurs as part of schools’ responsiveness-to-intervention (RTI) systems or multi-tier systems of support (MTSS), as reflected in the 2022 NAEP report. There, students in the lowest quartile, compared to those in the highest quartile, had less regular access during remote learning to a teacher for reading or math help (45% vs. 26%), more difficulty recognizing their own comprehension difficulties (32% vs. 67%), less help when needed (62% vs. 82%), and less access to online learning resources (41% vs. 60%).
This brings us to the second issue explored in the present set of analyses: the promise of remotely delivered structured intervention for mitigating the risk associated with learning loss from extended school closures for students with comorbid difficulty. To explore this issue, we focused on two cohorts from the same RCT. The 2018 to 2019 cohort was the most recent cohort to receive the intervention entirely in-person. In the 2020 to 2021 cohort, intervention involved a mix of in-person and remote (hybrid) delivery. We examined whether delivery mode moderated fidelity of implementation or the pattern of learning effects favoring structured RC intervention over control and favoring structured WPS intervention over control.
Results indicated that fidelity was strong and similar for the two delivery modes. Despite the logistical and technical challenges involved in remote implementation, 95% of lesson points were addressed in remote delivery; the figure for in-person delivery was 96%. This suggests that with the same intervention structure and with tutor training and monitoring in place across delivery modes, fidelity can be achieved with virtual procedures.
Moreover, in line with fidelity, effects on student learning were not moderated by delivery mode. For each intervention condition versus control, on acquisition and transfer outcomes, ESs were strong across delivery modes. In remote implementation, ESs for RC intervention over control were 1.32 on the RC outcome and 0.98 on the transfer WPS outcome. ESs for word-problem solving intervention over control were 0.79 on the WPS outcome and 0.99 on the transfer RC outcome.
This analysis extends the handful of available studies on remote intervention delivery during the pandemic in three ways. First, in the present analysis, we relied on a novel design for investigating pandemic effects. Within a multi-cohort RCT, within which students in each cohort were identified for participation and randomly assigned to intervention versus control in the same way, the analysis took advantage of a naturally occurring difference between cohorts: one received interventions via in-person delivery, and the other received the same interventions remotely. Given the need for additional analyses on pandemic samples, as framed in the introduction to this report, researchers with similarly structured extant databases may take a similar approach to deepen understanding of critical issues for designing mitigation strategies to address extended school closures for this and other vulnerable groups.
The second and third extensions to the literature concern reliance on more demanding remote delivery conditions and more complex interventions. Each contributes to a more stringent test of remote intervention’s promise. In terms of conditions, participation in remote delivery in the present analysis was not pre-conditioned on availability of in-home technology and parents, as required in prior work. Instead, as more in the pandemic, remote delivery in the present analysis often necessitated on-the-spot problem solving with school-issued technology and less-than-optimal supervision and learning conditions overseen by caregivers of questionable quality. This not only created a more stringent test of remote intervention’s promise but also enhanced external validity to the pandemic’s conditions. At the same time, it reduced the threats to internal validity inherent in requiring criteria for the remote delivery condition but not for the in-person condition.
In terms of intervention complexity, the prior studies we located all addressed foundational reading skill. The two interventions used for the present analysis were more complex. Each involved multiple activities within each session, with expanding content demands over 45 sessions while addressing transfer to another academic domain. These variations within and between lessons and innovative methods posed more demands on tutors, materials, technology, and student response requirements than likely is the case when the intervention focus is foundational reading skill. Yet, despite demanding conditions and complex interventions, fidelity in the present analysis was comparably strong for remote and in-person delivery and on student acquisition and transfer outcomes. ESs favoring intervention over control, when each complex intervention was delivered remotely, were strong.
At the same time, important limitations warrant caution when considering the results of our analyses. As already mentioned, small sample sizes produce a lack of precision in the ES point estimates, and readers should take note of the large confidence intervals reported in the results section. Clearly, additional research is needed using other pandemic databases to expand understanding of remote delivery’s potential. Also, the RCT’s interventions were delivered in 1:1 format. While this may hold relevance for delivering intervention remotely, our ESs likely overestimate the magnitude of effects when these interventions are implemented within the group sizes found in school-based in-person RTI and MTSS. Additionally, we note that no empirical basis presently exists for demarcating severe learning loss. A threshold may eventually evolve, as research provides data on the relation between learning loss and important long-term outcomes, such as high school graduation. In the meantime, readers should note that our use of the word severe is relative, referring to learning loss two to three times greater than occurs in the general population.
With these limitations in mind, we draw three major conclusions. First, compared to learning loss in the general population, pandemic reading and math declines were dramatically larger for students with pre-pandemic difficulty across RC and word-problem solving. Second, despite reliance on demanding pandemic-like conditions and complex interventions in the present analyses, fidelity was comparably strong for remote and in-person delivery. Third, effects for remote versus in-person delivery on students’ acquisition and transfer learning were comparable and strong for complex interventions on higher order RC and word-problem solving skills.
In this way, results of the present analysis on remote delivery represents a proof-of-concept demonstration that remote delivery of complex intervention can be provided to vulnerable students during extended school closures with fidelity and strong outcomes. Although we do not underestimate the challenges schools will face providing tutors the necessary level of support to operate remotely in an effective manner, the severity of learning loss for students with comorbid difficulty revealed in our analyses creates a moral imperative for schools to engage in emergency preparedness for extended school closures that may occur in the future.
According to the School Pulse Survey (National Center for Education Statistics, U.S. Department of Education, Institute of Education Sciences; see https://nces.ed.gov/surveys/spp/?utm_medium=email&utm_source=newsflash), schools with written plans to handle a pandemic scenario increased from 46% in the 2017 to 2018 school year to 82% in 2022. Even so, current guidance from the Centers for Disease Control and Prevention for such plans (https://www.cdc.gov/flu/pandemic-resources/pdf/schoolchecklist.pdf) lacks specificity and is without mention of students with intervention needs. Relevant guidance from the U.S. Department of Education is limited to the following: Consider and plan with community partners to address issues specific to your school environment, such as students with special needs, including those who are in special education, receiving supplemental services at school, English Language Learners, or have special health care needs (https://www2.ed.gov/admins/lead/safety/emergencyplan/pandemic/planning-guide/basic.pdf).
Clearer guidance to schools for effectively addressing vulnerable students, including those with comorbid difficulty, is instead required to structure schools’ collaborative planning at the start of each school year. In this process, classroom teachers, special educators, RTI and MTSS teams, interventionists, and families create a blueprint that specifies empirically based methods for identifying students in need of remote intervention delivery, for selecting interventions to be delivered remotely to these children, and for helping tutors structure and implement remote intervention delivery effectively.
Supplemental Material
sj-docx-1-ldx-10.1177_00222194231170313 – Supplemental material for Severe Pandemic Learning Loss and the Promise of Remotely Delivered Intervention in Students With Comorbid Reading and Mathematics Learning Difficulty
Supplemental material, sj-docx-1-ldx-10.1177_00222194231170313 for Severe Pandemic Learning Loss and the Promise of Remotely Delivered Intervention in Students With Comorbid Reading and Mathematics Learning Difficulty by Lynn S. Fuchs, Pamela M. Seethaler, Douglas Fuchs and Daniel Espinas in Journal of Learning Disabilities
Footnotes
Declaration of Conflicting Interests
The author(s) declared no potential conflicts of interest with respect to the research, authorship, and/or publication of this article.
Funding
This research was supported by 2 P20 HD075443, 3P20 HD075443-08S1, 1 R01 HD097772, and Core Grant HD15052 from the Eunice Kennedy Shriver National Institute of Child Health & Human Development to Vanderbilt University. The content is solely the responsibility of the authors and does not necessarily represent the official views of the Eunice Kennedy Shriver National Institute of Child Health & Human Development or the National Institutes of Health.
Supplemental Material
Supplemental material for this article is available on the Journal of Learning Disabilities website with the online version of this article.
References
Supplementary Material
Please find the following supplemental material available below.
For Open Access articles published under a Creative Commons License, all supplemental material carries the same license as the article it is associated with.
For non-Open Access articles published, all supplemental material carries a non-exclusive license, and permission requests for re-use of supplemental material or any part of supplemental material shall be sent directly to the copyright owner as specified in the copyright notice associated with the article.