
Abstract
Students with disabilities (SWD) who are Black or Hispanic have been reported to be more likely to be placed primarily outside of general education classrooms while attending U.S. schools. Federal law and regulation require monitoring of special education placement based on race or ethnicity. Yet, whether and to what extent racial or ethnic disparities in placement are explained by bias or by other explanatory factors is currently unclear. We evaluated for racial and ethnic bias in special education placement by analyzing longitudinal data from two independent samples of SWD (N values range 590–1,130) attending U.S. elementary schools. We statistically controlled for plausibly exogenous sociodemographic, academic, and behavioral risk factors measured in kindergarten in analyses of the students as they attended first, third, and fifth grades between the 1999–2000 and 2015–2016 school years. Of the resulting 12 Black or Hispanic grade-year–specific tests, 11 (i.e., 92%) indicated that controls for kindergarten explanatory factors—particularly significant academic difficulties—fully explained the risk initially attributable to race or ethnicity. We observed little evidence that bias explains racial or ethnic disparities in special education placement in U.S. elementary schools.
Keywords
Students with disabilities (SWD) in U.S. schools are legally entitled to special education services consistent with the goals of their Individualized Education Programs (IEPs). Placement decisions about where the services are provided should be based on a student’s individual educational needs and should also result in the least restrictive environment possible (Individuals with Disabilities Education Improvement Act [IDEA], 2004). However, delivery of special education services may appropriately result in placement primarily outside of general education classrooms if the student’s individual needs require more intensive services to meet his or her educational goals (Kauffman et al., 2018; Mathur & Jolivette, 2012). About 30% of students with learning disabilities (LDs), 35% of students with other health impairments, and 51% of students with emotional disorders spend less than 80% of their school day in general education classrooms (U.S. Department of Education, Office of Special Education and Rehabilitative Services, Office of Special Education Programs, 2020).
Racial and Ethnic Disparities in Special Education Placement
Students of color with disabilities have been reported to be more likely to be placed primarily outside of general education classrooms (Cartledge & Dukes, 2009; Ruppar et al., 2017; Sullivan, 2011). For example, 33% of SWD who are White spend less than 80% of their school day in U.S. general education classrooms. The contrasting percentages for SWD who are Black or Hispanic are 41% and 38%, respectively (U.S. Department of Education, Office of Special Education and Rehabilitative Services, Office of Special Education Programs, 2020). Analyses of state-level data indicated that SWD who are Black were less likely to be placed in general education classrooms and were three times more likely than those who are Whites to be placed in restrictive settings (Skiba et al., 2006). Analyses of one district’s data found that SWD who are Black or Hispanic were more likely to be placed outside of general education classrooms (De Valenzuela et al., 2006). Fierros and Conroy (2002) reported that 16% of SWD who are White versus 33% and 28% of SWD who are Black or Hispanic, respectively, were primarily educated outside of general education classrooms in the United States. Racial disparities in placement have also been observed among students with the same disability conditions (Skiba et al., 2006).
Findings that SWD who are Black or Hispanic are more likely than SWD who are White to be placed primarily outside of general education classrooms have been inferred to result from biased policies and practices (U.S. Department of Education, 2016). Racial and ethnic disparities in placement have been characterized as “unwarranted seclusion” of students of color (Fierros & Conroy, 2002, p. 40), with special education described as an alternative legal strategy to racially segregate students (Artiles et al., 2016; Ferri & Connor, 2005; Reid & Knight, 2006; Zion & Blanchett, 2011). Waitoller and Maggin (2018) characterized racial disparities in special education placement as evidence of inequities constituting a “continuing dilemma” (p. 9). However, recent work repeatedly finds that initially observed over-representation of racial and ethnic minority students in special education is fully or largely explained by other explanatory factors including between-group differences in achievement. Black and Hispanic students instead may be relatively under-identified as having disabilities (Morgan et al., 2020; Morgan, Farkas, Hillemeier, & Maczuga, 2017; Morgan, Farkas, Hillemeier, Mattison, et al., 2015; Shifrer, 2018). Despite this recent work, both federal law (i.e., IDEA, 2004) and regulations (i.e., U.S. Department of Education, 2016) require schools to report special education placement by race or ethnicity. States are to use a standard method to set numerical targets of disproportionality in special education placement as well as in identification and discipline. Schools where SWD of color are over-represented in more restrictive special education settings are required to reallocate 15% of their federal funding and to review their special education policies, practices, and procedures.
Extant Work’s Limitations
Whether and to what extent bias explains racial and ethnic disparities in special education placement in the United States is currently unclear. Very few studies have approximated contrasts between similarly situated SWD who differ in their race or ethnicity. Such contrasts are important because other factors may confound inferences based on unadjusted descriptive statistics (Farkas et al., 2020; Morgan et al., 2018; Morgan, Farkas, Cook, et al., 2017; U.S. Department of Education Office for Civil Rights, 2016), resulting in attributions of racial and ethnic disparities in special education placements to biased practices without considering other potential explanations. Such potential explanations include greater exposure to economic disadvantage and its correlates (e.g., lead exposure, low birthweight) and a corresponding increase in the likelihood of cognitive or behavioral impairments and so academic or behavioral difficulties in school (Donovan & Cross, 2002). Owing to historical and on-going bias and discrimination, students who are Black or Hispanic are more likely to be exposed to poverty and so display significant academic and behavioral difficulties including by school entry (e.g., Morgan, Farkas, Hillemeier, Mattison, et al., 2015; Wei et al., 2013; for an extensive review, see Donovan & Cross, 2002). Achievement gaps are relatively stable over time (Morgan et al., 2009; von Hippel & Hamrock, 2019). Differential exposure to poverty explains racial and ethnic achievement disparities during school (Reardon et al., 2019; Shores et al., 2020). The greater likelihood of experiencing poverty resulting from historical and ongoing racially biased housing and neighborhood segregation also disproportionately exposes Black and Hispanic children to early risk factors such as preterm birth and environmental toxins that increase the likelihood for disabilities and other health conditions (Krieger et al., 2020; Mehta et al., 2013; Turney, 2020). Black and Hispanic students are also more likely to attend racially segregated and economically disadvantaged schools with fewer resources and where teacher turnover more often occurs (Lankford et al., 2002; Sorensen & Ladd, 2020).
Significant academic or behavioral difficulties constitute strong confounds to inferences that racial or ethnic disparities in special education placement result from bias (Donovan & Cross, 2002; Kim et al., 2018). U.S. schools may instead be attempting to address academic or behavioral difficulties being experienced by SWD by providing intensive services (e.g., small-group classes, individualized instruction, frequent monitoring, and corrective feedback) that are more likely to be delivered in special education settings (Kauffman et al., 2018). If SWD who are Black or Hispanic are more likely to display significant academic or behavioral difficulties than SWD who are White including by kindergarten, then between-group disparities in underlying impairment rates resulting from historical and ongoing societal inequities may explain any initially observed between-group disparities in special education placement. Identifying potentially modifiable factors that consistently predict special education placement by the primary grades might also advance efforts to increase access to general education classrooms by SWD. In contrast, between-group disparities in placement evident after accounting for between-group differences in academic or behavioral difficulties as well as other explanatory factors by kindergarten, especially if repeatedly observed across grade levels and time periods, would provide stronger evidence of potential bias in special education placement by school personnel.
To date, the few studies of racial or ethnic disparities in special education placement that account for other explanatory factors find SWD of color are no more likely to be placed outside of general education classrooms than SWD who are White (Frey, 2002; Hosp & Reschly, 2002). Frey’s (2002) analyses of responses from 350 special education teachers from 10 school districts given matched vignettes indicated that economic disadvantage but not race or ethnicity explained the placement recommendations for students with behavioral disorders. Hosp and Reschly’s (2002) analyses of placement data for 230 students with LDs from four school districts indicated that other factors including severity of reading and mathematics difficulties rather than race or ethnicity explained placement. Hosp and Reschly (2002) suggested that “disproportionate placement in more restrictive programs, when it exists, is not a matter of bias in the process of special education placement” (p. 235).
Existing analyses of samples that might better generalize to the U.S. school-age population (Fierros & Conroy, 2002; U.S. Department of Education, Office of Special Education and Rehabilitative Services, Office of Special Education Programs, 2020) have been unable to account for alternative explanatory factors by school entry including direct measures of student-level academic or behavioral difficulties (Green et al., 2020). Prior work approximating contrasts between SWD who were similarly situated except for their race or ethnicity analyzed teacher recommendations based on hypothetical case studies (Frey, 2002) and so were unable to examine evidence of bias in actual special education placements. Other work approximating similarly situated contrasts did not examine sets of risk factors simultaneously and often analyzed cross-sectional rather than longitudinal data (Artiles et al., 1998; Green et al., 2020; Hosp & Reschly, 2002; Ruppar et al., 2017; Sullivan, 2011). How disparities in placement attributable to race or ethnicity may change across elementary school or in have fluctuated the past decade in the United States is currently unknown.
Study’s Purpose
We investigated for potential bias in special education placement by statistically comparing SWD of different race or ethnicity but who displayed similar academic, behavioral, family, and school characteristics, thereby approximating similarly situated contrasts (U.S. Department of Education Office for Civil Rights, 2016). We analyzed data from two subsamples of SWD participating in longitudinal cohorts of students who entered kindergarten in 1998–1999 or 2010–2011, respectively, and who then were followed until the end of fifth grade. We investigated the following research questions (RQs):
Method
Databases and Analytic Samples
We analyzed data from subsamples of SWD participating in the Early Childhood Longitudinal Study-Kindergarten Classes of 1998–1999 (ECLS-K: 1998) and 2010–2011 (ECLS-K: 2011). Each data set enrolled a nationally representative sample of kindergarteners from both public and private schools who were then followed throughout elementary school. Survey data were collected from individual students, parents, general and special education teachers, principals, and schools. In the ECLS-K: 1998, most students were assessed as they attended kindergarten and first, third, fifth, and eighth grade. The ECLS-K: 2011’s data were collected in kindergarten and first, second, third, fourth, and fifth grade. We restricted our analytical samples to SWD in first, third, and fifth grade for each of the data sets to allow for direct comparisons.
The ECLS-K: 1998 subsamples consisted of 590 SWD in first grade, 780 SWD in third grade, and 910 SWD in fifth grade. The ECLS-K: 2011 subsamples consisted of 740 SWD in first grade, 1,050 SWD in third grade, and 1,130 SWD in fifth grade. The greater number of students identified with disabilities in the ECLS-K: 2011 versus the ECLS-K: 1998, particularly during the earlier grades, is consistent with other work (Zablotsky et al., 2019) reporting increasing developmental disability prevalence possibly resulting from greater disability awareness, screening, and service access. Both samples largely consisted of students whose primary disabilities were specific LDs, speech or language impairments (SLIs), or highly comorbid conditions (e.g., emotional disorders and other health impairments). For example, students with LDs or SLIs constituted about 70% to 75% of the ECLS-K: 1998 sample of SWD in first, third, or fifth grade. We rounded sample sizes to the nearest 10 in accordance with the National Center for Education Statistics (NCES) confidentiality requirements. As neither data set adjusted the special education teacher sampling and nonresponse rates through weighting, we were unable to adjust our analytical subsamples of SWD through weighting to be representative of the general population of SWD entering kindergarten classrooms in 1998–1999 and 2010–2011. However, both analytical subsamples were drawn from nationally representative samples of U.S. schoolchildren. We adjusted the estimated standard errors to account for clustering of SWD within schools. We obtained Institutional Review Board approval for the analyses.
Measures
We accounted for a range of student, family, and school characteristics to approximate contrasts between similarly situated SWD who differed in their race or ethnicity. When investigating racial or ethnic bias in special education, the U.S. Department of Education Office for Civil Rights (2016) states that “students are similarly situated when they are comparable (even if not identical) in all material respects” (p. 8). When evaluating for bias in special education placement, we considered educational performance as indicated by whether students had experienced significant academic or behavioral difficulties as the most materially relevant factor for whether SWD are comparable. We also included additional student and family as well as school contextual factors.
Primary educational placement
Disability status and placement were assessed for students with IEPs through special education teacher surveys. Specifically, special education teachers were asked “Was this student’s primary placement in a general education classroom?” We coded responses as “1” if the primary placement was outside of the general education classroom and “0” if the primary placement was within the general education classroom.
Race or ethnicity
Parents reported the student’s race or ethnicity. We included SWD who are Black, Hispanic, or White (i.e., the reference group) and excluded other possible racial or ethnic backgrounds due to small subsample sizes.
Academic achievement
General reading and mathematics achievement were assessed using individually administered and untimed measures. Scores were derived using item response theory (IRT) methods. The kindergarten Reading Test assessed letter and word recognition, rhyming, print familiarity, beginning and ending letter sounds, vocabulary, and reading comprehension. The kindergarten Mathematics Test assessed the ability to identify and count one- and two-digit numerals, recognize geometric shapes, and knowledge of basic number operation skills. Kindergarten reliability scores ranged from 0.93 to 0.95 in the ECLS-K: 1998 (Najarian et al., 2009) and 0.92 to 0.94 in the ECLS-K: 2011 (Najarian et al., 2020). Differential item functioning was evaluated for all items across both tests. Bias was not detected in any of the items included in the final versions of the assessments (Najarian et al., 2009, 2018).
Prior work (e.g., Morgan, Farkas, Hillemeier, & Maczuga, 2017) has found that receipt of special education services is strongly explained by whether students experience significant academic difficulties. We dummy coded the reading and mathematics achievement scores for whether they were among the lowest 10% in the full score distribution, separately for each data set. This allowed us to examine whether SWD who had previously experienced significant academic difficulties were more likely to later be placed primarily outside of general education classrooms. A 10% cut-off is a conservative indicator of experiencing significant academic difficulties consistent with having LDs (Geary, 2004; Morgan et al., 2009). Thus, and because we were interested in whether experiencing significant academic difficulties predicted special education placement, and so might confound racial and ethnic disparities in placement, we included a binary variable as a predictor where “1” = achievement at or below the 10th percentile of the ECLS-K student distribution, and “0” = achievement higher than the 10th percentile, separately for kindergarten reading and mathematics test scores. Supplemental analyses indicated that the results were consistent with using achievement as a continuous predictor.
Behavioral self-regulation
Externalizing problem behaviors were assessed using the kindergarten teacher’s response to the Teacher Social Ratings Scale (SRS), a modified version of the Social Skills Rating Scale (SSRS). The SSRS has a 0.85 test–retest correlation across 4 weeks (Gresham & Elliott, 1990). Teachers assessed the frequency of a student’s behavior using a 4-point scale from 1 for “never” to 4 for “very often.” The externalizing problem behaviors subscale included five items rating the frequency that the student displayed anger and impulsiveness, disturbed others, or fought or argued with others. The split-half reliability coefficients for the teacher-reported externalizing behavior problem scale ranged from 0.87 to 0.90 across the two cohorts (Najarian et al., 2018; Tourangeau et al., 2009).
Kindergarten teachers also rated a student’s behavioral self-regulation using the SRS’s Approaches to Learning scale. Assessed behaviors included the student’s attentiveness, task persistence, eagerness to learn, learning independence, flexibility, and organization. Reliability coefficients were greater than 0.90 in both cohorts (Tourangeau et al., 2009, 2018). We dummy coded these teacher ratings for whether the frequency of a student’s externalizing problem behaviors or behavioral self-regulation were among the worst 10% of the respective full-score distributions, separately for each data set. A 10% cut off is a conservative indicator of experiencing significant behavioral difficulties (Feil et al., 2005). Because we also were interested in whether experiencing significant behavioral difficulties also predicted special education placement and so might further confound racial and ethnic disparities in placement, we included two binary variables as predictors. For externalizing problem behaviors, “1” = behavior problems at or above the 90th percentile of the ECLS-K student distribution indicated significant externalizing problem behaviors (“0” = problems lower than the 90th percentile). For behavioral self-regulation, “1” = self-regulatory difficulties at or below the 10th percentile of the ECLS-K student distribution indicating significant dysregulation (“0” = problems above the 10th percentile). Results were comparable to analyses in which these behavior variables were included as continuous predictors. Although some studies find evidence of cultural bias, two studies directly contrasting teacher ratings to classroom observations of disability-related behavior yielded no evidence of ethnic bias (see Mason et al., 2014, for a review).
Covariates
Child
Information on the student’s biological sex was collected from the school and then confirmed by a parent during the kindergarten survey year (male = 1, female = 0). Student age was indicated by calculating the days between when the student completed the assessment battery and their birthday (adjusted for leap years) after which they divided that number by 30 to obtain the student’s age in months.
Family
Family socioeconomic status (SES) was assessed using a composite variable based on interview responses about parental or guardian education and occupation as well as the household income. The variable was measured continuously and was standardized to have a mean of 0 and a standard deviation of 1. Parent marital status was assessed during the spring of kindergarten. We used a dichotomous variable indicating that the SWD’s primary caregiver was (a) married, in a civil union, or a domestic partnership (“0”) or (b) single, separated, divorced, or widowed (“1”). An SWD’s language status was captured during kindergarten using a dichotomous variable indicating that English (“0”) or another language (“1”) was primarily spoken at home.
School
School principals responded to survey questions about their school and students. We created two binary variables to identify schools where greater than 20% of the student body identified as (a) Black or African American and (b) Hispanic or Latino, relative to schools where fewer than 20% of the student body was so identified. We used a conservative cut-off of more than 40% of the students experienced economic disadvantage based on the number of students who were eligible for free or reduced-price lunch (Null, 2012) relative to fewer than 40% of the students being eligible for free or reduced-price lunch. School principals also reported the number of students enrolled in their school. Responses options were “1 = 0–149 students,” “2 = 150–299 students,” “3 = 300–499 students,” “4 = 500–749 students,” and “5 = 750 students and above.” We created a dichotomous variable indicating that the school enrollment was greater than 750 students (“1”) or less than 750 students (“0”).
School principals were asked during kindergarten, “Based on recent standardized tests, what percent of elementary children currently enrolled in this school tested at or above grade level nationally in reading/mathematics?” Respondents gave a number between 0 and 100 for both reading and mathematics. We averaged these two responses into a composite variable capturing the percent of students at or above proficiency. We then dichotomized this variable to indicate less (“1”) or more (“0”) than 60% of the student body were at or above proficiency. Primary classroom teachers were asked whether student misbehavior in the school interfered with their teaching. Response options ranged from “1 = Strongly Disagree,” to “5 = Strongly Agree.” We dichotomized this variable to indicate which schools had teachers who agreed or strongly agreed that their school displayed high levels of student misbehavior (“1”) relative to teachers who strongly disagreed, disagreed, or neither agreed nor disagreed (“0”).
Missing Data
The average amount of missing data per variable in the ECLS-K: 1998 was 12% in first grade, 14% in third grade, and 15% in eighth grade. In the ECLS-K: 2011, the average amount of missing data per variable was 11% in first grade, 12% in third grade, and 12% in fifth grade (see Tables S3 and S4 in the online supplemental material). We assumed that including variables related to the pattern of missingness in imputation models resulted in data missing at random. Our analysis model included sociodemographic, academic, behavioral, and school contextual variables that we reasonably assumed were related to longitudinal attrition and survey nonresponse. These variables were also included in our imputation model. The number of imputations m was selected to maximize efficiency such that the largest fraction of missing information divided by m was less than .01 (White et al., 2011). This led to 40 imputations conducted separately for each grade using Stata’s mi impute chained procedure. We imputed all variables by matching their values to the closest predicted mean using the nearest 10 neighbors (Little, 1988), thus replicating observed values in the data set. Predictive mean matching (PMM) uses a linear regression model to impute continuous missing data, a logistic regression model to impute binary missing data, and a multinomial logistic regression model to impute categorical missing data. However, instead of imputing random values from the conditional distribution, these regression models were used to find observed cases that most closely resembled the predicted values of the respondents with missing data. In this way, multiple imputation using PMM results in imputed values that are observed in the data set and that are more robust to violations of normality than other approaches (i.e., regress, logit, and mlogit) (van Ginkel et al., 2020). Imputation slightly increased the proportion of Black, Hispanic, and low-achieving students represented in our analysis as well as these proportions at the school level. In the ECLS-K: 2011 data set, imputation also increased the proportion of single parents and students from non-English-speaking households.
Statistical Analyses
We estimated logistic regression models of special education placement in first, third, and fifth grade using kindergarten predictors, separately for each data set. As students may move into and out of special education during different waves of data collection, we analyzed placement separately in each grade. We used Stata/SE version 16.0 for the analyses. We observed no issues with collinearity or normality. Standard errors were clustered by school to account for each data set’s sampling design of students randomly sampled from participating schools.
For each survey wave, we estimated two logistic regression models predicting whether SWD were placed primarily outside of the general education classroom. Model 1 included only the student’s race or ethnicity and so no other explanatory factors. Model 2 added indicators of academic and behavioral functioning as well as student, family, and school covariates. We also used state fixed effects. All predictors were measured in kindergarten. To control for Type-I errors, we used the Benjamini and Hochberg (1995) correction to adjust for repeated analyses on the same subsamples and across each grade of data collection. We report descriptive statistics of the two subsamples of SWD in the online supplementary materials. Both samples of SWD were diverse in regard to race and ethnicity, family SES, parent marital status, and language status. With three grade levels, each observed in two specific years, we conducted six sets of regressions. With coefficients for both Blacks and Hispanics in each set, we had 12 total tests of our hypotheses.
Results
Logistic Regression Models
ECLS-K: 1998
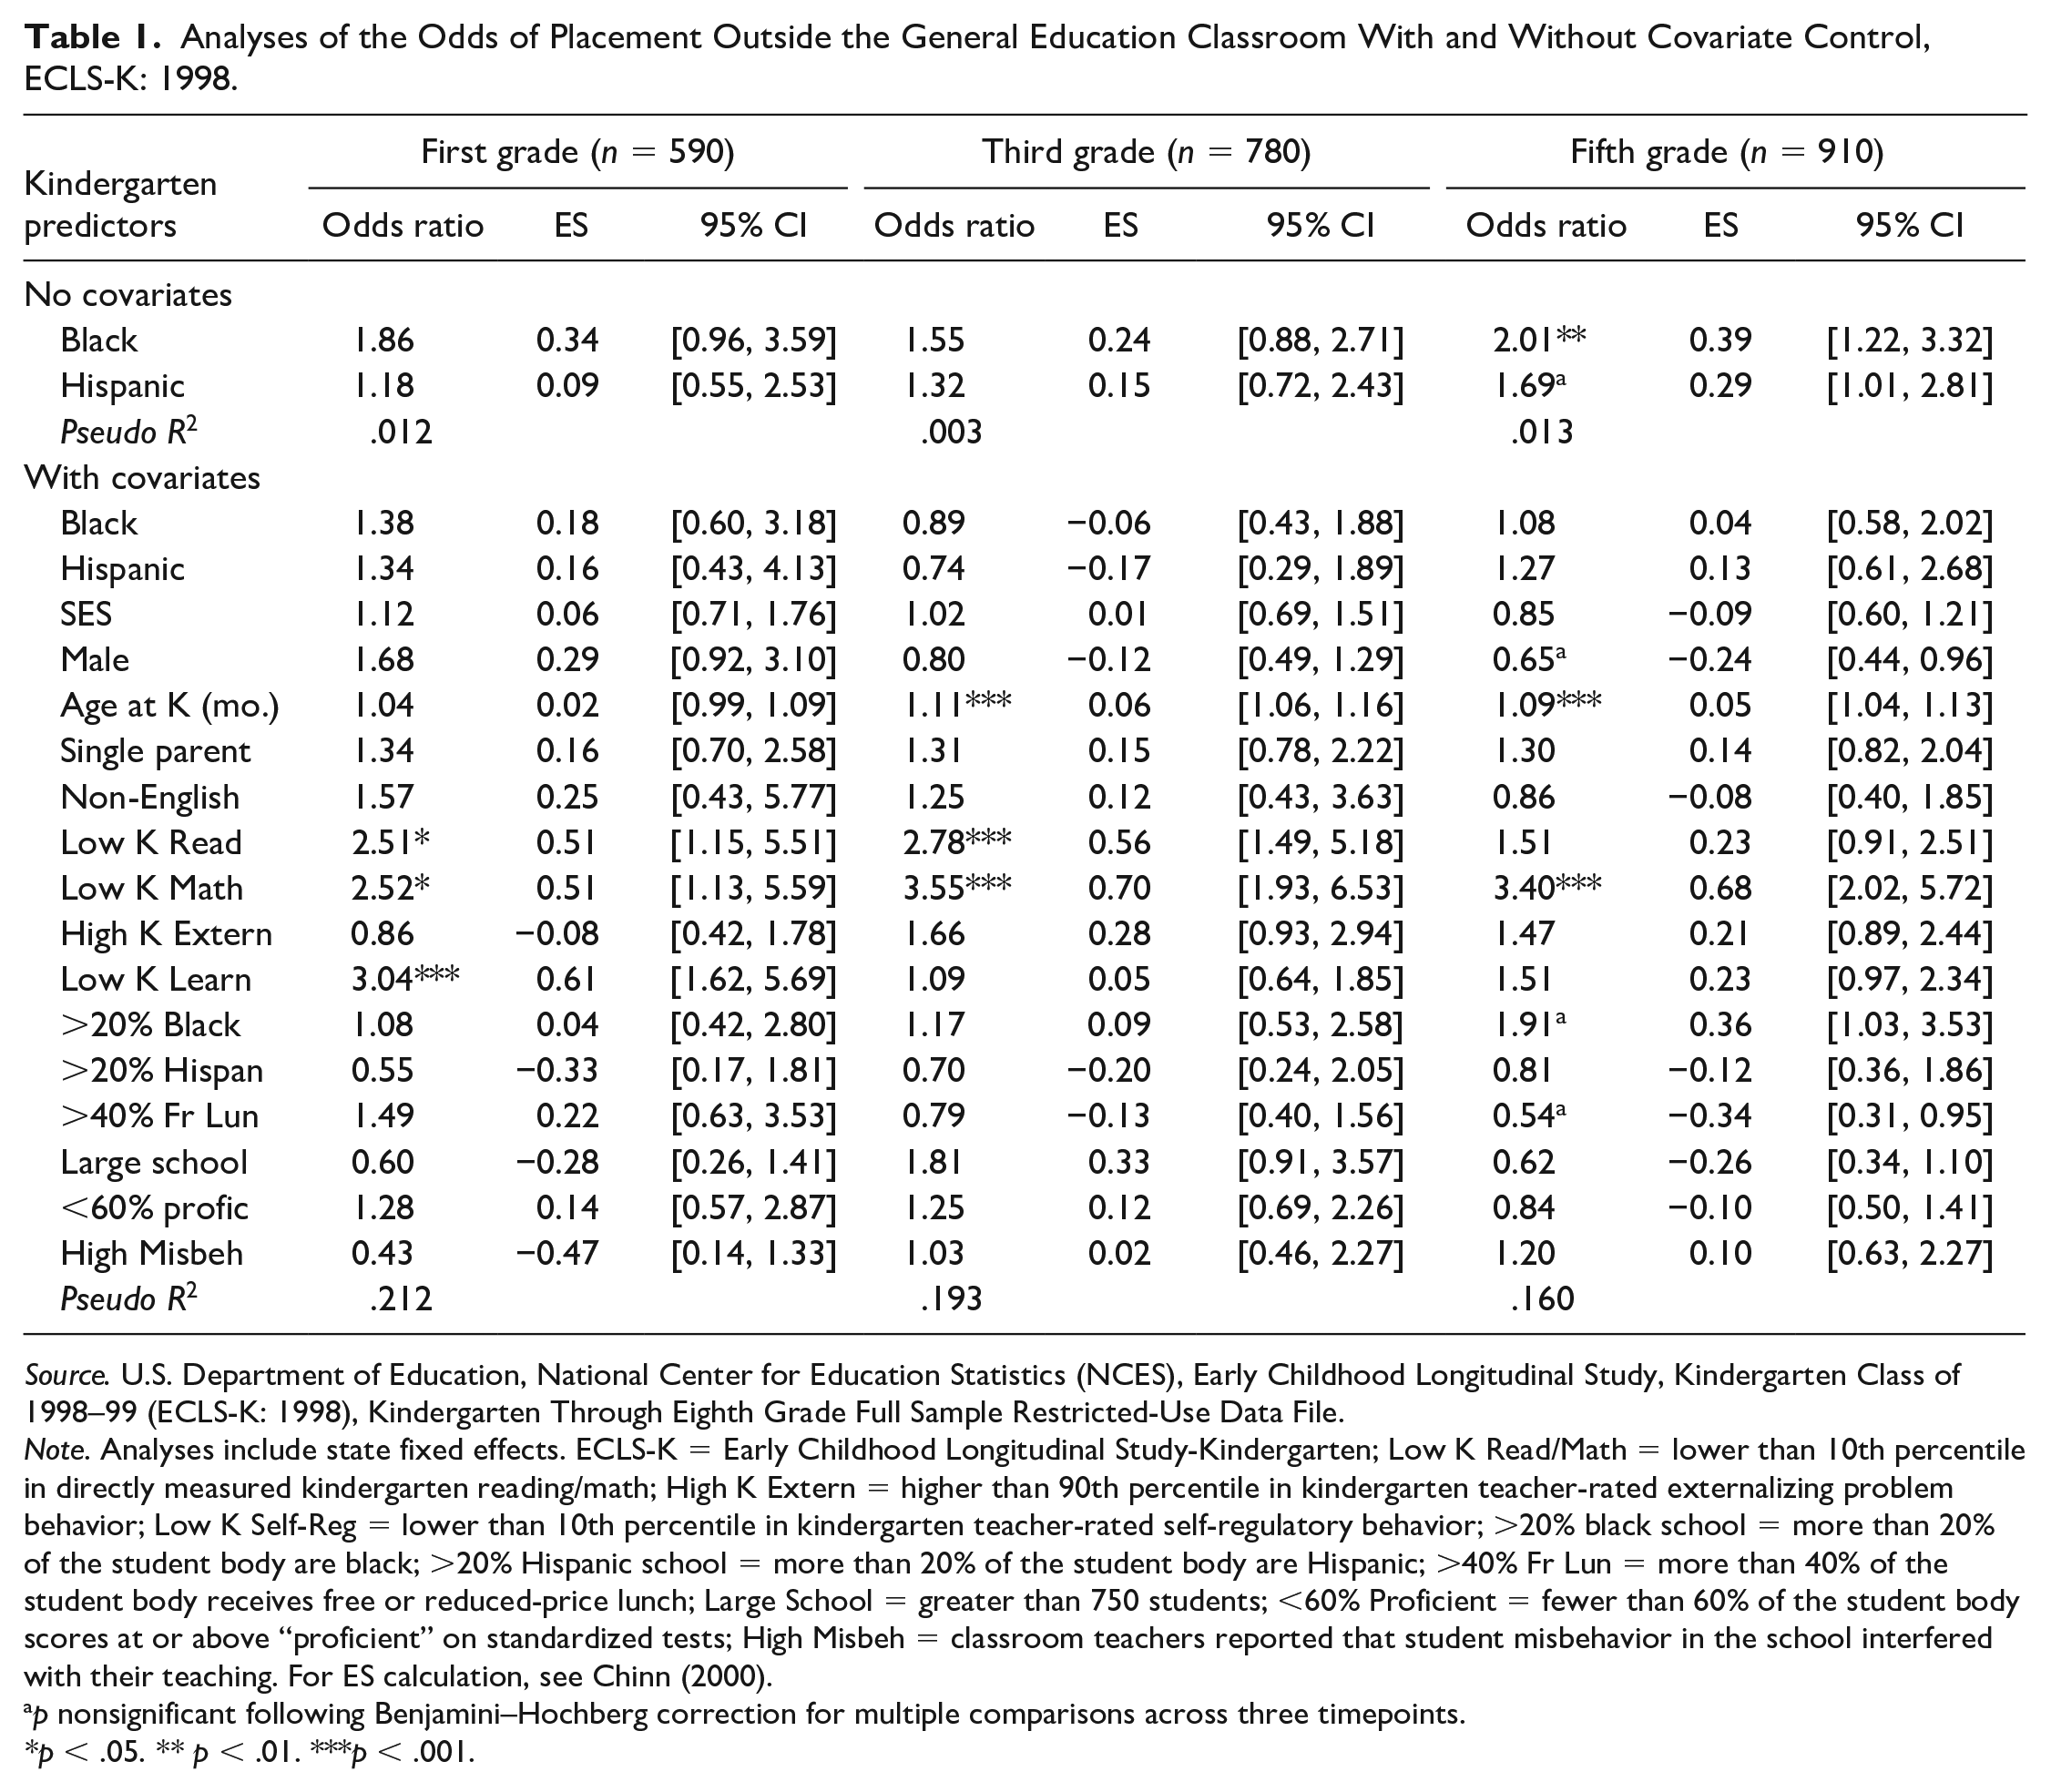
Table 1 presents odds ratio (OR) coefficients from logistic regression models using factors measured in kindergarten to predict special education placement in first, third, or fifth grade. Table 1’s top section, labeled “No Covariates,” displays results from Model 1. Here, the only explanatory factor for primary classroom placement was race or ethnicity. Model 2, labeled “With Covariates,” included additional kindergarten sociodemographic, achievement, and behavioral predictors of special education placement. As these factors were measured prior to placement in first, third, and fifth grade, reverse causality from placement to these factors was very unlikely.
Analyses of the Odds of Placement Outside the General Education Classroom With and Without Covariate Control, ECLS-K: 1998.
Source. U.S. Department of Education, National Center for Education Statistics (NCES), Early Childhood Longitudinal Study, Kindergarten Class of 1998–99 (ECLS-K: 1998), Kindergarten Through Eighth Grade Full Sample Restricted-Use Data File.
Note. Analyses include state fixed effects. ECLS-K = Early Childhood Longitudinal Study-Kindergarten; Low K Read/Math = lower than 10th percentile in directly measured kindergarten reading/math; High K Extern = higher than 90th percentile in kindergarten teacher-rated externalizing problem behavior; Low K Self-Reg = lower than 10th percentile in kindergarten teacher-rated self-regulatory behavior; >20% black school = more than 20% of the student body are black; >20% Hispanic school = more than 20% of the student body are Hispanic; >40% Fr Lun = more than 40% of the student body receives free or reduced-price lunch; Large School = greater than 750 students; <60% Proficient = fewer than 60% of the student body scores at or above “proficient” on standardized tests; High Misbeh = classroom teachers reported that student misbehavior in the school interfered with their teaching. For ES calculation, see Chinn (2000).
p nonsignificant following Benjamini–Hochberg correction for multiple comparisons across three timepoints.
p < .05. ** p < .01. ***p < .001.
In models unadjusted for additional explanatory factors, SWD who are Black or Hispanic had ORs consistently higher than 1.0. The ORs for SWD who are Black ranged from 1.55 to 2.01 across first to fifth grade and were statistically significant in fifth grade. The ORs for SWD who are Hispanic ranged from 1.18 to 1.69 and were not statistically significant. Our hypothesis for RQ 1 that SWD who are Black or Hispanic would be more likely to be placed primarily outside of general education classrooms in unadjusted analyses was only somewhat supported.
In the second set of models that included covariates allowing for contrasts between similarly situated SWD who are Black, Hispanic, or White, the magnitude of the ORs for SWD of color were greatly reduced. Model 2’s ORs ranged from 0.89 to 1.38 for Black SWD and from 0.74 to 1.34 for Hispanic SWD. None of the adjusted ORs were statistically significant. After controlling for potential confounds and consistent with RQ 2’s hypothesis, we observed no evidence indicating that SWD who are Black or Hispanic were more likely to be primarily placed outside of general education classrooms than similarly situated SWD who are White.
The OR coefficients for significant reading and mathematics difficulties were the most consistently large and positive coefficients in Table 1. Five of these six coefficients were statistically significant and ranged between 2.51 and 3.55, increasing the odds of placement by these multiplicative factors and indicating that significant reading or mathematics difficulties by kindergarten were the strongest predictors of placement outside the general education classroom in first, third, and fifth grades.
ECLS-K: 2011
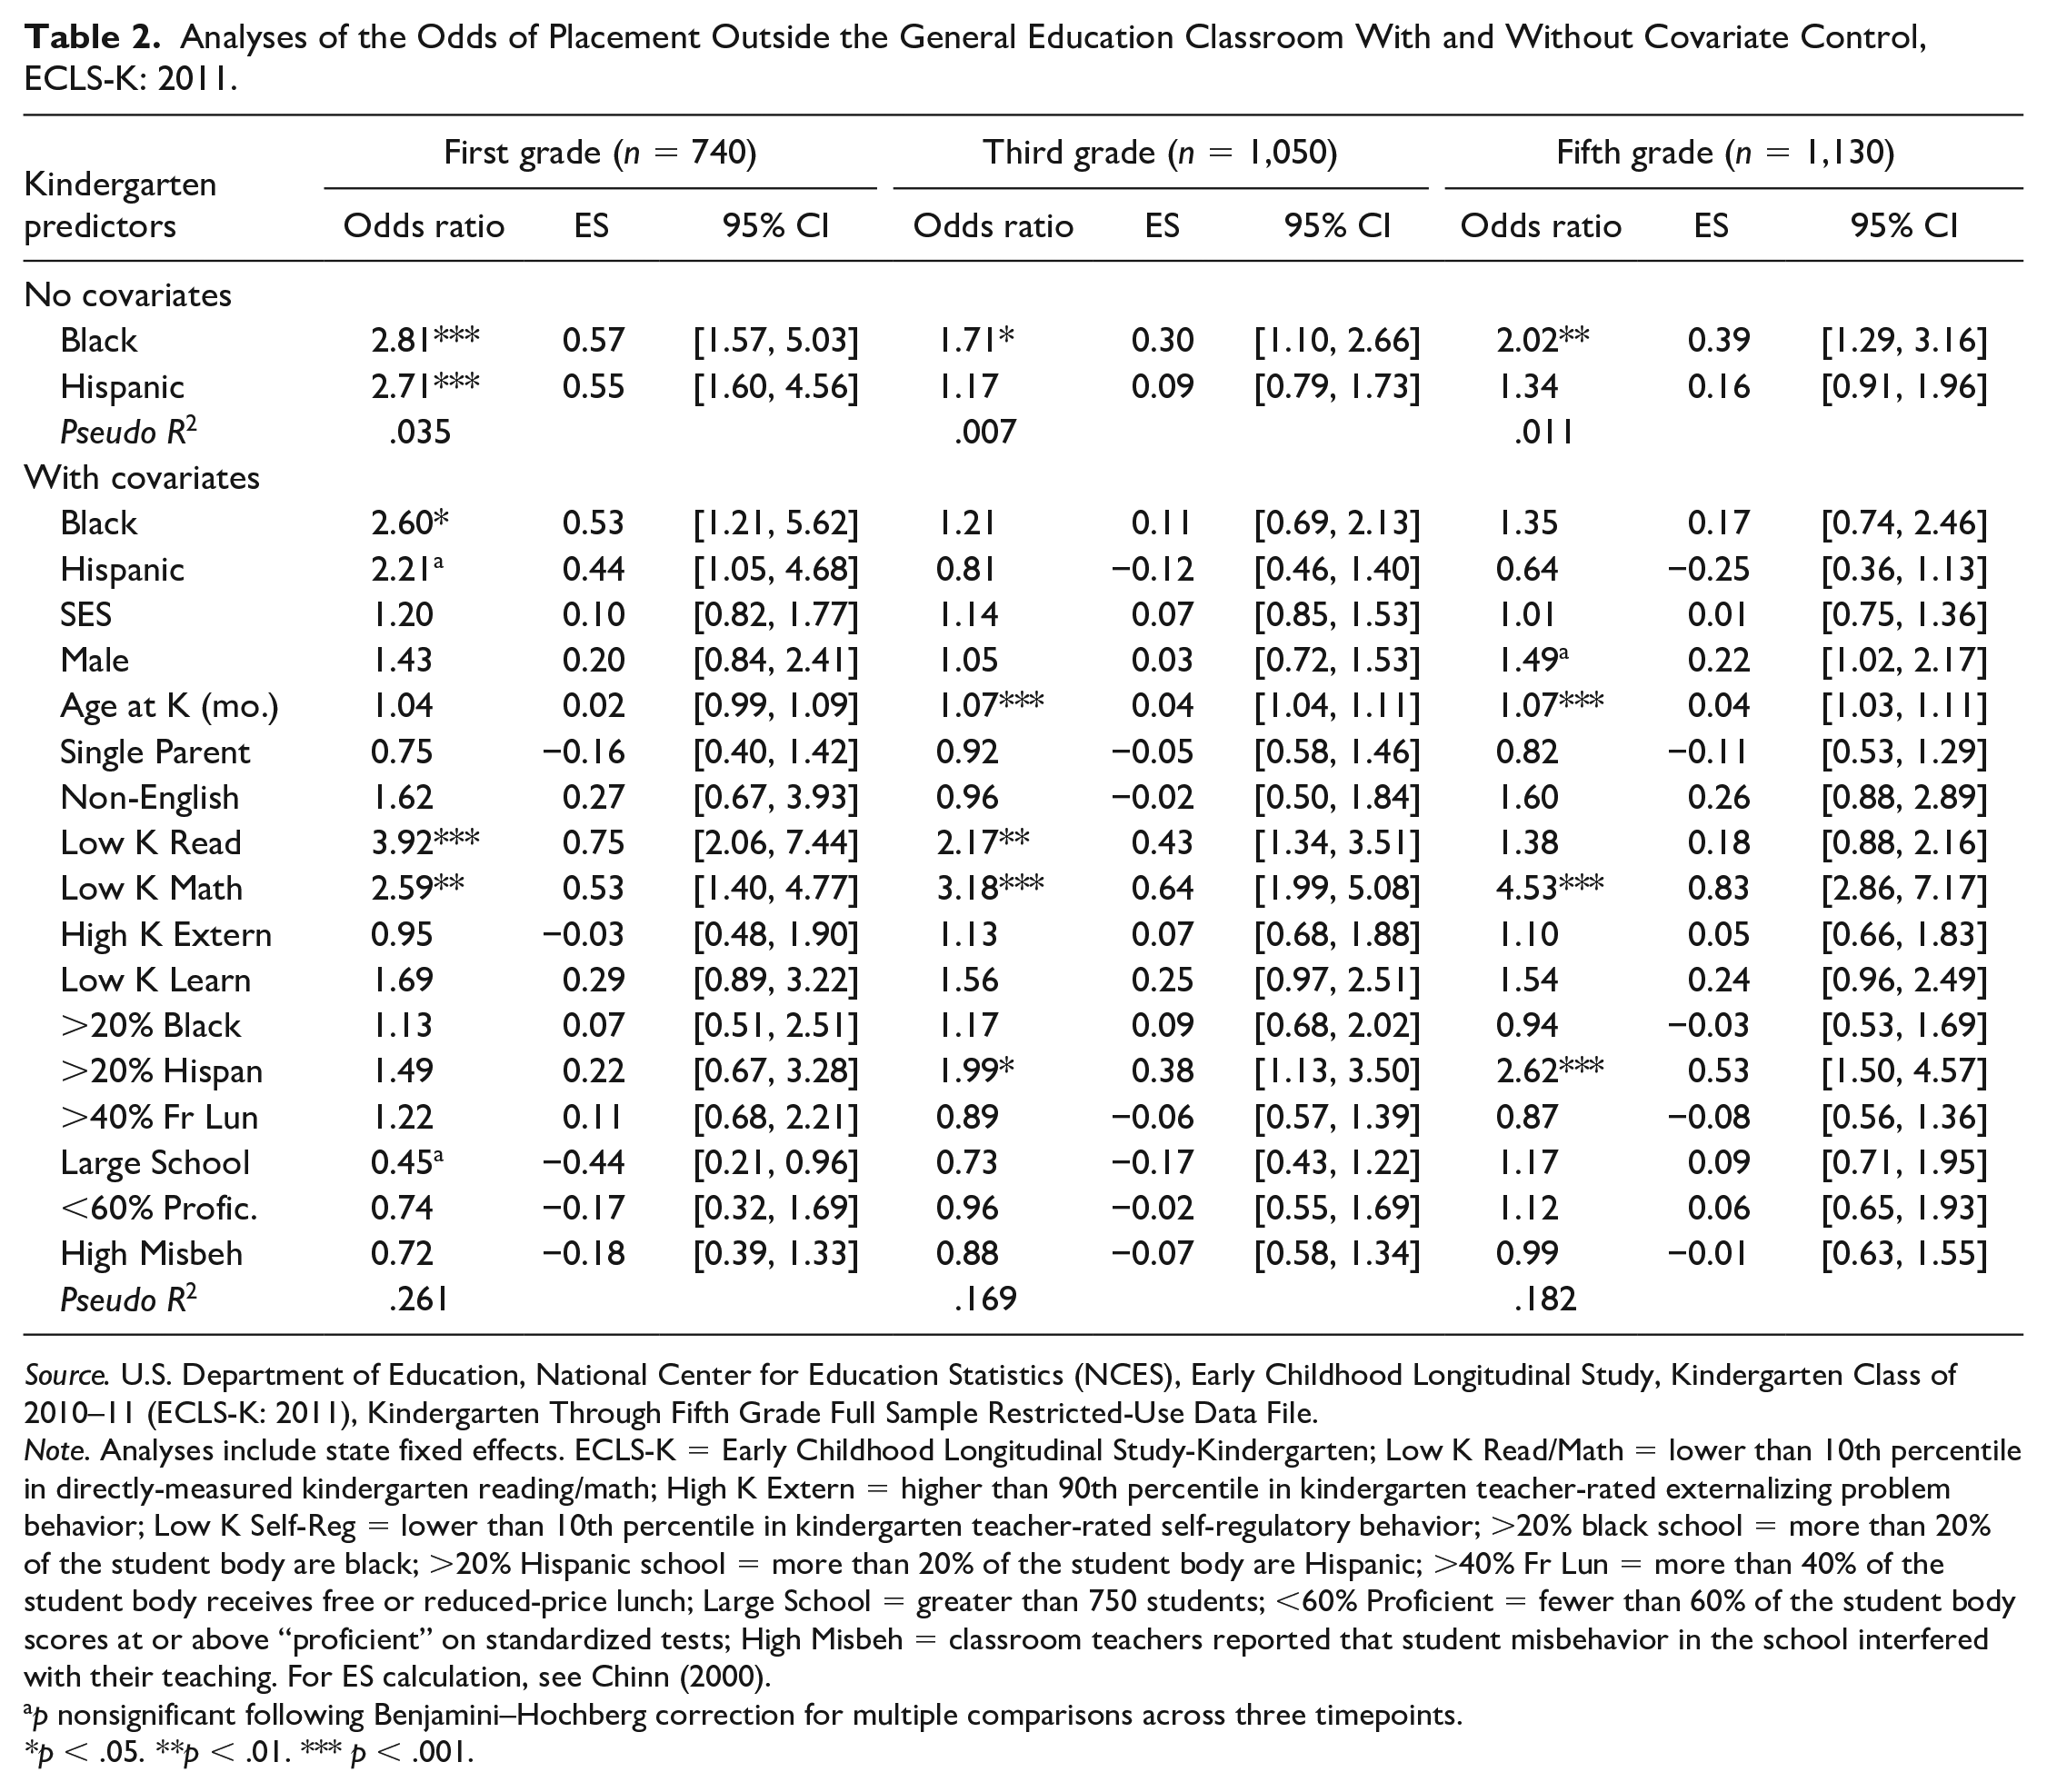
Table 2 repeats these analyses for the ECLS-K 2011 cohort. Results largely replicated those from analyses of the ECLS-K: 1998. Model 1 for first, third, and fifth grade indicated that SWD who are Black again had about twice the odds of being placed outside of U.S. general education classrooms. These odds were highest during first grade and were now statistically significant at each of the three grade levels. These results again supported RQ 1’s hypothesis for SWD who are Black. For SWD who are Hispanic, all three coefficients were positive, but only the coefficient for first grade achieved statistical significance.
Analyses of the Odds of Placement Outside the General Education Classroom With and Without Covariate Control, ECLS-K: 2011.
Source. U.S. Department of Education, National Center for Education Statistics (NCES), Early Childhood Longitudinal Study, Kindergarten Class of 2010–11 (ECLS-K: 2011), Kindergarten Through Fifth Grade Full Sample Restricted-Use Data File.
Note. Analyses include state fixed effects. ECLS-K = Early Childhood Longitudinal Study-Kindergarten; Low K Read/Math = lower than 10th percentile in directly-measured kindergarten reading/math; High K Extern = higher than 90th percentile in kindergarten teacher-rated externalizing problem behavior; Low K Self-Reg = lower than 10th percentile in kindergarten teacher-rated self-regulatory behavior; >20% black school = more than 20% of the student body are black; >20% Hispanic school = more than 20% of the student body are Hispanic; >40% Fr Lun = more than 40% of the student body receives free or reduced-price lunch; Large School = greater than 750 students; <60% Proficient = fewer than 60% of the student body scores at or above “proficient” on standardized tests; High Misbeh = classroom teachers reported that student misbehavior in the school interfered with their teaching. For ES calculation, see Chinn (2000).
p nonsignificant following Benjamini–Hochberg correction for multiple comparisons across three timepoints.
p < .05. **p < .01. *** p < .001.
However, and consistent with RQ 2’s hypothesis, these odds were reduced when adjusted for other explanatory factors. The ORs for SWD who are Black remained directionally larger than 1.0 but only one of these (i.e., for first grade) was statistically significant following control for other explanatory factors. (We note the practically significant OR of 2.6 and effect size estimate of .53 for Black students for first grade.) The ORs for SWD who are Hispanic were below 1.0 during third and fifth grade. None of the three Hispanic coefficients were statistically significant. The strongest predictors of placement outside of general education classrooms in first, third, and fifth grade were again whether SWD were students experiencing significant reading or mathematics difficulties by kindergarten. These ORs ranged from 2.17 to 4.53. Coefficients for these relations were generally among the largest in Table 2, thereby replicating findings shown in Table 1 through analyses of an independent sample. Significant academic difficulties again strongly and consistent predicted placement primarily outside the general education classrooms in U.S. elementary schools.
Discussion
We examined which SWD were more likely to be placed primarily outside of general education classrooms while attending U.S. elementary schools. We hypothesized that SWD who are Black or Hispanic would initially be observed to be more likely to be placed primarily outside of general education classrooms than SWD who are White (De Valenzuela et al., 2006; Fierros & Conroy, 2002; Skiba et al., 2006; U.S. Department of Education, Office of Special Education and Rehabilitative Services, Office of Special Education Programs, 2020). We further hypothesized that these racial and ethnic disparities would be fully or largely explained by experiencing significant academic and behavioral difficulties, family SES, and other potential confounds (Donovan & Cross, 2002; Frey, 2002; Hosp & Reschly, 2002; Morgan, Farkas, Hillemeier, & Maczuga, 2017; Morgan, Farkas, Hillemeier, Mattison, et al., 2015).
Results were largely consistent with our hypotheses. SWD who are Black or Hispanic initially were more likely than SWD who are White to be placed primarily outside of general education classrooms. However, statistical control for additional explanatory factors explained the risk initially attributable to race or ethnicity for eleven of the twelve (i.e., 92%) of the specific tests contrasting SWD who are Black or Hispanic to SWD who are White. (Although mostly not statistically significant, we note that the estimated ORs were often greater than 1.0, particularly for SWD who are Black.) Experiencing significant academic difficulties in kindergarten strongly and consistently predicted placement primarily outside of general education classrooms in subsequent grades. Kindergarten self-regulatory difficulties did not consistently predict placement in subsequent grades. We internally replicated our findings in analyses across two independent samples.
Limitations
Our study has several limitations. Our analyses were based on subsamples of SWD participating in two nationally representative cohorts. Analyses of specific local contexts may have yielded other findings. We also were unable to disaggregate results by specific disability conditions or other racial/ethnic groups due to small sample sizes. We controlled for school racial, ethnic, and economic factors by kindergarten and not at subsequent grades to better establish temporal precedence. We did not examine to what extent a greater likelihood of attending poorly resourced schools may have contributed to experiencing significant academic or behavioral difficulties over time. We did not include measures of teacher quality. Students of color are more likely to be taught by less-qualified teachers (Goldhaber et al., 2017; Mason-Williams, 2015). Teachers may have varied in how they assessed student behavior. Teachers may be biased in their behavioral evaluations of students of color (Mason et al., 2014; Redding, 2019), although teacher behavioral ratings consistently correlate with direct classroom observations including for students of color (Hosterman et al., 2008; Humphries et al., 2012). Our analyses were designed to identify factors predictive of placement primarily outside of general education classrooms conditional on other factors included in the study’s regression models. We did not examine the effectiveness of special education placement. Whether receipt of special education services including as delivered primarily inside or outside of general education classrooms effectively increases the achievement or behavior for SWD is not well established (Gilmour, 2018; Hurwitz et al., 2020; Lindsay, 2007; Morgan et al., 2010; Oh-Young, & Filler, 2015). Prior work has not adjusted for between-group differences in impairment when contrasting SWD educated in integrated versus restrictive settings and so is confounded by selection bias (Gilmour, 2018; Zigmond, 2003).
Study’s Contributions and Implications
SWD who are Black or Hispanic have been found to be more likely to be placed primarily outside of general education classrooms than SWD who are White (Ruppar et al., 2017; Skiba et al., 2006; Sullivan, 2011). These findings have led to inferences that disparities in special education placement result from biased practices deliberately designed to racially segregate students (Artiles et al., 2016; Fierros & Conroy, 2002; Reid & Knight, 2006; Zion & Blanchett, 2011), which in turn has led to federal monitoring through both legislation and regulation (e.g., IDEA, 2004; U.S. Department of Education, 2016). This is despite some earlier work finding that economic disadvantage or academic difficulties rather than bias explains these racial and ethnic disparities (Frey, 2002; Hosp & Reschly, 2002) as well as recent work finding that minority over-representation in special education is generally fully or largely explained by achievement differences and other confounds (Morgan et al., 2020; Morgan, Farkas, Hillemeier, & Maczuga, 2017; Morgan, Farkas, Hillemeier, Mattison, et al., 2015; Shifrer, 2018).
Yet limitations in the available knowledge base have resulted in ambiguity about the factors that explain racial and ethnic disparities in special education placement. Analyses of generalizable samples (Fierros & Conroy, 2002; Green et al., 2020; U.S. Department of Education, Office of Special Education and Rehabilitative Services, Office of Special Education Programs, 2020) have been unable to account for alternative explanatory factors including prior histories of significant academic or behavioral difficulties. Studies approximating contrasts between SWD who are similarly situated but who differ in their race or ethnicity were unable to examine the possibility of bias in actual placements in U.S. schools (Frey, 2002) or did not examine the risks attributable to a set of risk factors simultaneously (Artiles et al., 1998; Green et al., 2020; Hosp & Reschly, 2002). Recent work has been based on cross-sectional instead of longitudinal analyses that account for whether SWD were experiencing significant academic or behavioral difficulties (Green et al., 2020; Ruppar et al., 2017; Sullivan, 2011). Consequently, it has been unclear whether academic or behavioral difficulties by school entry explain racial and ethnic disparities in special education placement in U.S. elementary schools.
By addressing these limitations, our study makes important contributions to research, practice, and policy. For researchers and practitioners, our findings clarify which SWD are most likely to be placed primarily outside of general education classrooms in U.S. elementary schools. These are SWD with experiencing significant academic difficulties by school entry. One explanation of this finding is that school personnel working in U.S. elementary schools may be attempting to provide SWD displaying significant academic difficulties with the types of intensive remediation services that are more likely to be delivered in restrictive settings. Restrictive settings may facilitate the delivery of more individualized instruction as well as frequent monitoring and corrective feedback (Kauffman et al., 2018).
For researchers, our findings based on SWD participating in nationally representative cohorts replicate and extend earlier work using small convenience samples (Frey, 2002) including students with LDs (Hosp & Reschly, 2002). We examined for racial and ethnic disparities in placement for SWD generally rather than only for small convenience samples of students with only the specific conditions of behavioral (Frey, 2002) or LDs (Hosp & Reschly, 2002) and in actual rather than hypothetical placements (Frey, 2002). Our findings suggest that practitioners in U.S. elementary schools largely base special education placement decision-making on individual educational needs, particularly whether SWD were experiencing significant reading or mathematics difficulties as indicated here by performance on independently administered, untimed, and psychometrically strong measures.
We find that, conditional on other factors, the ethnic composition of the school may help explain special education placement. Why this may be occurring requires further study. One possibility is that factors like school context have become more likely to explain over- or under-placement during the elementary grades because of a greater emphasis on academic proficiency. Assessments for achievement during this early time also may introduce greater measurement error and subjectivity (Bond & Lang, 2018).
For federal policymakers, our study finds that race or ethnicity largely does not independently predict which SWD attending U.S. elementary schools will later be placed primarily outside of general education classrooms. Overall, our study provides little empirical evidence to support inferences that racial or ethnic disparities in placement in the U.S. result from systemic attempts by school personnel to racially segregate SWD, at least as indicated by the disparities almost always being explained by other explanatory factors including between-group differences in the extent to which SWD were already experiencing significant academic difficulties by school entry. Despite dismissals of such findings (Ford & Toldson, 2015; Welner & Skiba, 2016), this and other recent studies (e.g., Elder et al., 2021; Morgan, Farkas, Hillemeier, & Maczuga, 2017; Morgan, Farkas, Hillemeier, Mattison, et al., 2015; Shifrer, 2018) continue to yield replicated evidence suggesting that federal legislation and regulation on minority over-representation in special education may be misdirected and possibly limiting access to potentially beneficial services and supports.
Our analyses also suggest that societal inequalities that negatively impact development before school entry, instead of racial or ethnic bias by special educators and other school personnel after school entry, largely explain racial and ethnic disparities in special educational placement in U.S. elementary schools. To avoid spurious inferences that may misinform policy and practice, future research designed to assess for systemic bias in special education placement should be designed to account for the individual educational needs of SWD as well as other explanatory factors. A particularly important explanatory factor of special education placement is whether SWD were already experiencing significant academic difficulties when they began school.
Supplemental Material
sj-docx-1-ldx-10.1177_00222194221094019 – Supplemental material for Which Students With Disabilities are Placed Primarily Outside of U.S. Elementary School General Education Classrooms?
Supplemental material, sj-docx-1-ldx-10.1177_00222194221094019 for Which Students With Disabilities are Placed Primarily Outside of U.S. Elementary School General Education Classrooms? by Paul L. Morgan, Adrienne D. Woods, Yangyang Wang, George Farkas, Marianne M. Hillemeier and Cynthia Mitchell in Journal of Learning Disabilities
Footnotes
Declaration of Conflicting Interests
The author(s) declared no potential conflicts of interest with respect to the research, authorship, and/or publication of this article.
Funding
Funding for this study was provided by the U.S. Department of Education’s Institute for Education Sciences (grant no. R324A200166). Infrastructure support was provided by the Penn State Population Research Institute through funding from the National Institute of Child Health and Human Development, National Institutes of Health (grant no. P2CHD041025). No official endorsement should be inferred.
Supplemental Material
Supplementary material for this article is available on the Journal of Learning Disabilities website with the online version of this article.
References
Supplementary Material
Please find the following supplemental material available below.
For Open Access articles published under a Creative Commons License, all supplemental material carries the same license as the article it is associated with.
For non-Open Access articles published, all supplemental material carries a non-exclusive license, and permission requests for re-use of supplemental material or any part of supplemental material shall be sent directly to the copyright owner as specified in the copyright notice associated with the article.