
Abstract
This paper presents an analysis of Indigenous employment trends in Australia from 1981 to 2021, using nine iterations of 5-yearly Census data. It offers the most consistent long-term estimates available and situates these trends within broader shifts in the Australian labour market. Three key findings emerge. First, the overall increase in Indigenous employment over the 40-year period is primarily driven by the substantial rise in employment among Indigenous women, accounting for over 93% of the total growth. Second, employment rates for Indigenous men have remained largely stagnant, highlighting persistent structural barriers. Third, geographic and educational disparities continue to constrain Indigenous labour market participation, particularly in remote areas. From a long-term perspective, existing data sources offer valuable insights into employment trends and provide a foundational platform for understanding systemic patterns over time. At the same time, this long-term view invites critical reflection on the evolving nature of data collection and interpretation, particularly in relation to complex, identity-based variables. Recognizing both the contributions and limitations of current datasets underscores the importance of developing innovative, culturally responsive methodologies that can more accurately capture the multifaceted drivers of employment. This includes attending to dynamic factors such as the increasing visibility and self-determination of Indigenous identity, which may influence statistical representations and policy responses in nuanced ways.
Introduction
Improving the labour market outcomes of Aboriginal and Torres Strait Islander peoples has been a focus for Australian policymakers since at least the 1970s. 1 This policy focus acknowledges both the systematic exclusion of Indigenous peoples from the mainstream labour market (Langton, 2011; Leroy-Dyer, 2010) and the socioeconomic benefits of paid employment. It also arises from concerns about the direct and indirect costs to government of high rates of joblessness. Although employment rates have risen over recent decades, in 2021 only 52.2% of Indigenous peoples aged 15–64 years were employed, compared to 74.6% of their non-Indigenous counterparts (AIHW, 2023a). The intergenerational consequences of the economic marginalisation of Indigenous peoples continue to be felt and are reflected in inferior outcomes on a range of socio-economic indicators beyond employment (Productivity Commission, 2024).
There is extensive Australian academic literature (over 200 publications) on Indigenous labour market issues since the 1990s (Eva et al., 2025). This diverse literature, spanning policy analysis, historical research, and both qualitative and quantitative studies, contributes to a deeper understanding Indigenous employment. Combined with numerous government reports, navigating through the literature can be challenging. These challenges stem from several factors: varying data sources which produce different estimates; changes in rates of Indigenous self-identification in administrative datasets (Biddle and Markham, 2018); inconsistent definitions of employment, such as whether the previous Community Development Employment Program (CDEP) participants are classified as being employed or not employed; and differing age ranges used in employment estimates (eg., 15+ 18+, 15–64). Alongside these methodological inconsistencies, many of the existing papers undertake single-year analyses, making it difficult to construct a coherent picture of Indigenous employment trends over time.
Research on Indigenous employment has been shaped by the relative paucity of the available data on Indigenous labour market outcomes compared to that available for the broader Australian population. Amongst more than one hundred academic publications that utilise quantitative data to analyse Indigenous employment in Australia (Eva et al., 2025), most rely on Australian Census or National Aboriginal and Torres Strait Islander Social Survey (NATSISS) data. Others draw on non-Australian Bureau of Statistics (ABS) surveys of specific regions or industries, as well as ABS Labour Force Survey (LFS) and Household, Income and Labour Dynamics in Australia (HILDA) data.
The Australian Census of Population and Housing, conducted every 5 years, is used for annual reporting of Indigenous employment rates under The National Agreement on Closing the Gap. 2 The Census has two clear strengths for analysing Indigenous employment and labour market outcomes more broadly. First, it aims to include all Indigenous peoples, thereby avoiding the small sample size issues that limit the utility of most surveys. Second, it provides comparable data over a long period of time. Data on Indigenous employment is first available from the 1971 Census, which was the first Census in which Indigenous peoples were purposefully counted towards the Australian population and not deliberately excluded (National Museum of Australia, 2024).
There are three main limitations of the census data for analysing Indigenous labour market outcomes. First, it is only collected every 5 years. Second, while it does provide a significant amount of labour market-related data (labour force status, hours worked, occupation, industry as well as information on self-employment and business ownership) it does not have the level of detailed information available from labour market-specific surveys. Third, the Census lacks Indigenous specific variables that may be important for understanding Indigenous labour market outcomes.
Another significant data source was the ABS NATSIS and its successor, the NATSISS, conducted four times between 1994 and 2015 before being discontinued (ABS, 2016). These Indigenous-specific surveys helped to address some of the limitations inherent in Census data when measuring and interpreting Indigenous employment. By focusing exclusively on Indigenous populations, they offered more granular insights than the general Census (Biddle and Hunter, 2006; Gray and Chapman, 2006) and were arguably better aligned with the lived realities of Indigenous communities (Rowse, 1997; Smith, 1994). However, critiques of their methodological simplifications have also been noted (Walter, 2020). Since the cessation of the NATSISS, researchers have had to rely predominantly on Census data to analyse Indigenous employment trends.
Beyond the Census, the two principal sources of labour market survey for the population are the ABS monthly LFS and HILDA. However, neither the LFS nor HILDA provides reliable estimates of Indigenous employment due to insufficient sample sizes (Venn and Biddle, 2018). In addition, the HILDA does not provide data for remote areas of Australia (Wilkins et al., 2024). Despite these limitations, the HILDA survey has been used to undertake some analysis of Indigenous labour market outcomes (e.g., Howlett et al., 2016).
Several consistent patterns emerge in studies that quantify Indigenous employment. Non-Indigenous employment rates are higher than Indigenous employment rates (e.g., AIHW, 2024a; Daly, 1991; Gray et al., 2014; Hunter, 2001). Indigenous peoples in remote locations have lower rates of employment than Indigenous peoples in urban locations (e.g., Altman and Gray, 2005; Junankar and Kapuscinski, 1991; Leroy-Dyer, 2010). Higher rates of education are associated with higher rates of employment (Biddle, 2007; Hunter, 1997). Indigenous men have higher rates of employment than Indigenous women (e.g., Hunter and Gray, 1998; Jones, 1993). Survey-based analyses such as from the NATSISS have allowed for more nuanced understanding of Indigenous employment, such as the role played by labour market discrimination (Biddle et al., 2013; Duncan et al., 2019), participation in customary economic activities (Altman et al., 2006), and previous incarcerations (Borland and Hunter, 2003). The use of survey and qualitative data has provided for more textured, contextualised, and disaggregated analysis of Indigenous employment in Australia. However, none of these sources provide data over the length of time available using Census data and they also lack the relative longitudinal consistency of the Census.
Although many studies have used Census data up to and including the 2011 Census, relatively little research has been published using the 2016 or 2021 Censuses. To date, no academic publications have examined Indigenous employment trends over more than 20 years. This paper addresses that gap by analysing data from 1981 to 2021, the longest period possible whilst maintaining data quality. Although the focus of this paper is on the period since 1981, it is essential to recognise that Indigenous labour market outcomes at that time resulted from a historical legacy of racist and discriminatory practices that inevitably limited Indigenous labour market participation (Leroy-Dyer, 2021). This included, for example, the forcible removal of Aboriginal children to provide indentured labour. Langton (2011) describes the ‘near total exclusion’ of the Indigenous population from mainstream education, training, and employment before the political shifts in Australia through the 1960s and 1970s. These historical injustices continue to shape contemporary labour market outcomes, underscoring the importance of long-term data analysis to understand both progress and persistent disparities.
This paper presents the most comparable estimates possible of Indigenous employment trends over the last four-decades, using data from all nine Censuses conducted from 1981 to 2021. The trends in employment for men and women, different age groups, and geographic remoteness are reported. It also examines changes in post-secondary educational attainment and CDEP participation, as well as analysing the age-employment profiles for different birth cohorts to help identify drivers of employment trends. A key aspect of the paper is placing the trends in Indigenous employment in the context of trends in the broader Australian labour market over the longer-run. While demonstrating the value of Census data for tracking changes to Indigenous employment over four decades. The paper also highlights its limitations as the primary source for understanding Indigenous socio-economic outcomes, including employment.
Data and methods
This paper uses data from the nine censuses conducted over the period 1981 to 2021 to estimate employment rates for both the Indigenous and non-Indigenous population. The data from the 2006, 2011, 2016 and 2021 Censuses is extracted using the ABS Table Builder tool. The data from the 1981, 1986, 1991, 1996 and 2001 Censuses are derived from the original ABS data that was provided for the Hunter (2004) paper and was reanalysed to maintain consistent disaggregation across these nine Census years. There is further data available for the 9 Census counts prior to 1981, spanning the period of 1911–1976 (ABS, 2025), but these cannot be included in this analysis for myriad reasons. Prior to the 1967 referendum and the repeal of Section 127 of the Constitution, individuals classified as ‘Aboriginal natives’ were excluded from official population counts, with this being defined as ‘persons that are more than 50% Aboriginal’. The history of this exclusion, and the violent classification of Aboriginal identities on blood quantum (McCorquodale, 1997) are better explained elsewhere (e.g., Bond et al., 2014). In short, whilst some Indigenous peoples are enumerated in Censuses between 1911 and 1966 (those considered not to be ‘Aboriginal natives’), this is an incomplete and incidental enumeration of the Indigenous population. Additionally, employment data from earlier Censuses overlaps with the protectionist policy eras in Australia, and it would be inappropriate to classify unpaid or underpaid forced labour as employment. 3 From the 1971 Census onwards there is purposeful inclusion of Indigenous peoples in Census counts, however, the evidence is that there was a very significant under-enumeration in the 1971 and 1976 Censuses and that the data collection processes regarding enumerating the Indigenous population were much improved from 1981 onwards (Choi and Gray, 1985). Choi and Gray (1985) conclude, in relation to the 1971 and 1976 Censuses that the under-enumeration of the Indigenous population in these Census counts, especially those in remote areas, is likely to have produced overestimations of Indigenous employment rates. 4 It is for these reasons that the analysis in this paper uses Census data from 1981 onwards.
The enumeration strategy from the ABS relating to the Indigenous population and the Census has improved over time, which has seen an increasing number of Indigenous peoples included within Census counts. In addition to this has been the increasing propensity in recent Census counts for individuals to change their identification in the Census to Indigenous (ABS, 2023). There are myriad reasons for this that are explored elsewhere (e.g., Griffiths et al., 2019, 2025), but ultimately this means the Indigenous population is growing for both demographic and non-demographic reasons (ABS, 2023). Longitudinal census data indicates that increased identification has contributed to the overall increase in Indigenous employment, with ‘new’ identifiers tending to have higher employment rates (Biddle and Markham, 2018).
The analysis in this paper is restricted to individuals aged of 15–64 in each Census year. Although the National Agreement on Closing the Gap reports Indigenous employment using a narrower age range (25–64), to understand longer-run trends it is important to use a wider age range to capture effects such as increases in educational attainment (i.e., leaving school at an older age) and increases in the retirement age. The analysis is restricted to respondents who either identified themselves as Aboriginal and/or Torres Strait Islander or as non-Indigenous in each Census, with those who did not answer excluded from the analysis. Also excluded are respondents whose employment status cannot be determined. Sex, as recorded within the Census (male or female), is used to disaggregate employment outcomes. 5
For the period of 1981–2021, employment statistics are presented in this paper for each 5-yearly Census, disaggregated on Indigenous status, sex, and 10-year age range, as these are the variables captured consistently across all these Censuses. Synthetic cohort analyses were constructed using 10-year age cohorts for the 1981, 1991, 2001, 2011, and 2021 Censuses to track employment trends among Indigenous and non-Indigenous men and women.
To illustrate the relationship between education and employment, post-secondary educational attainment rates and the employment rates of those with a post-secondary education are presented. Due to data limitations, this comparison is restricted to the 1981 Census (as reported in Committee of Review of Aboriginal Employment and Training Programs (The Miller Report), 1985), and 2021 Census data using consistent classifications.
To illustrate the extent to which the rise and fall of the CDEP Scheme may help explain long-term trends in Indigenous employment, estimations of the proportion of the Indigenous working-age population that was CDEP participants are made for each Census year (1981–2021). Population data is drawn from the Census, and CDEP participation numbers are drawn from Aboriginal and Torres Strait Islander Commission (ATSIC) administrative data.
Finally, the extent of geographic disaggregation possible using Census data is broader for more recent Census datasets (2006–2021) than for earlier datasets (1981–2001). Employment statistics are therefore disaggregated by remoteness level for the 2006, 2011, 2016, and 2021 Censuses to detail differences in employment across geographies.
This analysis is undertaken by non-Indigenous (CE, MG, BH) and Indigenous (SLD) researchers with extensive research histories relating to the Indigenous labour market. The central aim of this collaboration was to produce the most robust understanding of Indigenous labour market outcomes possible with the available data. In doing so, the research also underscores the limitations of both historical approaches and the current data environment in advancing a meaningful understanding of Indigenous labour market outcomes.
Employment trends from 1981 to 2021
Indigenous and non-indigenous employment rate
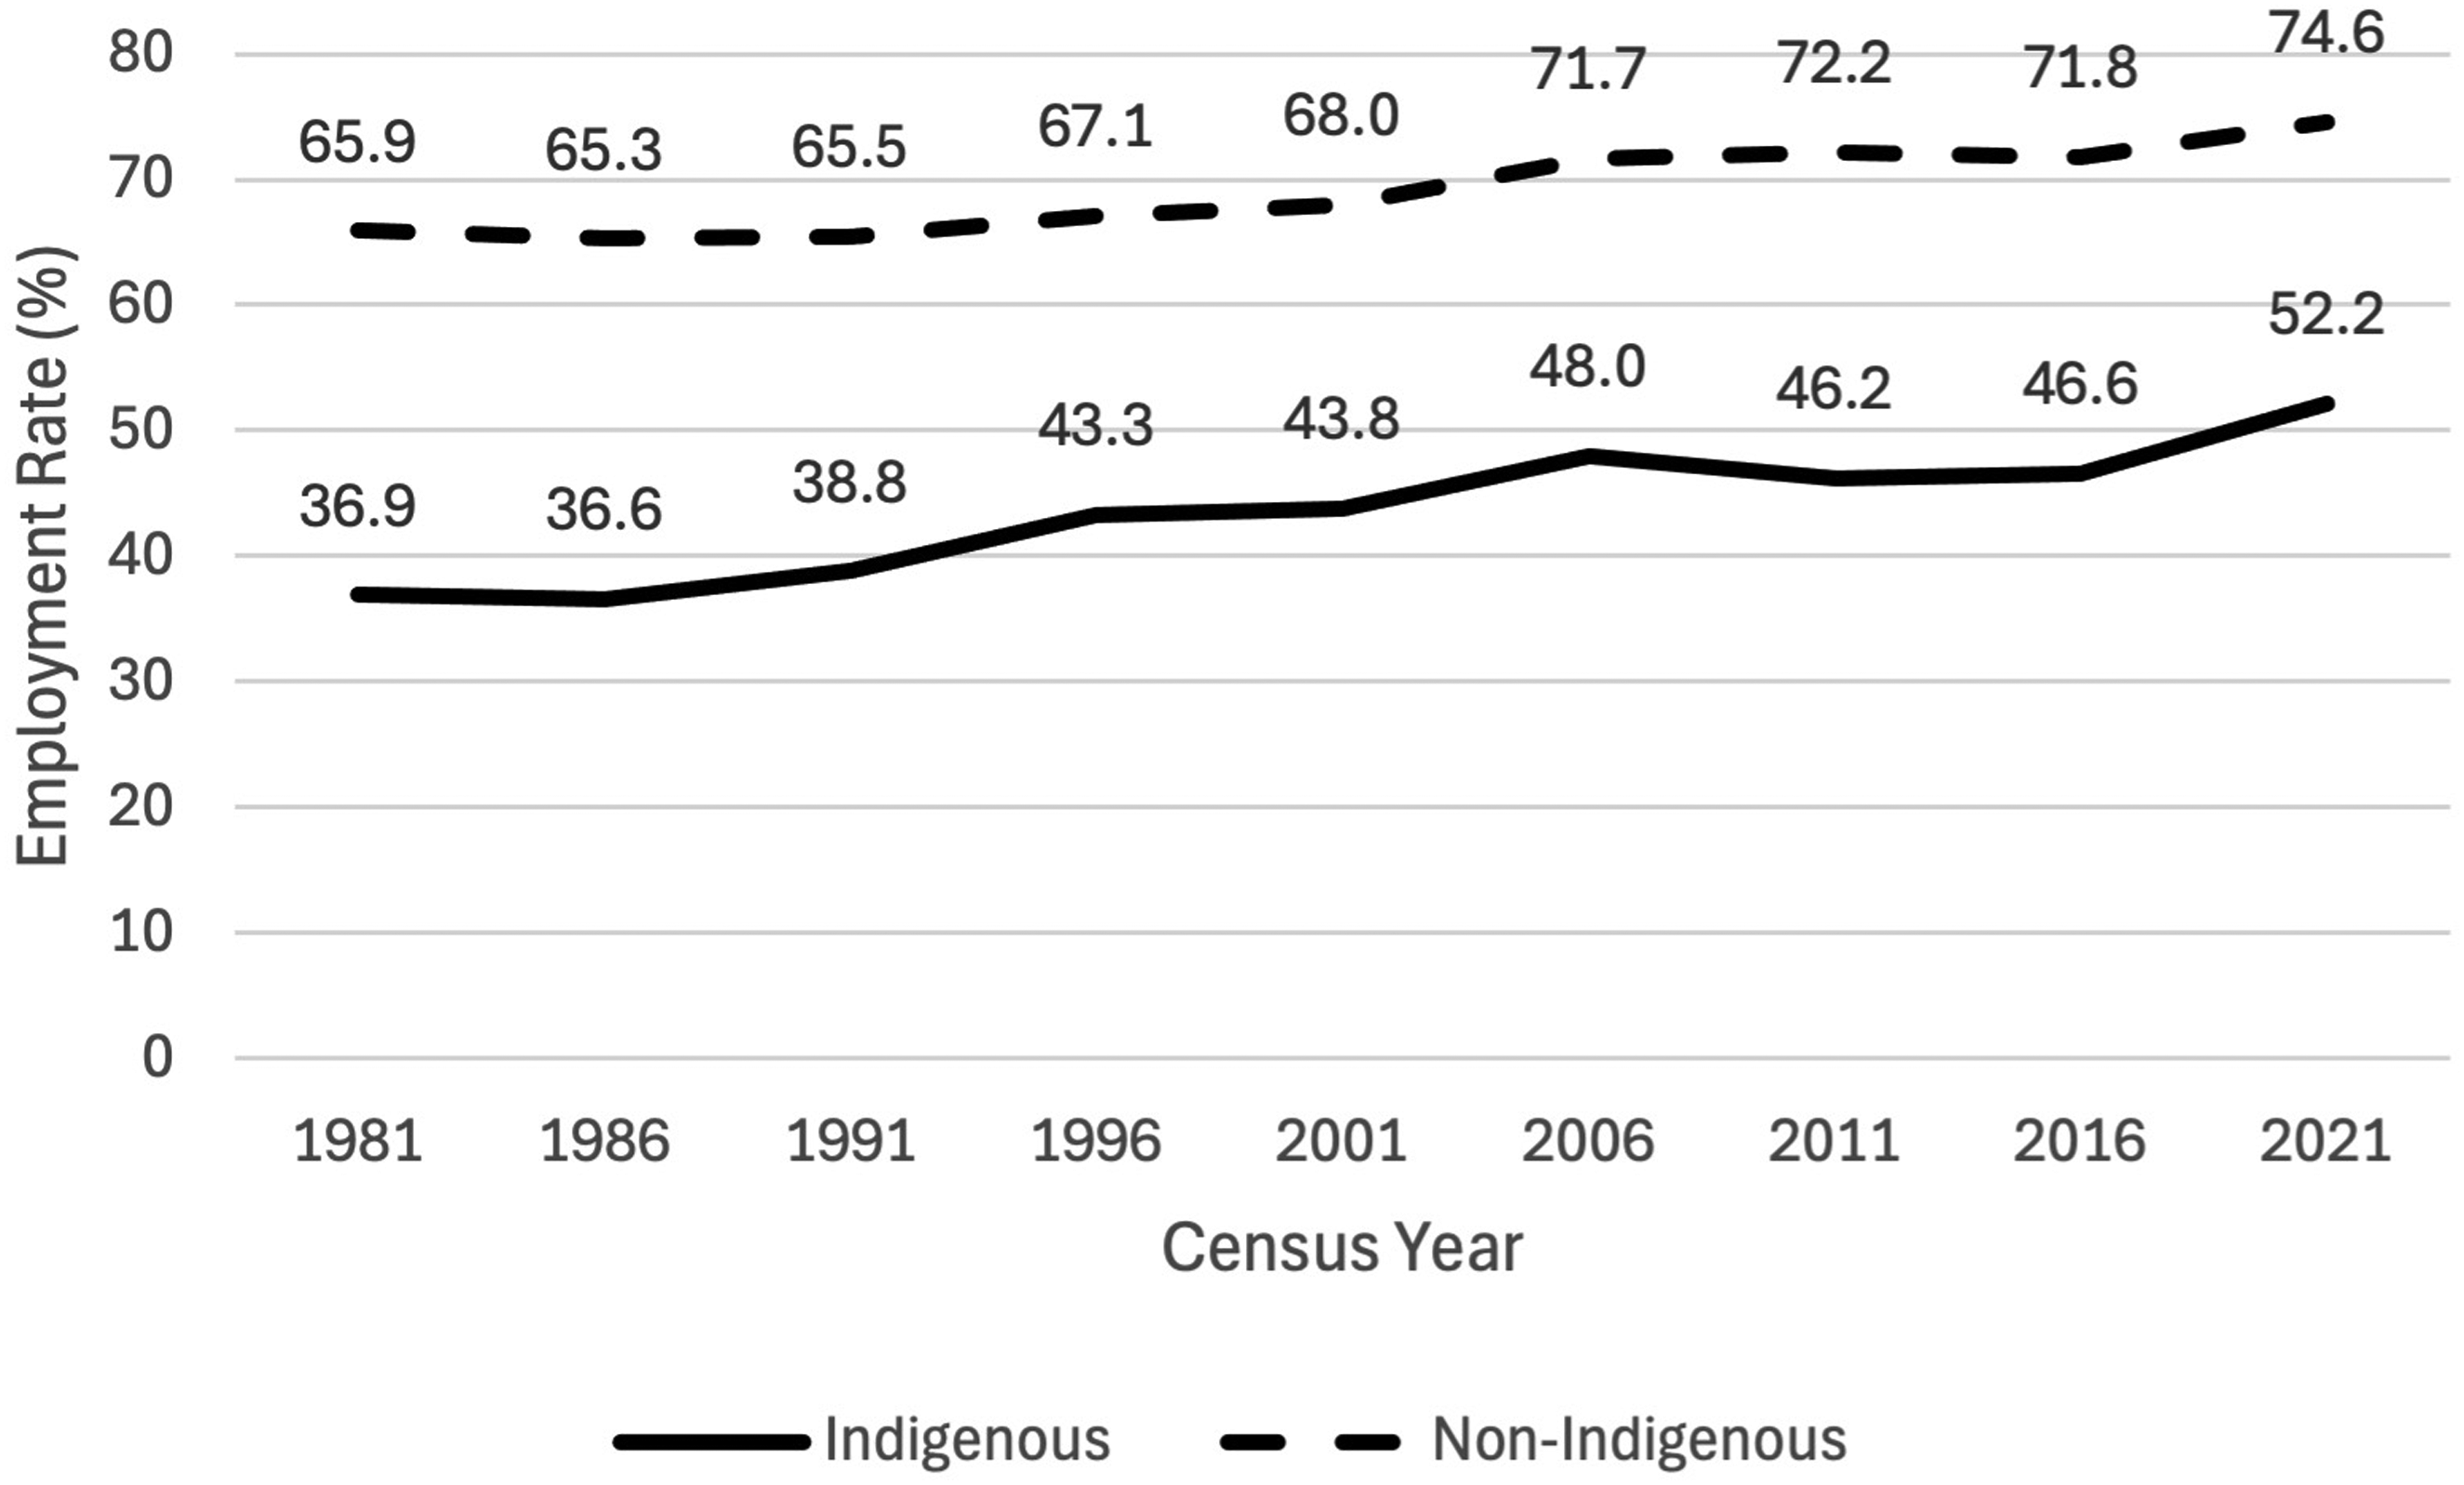
Figure 1 presents employment rates for Indigenous and non-Indigenous populations aged 15–64 across Census years from 1981 to 2021. The data highlights the persistent employment ‘gap’ between the two groups, which has been a key driver of policy initiatives aimed at improving Indigenous employment outcomes. All estimates of employment in this paper include CDEP participation. Over the 40-year period, the Indigenous employment rate rose from 36.9% in 1981 to 52.2% in 2021, a 15.3% point rise. In comparison, the non-Indigenous employment rate increased from 65.9% to 74.6%, a smaller increase of 8.7% points. While the gap remains substantial, the faster growth in Indigenous employment has resulted in a narrowing of the employment gap.
Employment rate by Indigenous status, 15–64 years, 1981–2021 (%).
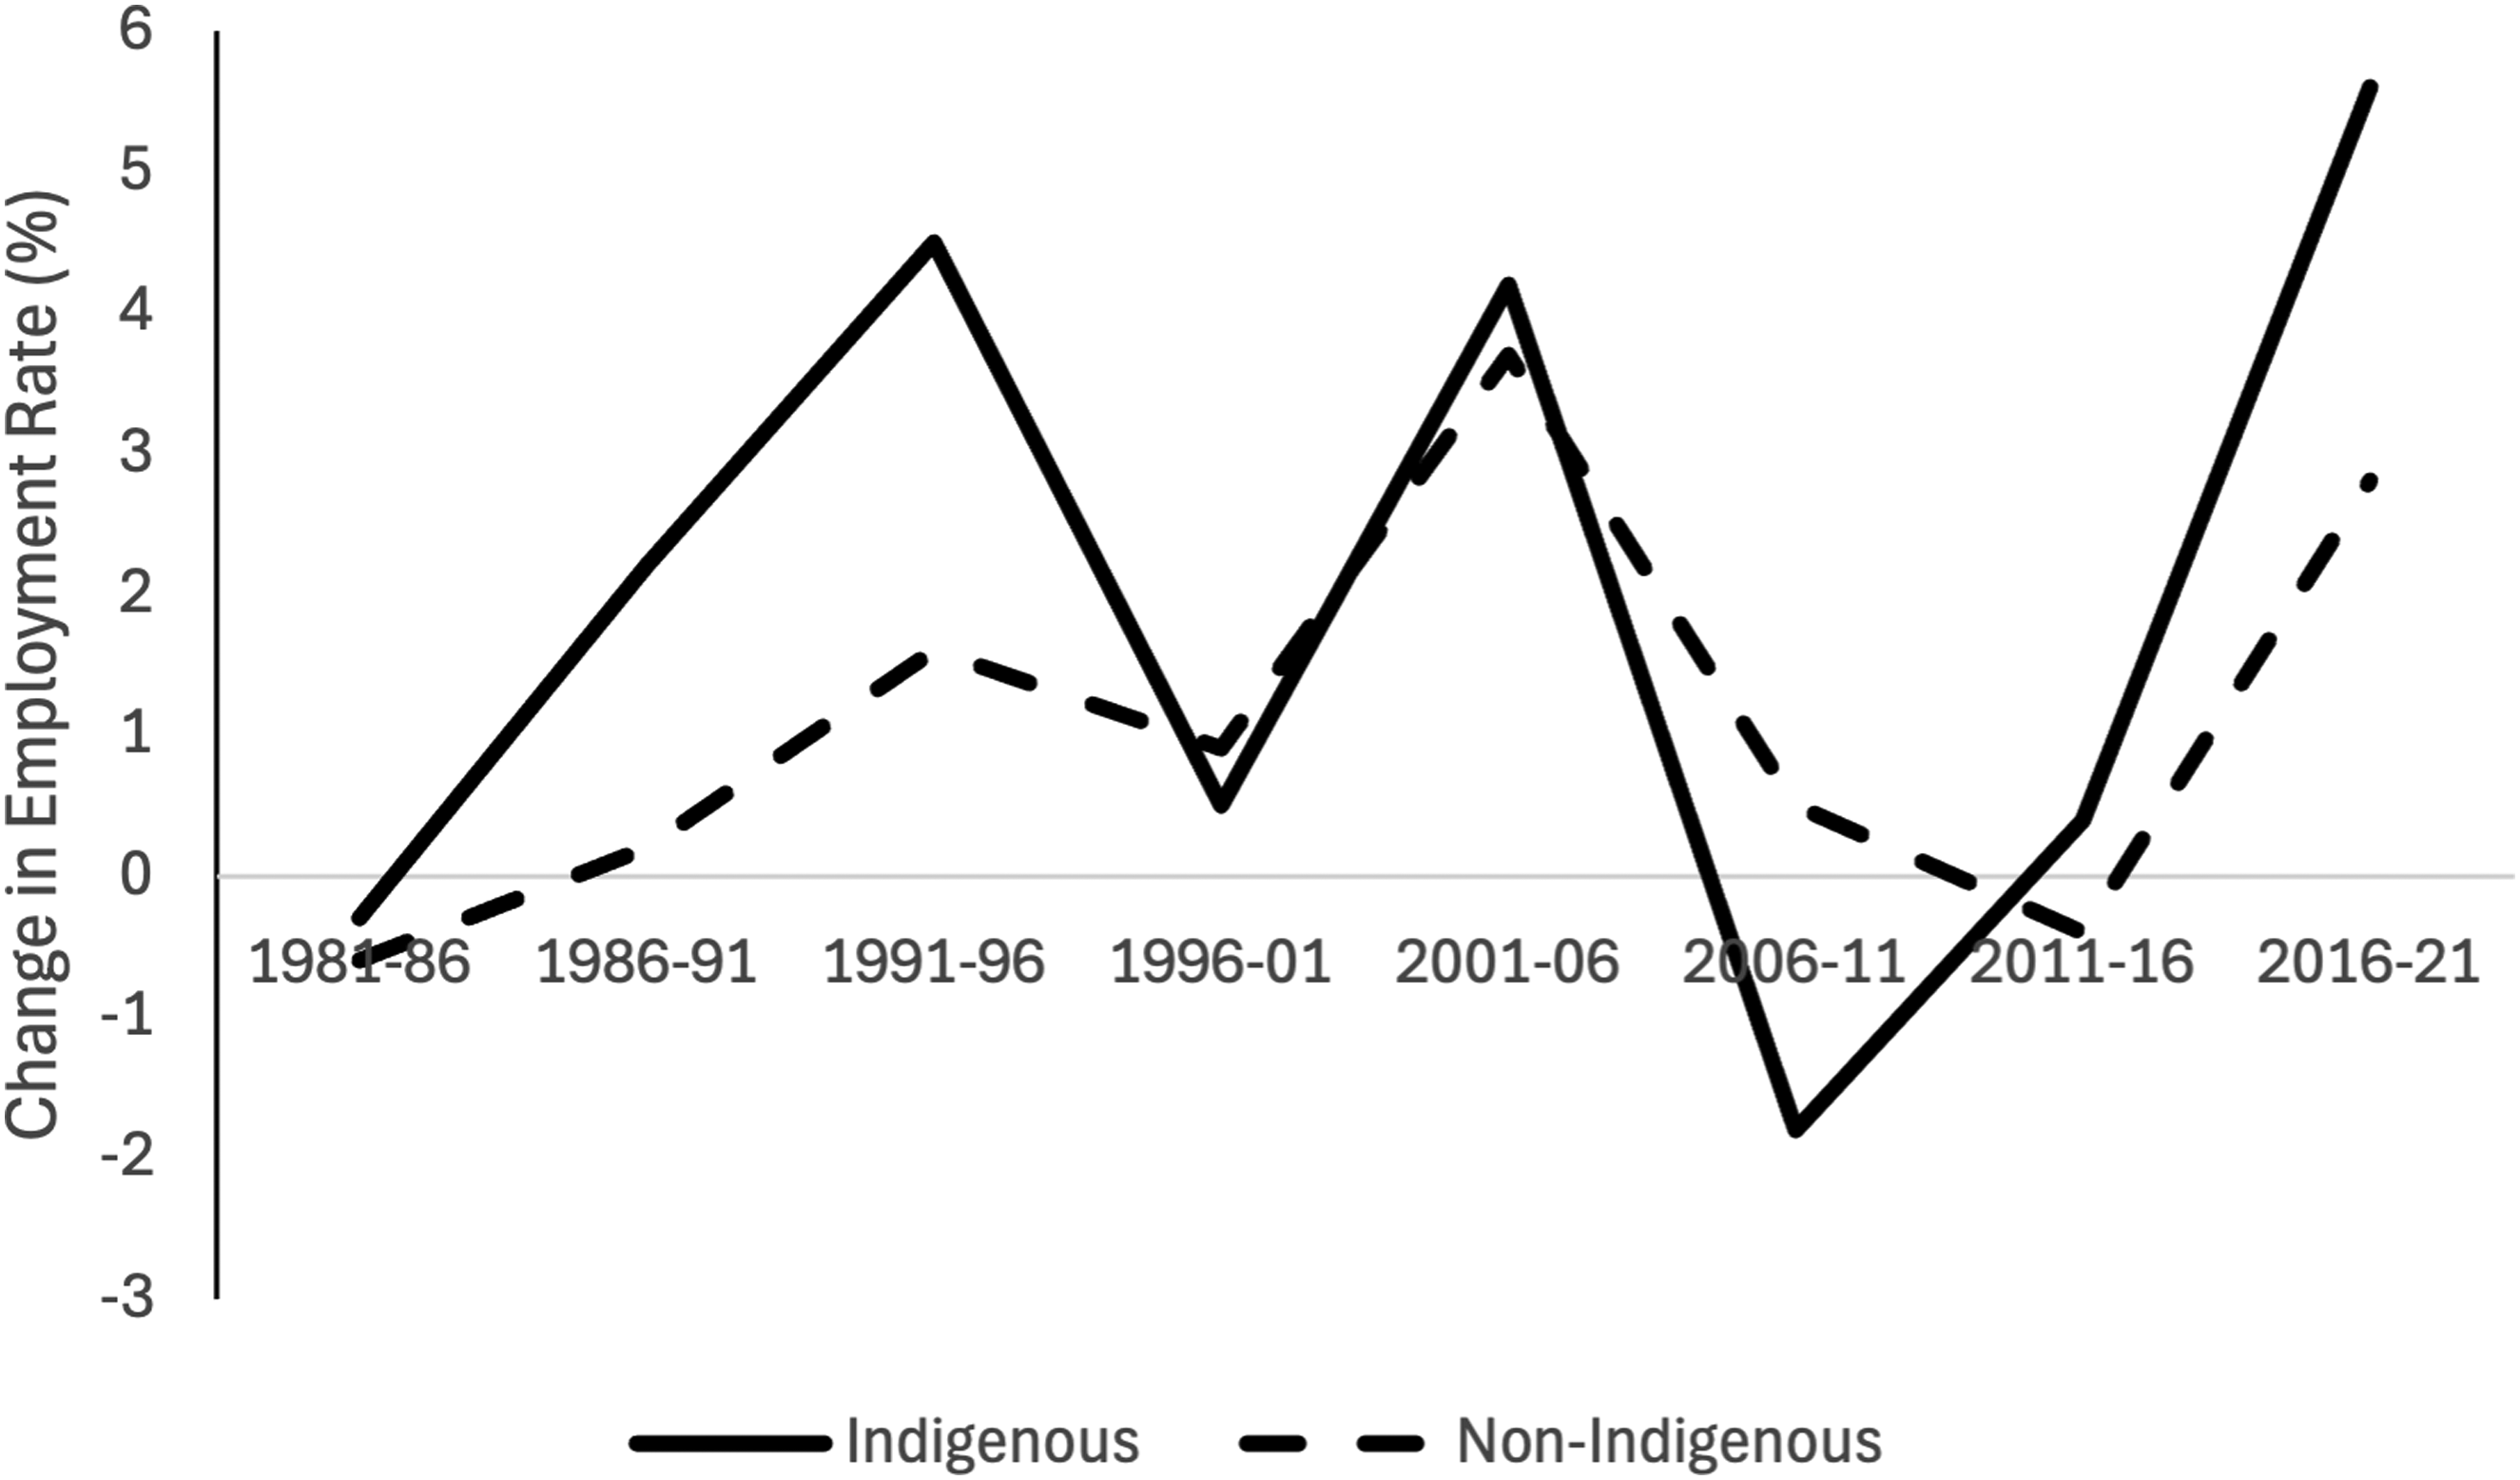
Although employment rates for Indigenous and non-Indigenous populations differ significantly, Figure 1 shows that both groups have followed similar trajectories across Census years. Building on this, Figure 2 displays the percentage point changes in employment rates between each Census. It reveals that Indigenous employment tends to increase during periods of broader employment growth and to decline, or grow more slowly, during periods of weaker labour market performance. This pattern suggests that Indigenous employment is closely tied to broader labour market trends.
Intercensal change in the employment rate by indigenous status, 15–64 years, 1981–2021.
Despite fluctuations, overall employment has increased over recent decades (AIHW, 2023b). Notably, the 5.6% point increase in Indigenous employment between 2016 and 2021 means that it is one of only a few Closing the Gap targets currently on track (Productivity Commission, 2024). However, there has been no formal analysis to date confirming whether this increase is driven entirely, or even primarily, by macroeconomic trends, or whether it is related to other factors such as Indigenous specific labour market programs and changing patterns of Indigenous identification between Censuses. It is not possible using the available data to disentangle the relative contributions of: (i) macro-economic factors; (ii) government policies aimed at increasing Indigenous employment and education policies; (iii) the impact of the former Indigenous specific CDEP program; and (iv) changes in Indigenous Identification. However, the evidence suggests that all these factors have played a role.
Employment trends by sex
One of the most significant shifts in the Australian labour market over recent decades has been the increase of women in the workforce (National Skills Commission, 2022). Societal attitudes that once limited women's economic autonomy have shifted, and the educational and employment discrimination imposed on women has reduced over recent decades. As a result, the share of women in the Australian workforce has grown substantially—from 30% in the 1960s to almost 50% in 2020 (ABS, 2021). This transformation reflects broader social, economic, and policy changes that have supported women's access to education, employment, and career advancement.
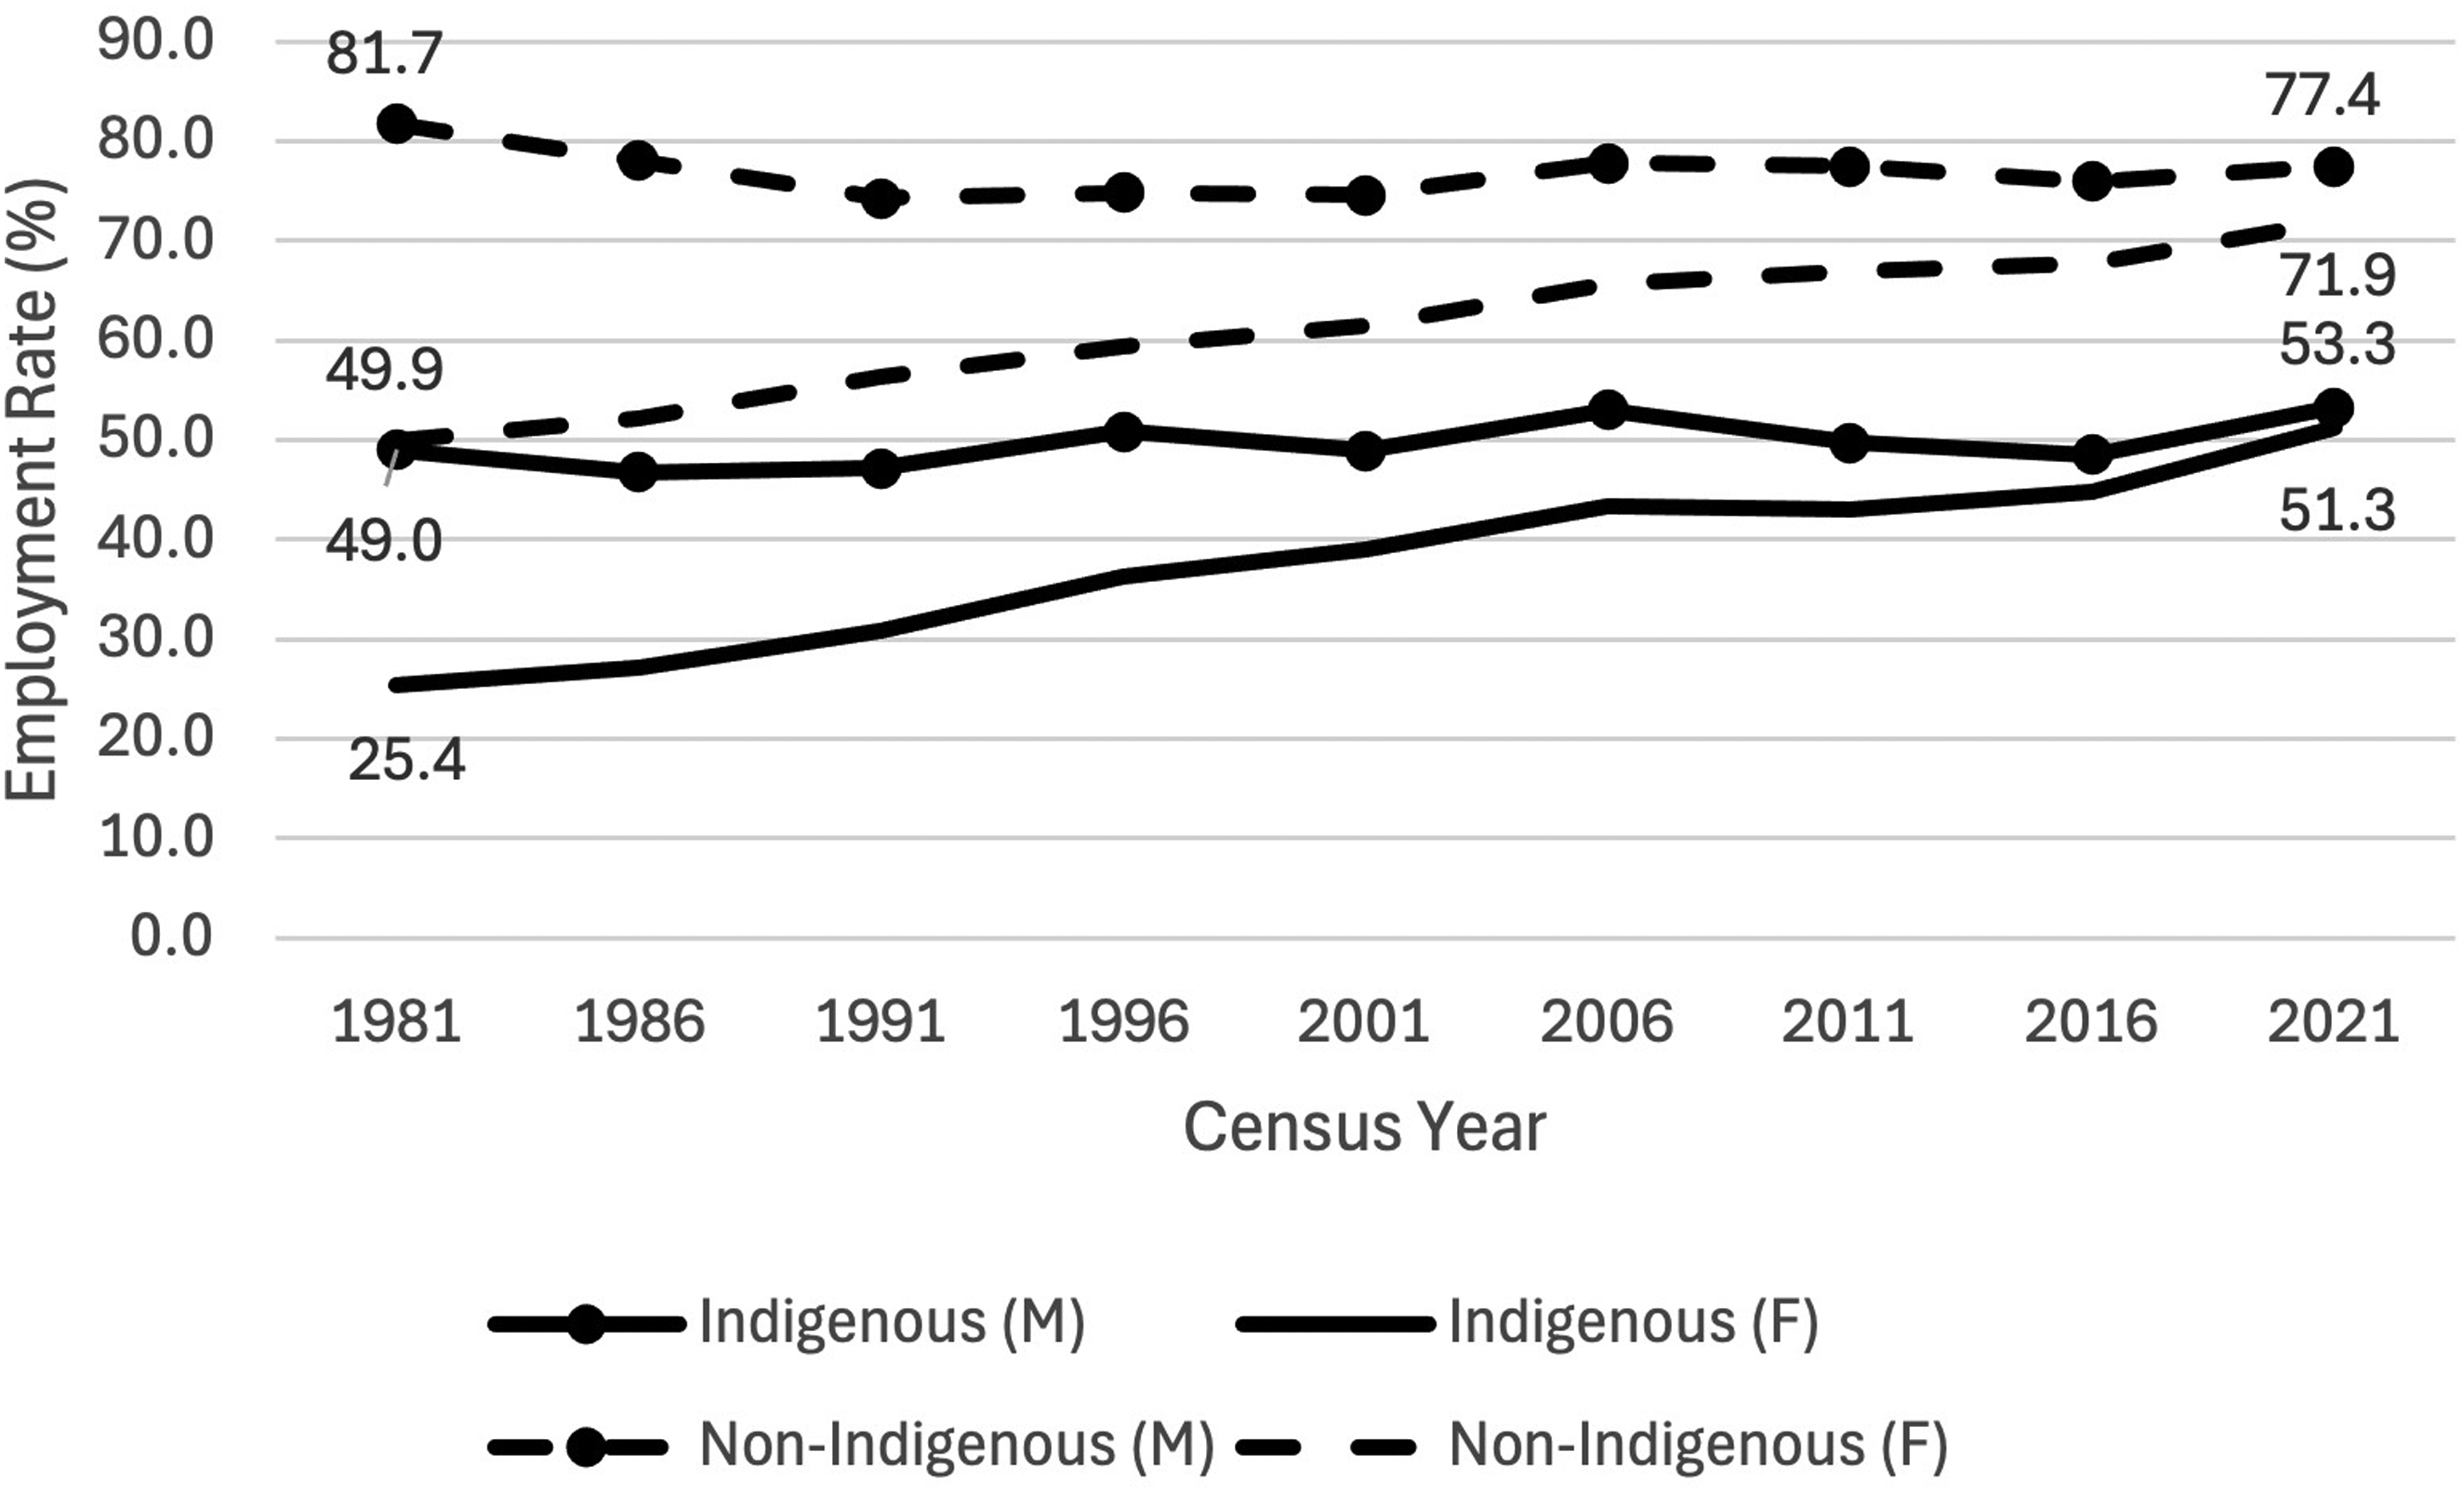
Figure 3 reports the trends in employment for the Indigenous and non-Indigenous population for men and women. While Figure 1 shows growth in employment for both the Indigenous and non-Indigenous populations between 1981 and 2021, Figure 3 illustrates that this growth for both the Indigenous and non-Indigenous population has been heavily influenced by the significant increase in the employment rate of women.
Employment rate by indigenous status and sex, 15–64 years, 1981–2021 (%).
For the non-Indigenous population, despite an overall increase in employment (as shown in Figure 1), male employment has declined by 4.3% points, albeit from a relatively high base. In contrast, non-Indigenous female employment has increased by 22.0% points, though it remains below parity with male employment. These trends are consistent with those in many other OECD countries (Fluchtmann and Patrini, 2023).
For Indigenous men, there has been a modest increase in the employment rate— 4.3% points over the 40-year period. In contrast, the employment rate of Indigenous women rose substantially from 25.4% to 51.3%, an increase of 25.9% points. This significant growth in employment among Indigenous women, coupled with the smaller increase in employment amongst Indigenous men means that by 2021, employment rates for Indigenous men and women are nearly equal.
Previous analyses of the Indigenous labour market have often identified Indigenous men as more likely to be in paid employment. However, these analyses have tended to overlook broader trends in the Australian labour market—particularly the increasing participation of women—which have had a significant impact on the employment outcomes of Indigenous women.
Given that the rate of employment of non-Indigenous men declined between 1981 and 2021, the overall increase the non-Indigenous employment rate is largely attributable to the substantial rise in women's employment (AIHW, 2023b). For the Indigenous population, while both men and women experienced increased employment rates, the majority of the overall growth is due to significant increase in employment among Indigenous women. Between 1981 and 2021, the total Indigenous employment rate has increased by 15.3% points. If Indigenous men had maintained their 1981 employment rate in 2021, the total Indigenous employment rate would have been 51.3%—0.9% points lower than the actual rate. However, if Indigenous women had maintained their 1981 employment rate, the total Indigenous employment rate in 2021 would have been 39.0%, 13.2% points lower. This means that the increase in employment rate among Indigenous women accounted for over 93% of the total increase in Indigenous employment over the 40-year period. This is a significant finding, as it highlights that shifts in Indigenous employment rates over this period are likely due to changes in the broader Australian labour market, particularly the increasing employment of women, rather than gains specific to the Indigenous labour market alone.
Education changes
Another potential explanation for the narrowing of the employment gap between the Indigenous and non-Indigenous populations is the increase in educational attainment among Indigenous peoples relative to the broader population. At a population level, the proportion of Australians aged 15 and over with non-school qualifications rose from 24.2% in 1981 to 54.7% in 2021 (ABS, 2022).
While comparing educational attainment across Census years is challenging due to changes in question design, it is possible to examine trends in post-secondary educational attainment—defined here as holding a diploma, bachelor's degree or graduate diploma.
Data for 1981 is drawn from the Committee of Review of Aboriginal Employment and Training Programs (1985), which reports figures for the Indigenous population and the Australian population as a whole (but not specifically for the non-Indigenous population), and focuses on those aged 15 and over. To ensure comparability, 2021 data is also reported for the Indigenous population and the Australian population as a whole, for those aged 15 + .
Table 1 shows that there were large increases in post-secondary educational attainment between 1981 and 2021:
For Australian men, the proportion with a post-secondary qualification rose from 8.6% to 33.3%. For Australian women, the increase was even greater—from 6.8% to 41.2%. Among Indigenous men, post-secondary attainment increased from 0.6% to 9.3%. For Indigenous women, the increase was from 0.7% to 18.0%.
Post-secondary education by indigenous status and sex, 15 years plus, 1981–2021 (%).
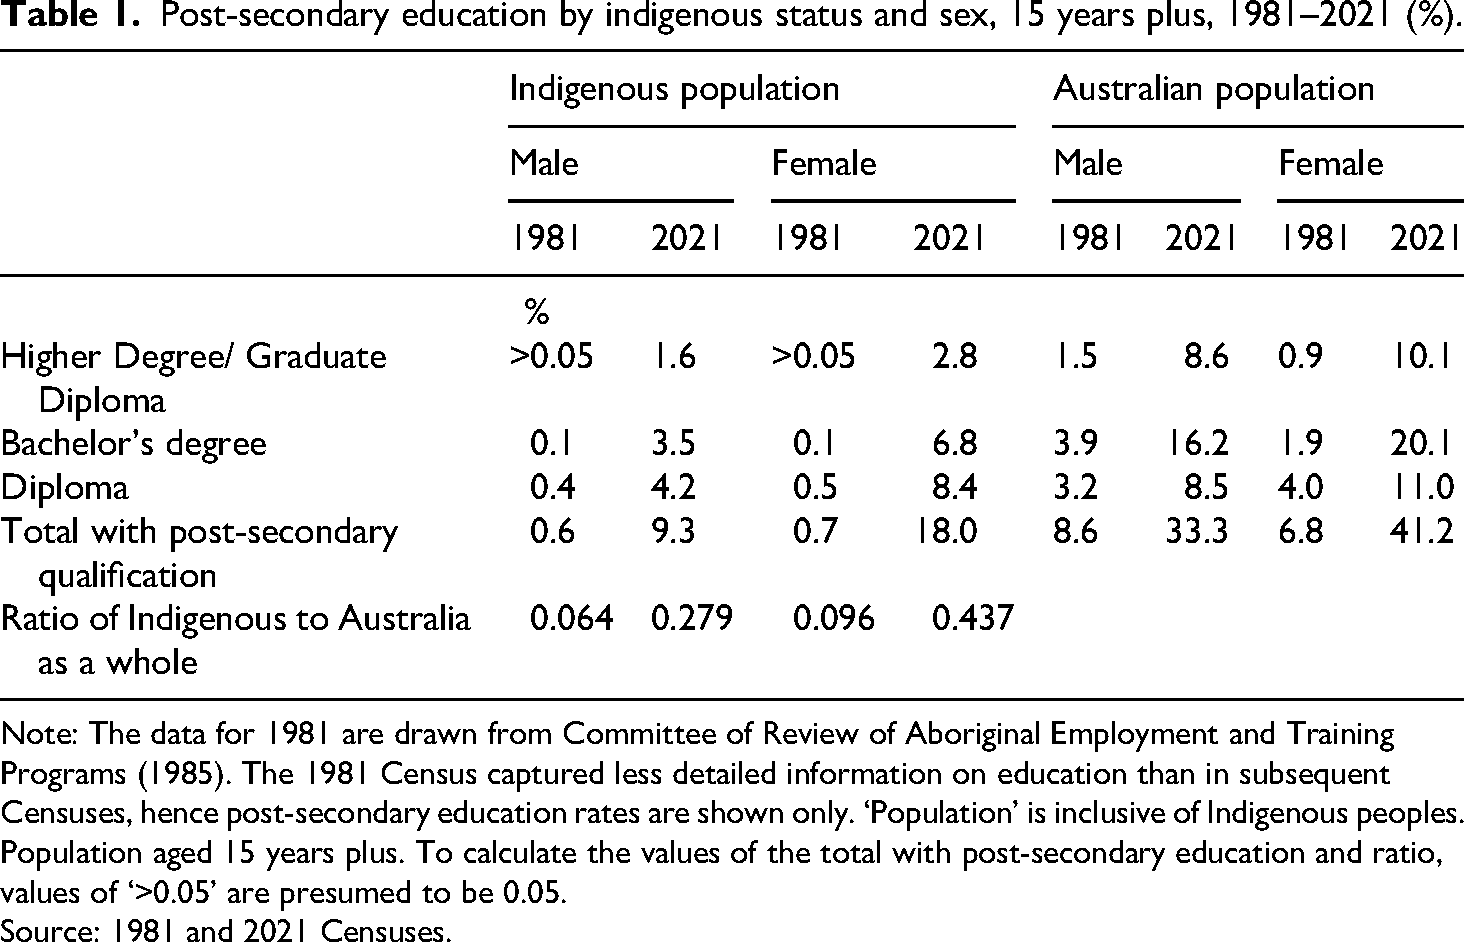
Note: The data for 1981 are drawn from Committee of Review of Aboriginal Employment and Training Programs (1985). The 1981 Census captured less detailed information on education than in subsequent Censuses, hence post-secondary education rates are shown only. ‘Population’ is inclusive of Indigenous peoples. Population aged 15 years plus. To calculate the values of the total with post-secondary education and ratio, values of ‘>0.05’ are presumed to be 0.05.
Source: 1981 and 2021 Censuses.
Women have significantly outpaced men in post-secondary attainment over the period, which likely contributes to the rising employment rates among both Indigenous and non-Indigenous women.
The final row of Table 1 reports the ratio of Indigenous to total Australian post-secondary attainment:
For men, the ratio increased from 0.064 in 1981 to 0.279 in 2021. For women, the ratio rose from 0.096 to 0.437.
While a substantial gap in post-secondary attainment remains in 2021, the data shows that this gap has narrowed considerably over the past four decades. The relative increase in higher education for females compared to males is more pronounced for the Indigenous population. Biddle and Meehl (2016) discuss a range of reasons for this. Potential reasons for which there is at least some empirical support identified by Biddle and Meehl (2016) are: (i) higher rates of school absenteeism among male Indigenous students and evidence that gender cultural practices are a factor in higher rates for absenteeism for Indigenous males in remote areas; (ii) high rates of male Indigenous incarceration; and (iii) the fact Indigenous women are more likely to complete postschool qualifications as a mature-age student. Moore et al. (2023) further develop this argument, identifying additional barriers to higher education related to cultural practices for young Indigenous males.
The much faster rate of increase in post-secondary education among Indigenous women compared to Indigenous men appears to be a key drive of stronger employment growth among Indigenous women. As shown in Table 2, in 2021, Indigenous people with post-secondary qualifications had higher employment rates their non-Indigenous counterparts with post-secondary qualifications. Notably, Indigenous women were represented in this cohort at twice the rate of Indigenous men, highlighting the significant role of educational attainment in shaping employment outcomes.
Employment rate post-secondary education and indigenous status, 15 years plus, 1981–2021 (%).
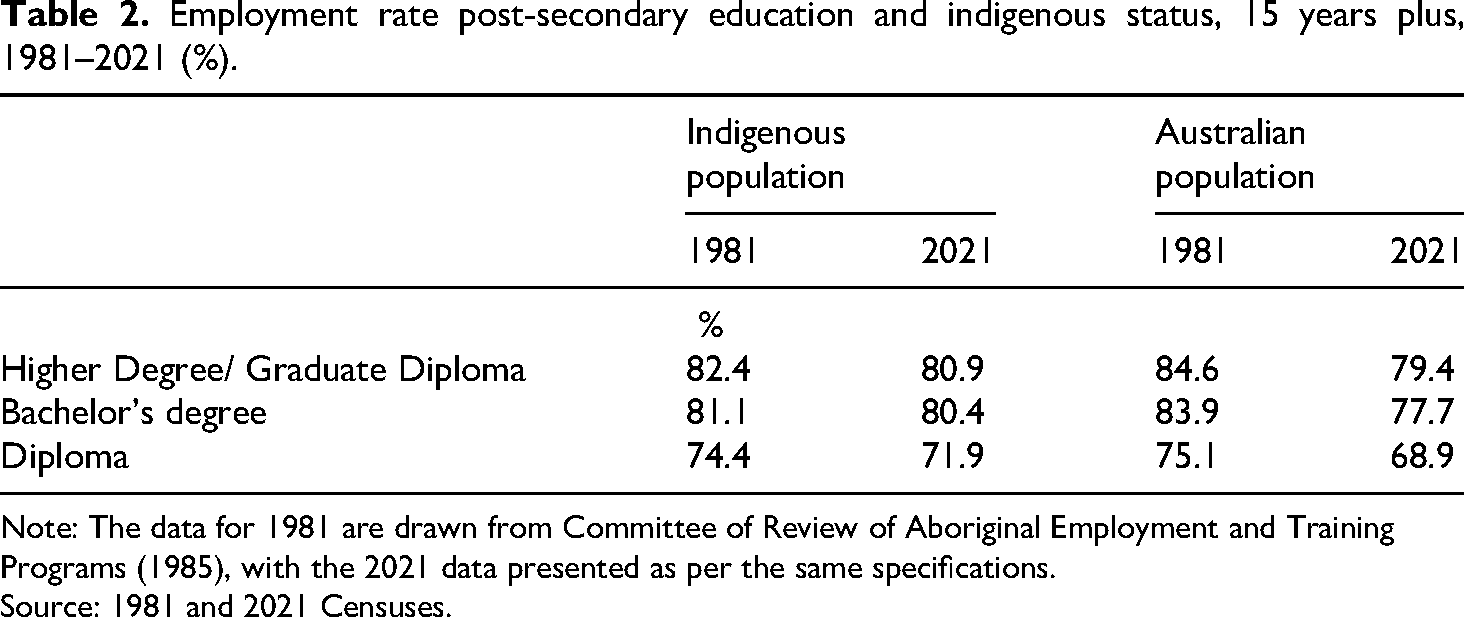
Note: The data for 1981 are drawn from Committee of Review of Aboriginal Employment and Training Programs (1985), with the 2021 data presented as per the same specifications.
Source: 1981 and 2021 Censuses.
Changes in employment rates across age groups, 1981 and 2021
Table 3 presents employment rates for 10-year age groups in 1981 and 2021. There are notable differences in how employment rates changed across age groups.
Employment rates by 10-year age group, sex, and indigenous Status, 1981 and 2021 (%).
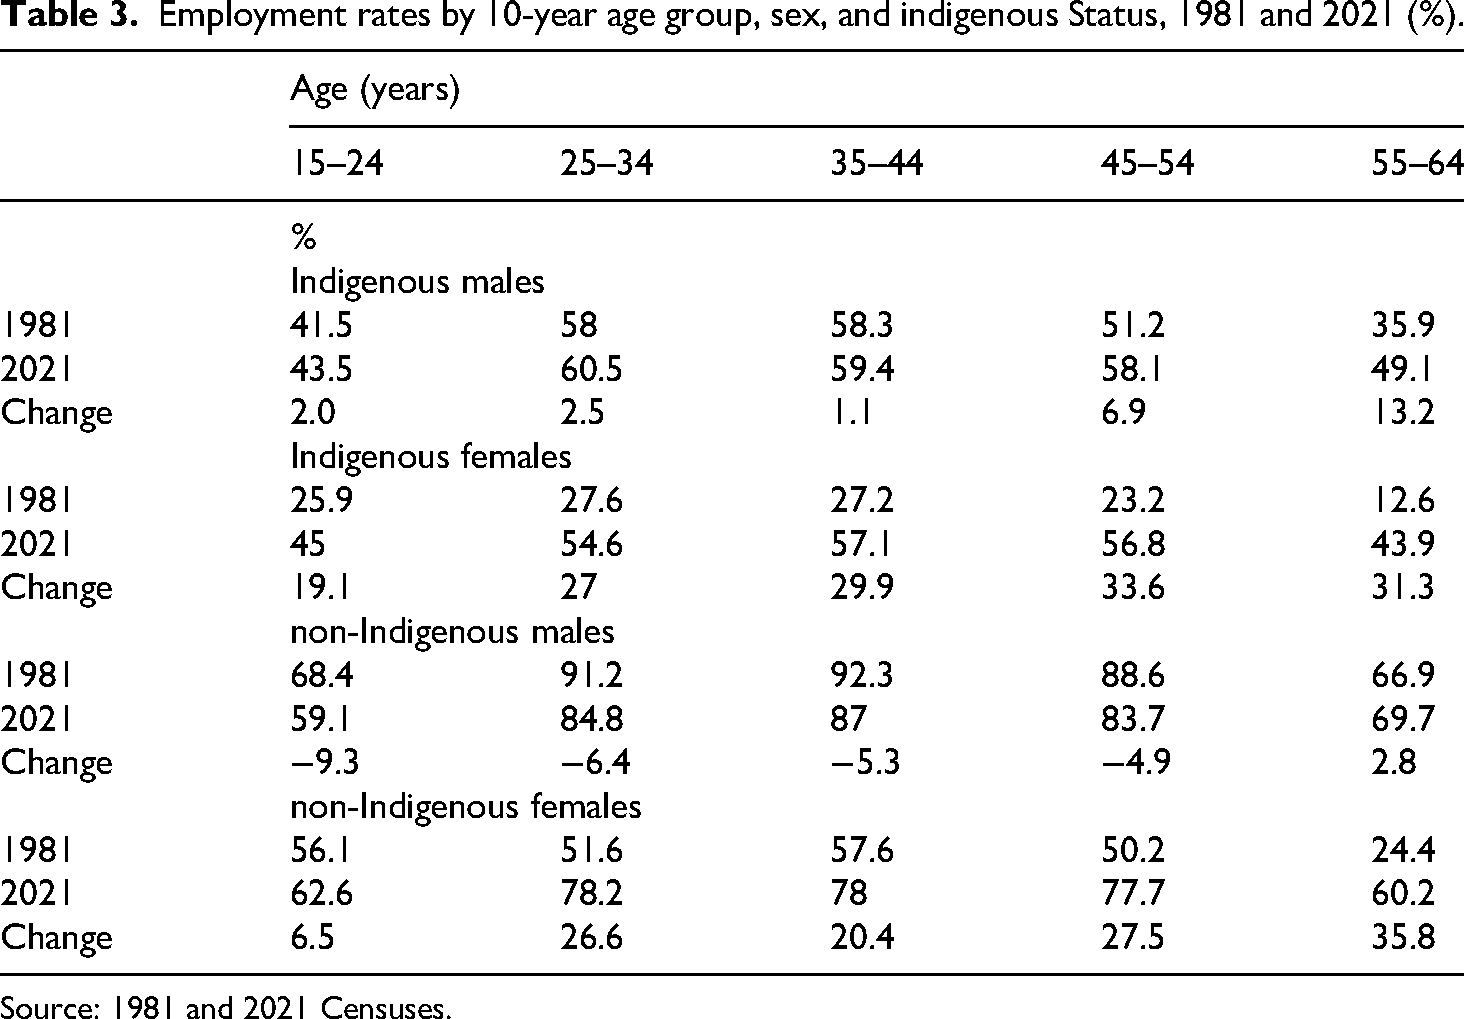
Source: 1981 and 2021 Censuses.
For non-Indigenous men, employment rates declined across all age groups except for those aged 55–64 years who experienced a slight increase. The largest decline rate occurred amongst those aged 15–24 years, with a decrease of 9.3% points. The decline in employment rates tapers off with increasing age and for those age 55–64 years there was an increase of 2.8% points. Indigenous men experienced modest increases in employment in the younger age cohorts (15–24, 25–34 and 35–44 years), with the most substantial increases occurring in the older age groups: 6.9% points for those aged 45–54 years and 13.2% points for those aged 55–64 years.
For both Indigenous and non-Indigenous women, there are substantial increases in the employment rate for all age cohorts, with the largest increases experienced by the older age groups. These increases in employment among older age groups are due to a range of factors including many people being in better health during their fifties and sixties as life expectancy increases. Access to the age pension and the average retirement age have increased across the period of this analysis (Department of Social Security, 2023; ABS, 2024). Similarly, the life expectancy of both the non-Indigenous and Indigenous populations has increased over this time (AIHW, 2024b, Productivity Commission, 2024a).
For the older Indigenous age groups, historical context provides an important lens through which to understand employment trends. Those aged 45–64 in 1981 were born between 1917 and 1936, during the ‘Protection Era’ of Australian Indigenous policy during which there were extensive control and restrictions imposed by Aboriginal Protection Boards (Leroy-Dyer, 2021). In contrast, those aged 45–64 in 2021 were born between 1957 and 1976, a time that includes the 1967 referendum which resulted in Aboriginal and Torres Strait Islander peoples being formally acknowledged as part of the Australian population, and gave the Federal Government powers to legislate for Aboriginal and Torres Strait Islander peoples which previously rested with the state. It marked a shift away from ‘protectionist’ policies (Langton, 2011).
However, while older Indigenous men experienced the most substantial employment gains, they represent a smaller share of the overall Indigenous male working age population. In 2021, there were 172,330 Indigenous men aged 15–44, compared to 65,467 aged 45–64. This means that whilst the increased rate of employment for older Indigenous men is significant, it does not account for most of the overall increase in employment for Indigenous men.
Cohort analysis of employment rates
This section presents a synthetic cohort analysis to explore how employment rates are changing for different birth cohorts. This approach is useful for both understanding some of the drivers for Indigenous (and non-Indigenous) employment outcomes over time, tracks how employment has changed for specific birth cohorts over their lifetimes, and provides insights into possible future trends in Indigenous employment.
The analysis is based on data from the 1981, 1991, 2001, 2011 and 2021 Censuses which are used to track labour market outcomes for 10-year birth cohorts. Thus, the unit of analysis is a ‘cohort’ which is uniquely identified in successive censuses by its sex, age, and Indigenous status. The birth cohorts used are people born in the following range of years: 1957–1966 (aged 55–65 years in 2021); 1967–1976 (aged 45–54); 1977–1986 (aged 35–44)); and 1987–1996 (aged25–34). 6 These cohorts are presented for Indigenous and non-Indigenous men and women in Figure 4.
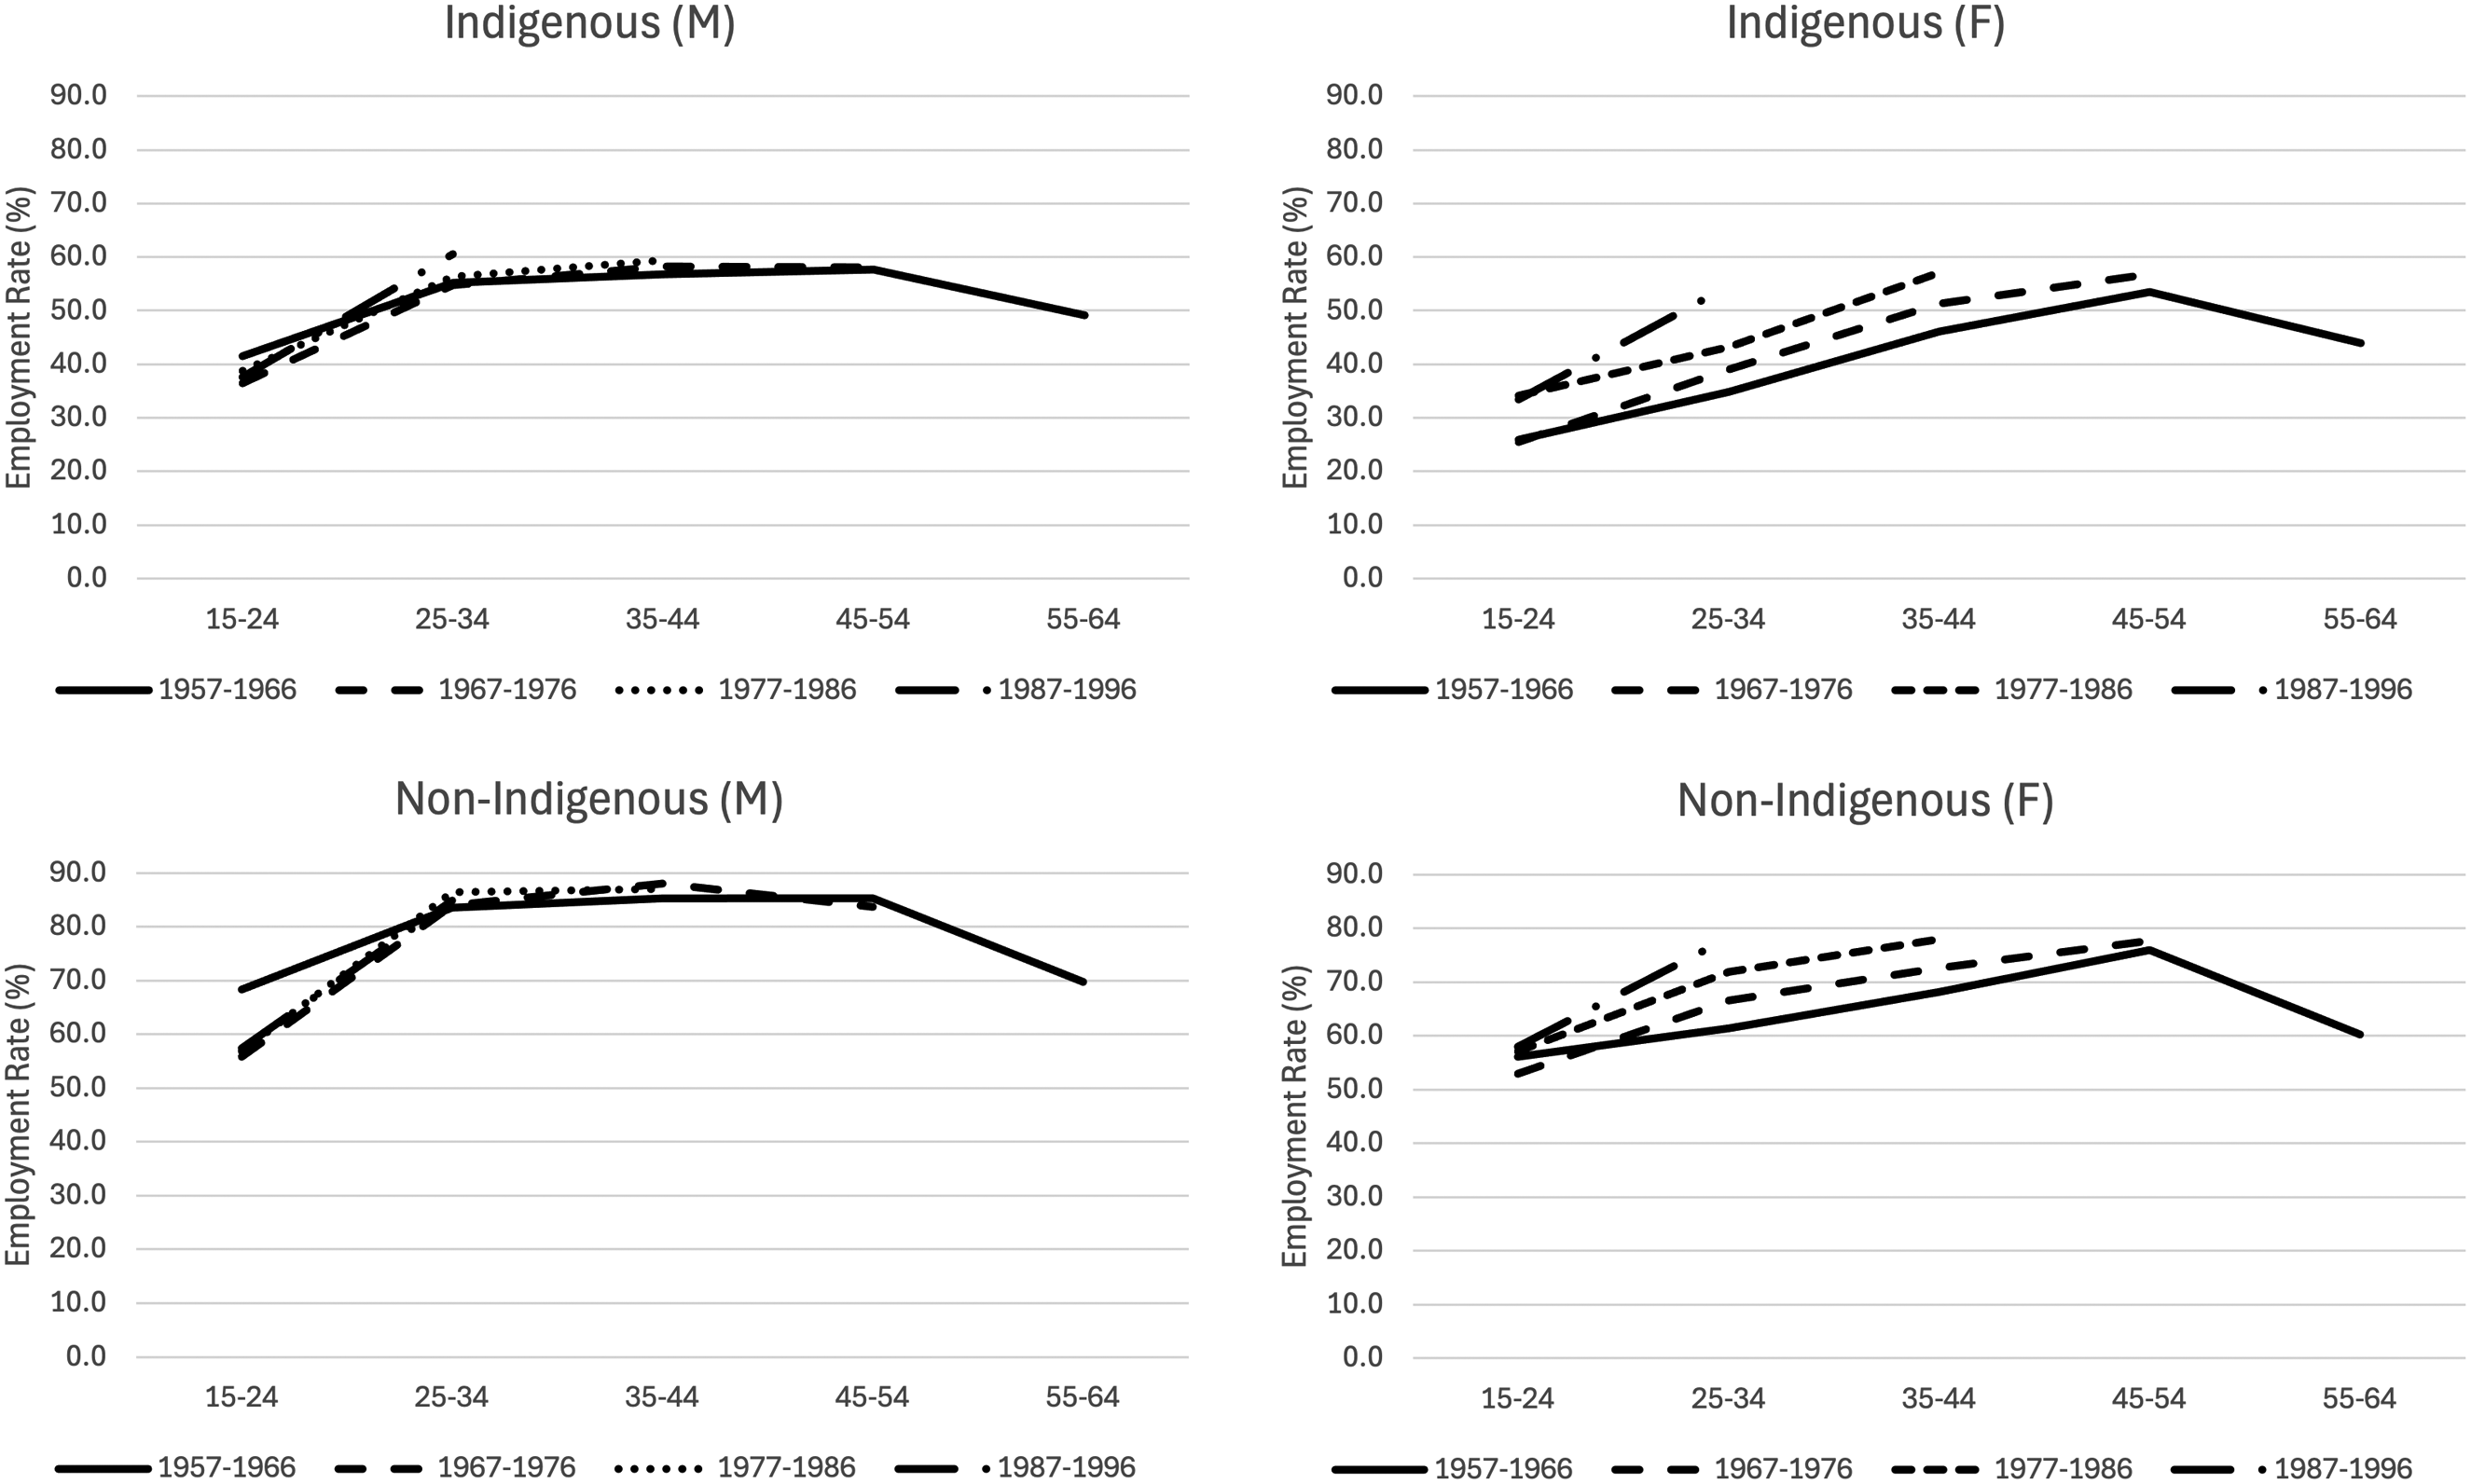
Age profile of employment rate by birth cohort, Indigenous status and sex (%).
The three older cohorts of Indigenous men (born 1957–1986) have similar age-employment profiles. The key difference is that those born between 1957 and 1966 had a higher employment rate at ages 15–24 years than the subsequent cohorts. The youngest cohort (1987–1996) had a higher employment rate at ages 25–34 than the older cohorts did at the same age. This means that the increases in employment rates for Indigenous men are largely being driven by increases in employment amongst younger Indigenous men and not increases by older birth cohorts.
For non-Indigenous men, the employment rate at age 15–24 years was highest for the 1957–1966 cohort, with little difference among later cohorts. From ages 25–34, differences in employment rates between cohorts are relatively minor.
The age-employment profiles of Indigenous women differ markedly across cohorts. The substantial rise in Indigenous women's employment since 1981 is largely due to each successive birth cohort having a higher employment rate at any given age than the cohort before it. The only exception is at ages 25–34, where employment rates for the 1977–1986 and 1987–1996 cohorts are similar. This analysis suggests that the employment rate of Indigenous women is likely to continue to increase in coming decades. There is a similar trend for non-Indigenous women, with employment rates increasing across birth cohorts at most ages. However, like Indigenous women, there is little change in employment rates at ages 15–24.
Considering the community development projects (CDEP) scheme
Introduced in 1977, the CDEP scheme was a multi-faceted program that converted unemployment benefit payments that had been directed to Indigenous peoples in remote areas, to Indigenous organisations to employ these individuals part-time (Hunter, 2009). While the CDEP Scheme had a broad range of aims and benefits, its main aim was to redress the imbalance of an oversupply of labour in remote labour markets with limited demand. Being delivered by community organisations, CDEP was able to support local decision making and support localised aspirations for community development (Klein and Markham, 2025, p8–13). At its peak in 2002–03, there were over 35,000 CDEP participants (Hunter and Gray, 2012). The scheme continued to operate in some remote areas until June 2015, albeit with significantly reduced numbers (Hunter 2019), at which time it was replaced by the Community Development Programme (CDP). 7 Though similarly named, CDEP and CDP were underpinned by divergent rationales and maintained different policy architectures (Jordan and Fowkes, 2016), with CDP opting for a more inflexible and punitive approach that resulted in increased poverty and decreased employment rates (Klein and Markham, 2025). Key differences between the schemes that are relevant to this paper include that CDEP had much higher participation at its peak compared to CDP. Second, participation in CDEP was classified as employment in Census data from 1981 to 2011, whereas CDP participation was not in 2016 and 2021. 8 This distinction is important when analysing Indigenous employment trends, as fluctuations in CDEP participation significantly influenced reported employments rates as measured using the Census.
The classification of CDEP participation as employment has been the subject of considerable debate. Critics argue that CDEP payments resembled welfare rather than wages, and that classifying participation as employment may obscure the persistent barriers to formal labour market engagement (Hunter, 2002; Jordan, 2012). While one of CDEP's goals was to reduce these barriers, its inclusion in employment statistics may have overstated progress in overcoming them.
Given the significance of the CDEP scheme over several decades, it is important to understand the extent to which it may have contributed to Indigenous employment rates between 1981 and 2021. Attempts have been made to estimate what the rates of Indigenous employment would be should CDEP participation not have been classified as employment (e.g., Hunter, 2002; Taylor and Hunter, 1998). These estimates rely on multiple assumptions and have significant limitations. Most significantly, excluding CDEP participants from employment statistics assumes that, in the absence of the scheme, those individuals would not have been in any other form of employment. Additionally, these estimates depend on administrative CDEP data external to the Census, which are difficult to use for population-level analysis. 9 Rather than attempting to re-estimate employment rates, this paper calculates the proportion of the working-age population (aged 15–64) who were CDEP participants in each Census year, as shown in Figure 5. Estimates of employment rates excluding CDEP participation can be found in the endnotes, 10 alongside their substantive caveats.
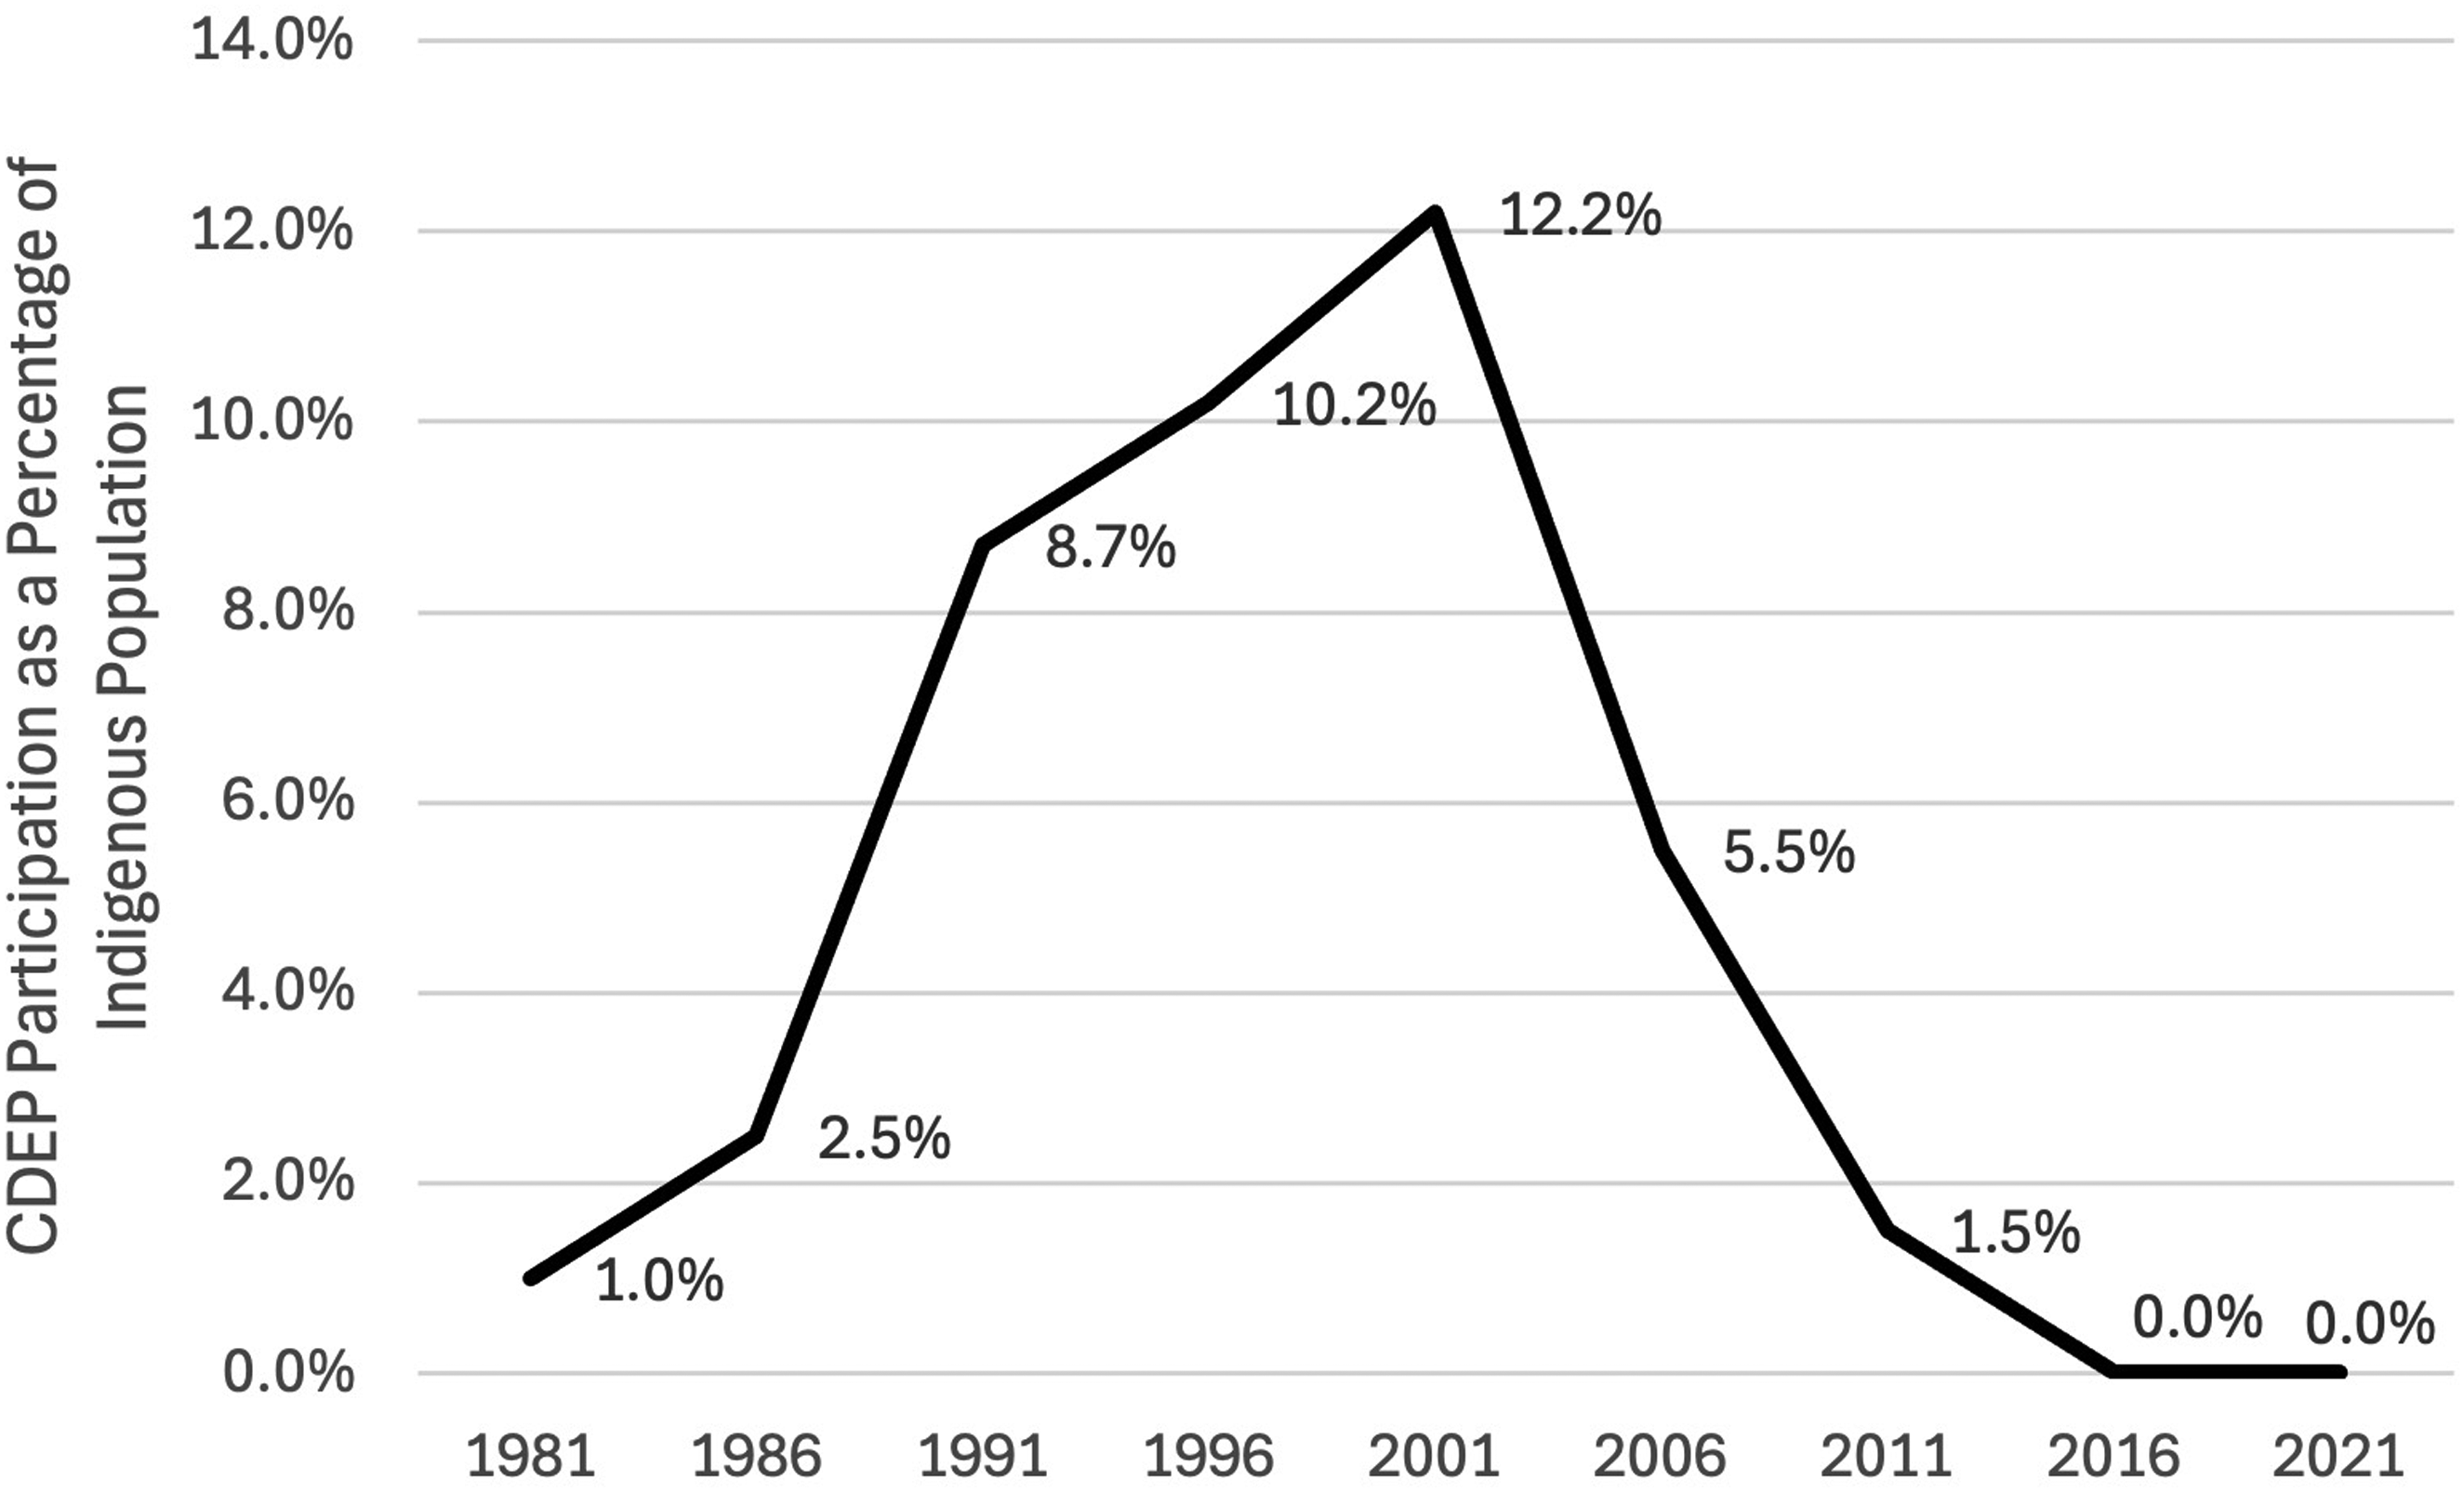
CDEP participants as a proportion of the Indigenous working-age population, 1981–2021 (%).
The proportion of the Indigenous population aged 15–64 years who were CDEP participants increased from 2.5% in 1986 to 12.2% in 2001 before falling to 1.5% in 2011 (Figure 5). The decline in Indigenous employment between 2006 and 2011 which was maintained through to 2016 (Figure 1) can be partly attributed to the substantial reduction in the number of CDEP participants during this period, culminating in the scheme's cessation in 2015. However, the reduction in the CDEP scheme does not fully explain the decline in employment. Broader labour market conditions, particularly the impact of the 2008 Global Financial Crisis, also contributed to reduced employment opportunities during this time.
Employment trends and geographic remoteness
Policymakers have long faced challenges in designing effective Indigenous economic development and labour market policies and programs in remote areas. As discussed in the previous section, the CDEP scheme played a central role in generating employment opportunities for Indigenous peoples in remote areas between 1977 and 2015. With the demise of CDEP, it is important to understand its impact on Indigenous employment in remote and very remote areas where the scheme was most prominent.
Due to a lack of comparable data on employment rates by geographic remoteness prior to 2006, this analysis focus on the period 2006 to 2021, using the Australian Standard Geographical Classification for Remoteness Areas, which categorises areas as major city, inner regional, outer regional, remote and very remote.
Table 4 presents employment rates for the Indigenous and non-Indigenous populations by geographic remoteness for the years 2006, 2011, 2016 and 2021. Consistent with existing literature, Indigenous employment rates are highest in major cities and decline with increasing remoteness. In contrast, non-Indigenous employment rates tend to increase with remoteness. For example, in 2021 the Indigenous employment rate was 58.1% in major cities and 30.4% in very remote areas, and the non-Indigenous employment rate was 74.4% in major cities, and 86.1% in very remote areas.
Indigenous and non-indigenous employment rates by geographic remoteness, 2006–2021, 15–64-year-olds (%).
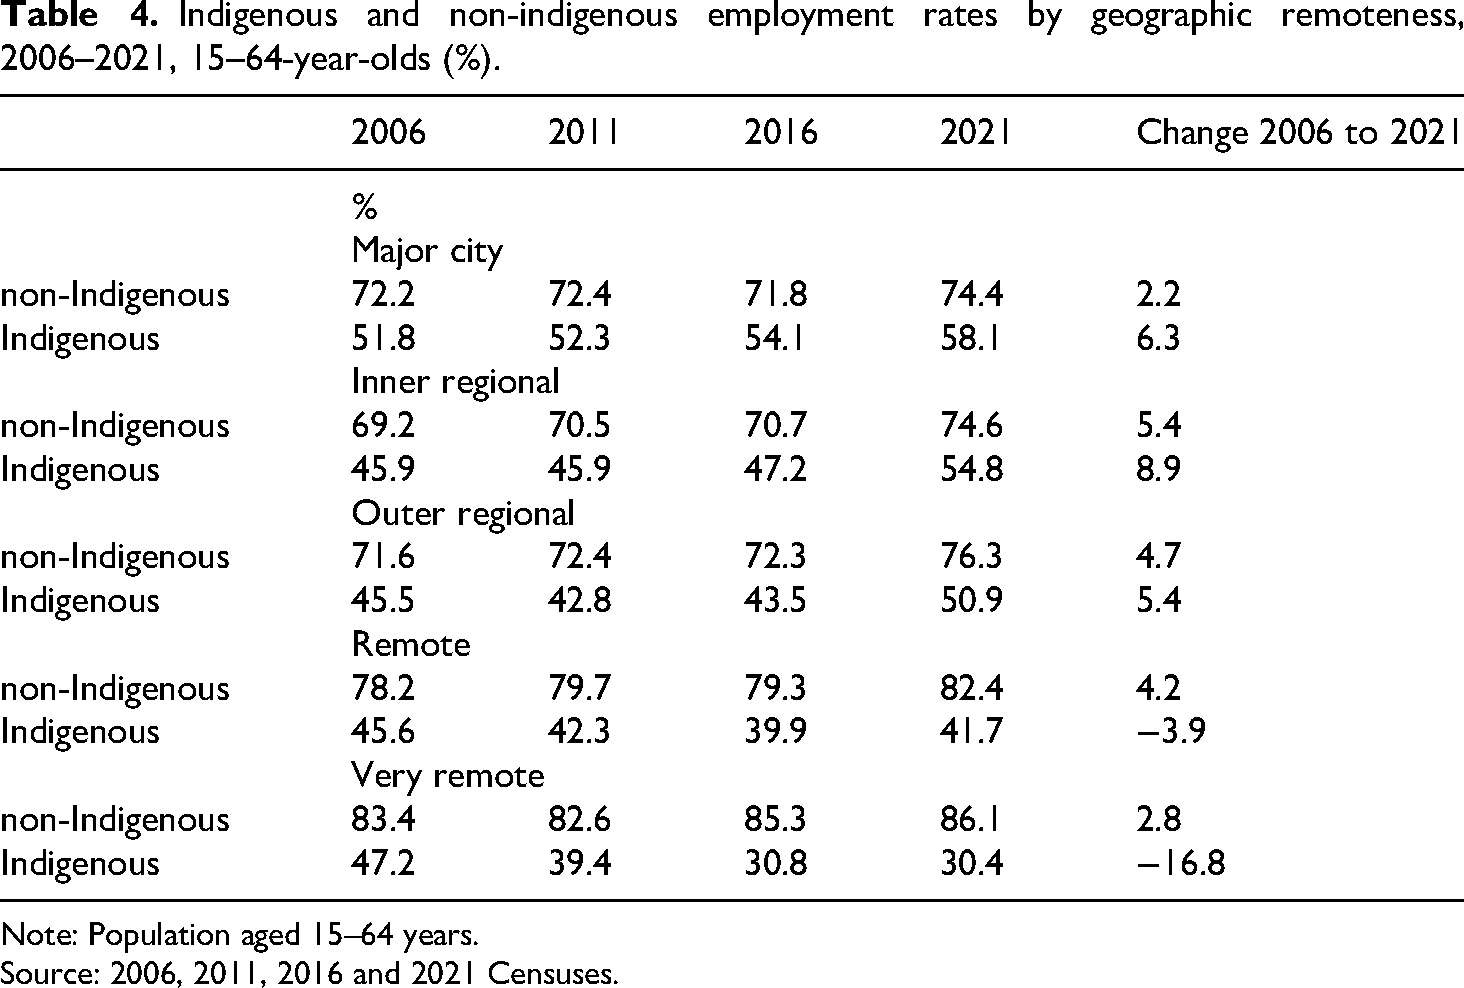
Note: Population aged 15–64 years.
Source: 2006, 2011, 2016 and 2021 Censuses.
Between 2006 and 2021, the overall Indigenous employment rate rose from 48.0% to 52.2% (Figure 1). However, the changes in employment rate are not consistent across geographic areas. There were increases in the non-Indigenous employment rate in all geographic remoteness areas and increases in the Indigenous employment rate in major cities, inner regional and outer regional areas, there were falls in the Indigenous employment rate in remote and very areas of 3.9% and 16.8% points respectively.
CDEP participation peaked in 2001 and steadily declined until the scheme ended in 2015. The concurrent drop in Indigenous employment in remote and very remote areas strongly suggests that the demise of CDEP played a significant role in these declines. However, broader labour market factors—such as the 2008 Global Financial Crisis—also likely contributed to reduced employment opportunities during this period.
Figure 6 shows the ratio of Indigenous to non-Indigenous employment across geographic remoteness categories from 2006 to 2021. This clearly shows a narrowing employment gap in major cities, and regional areas, but a substantial widening in remote and very remote areas. By 2021 the ratio of Indigenous to non-Indigenous employment was 0.506 in remote areas meaning that the Indigenous employment rate was half that of the non-Indigenous population and in very remote areas it was 0.353, just over one-third that of the non-Indigenous employment rate.
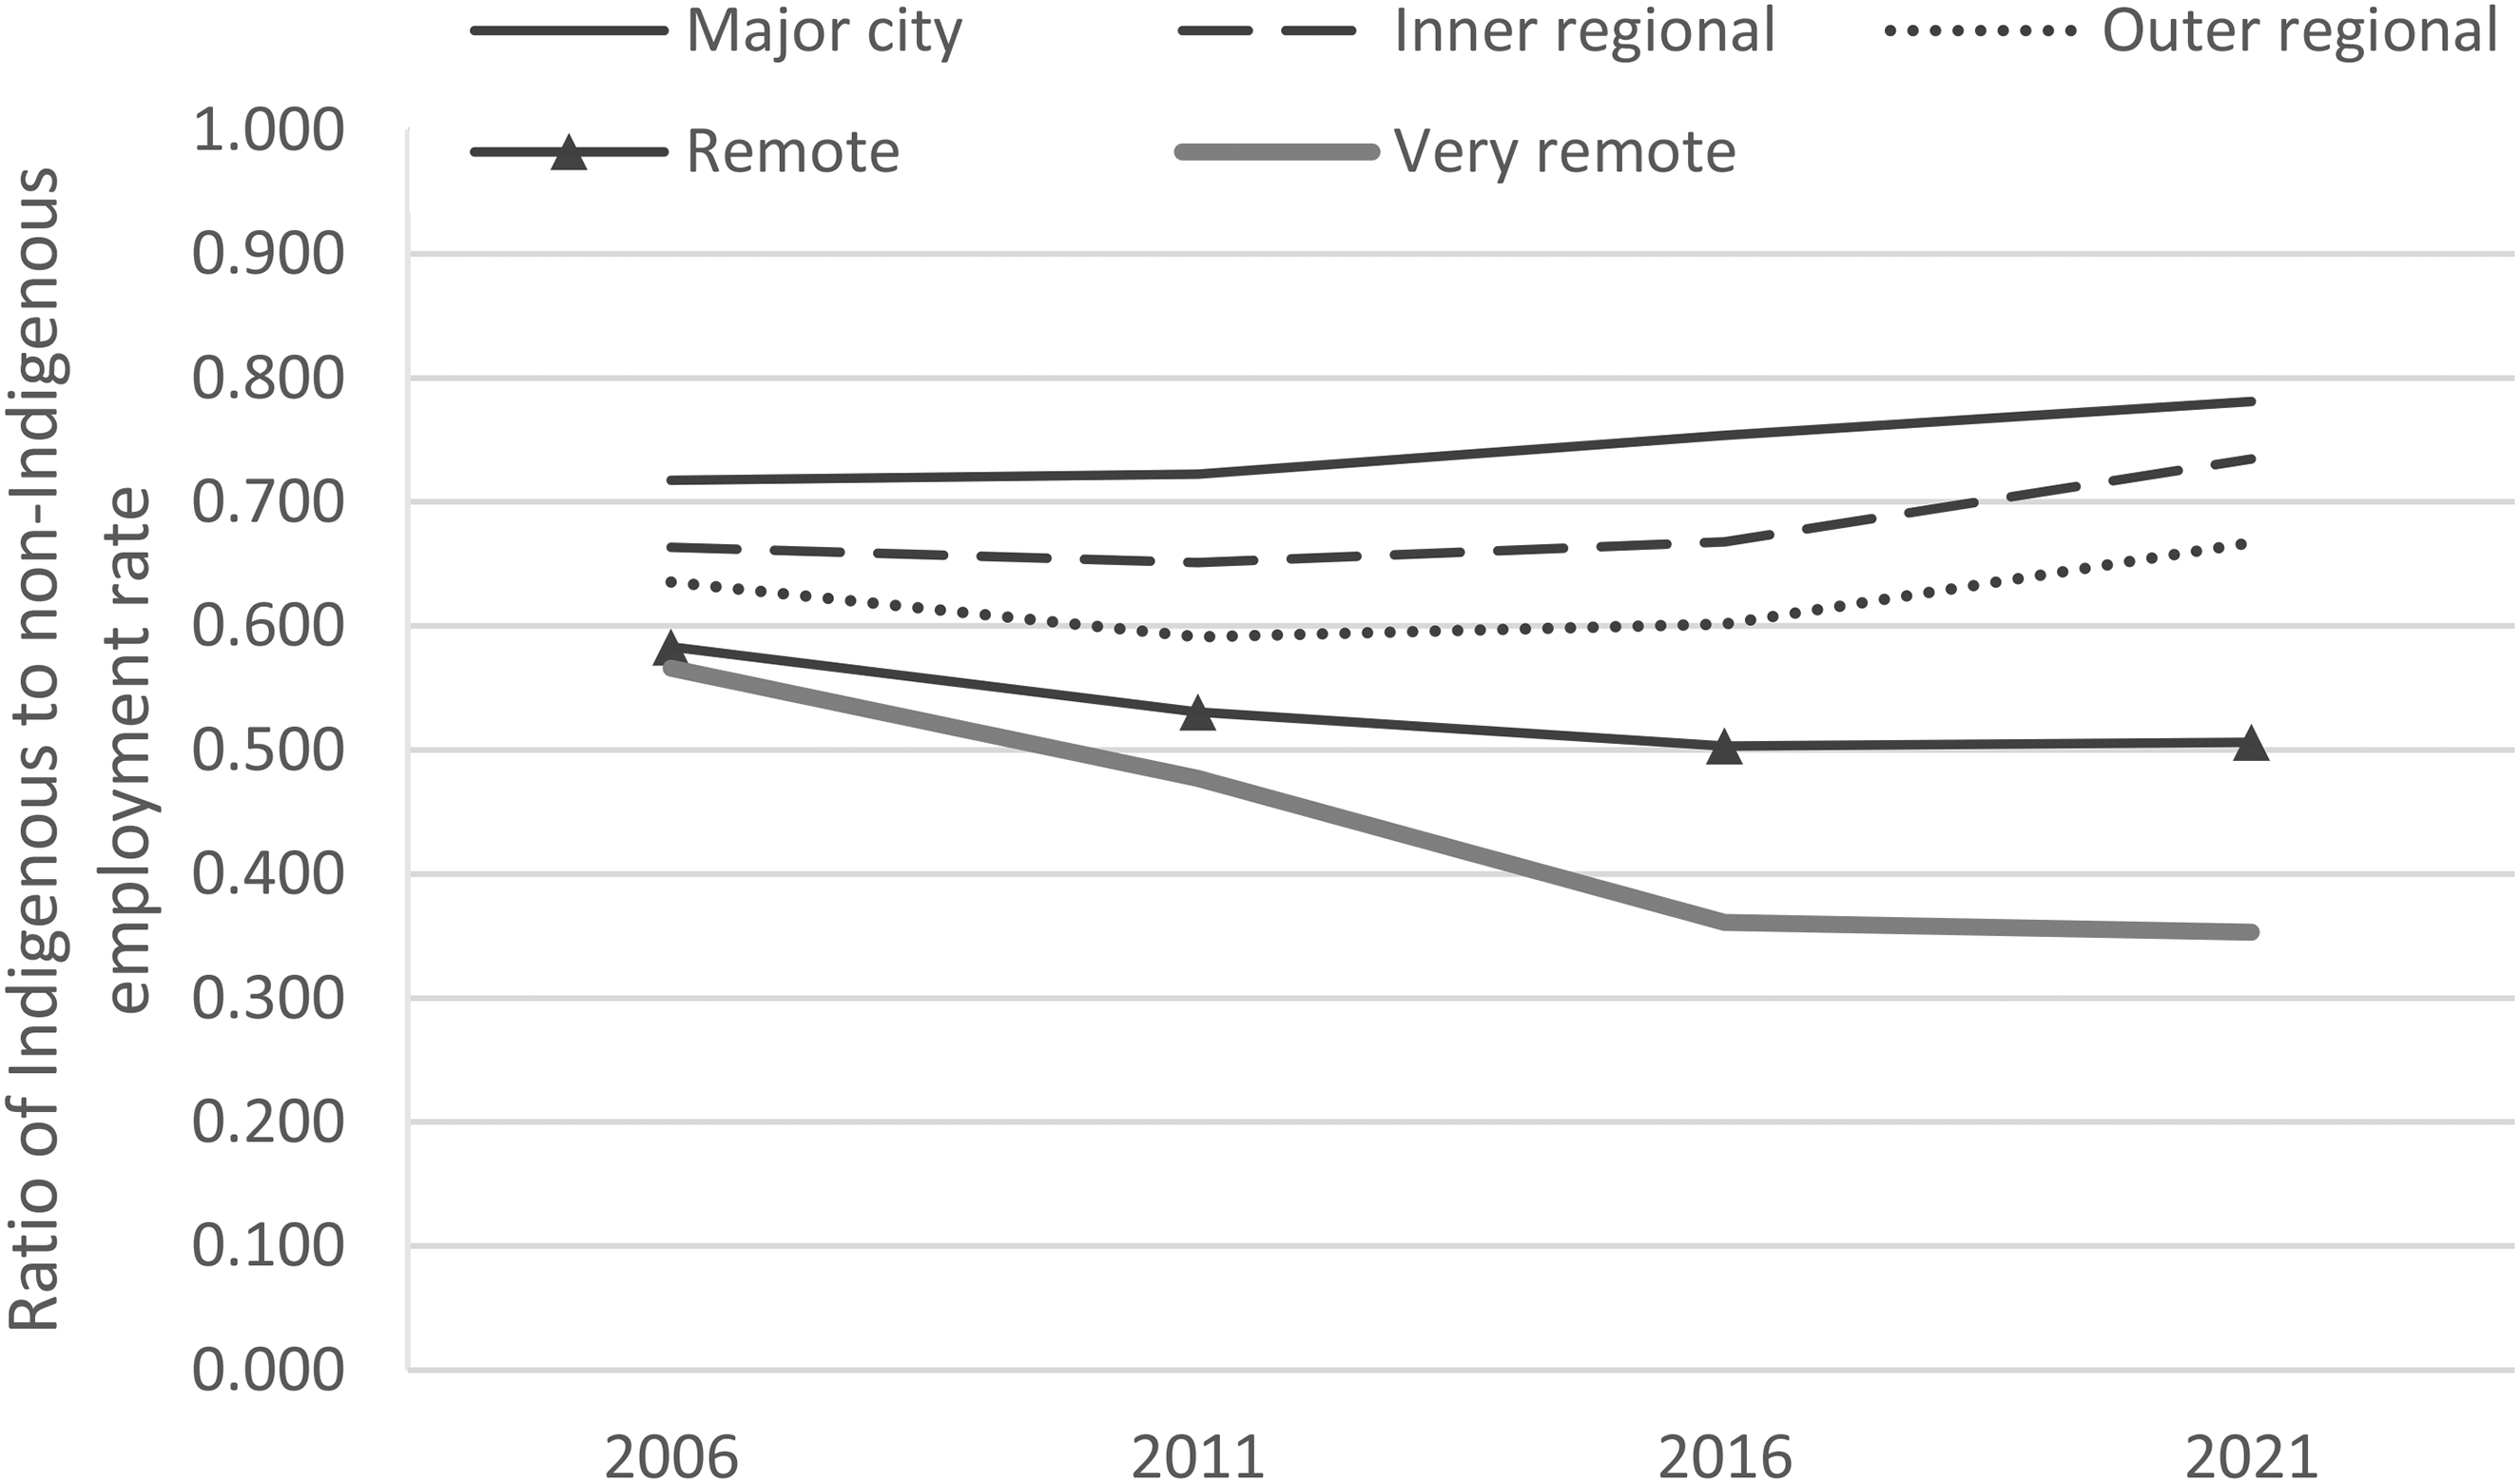
Ratio of indigenous to non-indigenous employment by geographic remoteness, 15–64 years, 2006–2021.
Although Indigenous peoples make up a larger proportion of the population in remote and very remote regions compared to other parts of the country, the majority of Indigenous peoples live in major cities and regional areas. As a result, national-level employment statistics can mask the challenges faced by Indigenous communities in remote regions, where employment gaps remain most pronounced.
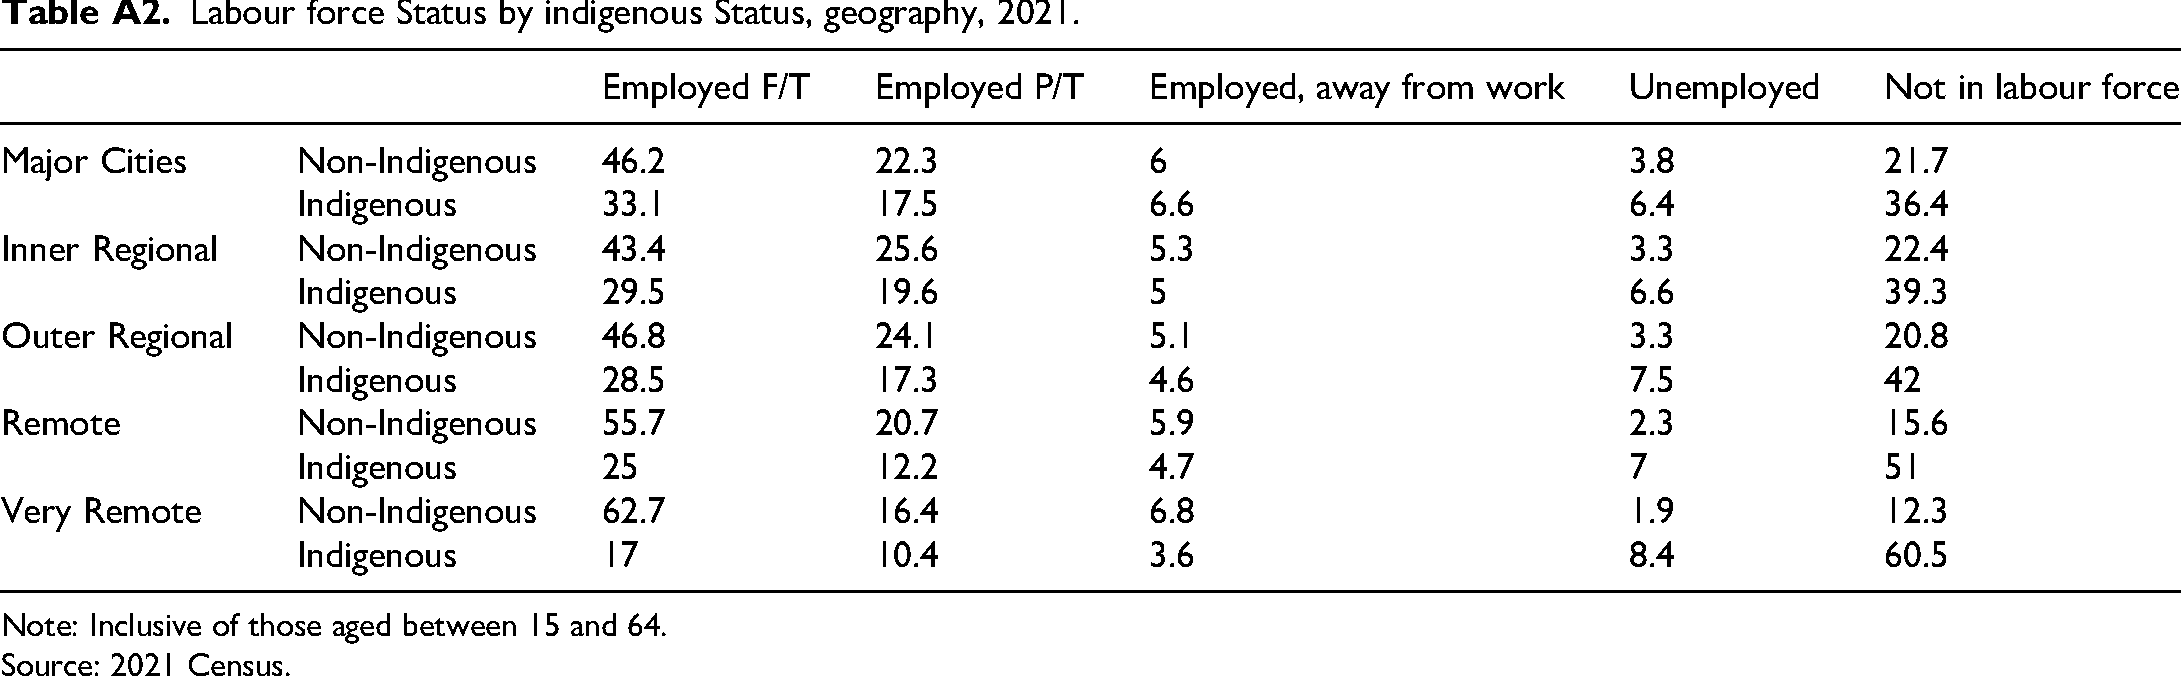
As discussed, the decline in Indigenous employment in remote and very remote areas is likely a direct consequence of the demise of CDEP scheme, which had previously accounted for a substantial amount of employment in these regions. However, the reasons why non-Indigenous employment rates are highest in these areas are more complex. Table A2 shows that the Indigenous unemployment rate — defined as those not employed, but who are looking for work—remains relatively consistent across geographic areas, though slightly higher in remote and very remote areas. However, the proportion of Indigenous peoples not in the labour force (i.e., not employed and not looking for or unable to work) is markedly higher in these areas: 51% in remote and 60.5% in very remote. The reasons for this are nuanced and not fully captured by Census data (see Seet et al., 2018). Several factors may contribute to the high proportion of individuals outside of the labour force. These include differing aspirations to work including informal or cultural labour that is not recognised in formal employment statistics, and limited local labour employment opportunities that mean for many there is little point actively looking for work (Klein and Markham, 2025). Many Indigenous peoples in remote and very remote areas are living On Country and are less likely to relocate for employment due to strong cultural and familial ties to these locations. This contrasts with non-Indigenous populations, who often reside in remote areas specifically for employment purposes. This may help explain the different patterns in employment trends via geographic status between the Indigenous and non-Indigenous populations. These factors, combined with other supply-side constraints—such as lower education levels, poorer health outcomes, and housing stress—highlight that labour market challenges in remote Indigenous communities are not solely demand-driven (e.g., the withdrawal of programs like CDEP).
Discussion
This paper provides long-term estimates of Indigenous employment in Australia from 1981 to 2021. While employment trends for the broader Australian population are well understood, the longer-term trends in Indigenous employment remain less clearly understood due to data limitations and a literature which takes differing approaches. Over the 40-year period, Indigenous employment increased by 15.3% points—nearly double the 8.7% point increase observed among non-Indigenous Australians.
Despite the very large disparity in employment rates in 1981, both the Indigenous and non-Indigenous populations have followed broadly similar patterns of gains and losses across Census years. The overall growth in Indigenous employment has been overwhelmingly driven by increased employment among Indigenous women, whereas employment rates for Indigenous men have remained relatively stagnant. This appears to be closely linked to the substantial increases in post-secondary educational attainment among Indigenous women, which have far outpaced those of Indigenous men. Taken together, these findings suggest that improvements in Indigenous employment are more reflective of broader gendered macroeconomic shifts—such as increased female labour force participation—than factors specific to the Indigenous labour market.
Birth cohort analysis reveals a clear upward trend in employment rates among Indigenous and non-Indigenous women across successive generations. However, this pattern is not mirrored among men. For non-Indigenous men, the lack of growth is less concerning given their high employment rate in 1981, but for Indigenous men it paints a pessimistic picture for the prospects of a rapid increase in employment.
The demise of CDEP resulted in a very big decline in Indigenous employment in very remote areas, and a more moderate decline in remote areas. Although Indigenous employment increased nationally between 2016 and 2021, there is no evidence of corresponding gains in remote and very remote areas. The ceasing of CDEP has exacerbated demand-side labour market constraints in these regions. However, the persistently high proportion of Indigenous people outside the labour force suggests that more needs to be done to address supply-side factors.
While most Indigenous peoples reside in urban and regional areas, the challenges facing remote communities must not be overlooked. There is a need to expand labour market opportunities in remote regions to ensure equitable opportunity for economic development (Klein and Markham, 2025). At the same time, it is important to recognise that the Indigenous labour market in remote areas may always have different levels, patterns and nature of employment which reflects different aspirations and economic constraints.
While there have been significant gains in the overall rate of Indigenous employment over four decades, these improvements are closely tied to broader macroeconomic trends and may not reflect the outcomes envisioned by decades of targeted policy efforts. In 1985, a review of Aboriginal employment and training programs submitted to the Federal Ministers for Employment and Industrial Relations and Aboriginal Affairs found some positive outcomes but concluded that these programs had failed to address the underlying social and structural issues that contributed to adverse Indigenous employment outcomes.
A 2021 review of a suite of Indigenous employment programs by Deloitte, which were developed from recommendations drawn from the Forrest Review of Indigenous employment from 2014 found that although the design of these policies was in-line with successful policy design for disadvantaged jobseekers generally, they did not account for the specific cultural, geographic and historical contexts of the Indigenous population. As a result, their effectiveness was limited. As the analysis in this paper shows, Indigenous employment has increased over the period of 1981–2021. Similarly, across this period there have been substantive gains in the labour market experience of Indigenous peoples such as the extent to which individuals face discrimination in the workplace, earnings, seniority level, and industry representation. However, the volume of research, the extent of the policy focus, and the continuation of similar rhetoric in relation to Indigenous employment across this period speaks to an inertia from policymakers to meaningfully address the underlying causes of adverse Indigenous employment outcomes.
In compiling the data, research, and policy evidence for this analysis, it is worth highlighting that the vast majority of data collection, design, and analysis relating to Indigenous employment has been led by non-Indigenous institutions and researchers. Coupled with criticism of the measurement approach and framework of the National Agreement on Closing the Gap, this has prompted calls for Indigenous-led data collection and analysis aligned with principles of Indigenous data governance. Such an approach could include the reinstatement of a survey like the National Aboriginal and Torres Strait Islander Social Survey (NATSISS), which captured variables of Indigenous-defined relevance and provided more nuanced insights than the Census. While the Census remains the most comprehensive source of longitudinal data on Indigenous employment, it is not without significant limitations. One key issue for interpretation is the potential changing composition of the population over time as different people identify as Indigenous in census collections (Biddle and Markham, 2018). The issue of changing identification as being Indigenous of course effects other surveys in the same way as it affects the Census. This complicates the interpretation of employment trends and progress against policy targets. These changes are complex and require more robust measurement and analysis (Knott, 2022).
Moreover, the Census offers only a narrow depiction of Indigenous identity, relying on statistical markers that fail to capture the full diversity of the experience of Indigenous peoples (Williamson et al., 2021). Although the Census largely consistently reports on variables such as employment, education, and geography, it does not collect data on factors that may be more relevant to Indigenous communities and which impact on labour market participation—such as experiences of labour market discrimination, exposure to trauma, or the change role of Indigenous forms of human capital in the labour market.
As a result, policy responses informed primarily by Census data tend to adopt normative frameworks that reinforce conventional approaches—such as remote employment programs and education-focused interventions—without adequately addressing the structural and cultural dimensions of Indigenous labour market disadvantage (Deloitte, 2021). While these programs have merit, the limitations of the data environment constrain the scope and effectiveness of policy design.
Given the sustained political focus on employment and its strong associations with a range of socio-economic outcomes, the emphasis on Indigenous employment is likely to persist. Without deliberate efforts to improve data collection, analysis, and policymaking—grounded in Indigenous community-level decision-making—this focus risks remaining rhetorical rather than transformative.
Footnotes
Funding
The authors received no financial support for the research, authorship, and/or publication of this article.
Declaration of conflicting interests
The authors declared no potential conflicts of interest with respect to the research, authorship, and/or publication of this article.
Notes
Author biographies
![]()
![]()
![]()
![]()
Appendix
Labour force Status by indigenous Status, geography, 2021.
| Employed F/T | Employed P/T | Employed, away from work | Unemployed | Not in labour force | ||
|---|---|---|---|---|---|---|
| Major Cities | Non-Indigenous | 46.2 | 22.3 | 6 | 3.8 | 21.7 |
| Indigenous | 33.1 | 17.5 | 6.6 | 6.4 | 36.4 | |
| Inner Regional | Non-Indigenous | 43.4 | 25.6 | 5.3 | 3.3 | 22.4 |
| Indigenous | 29.5 | 19.6 | 5 | 6.6 | 39.3 | |
| Outer Regional | Non-Indigenous | 46.8 | 24.1 | 5.1 | 3.3 | 20.8 |
| Indigenous | 28.5 | 17.3 | 4.6 | 7.5 | 42 | |
| Remote | Non-Indigenous | 55.7 | 20.7 | 5.9 | 2.3 | 15.6 |
| Indigenous | 25 | 12.2 | 4.7 | 7 | 51 | |
| Very Remote | Non-Indigenous | 62.7 | 16.4 | 6.8 | 1.9 | 12.3 |
| Indigenous | 17 | 10.4 | 3.6 | 8.4 | 60.5 |
Note: Inclusive of those aged between 15 and 64.
Source: 2021 Census.