
Abstract
Secretory processes and their regulation have been extensively studied in mammalian salivary parotid glands. However, little is known regarding the secretory mechanism in the venom glands of snakes, which invariably produce one of the most complex of all animal secretions. The pharmacologically important and toxic components of the Malayan spitting cobra (Naja naja sputatrix) venom include postsynaptic neurotoxins (NTX), presynaptic neurotoxins (phospholipase A2, PLA2), and cardiotoxins (CTX) which, for convenience, have been collectively referred to as “toxins.” We report here for the first time the mechanism of toxin gene expression by studying the accumulated mRNA level and protein synthesis rates for the three toxins over a period of 8 days after stimulation of venom synthesis by manual “milking” of the venom gland. Immunofluorescence and in situ hybridization were used to localize the toxins and their mRNAs in venom gland sections. The rate of protein synthesis, as determined by immunofluorescence and liquid chromatography-mass spectrometry (LC-MS) techniques, increased in parallel with the increase in the toxin mRNA content in the secretory epithelial cells, suggesting that transcriptional regulation of the toxin genes is involved.
V
More than 30 different enzymes have been identified in snake venoms, although a single species usually possesses between seven and ten different enzymes. In general, enzymes appear to play an important role in the lethal action of venom from the Viperidae and Crotalidae families of snakes. However, the nonenzymatic proteins or polypeptide toxins dominate the lethal action of venom from the Elapidae snake family (Iwanga and Suzuki 1979). The elapids include some of the world's most dangerous snakes, such as the mambas, kraits, coral snakes, and cobras (Phelps 1989). In Asia, kraits (genus Bungarus) and cobras (genus Naja) are the most abundant and widely distributed of the elapids (Habermehl 1981). The genus Naja embraces six species, five of which occur in Africa and only one of which (Naja naja) is found in Asia (Phelps 1989). The Naja naja species can be further divided into ten distinct subspecies. Among them, only Naja naja sputatrix has the unique capability of spitting its venom.
Naja naja sputatrix, the Malayan spitting cobra, is found in peninsular Malaysia, Singapore and Java, Bali, Lombok, Flores, Komodo, and Celebes islands of Indonesia (Phelps 1989). The envenomation of N. n. sputatrix is manifested by local necrosis characteristic of myoneural curare-like (neurotoxic) and cardiovascular effects (Reid 1968; Viravan et al. 1986).
The intravenous LD50 for N. n. sputatrix is 0.8 μg/kg and the major biochemical constituents of the venom include high molecular weight proteins and enzymes, such as phospholipase A2 (PLA2) enzymes, and also low molecular weight polypeptide toxins, such as postsynaptic neurotoxins (NTX) and polypeptide cardiotoxins (CTX) (Tan 1991). The pharmacologically important toxic components of N. n. sputatrix venom include NTX, PLA2, and CTX (Tan 1991) which, for convenience we have collectively referred to as “toxins.” Neurotoxins are the main lethal fraction of the venom. They block neuromuscular transmission, resulting in death from respiratory failure (Yang 1994). The enzyme PLA2 (EC 3.1.1.4) specifically catalyzes the hydrolysis of the acyl-ester bond at the sn-2 position of 1,2-diacyl-3-sn phosphoglycerids in a calcium-dependent reaction. Cardiotoxins, which account for 60% of the venom dry weight, have very potent effects on cardiac muscle (Sarkar 1947) and skeletal muscle (Meldrum 1965; Lee et al. 1968). Apart from these actions on muscle, CTXs also show diverse pharmacological effects, such as lysis of lymphocytes (Braganca et al. 1967) and red blood cells (Condrea 1974; Harvey et al. 1983), activation of tissue phospholipase C (PLC) activity (Fletcher et al. 1991), cytotoxic activity on all types of excitable and nonexcitable cells (Harvey 1985), and necrosis of skeletal muscle cells (Ownby et al. 1993). The local necrosis, which is prevalent in N. n. sputatrix envenomation, may be due to the synergistic action of the CTXs and venom PLA2 enzymes.
In this investigation, N. n. sputatrix is used as a model to study the mechanism of gene expression and biosynthesis of toxins in the venom glands of cobras. Although some histochemical studies on venom glands had been previously reported (Ben-Shaul et al. 1971; Fein et al. 1971; Oron and Bdolah 1978), they were all carried out on viper glands but without demonstrating the mechanism by which these snake venom proteins were expressed or regulated. Recently, Ogawa et al. (1995) reported the localization and expression of PLA2 in the venom glands of the Habu snake (Trimeresurus flavoviridis). However, the study did not look at the pattern of gene expression after venom synthesis was stimulated.
In this study we investigated the mechanism of toxin gene expression by looking at the mRNA turnover and protein synthesis rate in situ over a period of 8 days after initiation of venom synthesis. To the best of our knowledge, this is the first report on a comprehensive study of the pattern of toxin gene expression in vivo using immunofluorescence and in situ hybridization to localize all three major cobra toxins and their message. Liquid chromatography-mass spectrometry (LC-MS) was also used to correlate the venom protein profile with the gene expression pattern of the venom gland.
Materials and Methods
Venom Gland Sections
Spitting cobras (Naja naja sputatrix) were obtained from the Singapore Zoological Gardens and were identified on the basis of their anatomic features. Each snake was milked (manual venom extraction) by trained personnel and placed in a canvas bag. Anesthesia (pentobarbital sodium; Boehringer Ingelheim, Artarmon, New South Wales, Australia) was injected IM through the canvas bag to prevent spitted venom aerosol from causing eye injury. Once anesthesia had taken effect, the snake was sacrificed by decapitation and both venom glands were dissected out immediately. One of the glands was frozen in liquid nitrogen and stored at −70C and the other was fixed overnight in 4% (w/v) paraformaldehyde in 0.1 M phosphate buffer, pH 7.4, at 4C. Fixation was followed by dehydration and embedding in paraffin. The paraffin-embedded venom gland blocks were sectioned at 7 μm thickness and then fixed onto microscope slides coated with 3-aminopropyltriethoxysilane (Sigma Chemical; St Louis, MO).
Hybridization Probes
These were prepared by sub-cloning cDNA inserts for CTX (Yeo et al. 1993; Jeyaseelan et al. 1998), PLA2 (Armugam et al. 1997), and NTX (Jeyaseelan et al. GenBank Accession No. L42002) into an RNA expression vector, pBSk+ plasmid (Stratagene; La Jolla, CA), according to a standard procedure (Sambrook et al. 1989). The presence of the inserts was confirmed by automated DNA sequencing. The plasmids were linearized with appropriate restriction enzymes to allow in vitro run-off synthesis of both sense- and anti-sense-oriented RNA probes (Valentino et al. 1987) labeled with digoxigenin (DIG)-conjugated UTP (Boehringer Mannheim; Mannheim, Germany).
In Situ Hybridization
In situ hybridization was carried out as previously described (Nomura et al. 1988; Ogawa et al. 1995; Komminoth 1996) with the following modifications. The DIG-labeled probes were used at a concentration of 0.5 μg/ml and were denatured at 80C before addition to the hybridization solution (50% formamide, 10% dextran sulfate, 10 mM Tris-HCl, pH 7.6, 1 mM EDTA, 1 x Denhardt's solution, 600 mM NaCl, 0.25% SDS, 100 μg/ml sheared herring sperm DNA, and 200 μg/ml tRNA). Hybridization was carried out at 50C overnight in a humidified chamber.
After the overnight incubation, the slides were washed with 5 x SSC, followed by 50% formamide in 2 x SSC at room temperature (RT) and two washes at 50C using 0.2 x SSC for 10 min each. Slides were blocked with blocking solution [1% blocking powder (Boehringer Mannheim)] in Buffer 1 (0.1 M malic acid and 0.15 M NaCl). Sheep anti-DIG (Fab fragments) conjugated to alkaline phosphatase (Boehringer Mannheim) diluted 1:500 in blocking solution was applied to the sections and incubated for 2 hr at RT. At the end of the incubation period, the sections were washed twice with washing buffer (0.3% Tween 20 in Buffer 1) for 10 min on a shaking platform. The sections were later incubated with Buffer 3 (100 mM Tris-HCl, 100 mM NaCl, and 50 mM MgCl2) for 10 min. Excess Buffer 3 was blotted off and sections were covered with 200 μl color substrate solution [10 μl NBT/BCIP color substrate stock solution (Boehringer Mannheim) in 1 ml Buffer 3] and incubated in a moist chamber at RT until optimal color development. The reaction was stopped by washing with Buffer 4 (10 mM Tris-HCl and 1 mM EDTA). The sections were later washed twice with water and mounted with aqueous mounting medium (Aqua-mount; BDH, Poole, UK) and left to dry in a cool dark place.
Quantitation of the relative signal strength/density of the in situ hybridization results was carried out using the KS 400 Version 2 imaging systems (Carl Zeiss; Oberkochen, Germany) by random selection of the stained areas in the venom gland sections. Results were expressed as the means ± SD of 30 such readings.
Immunofluorescence and Confocal Laser Scanning Microscopy
Paraffin-embedded tissue sections on glass slides were de-waxed with xylene and hydrated. The sections were later permeabilized with 0.1% trypsin in PBS at 37C for 10 min followed by overnight incubation at 4C with rabbit polyclonal anti-toxin antibodies (either anti-CTX, anti-PLA2, or anti-NTX), which were a gift from Professor N.H. Tan (University of Malaya, Kuala Lumpur, Malaysia) at a concentration of 1 μg/ml (in 0.1% BSA-PBS). For immunofluorescence detection, the sections were incubated with fluorescence (FITC; fluorescein isothiocyanate or Texas Red)-conjugated goat anti-rabbit antibodies (5 μg/ml in 2% normal goat serum-PBS). The sections were later washed and mounted with Vectashield (Vector Laboratories; Burlingame, CA) and confocal images collected using an LSM 410 laser scanning confocal microscope (Zeiss). The corresponding images were digitally processed with Photoshop 4.0 (Adobe Systems; Mountain View, CA).
Venom Protein Profile from LC-MS
The protein content of crude venom collected manually from individual snakes before decapitation was determined by the Bio-Rad microassay procedure (Bio-Rad; Hercules, CA). Venom samples (10 μg protein) were chromatographed on a reverse-phase C18 column (Phenomenex Jupiter 5 μm 300A) connected to a mass spectrometer (ABI 300; LC-MS/MS System, Foster City, CA). The venom proteins were fractionated using 0.1% TFA [trifluoro acetic acid (Buffer A) and 80% acetonitrile in 0.1% TFA (Buffer B)] following 0–20%, 20–80%, and 80–100% Buffer B step gradients for 10, 70, and 10 min, respectively. The molecular masses of the fractionated proteins were analyzed concurrently by ion-spray mass spectrometry. The identity of each protein peak was established on the basis of its molecular mass and was confirmed by comparing it with the amino acid sequence data obtained by purification of the individual components of the venom (Armugam et al. 1997; Jeyaseelan et al. 1998).
Results
Morphology of the Venom Gland Secretory Cells
The histology of the venom glands was studied by Masson's trichrome staining. The venom glands of N. n. sputatrix conform to the elapid venom gland pattern, which is divided into the main venom gland and the less prominent accessory glands (Kochva et al. 1982; Gopalakrishnakone et al. 1994). The structure of the main venom gland combines the features found in the tubuloacinar gland structure of the pancreas and of the venom glands of the viperids. The main venom gland comprises many tubules converging towards the center of the gland and leading through ducts passing the accessory glands in the anterior (Figure 1A). These tubules consist of a single layer of secretory epithelium and are surrounded by loosely packed connective tissues (Figure 1B). The secretory epithelium, which produces the various venom components, is generally represented by tall columnar cells, each with a basal nucleus and refractile globules near the apex (luminal border) of the cell (Figure 1C). The accessory glands are composed primarily of mucous cells, the secretion of which joins the product of the main venom gland in the region of the gland ducts.
Localization of Toxin mRNAs in the Venom Gland
Snakes were milked to stimulate venom production and venom glands from individual snakes were removed 2, 4, 24, 48, 96, or 192 hr after milking (referred to as 2-hr, 4-hr, and Days 1, 2, 4, and 8 venom glands). Venom glands from snakes that had not been fed or milked over a period of 14 days or more were used as unstimulated controls. Thin sections were prepared from these venom glands as described in Materials and Methods and were used for all subsequent experiments.
In situ hybridization was performed to localize the mRNAs of CTX, PLA2, and NTX in the venom gland sections. Hybridization with an anti-sense digoxigenin-labeled complementary RNA probe (DIG-cRNA) for the toxins showed that the transcripts for the toxin mRNAs were confined to the epithelial cells of the venom gland (Figure 1D). An intense positive signal was observed throughout the cytoplasm of almost all the venom gland secretory epithelial cells. This suggests the simultaneous expression of toxin mRNAs specifically in the secretory epithelial cells. No signal was observed in other types of cells of the venom gland.
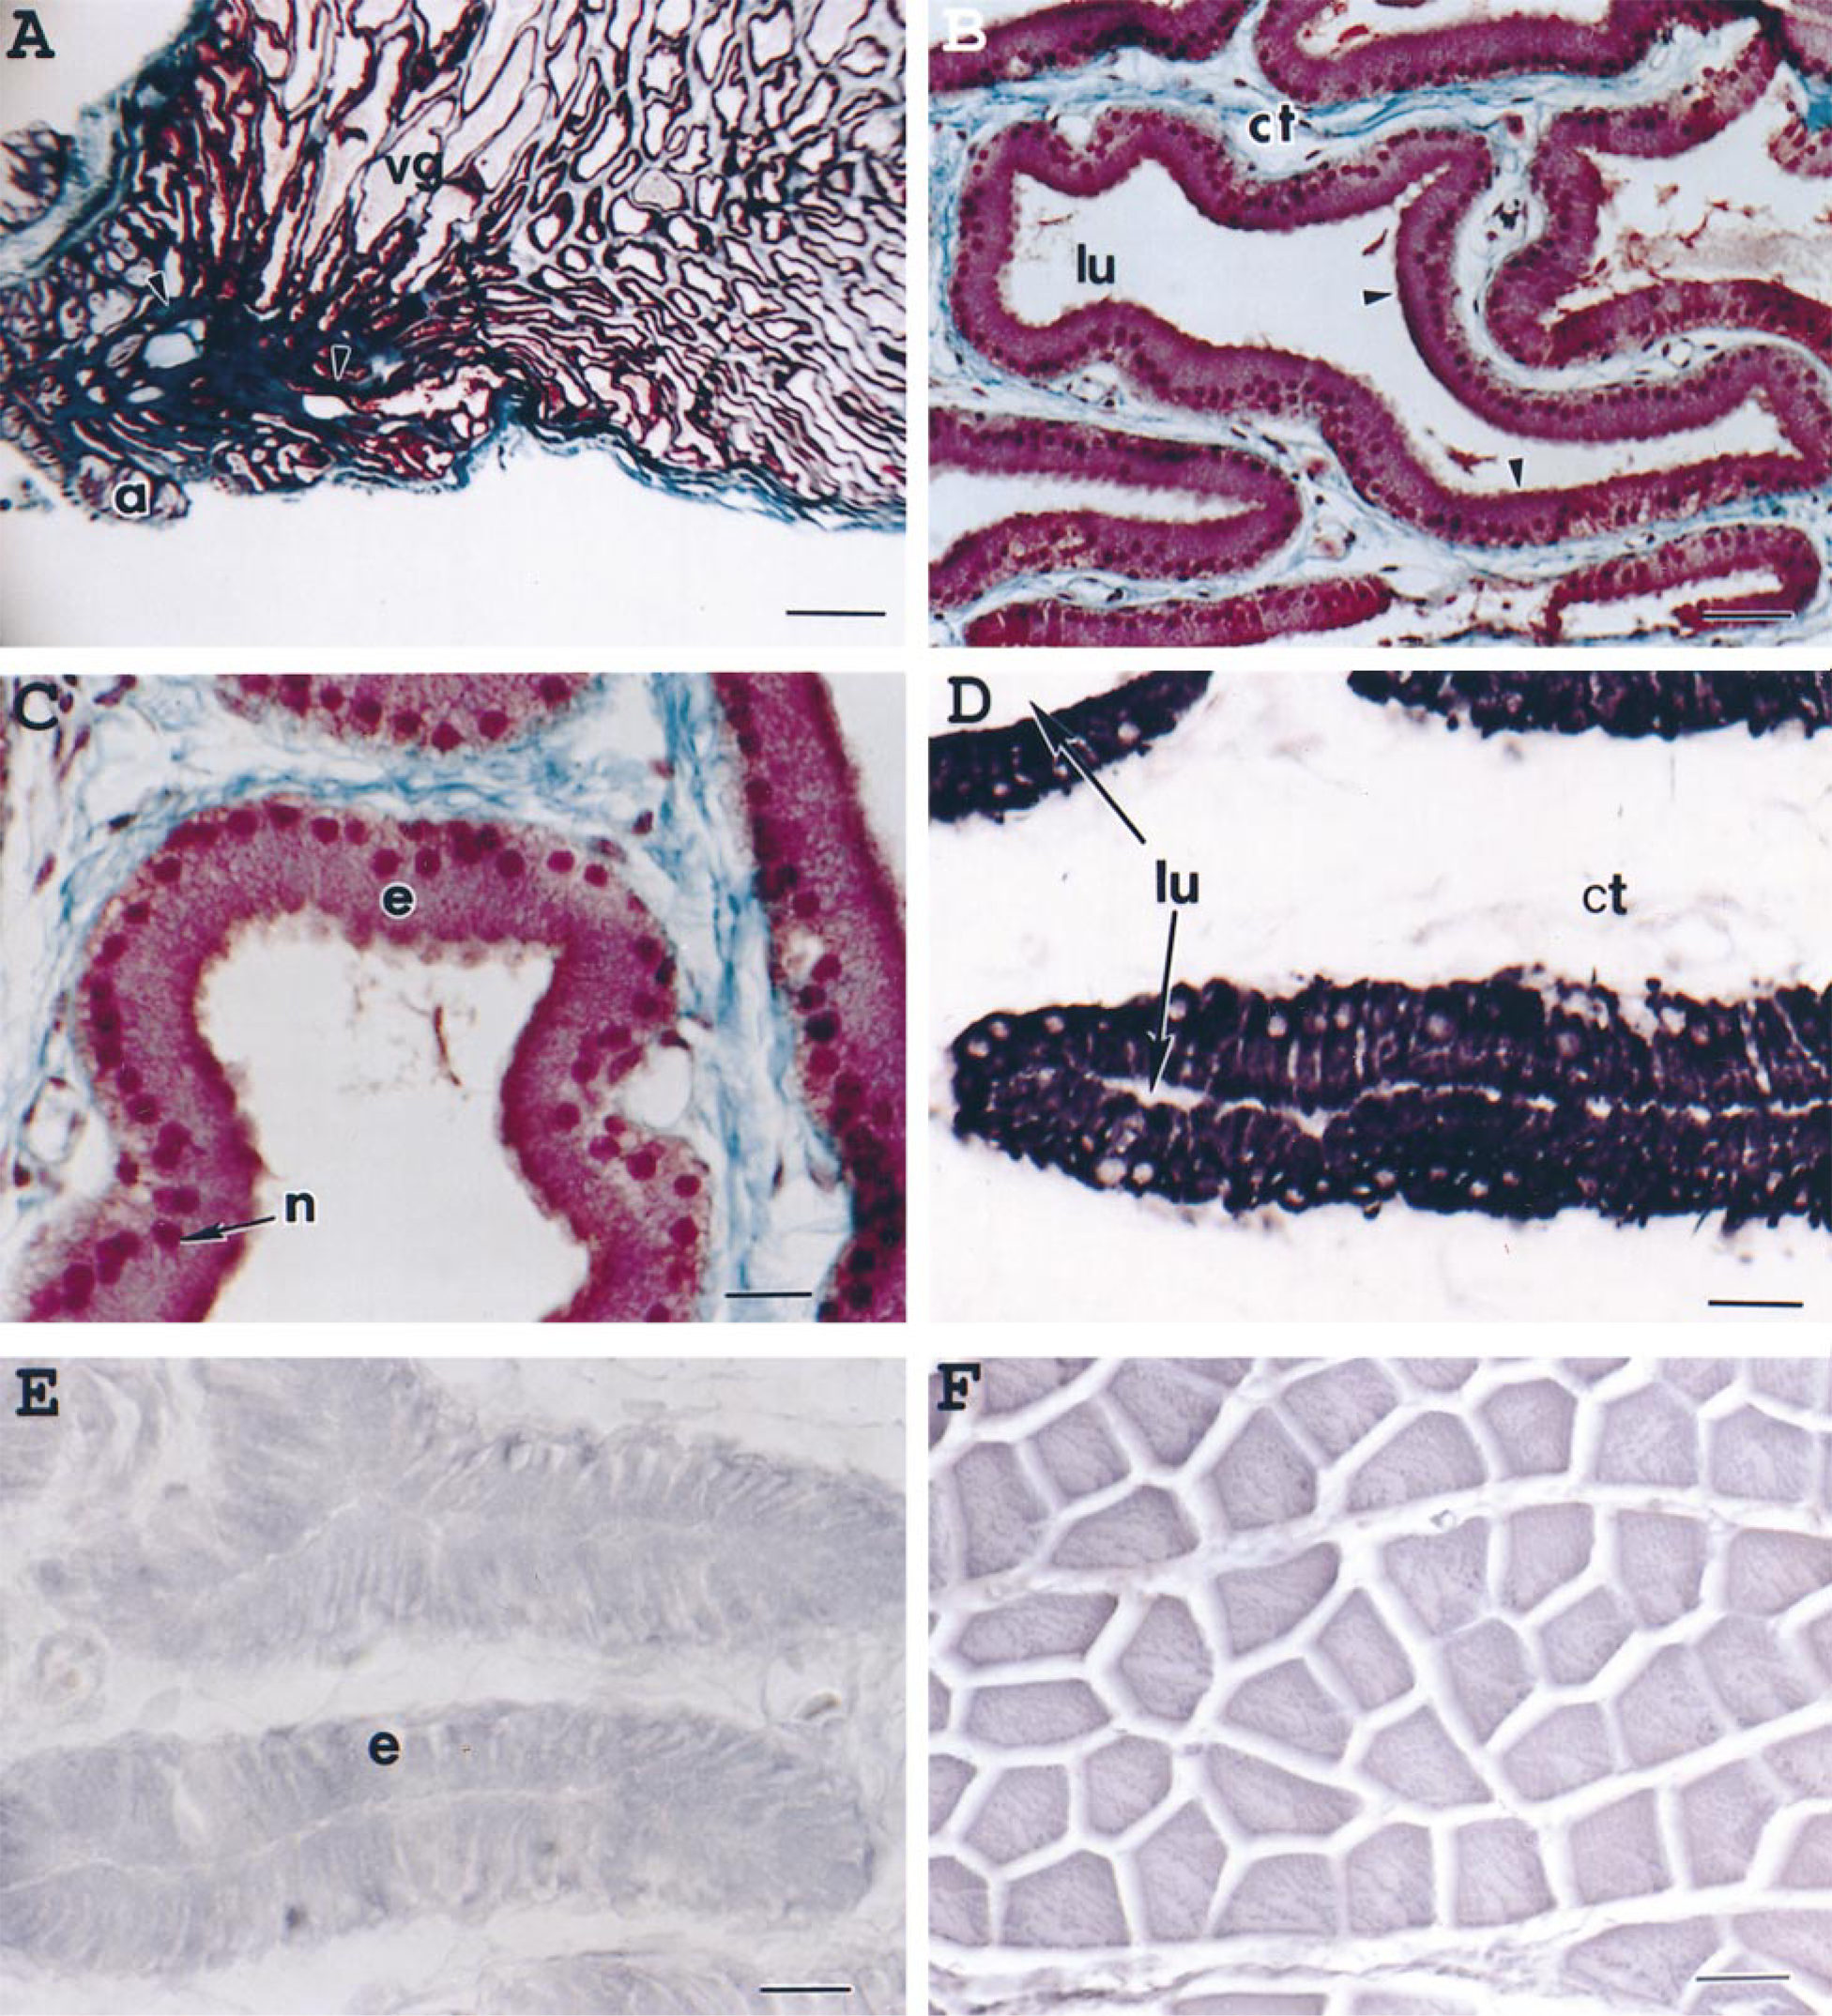
Structure and in situ hybridization of spitting cobra main venom gland. (A) Low-power view showing accessory glands (a), venom ducts (arrowheads), and main venom gland (vg) of spitting cobra. Masson's trichrome staining. Bar = 1000 μm. (B) Longitudinal section of the venom gland showing many secretory tubules lined by epithelial cells (arrowheads) with empty lumen (lu) surrounded by connective tissues (ct). Masson's trichrome staining. Bar = 50 μm. (C) High-power light micrograph of a longitudinal section, showing secretory epithelium (e) that is composed of tall columnar cells with prominent basal nuclei (n). Masson's trichrome staining. Bar = 20 μm. (D) In situ hybridization using anti-sense DIG-cRNA probe against cardiotoxin transcripts, showing strong positive signals within the cytoplasm of the secretory epithelial cells (e). Note the absence of staining in the lumina (lu) of the secretory tubules and also in the surrounding connective tissues (ct). Bar = 20 μm (E) In situ hybridization using the sense DIG-cRNA probe (negative control), showing absence of staining for CTX transcripts in the secretory epithelial cells (e). Bar = 20 μm. (F) In situ hybridization using anti-sense DIG-cRNA probe for toxins on the snake compressor glandulae muscle sections, showing absence of positive signal for CTX mRNAs. Bar = 50 μm.
The specificity of this detection system was shown by the lack of positive signals through (a) hybridization with sense (mRNA) probe (Figure 1E), (b) hybridization with anti-sense probe on snake compressor glandulae muscle sections (Figure 1F), (c) ribonuclease A treatment (20 mg/ml) of the venom gland sections before hybridization, and (d) washing with solution of low ionic strength (H2O) after hybridization (not shown).
Hybridization with anti-sense RNA probes for CTX, PLA2, and NTX mRNAs on sections from the control (unmilked) group showed low signal intensity (not shown) for all three toxins. Although the signal was not as intense as in the milked group, the presence of the signal indicates that toxin mRNAs were also present in the so-called “resting” secretory epithelial cells of the unmilked snakes.
Synthesis of the toxin mRNAs at 4 hr after milking the venom is represented in sections hybridized with the appropriate anti-sense cRNA probes (Figures 2A-2C). The increase in positive signal intensity for the toxins' transcripts follows a trend in which it gradually increases with time after milking of the venom. The changes in the amount of mRNAs for the three toxins before and after milking were also quantified by measuring the density of the DIG-alkaline phosphatase-catalyzed NBT-BCIP staining on the venom gland sections during in situ hybridization (Figure 3). The increase in signal intensity reflects the increase in the rate of toxin mRNA synthesis immediately after milking of the snake. The signal for CTX increases rapidly from 0 to 24 hr, in contrast to the mRNAs for both PLA2 and NTX, which showed a gradual increase. The elevated mRNA content was sustained for all three toxins from about 48 hr up to 192 hr after milking.
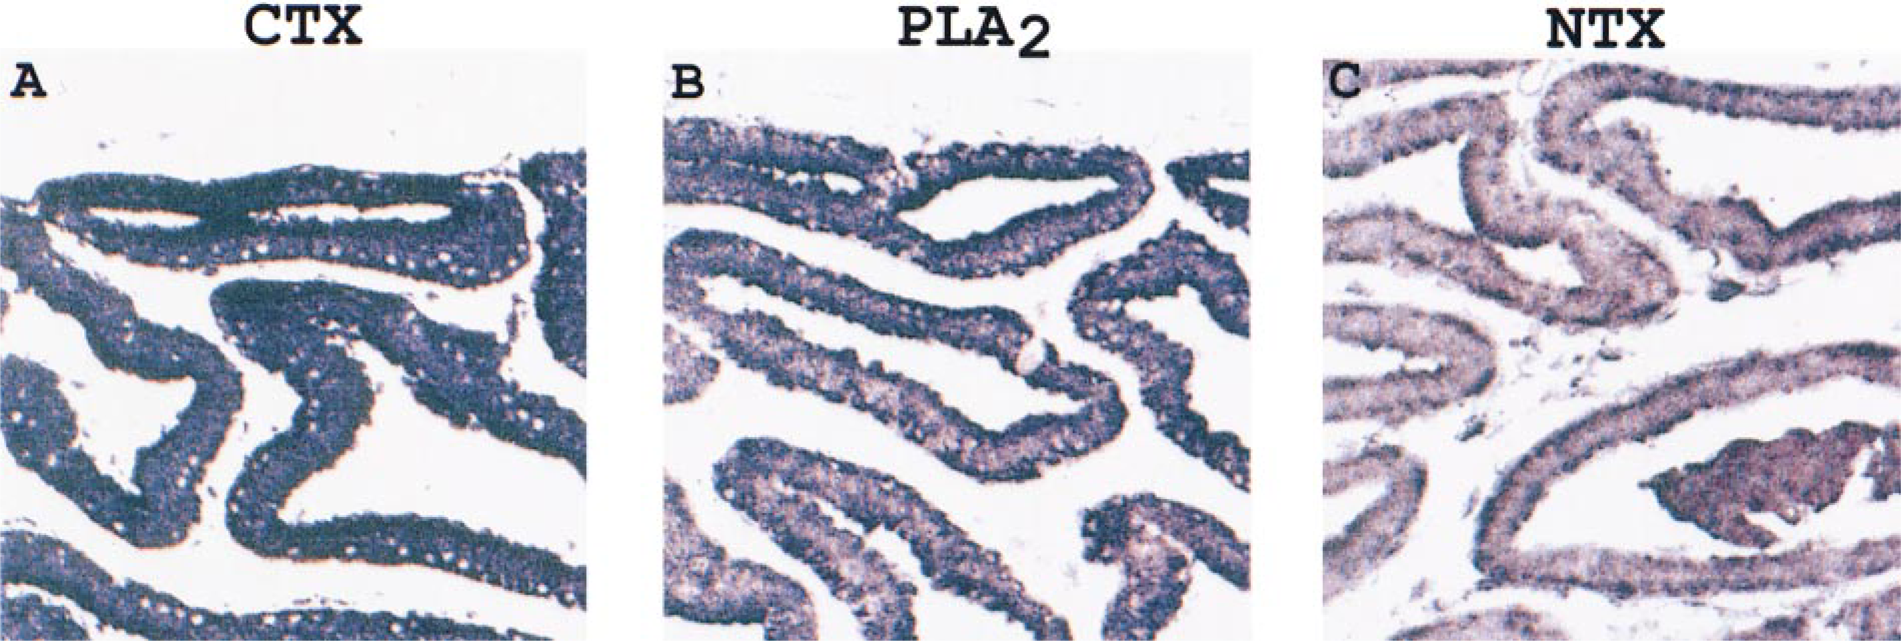
In situ hybridization for detection of CTX, PLA2, and NTX mRNAs in venom gland sections obtained 4 h after milking the venom.
The mRNA biosynthesis pattern for CTX, PLA2, and NTX in the venom glands appears to be identical, with the same secretory epithelial cells showing positive staining for all three toxin mRNAs, although their intensities varied.
Toxin Synthesis in Resting and Active Glands
Polyclonal antibodies to CTXs, PLA2, and NTXs raised in rabbit were used to localize these toxins in the venom gland sections. Fluorescence-tagged goat anti-rabbit IgGs were used as secondary antibodies. Visualization was carried out with an LSM 410 laser scanning confocal microscope (Zeiss).
The progress of NTX synthesis in the venom gland from unmilked snakes to those sacrificed after 2 hr to 8 days after milking is presented in Figure 4. The sections from the unmilked snakes show intense fluorescence in the lumen. In contrast, the secretory epithelial cells lining the lumen are almost devoid of fluorescence (Figure 4A).
Sections obtained from milked snakes, ranging from 2 hr to 8 days after milking, showed a gradual increase of fluorescence in the secretory epithelial cells (Figures 4B-4F). The fluorescence in the secretory epithelial cells increased from 2 hr to 2 days after milking, and there was a corresponding increase of fluorescence in the tubular lumina from 1 day to 8 days after milking. The fluorescence in the tubular lumina was, in fact, very intense on sections from 8 days after milking (Figure 4G). However, the secretory epithelial cells showed a decrease in fluorescence from 4 days after milking (Figure 4F) to minimal fluorescence on sections from Day 8 (Figure 4G). Controls included (a) snake compressor glandulae muscle (Figure 4H) and snake pancreas (Figure 4I) probed with NTX antibodies, and also (b) venom gland sections probed with normal rabbit serum instead of rabbit anti-NTX antibodies (not shown), which gave only background fluorescence.
The relative rate and amount of a particular toxin's synthesis were assessed by comparing the intensity and area of fluorescence for the toxin.
Immunofluorescent probing was carried out for cardiotoxins, phospholipase A2, and neurotoxins independently.
Venom Protein Profile from LC-MS
The venom proteins' profile was obtained by using reverse-phase liquid chromatography coupled to mass spectrometry (LC-MS) to separate and identify the protein constituents of the venom. Venom obtained from snakes sacrificed 1, 4, or 8 days after milking, and from the control (unstimulated) snakes, was analyzed and the protein profiles obtained (Figure 5). No appreciable amount of venom was recovered from snakes sacrificed 2 or 4 hr after milking. This indicates that venom extraction by milking entirely depletes the venom gland and that venom accumulation takes longer than 4 hr. However, by 24 hr after milking, quite a substantial amount of venom accumulation had taken place, albeit at a lower concentration (11.3 μg/μl) compared to venom from snakes sacrificed 4 or 8 days after milking (31.4 μg/μl and 32.7 μg/μl, respectively). The concentration of venom proteins stabilized in about 4 days and was found to be similar to that of the control venom (36.3 μg/μl) and the sample obtained after 8 days (32.7 μg/μl).
The venom protein profiles obtained by LC-MS from Day 1 to Day 8 show the relative increase in the peak heights and areas (peak sizes) for CTX, PLA2, and NTX. The peak sizes are largest for CTX, followed by PLA2, and the least for NTX. The relative ratio (13:3:1) of the three toxins' concentrations is also maintained from Day 1 to Day 8, with CTX always being the most abundant, followed by PLA2 and NTX.
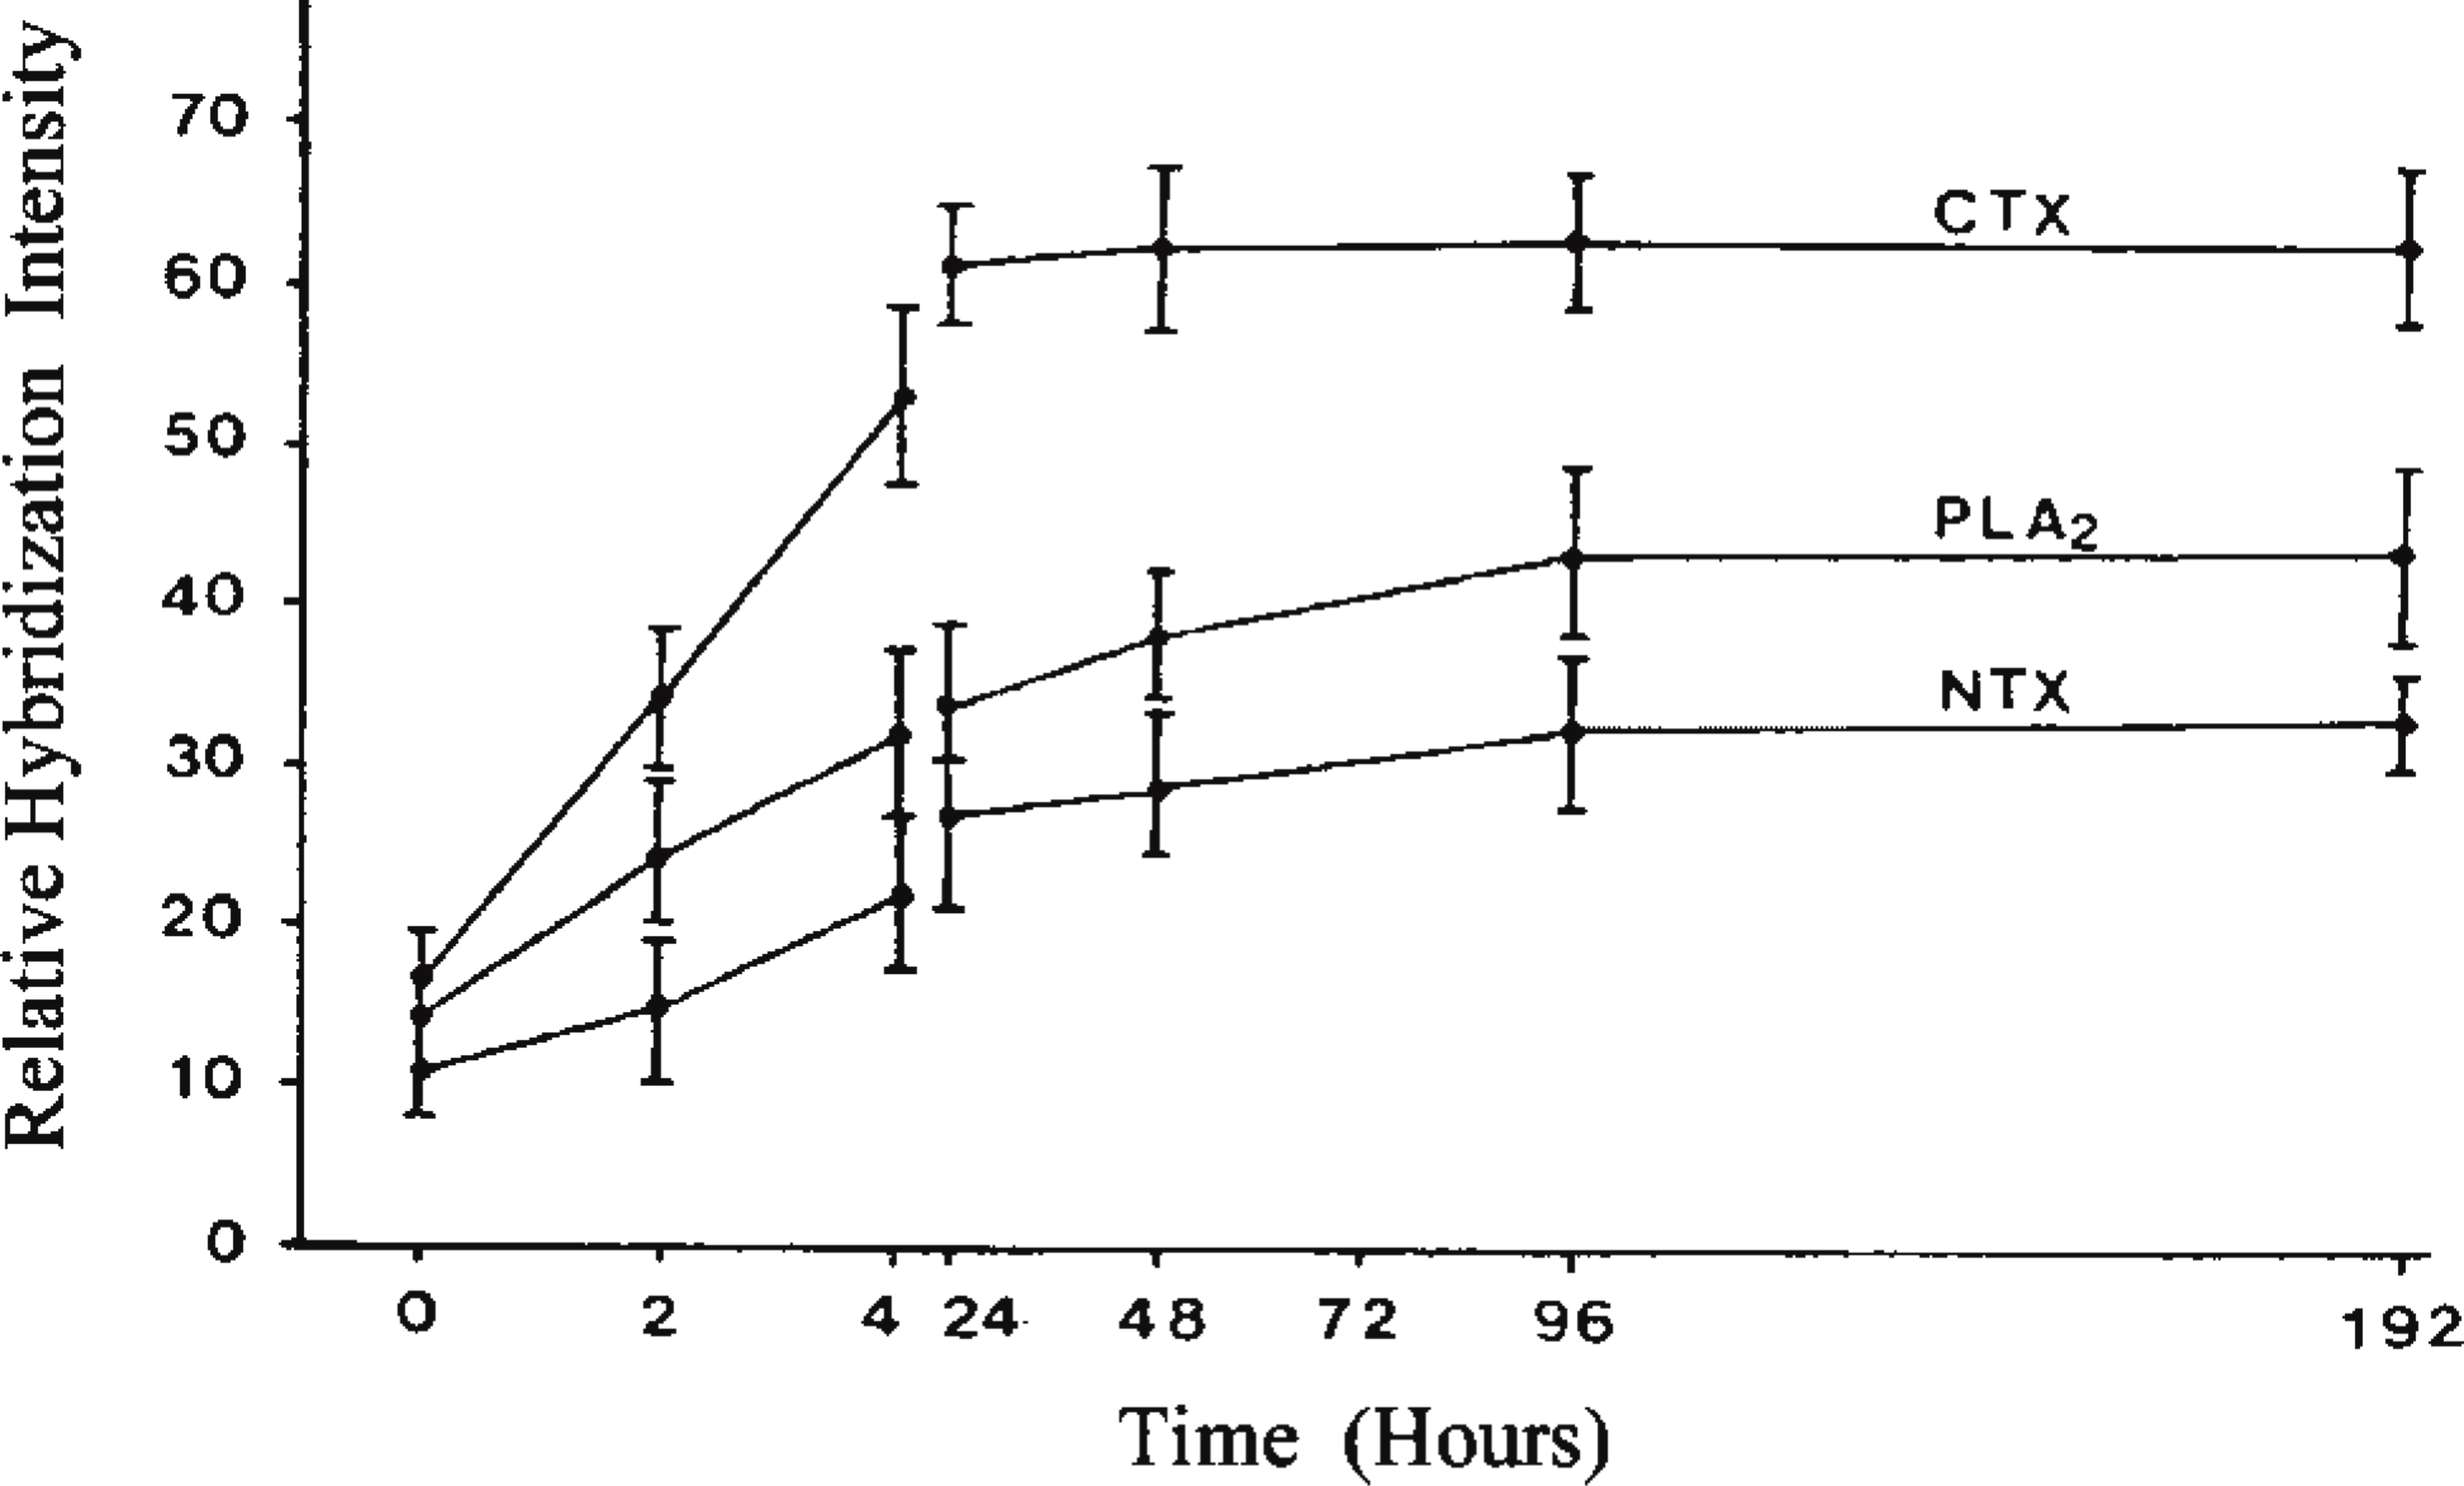
In situ hybridization staining intensities for CTX, PLA2, and NTX mRNAs on venom gland sections obtained from unmilked snakes (0 hr) and milked snakes sacrificed over a period of 8 days. Horizontal bars represent the standard deviation (n = 30). The relative values of the staining were quantified as described in Materials and Methods.
Discussion
Light microscopic studies on the morphology of the venom glands of N. n. sputatrix reveal that the tubular lumina are lined with tightly arrayed columnar epithelial cells, with each cell possessing a basal nucleus. This compact structural feature could be important in preventing damage from cytotoxic proteins secreted by the gland itself, as suggested by Ogawa et al. (1995). Several studies on the pattern of venom production (Rotenberg et al. 1971; Oron and Bdolah 1973; De Lucca et al. 1974) showed that the size of the venom gland cells alters in relation to the amount of venom produced and peaks at different times after milking, depending on the species of snake. However, in the spitting cobra, the venom gland cells do not exhibit any marked size difference before and after stimulation of venom production.
The gross morphology of the venom glands conforms to what has been described for snakes of the Elapidae family (Kochva et al. 1982). The N. n. sputatrix venom gland lacks the expanded central lumen seen in the viperids, but instead has extensive tubular lumina throughout the gland, which are smaller than the central lumen. The accessory glands are less prominent, and the function of their mucous secretion is still not clearly understood (Gopalakrishnakone et al. 1994). The presence of the horizontal cells beneath the columnar epithelial cells is not as prominent as in viperids. In situ hybridization studies showed that the CTX, PLA2, and NTX mRNAs were specifically localized in the columnar secretory epithelial cells (Figure 2). No staining was observed in other cell types in the venom gland, confirming that toxin gene expression takes place exclusively in the columnar epithelial cells. Measurement of the in situ hybridization staining intensities (Figure 3), which reflect the rate of mRNA synthesis, reveals that synthesis of nascent mRNAs for the three toxins commenced almost immediately (as early as 2 hr) after the venom was milked. This observation differs from the transcriptional activity in vipers, which showed a lag period of 2 days after milking followed by a sharp increase in transcriptional activity on Day 3 that was maintained until 5 days after milking (Paine et al. 1992). However, the immediate increase of toxin mRNA level in the spitting cobra correlates with the accelerated transcription of the amylase gene in rat parotid gland, as shown by the rapid elevation of amylase mRNA content within 1 hr, and was two- to threefold higher than control values at 4 hr after stimulation (Woon et al. 1993). Therefore, it appears that the rate of initiation of toxins' mRNA transcriptional activities in the spitting cobra is similar to those in rat parotid gland but differs significantly from the rate seen in viperid venom gland.
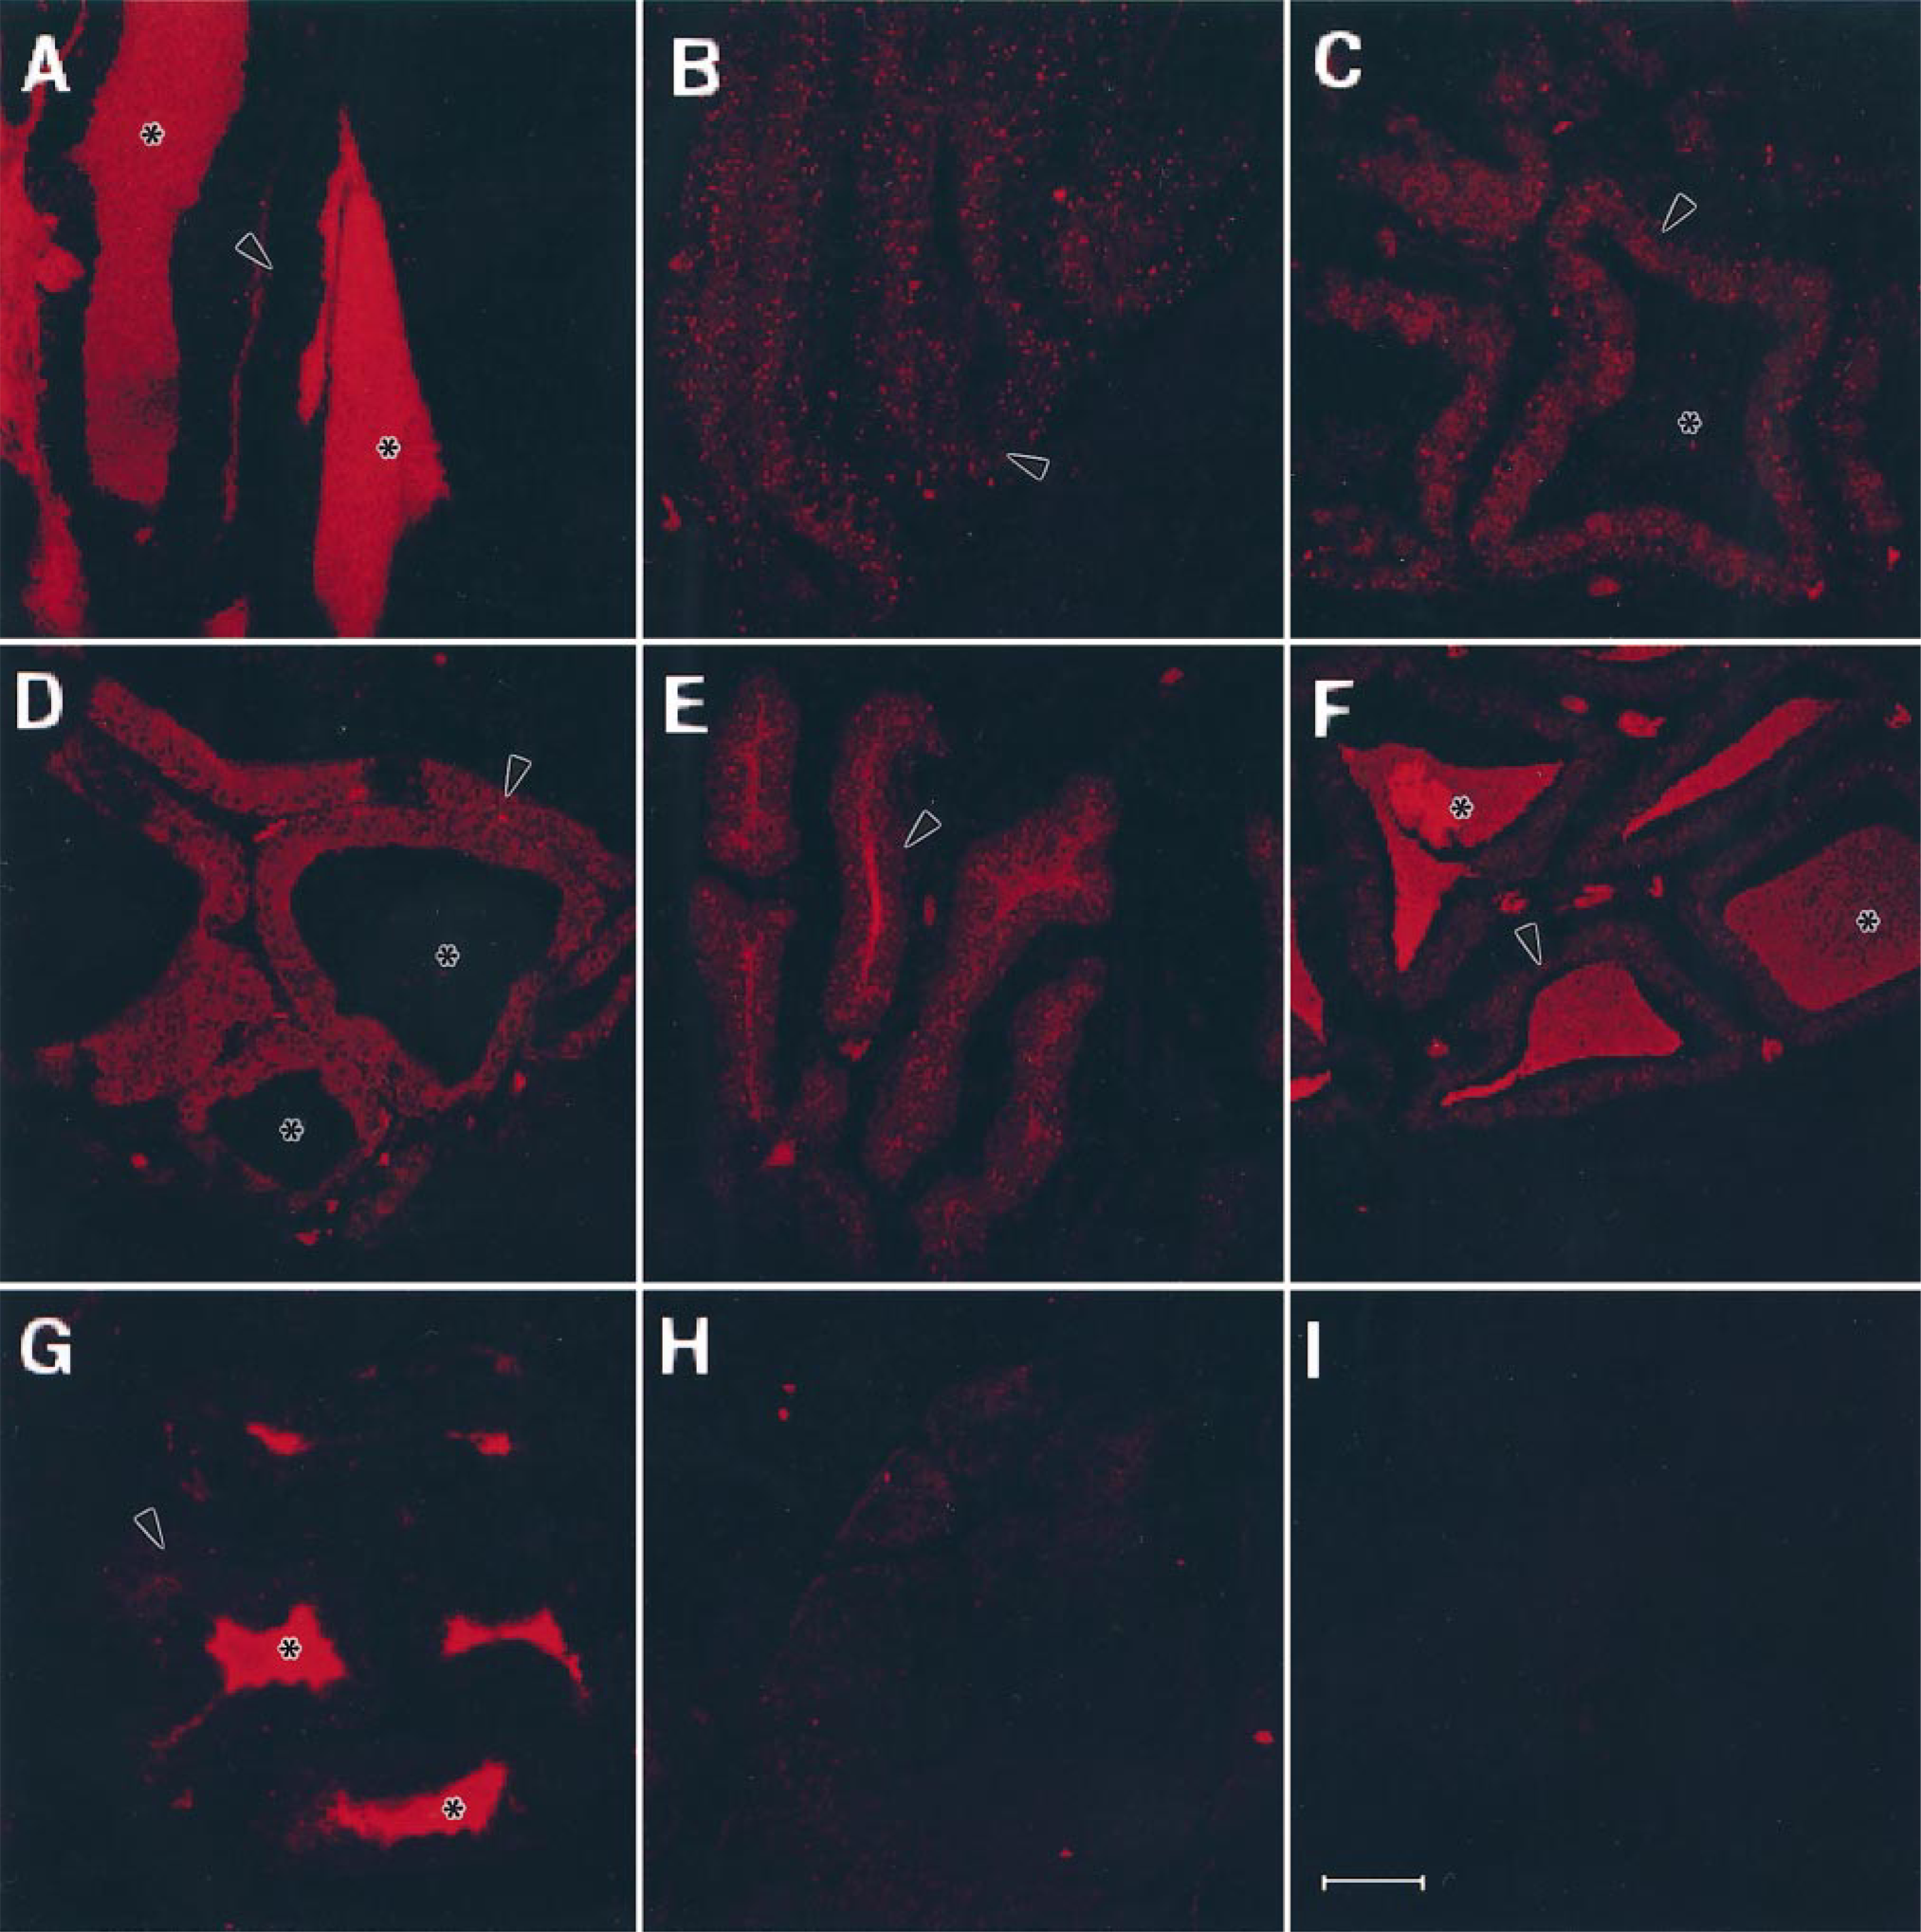
Confocal images collected after immunofluorescent probing for NTX. (A-G) Venom gland sections. (A) Unmilked (control) section; (B-G) sections from snakes sacrificed 2, 4, 24, 48, 96, or 192 hr after milking. (H) Snake compressor glandulae muscle section; (I) Snake pancreas section. Venom gland secretory tubules lined by epithelial cells are indicated with arrowheads and the lumens with asterisks. Bar = 75 μm.
The rate of CTX mRNA synthesis is the highest among the three toxin mRNAs (Figure 3), as evidenced by the intense staining observed on venom gland sections obtained 4 hr after milking (Figure 2). The rate of phospholipase A2 mRNA synthesis appears to be only slightly higher than that of neurotoxins. From the above observations, it is evident that the synthesis of CTX mRNAs occurs at a much higher rate than that for PLA2 and NTX mRNAs. Another important observation is the fact that each secretory epithelial cell shows staining for all three types of toxins, thus confirming their synthesis. The evidence provided therefore shows the absence of specialization of secretory epithelial cells in their production of any particular type of toxin.
LC-MS profiles of N. n. sputatrix venom proteins (10 μg). (A) Protein profile for venom from a control (unstimulated) snake. (B-D) Protein profiles for venom obtained from snakes sacrificed 1, 4, or 8 days after milking. Numbers on the peaks are the molecular mass (Mr) as determined from ion spray mass spectrometry. Mr ã 6.7 × 10³ is for cardiotoxins (CTX), Mr ã 1.3 × 10³ is for phospholipase A2 (PLA2) and Mr ã 6.8 × 10³ and 7.4–7.5 × 10³ are for short and long neurotoxins, respectively (NTX).
To elucidate toxin synthesis events in the venom gland, immunofluorescence detection was carried out for NTX, PLA2, and CTX on sections from unmilked (control) and milked snakes. The progress of NTX synthesis from the time of milking to 8 days later is clearly shown in Figure 4. Immunofluorescence studies of NTXs in unmilked snake glands (control) indicated that the synthetic activity in the secretory epithelial cells is indeed very low (Figure 4A), as shown by the minimal fluorescence in the epithelial cells. In contrast, intense fluorescence is seen in the lumen, indicating the presence of large amounts of toxins stored in the tubular lumina. The fluorescence intensity in the secretory epithelial cells increases gradually in the venom gland sections from 2 hr up to 2 days after milking (Figures 4B-4E), and thereafter the appearance of the venom in epithelial cells decreases with the concomitant increase in transport and storage in the tubular lumina (Figures 4F and 4G), which correlates with the increase in the rate of synthesis of the toxins after milking. At 8 days after milking, the tubular lumina were almost filled with venom, as can be seen by the intense fluorescence, whereas the fluorescence in the secretory epithelial cells is at a minimum. We therefore believe that venom toxin synthesis slows to a minimal level once the tubular lumina are filled with venom. This is in accordance with the findings by Sells et al. (1989), who suggested that the hydrostatic pressure and the amount of venom present in the lumen of the gland were the main regulatory factors for the synthesis and secretion of venom in vipers. A similar control mechanism therefore appears to be present in cobras (elapids) also. The rate of venom synthesis in cobras appears to be higher than that in viperids; the latter requires up to 3 weeks for total regeneration of venom after milking (Oron and Bdolah 1978). The production of an appreciable amount of venom in a relatively short period of time could be due to the fact that the rate of mRNA synthesis (transcription) and its translation into proteins is high in cobras. The high rate of toxin synthesis and accumulation could account for the fact that secretion granules (containing toxins) in secretory epithelial cells of cobra venom gland occupy 60–80% of the cell volume (Kochva et al. 1982). This is very much higher than in viperids, in which the secretory granules occupy less than 5% of the secretory epithelial cell volume (Oron and Bdolah 1978). The rapid production of venom components could be due to the evolutionary adaptation of the spitting cobra, which expels huge amounts of venom for defensive purposes by spitting its venom towards aggressors, apart from using the venom for immobilizing and aiding in the digestion of prey. This could account for the difference in the rate of toxin gene expression and of venom synthesis and accumulation between the spitting cobra and the viperids.
The amount and the rate of synthesis of the three different types of toxins could account for the difference in total percentage of each toxin in the venom from N. n. sputatrix. Studying the venom protein profile with LC-MS sheds some light on toxin expression in the venom gland. As soon as 1 day after milking, appreciable amounts of venom could be obtained and analyzed, and the protein profiles show that CTX is produced in the greatest amount (by its peak sizes), followed by PLA2 and NTX at very low levels. By Day 4 there is a substantial increase in CTX and PLA2 production (Figure 5B). Even NTX is produced at a higher level, although far lower than CTX and PLA2. On Day 8 the venom protein profile (Figure 5C) is similar, although not identical, to the control venom profile (Figure 5D). This is predictable because venom protein profiles show minor variations among snakes even from the same species. However, comparison of the profiles in Figure 5 is acceptable for major components of the venom (e.g., CTX, PLA2, and NTX), because most variations were limited to minor components. By Day 8 venom production is at its peak, although not at its maximum as for control venom. The higher concentration of toxin proteins in the control venom could be accounted for by the accumulation and concentration of venom in the tubular lumina of the venom gland over a prolonged period. The venom protein profiles conclusively suggest that the amount of toxin protein increases from Day 1 to Day 8 after milking and that the rate of increase is always greater for CTX, followed by PLA2, and is the lowest for NTX. This observation supports the fact that cardiotoxins in N. n. sputatrix comprise almost 60% of venom dry weight, whereas phospholipase A2 and neurotoxins comprise 14% and 4.5%, respectively (Tan 1991). We postulate that more CTXs are produced by the venom glands because of their multitude of target sites and pharmacological actions. Apart from their action on cell membranes, phospholipases A2 are known to act in synergy with CTXs in exerting some of their pharmacological effects. It is therefore not surprising that an appreciable amount of PLA2 is also produced by the venom gland epithelial cells. Neurotoxin has a very specific target site and mode of action. Its binding to acetylcholine receptors (AChR) on postsynaptic membranes causes inhibition of nerve impulse transmission. Because of its potency, small doses are sufficient to achieve paralysis. Therefore, only small amounts must be produced by the secretory epithelial cells. The increase in toxin protein levels could be attributed to the increase in the level of toxin mRNA in the venom gland, suggesting that transcriptional regulation of the toxin genes may be involved.
Our investigations provide confirming evidence that synthesis of the three major toxic components of N. n. sputatrix venom takes place exclusively and indiscriminately in the secretory epithelial cells lining the extensive tubular lumina of the venom gland. However, the mRNA turnover and protein synthesis rates differ significantly for the three toxins, with CTX having the highest rate, followed by PLA2, and the least for NTX, leading to varying venom concentrations of CTX, PLA2, and NTX in the ratio of 13:3:1, respectively. The temporal dissociation between venom gland stimulation and initiation of protein synthesis with the initial accelerated increase in mRNA content suggests that transcriptional regulation is involved in toxin gene expression. The higher rate of toxin gene expression and secretion, resulting in rapid accumulation of venom compared to viperids, may be an evolutionary adaptation of the spitting cobra, which makes perfect biologic sense because it expends an enormous amount of venom for spitting, believed to be a unique defensive reaction. The gradual decrease leading to a barely minimal rate of toxin synthesis, with the concomitant increase in the accumulation of venom in the tubular lumina, suggests a feedback mechanism whereby the synthesis of secretory proteins, such as venom toxins, is coordinated with their secretion.
Footnotes
Acknowledgements
Supported by Research Grant RP 960324. RL is the recipient of a Research Scholarship from the National University of Singapore.
We thank Dr P.N. Strong of the Imperial College School of Medicine, Hammersmith Hospital, London, for discussion and critical reading of the manuscript. We are also indebted to Dr R.M. Kini of the Bioscience Center, National University of Singapore, for helping us with the LC-MS analysis.