
Abstract
I
Quantitative histochemical assays are based on the densitometric monitoring of the enzyme-linked reduction of nitroblue tetrazolium (NBT) to its insoluble diformazan salt over time in tissue cryosections. The strength and versatility of these procedures draws on the fact that the progression of the enzyme reactions is linear over a reasonable length of time, thereby permitting endpoint determinations of specific activity (Blanco et al. 1988; Chalmers and Edgerton 1989; Jasmin et al. 1995; Dunn and Michel 1997). This versatility has been somewhat tempered by the recent suggestion that the histochemically determined reaction kinetics for succinate dehydrogenase (SDH) are linear only within a short period (i.e., >2 min) after initiation of the substrate reaction, a situation exacerbated by increasing cellular concentrations of this enzyme (Skorjanc et al. 1997; Skorjanc and Pette 1998).
In this present letter we provide evidence and reemphasize the fact that, in our hands (Jasmin et al. 1995; Dunn and Michel 1997) and in those of others (Blanco et al. 1988; Chalmers and Edgerton 1989), the quantitative microphotometric assessment of reaction kinetics for SDH and FAD-linked glycerol-3-phosphate dehydrogenase (GPDH) in individual excitable cells in situ is indeed linear over an extended period of time and across all cell types, regardless of levels of these enzymes or their cross-sectional size. These histochemical procedures can therefore be applied appropriately to an endpoint determination process, if so desired. This point is illustrated in Figure 1. In these data sets, the substrate-specific reaction rates for SDH were obtained after tissue incubation in medium without substrate to correct for nonspecific reduction of NBT (i.e., “nothing dehydrogenase” activity).
We show that SDH reaction kinetics are linear for 10-12 min of incubation time in individual rat plantaris fibers. This steady progression of OD over time is maintained when single fibers are grouped according to their myosin heavy chain (MHC) isoform composition, which in rat control tissue displays high (IIa MHC), moderate (I and IIx MHC) and low (IIb MHC) SDH activities. This linearity is also preserved under conditions that cause massive changes in muscle cell volume, as seen after 2 weeks of tetrodotoxin (TTX)-induced paralysis (50% loss in cross-sectional size) or 4 weeks of functional overload (100% increase in cross-sectional size). Moreover, our group and others have documented the linear progression of the SDH reaction to beyond 10 min in motor neuron somata (data not shown; Chalmers and Edgerton 1989). Finally, we have also assessed the kinetics of the GPDH reaction in muscle fibers using these same microphotometric procedures and have found them to be linear over 25 min of tissue incubation at 37C (data not shown; Martin et al. 1985).
We offer two plausible explanations as to why the quantitative histochemical methods employed in our laboratory (Blanco et al. 1988; Chalmers and Edgerton 1989; Jasmin et al. 1995; Dunn and Michel 1997) provide results that differ from those recently reported with respect to the duration of the linear phase of the SDH reaction (Skorjanc et al. 1997; Skorjanc and Pette 1998). The first and most apparent discrepancy relates to their use of phenazine methosulfate (PMS) as the exogenous electron carrier and cyanide as the inhibitor of the electron transport system. The merits of using mPMS and azide over PMS and cyanide have been thoroughly tested and eloquently presented by Blanco et al. (1988). Briefly, the substitution of PMS and cyanide results in the significant production of NBT monoformazan as a contaminating (i.e., second) reaction indicator, leading to a loss of linearity and a substantial increase in the substrate-related (240%) and nonspecific (420%) reductions of the reaction indicator NBT (Blanco et al. 1988).
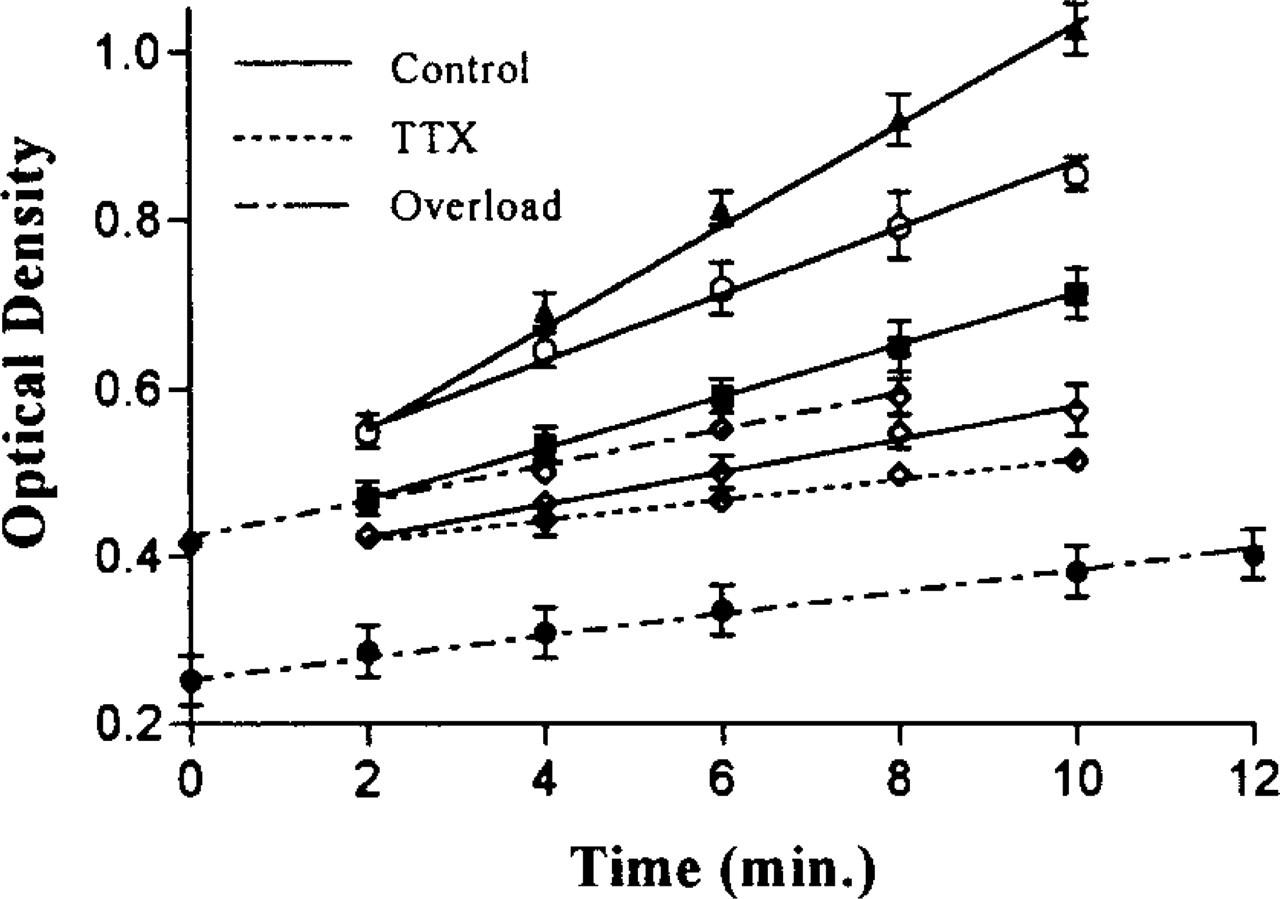
Reaction kinetics of SDH in single rat plantaris muscle fibers measured as the enzyme-linked reduction of nitroblue tetrazolium to its insoluble diformazan salt over time across four distinct fiber types and after various experimental conditions. The imaging apparatus, computer software, and staining procedures are described in detail elsewhere (Jasmin et al. 1995; Dunn and Michel 1997). Tissue cross-sections (10 μm) were placed inverted over a temperature-controlled (23C) reaction well and exposed to a blank reaction medium (i.e. without substrate) for 10 min, a time when nonspecific staining has reached a plateau. At this time, the blank medium was replaced by an identical reaction mixture except for the presence of substrate (48 mM succinic acid). Filtered images (540 nm) of product formation within individual fibers were captured every 2 min and OD measurements determined. Except for each image capture (i.e., >5 sec), all reactions were protected from direct (i.e., microscope light path) and incident light. Muscle fibers are samples from control (solid lines), tetrodotoxin (TTX)-inactivated (dotted line), and 4-week functionally overloaded (dotted/dashed lines) tissues. Each curve represents means ± SEM from 5-10 fibers from each sample condition. Fibers were typed according to the immunohistochemical detection of specific myosin heavy chains
The second relates to their method of exposing the reacting tissue to direct microscopic light for 100-130 sec. Because NBT and PMS are light-sensitive and NBT diformazan absorbs visible light to a high degree, exposure to either direct or incident light also increases the tissue accumulation of the NBT-diformazan product (data not shown). The effect of these two factors may be confounded by the fact that the response range of most video-based microdensitometric image processing system scanners is known to deviate from linearity at high tissue concentrations of NBT diformazan (< 130 μM) (Blanco et al. 1988).
An additional factor that we have found to influence the progression of histochemically determined dehydrogenase reactions is assay incubation temperature. Although the control of reaction temperature does not appear to affect the linearity of the SDH reaction, we report comparatively lower activities of this enzyme under such conditions (Figure 1).
In summary, the quantitative histochemical assay that we describe leads to optimal reaction kinetics that are consistently linear, slowly progressing, and reproducible and are therefore suited to endpoint reaction measurements if required. This holds true only when the exact reagent mixtures are utilized and when the reagents and assay reactions are protected from light and variations in temperature during the microphotometric procedures.
Footnotes
Acknowledgements
Supported by NSERC Canada.