
Abstract
Hepatocellular carcinoma (HCC) is a common type of cancer, with approximately 260,000 new cases each year, and liver cirrhosis is generally considered a major predisposing factor for HCC. However, specific changes of gene expression in liver cirrhosis and HCC remain obscure. The expression of genes for hepatocyte growth factor (HGF), its receptor c-met proto-oncogene, c-myc proto-oncogene, and albumin was analyzed. Gene expression was studied by PCR in seven normal human livers, nine cases of hepatitis C cirrhosis, 12 cases of alcoholic cirrhosis, two cases of liver adenoma, and 12 cases of HCC. HGF and c-met protein were revealed by immunofluorescent staining. HGF mRNA was not expressed in normal livers but was detected in adenomas, in 80% of HCC, and in some cirrhoses. Paraffin-embedded and fresh-frozen tissue samples yielded similar results. Immunohistochemical data correlated with PCR results regarding the overexpression of the HGF/c-met system in HCC. Albumin gene expression was decreased in HCC vs normal livers, consistent with altered function of tumor hepatocytes. The elevated expression of the HGF/c-met system in HCC may play a role in tumor development and/or progression. Tissue localization studies of HGF and its receptor c-met protein support the existence of both autocrine and paracrine mechanisms of action of HGF in HCC vs only a paracrine mechanism in normal liver.
Keywords
H
Hepatocyte growth factor/scatter factor (HGF/SF) is a mesenchyme-derived heparin-binding polypeptide (Noji et al. 1990; Rosen et al. 1990; Nakamura et al. 1989; Zarnegar et al. 1989) which may act in different systems as a mitogen (Kan et al. 1991; Matsumoto et al. 1991), morphogen (Montesano et al. 1991), motogen, and metastasis-promoting factor (Rosen et al. 1990; Stoker et al. 1987). It may be involved in embryonic development, wound healing, vascular repair, and cancer invasion (Zarnegar and Michalopoulos 1995; Grant et al. 1993; Yoshinaga et al. 1993).
The product of the c-met proto-oncogene, a transmembrane receptor tyrosine kinase, has been identified as the HGF receptor (Bottaro et al. 1991). Two c-met protein subunits (α, 50 kD and β, 145 kD) are generated by the cleavage of a single precursor (Gonzatti-Haces et al. 1989; Park et al. 1987). The tyrosine kinase activity resides in the cytoplasmic domain of the β-subunit. A wide range of cells and tissues express this receptor protein (Jiang et al. 1993). c-met mRNA is overexpressed in human thyroid (Di Renzo et al. 1992), stomach (Di Renzo et al. 1991), and pancreatic (Di Renzo et al. 1995) cancers.
Because HGF is a potent hepatocyte mitogen and the c-met proto-oncogene is highly expressed in various tumors, the HGF/c-met system is believed to play an important role in liver regeneration, growth, and tumorigenesis. However, data regarding HGF and c-met expression in liver neoplasms vs normal liver are very limited and controversial (Boix et al. 1994; Selden et al. 1994; Suzuki et al. 1994). This may be due in part to the insufficient sensitivity of the techniques used, e.g., Northern analysis (Suzuki et al. 1994). Moreover, HGF and its receptor used to be studied separately, by Northern analysis or immunohistochemistry, usually for one gene or gene product (more often c-met). However, they are parts of the same regulatory pathway, and it is important to identify the expression patterns of both these genes together in the same clinical cases. This problem has not been studied previously.
The goal of our study was therefore to analyze HGF and c-met expression together in potentially premalignant (cirrhosis and adenoma) and malignant (HCC) liver disorders, compared with normal liver. We hypothesized that neoplastic transformation in the liver would bring about HGF upregulation, in concert with c-met. Another hypothesis was that such upregulation could be associated in liver tumors (as in pancreatic cancers) (Furukawa et al. 1995) with the appearance of an autocrine HGF pathway in addition to its normal paracrine mechanism of action. Because cirrhosis and HCC are associated with abnormalities in cell proliferation and function, it was reasonable to include in the analysis their respective markers, the c-myc proto-oncogene (Evan and Hancock 1985; Persson and Leder 1984) and albumin. We used a reverse transcription–polymerase chain reaction (RT-PCR) technique and immunofluorescent staining to analyze, respectively, the gene and gene product expression in human formalin-fixed, paraffin-embedded (FFPE), and fresh-frozen tissues. In agreement with our hypotheses, we were able to show that the HGF/c-met gene system was overexpressed in primary liver cancer and to obtain the first evidence in favor of an additional autocrine pathway of HGF action in HCC.
Materials and Methods
Tissue Processing
FFPE human liver tissue was obtained from 36 patients: 28 men and eight women, 4 to 76 years old (mean age 47.6 years). None of the patients either had evidence of distant metastases or had been previously diagnosed with HCC. Liver biopsies were obtained either percutaneously or during exploratory laparotomy. Samples were fixed in neutral buffered formalin and embedded in paraffin. They included four biopsy specimens from normal organ donor livers, nine cases of chronic hepatitis C (HCV), 12 cases of alcoholic liver disease (ALD), including four HCV-positive livers (histologically all patients had established cirrhosis), two liver adenomas and nine well-differentiated HCCs. Four of these HCCs developed in cirrhotic livers and three were found in non-cirrhotic livers. For two HCCs, only biopsy material was available, without surrounding liver parenchyma, so the presence or absence of cirrhosis could not be determined. These patients, however, had no clinical, laboratory, or radiological evidence of preexisting chronic liver disease. In three cases, the etiology of cirrhosis underlying HCC was determined: two were associated with hepatitis C and one with alcohol abuse. The study protocol was approved by the institutional committee for the protection of human subjects and conformed with the guidelines of the 1975 Declaration of Helsinki.
Sections for RNA extraction were taken from a block(s) with the most characteristic histological findings. This was especially important in the case of liver tumors, because it was necessary to extract RNA from the tumor tissue itself but not from adjacent non-tumorous tissue. We validated the FFPE technique in 11 cases of fresh-frozen tissues by analyzing them by RT-PCR in parallel with FFPE tissues. Fresh-frozen sections were obtained from four normal livers, two HCV cirrhotic livers, one ALD, and four HCCs (two developed on HCV cirrhotic background, two did not have any underlying cirrhosis). Of these, five samples (one normal, two HCV, one ALD, and one HCC) were from the same patients as the respective FFPE tissues. Fresh-frozen samples were analyzed identically to the FFPE samples (without deparaffinization and proteinase K treatment).
RNA Extraction from Tissue Blocks
Paraffin sections were deparaffinized in xylene and total RNA was extracted using a modification of the acid guanidinium thiocyanate/phenol/chloroform method (Chomczynski and Sacchi 1987). RNA was extracted from five to ten 3–5-μm tissue sections that were incubated in 200 μl of digestion buffer (100 mM Tris-HCl, pH 8.0, 4 mM EDTA, 400 μg/ml proteinase K, 1% SDS) for 1 hr at 37C and were boiled for 7 min to stop the digestion. The DNA-RNA mixture was extracted twice with phenol, once with chloroform, and precipitated with ethanol. After centrifugation, pellets were dissolved in 0.5 ml of Solution D (4 M guanidine thiocyanate, 25 mM sodium citrate, pH 7.0, 0.5% N-lauroylsarcosine, and 0.1 M 2-mercaptoethanol) and rotated for up to 24 hr at room temperature (RT). Then 0.1 ml of chloroform/isoamyl alcohol (24:1), 0.5 ml of acid phenol, and 50 μl of sodium acetate were added, centrifuged for 20 min, and the aqueous phase precipitated with ethanol. The precipitates were washed with 1 ml of 75% ethanol, vacuum-dried, and treated with 20 U of RNAse-free DNAse (Sigma Chemical; St Louis, MO) for 30 min at 37C, immediately followed by phenol/chloroform extraction and ethanol precipitation. The OD260/OD280 ratio was measured for RNA quantitation and determination of the preparation purity.
Primer Selection
RT-PCR analysis was performed to generate and amplify cDNA sequences from cellular mRNA for HGF, its receptor c-met, albumin, and c-myc. The β-actin gene served as an internal control for the efficiency of mRNA isolation and cDNA synthesis in each sample. The software program Oligos (National; Plymouth, MN) was used to design optimal PCR primers that would amplify at similar temperatures and magnesium concentrations. We used the following primers: HGF, 5’ primer AGTACTGTGCAATTAAAACATGCG, 3’ primer TTGTTTGGGATAAGTTGCCCA; c-met, 5’ GGTCCTTTGGCGTCGTCCTC, 3’ CTCATCATCAGCGTTATCTTC; c-myc, 5’ CTCGGAAGGACTATCCTGCTGCCAA, 3’ GGCGCTCCAAGACGTTGTGTGTTCG; albumin, 5’ TTAGGATCCCCCAGGAAGACATCCTTTGC, 3’ CCTGAGCCAGAGATTTCC; β-actin, 5’ AGGCCAACCGCGAGAAGATGACC; 3’ GAAGTCCAGGGCGACGTAGCACA.
The amplimers had similar G-C content to avoid large differences in reaction efficiencies. All primers were compared to the GenBank and EMBL nucleic acid sequence libraries using the Intelligenetics Suite program (Intelligenetics; Mountain View, CA), to ensure that they would not hybridize to any other known nucleic acid sequences under the conditions used.
Reverse Transcription and Polymerase Chain Reaction
RT of RNA and PCR amplification of cDNA were carried out in the same test tube, according to a Perkin-Elmer-Cetus (Norwalk, CT) protocol. Briefly, MgCl2, 10 X PCR buffer, an RNAse inhibitor, reverse transcriptase, deoxynucleoside triphosphates, oligo d(T)16, and RNA were mixed in a total volume of 20 μl. The thermal cycler (GeneAmp PCR System 9600; Perkin-Elmer-Cetus) program for the RT step was 30 min at 42C, 5 min at 99C, and 5 min at 5C. PCR of each cDNA sequence was performed with 1 μg of mRNA (concentration determined by spectrophotometry), 2.5 U of Taq polymerase (GeneAmp RNA PCR Kit; Perkin-Elmer-Cetus), and 5 mM Mg++, in a total volume of 100 μl. All samples were amplified simultaneously with specific primers using a master mixture containing all components of the PCR reaction. Negative controls routinely used for each set of primers included water control and control without template. An RT-PCR positive kit control was included for each reaction. Programmable temperature cycling was performed with the following cycle profile: 94C for 1 min and then 35 cycles each comprising denaturation for 30 sec at 94C, annealing for 45 sec at 55C, and extension for 45 sec at 72C. After 35 cycles, the reaction tubes were kept for 5 min at 72C and then at 4C. Samples were electrophoresed in gels containing 3% NuSieve and 1% SeaKem agarose (FMC; Rockland, ME). PCR bands were authenticated by sequencing as described (Sanger et al. 1977).
Immunofluorescent Analysis
Indirect immunofluorescent analysis of HGF and c-met product distribution in three normal, three HCV, and three ALD cirrhotic specimens and in six HCC FFPE tissues was applied to the same cases for which HGF and c-met gene expression had been analyzed by PCR. Five μm sections deparaffinized in xylene and brought to PBS were blocked with normal goat serum for 1 hr at RT, incubated with primary antibodies for 1 hour, washed in PBS, then incubated for 1 hour with rhodamine-conjugated anti-species secondary antibodies (preadsorbed with human serum proteins; Chemicon International, Temecula, CA), and mounted in glycerol/water (1:1). Sections were viewed and photographed in an Olympus BH-2 fluorescence microscope. Primary polyclonal antibodies were goat antibodies to human HGF (R&D Systems; Minneapolis, MN) and rabbit antibodies to human c-met protein (Santa Cruz Biotechnology; Santa Cruz, CA), both used at 25 μg/ml. Four routine controls were negative: (a) without the primary antibody; (b) without the secondary antibody; (c) with non-immune goat (for HGF) or rabbit (for c-met protein) IgG as a primary antibody; and (d) antibody neutralization by the antigen. For the latter control, an equal amount (w/w, in excess of the antigen) of specific antibody was incubated with the respective antigen (recombinant human HGF or a 28 mer c-met peptide), using 0.5% bovine serum albumin as a carrier, on a shaker, for 3 hr at 37C and then overnight at 4C. After a 30-min spin in a minifuge, the neutralized antibodies (supernatant) were applied to sections, followed by secondary antibodies.
Statistical Analysis
This was done with the two-sided Fisher's exact test.
Results
Comparison of mRNA Expression Between Fresh-frozen and Formalin-fixed Samples
We compared the expression of all studied genes in fresh-frozen and FFPE human liver tissues. RNA was extracted from 11 fresh-frozen and 36 FFPE samples, and RT-PCR was run simultaneously for all of them. Expression of all genes in fresh-frozen material was qualitatively similar to that seen in FFPE samples, so the results from these two groups are combined in Table 1. However, we observed a difference in signal intensity between the two groups. In fresh-frozen samples, some bands were more intense, particularly for the albumin gene (Figures 1a and 1b). This could be due to partial mRNA degradation during FFPE tissue processing, as pointed out by others (Finke et al. 1993).
Gene Expression in Normal and Diseased Liver Tissue
Normal Liver HGF gene expression was not detected in normal livers, whereas all other genes studied were expressed in all normal livers (Figure 1; Table 1).
Gene expression in normal and pathological livers (combined results from FFPE and fresh-frozen tissues)
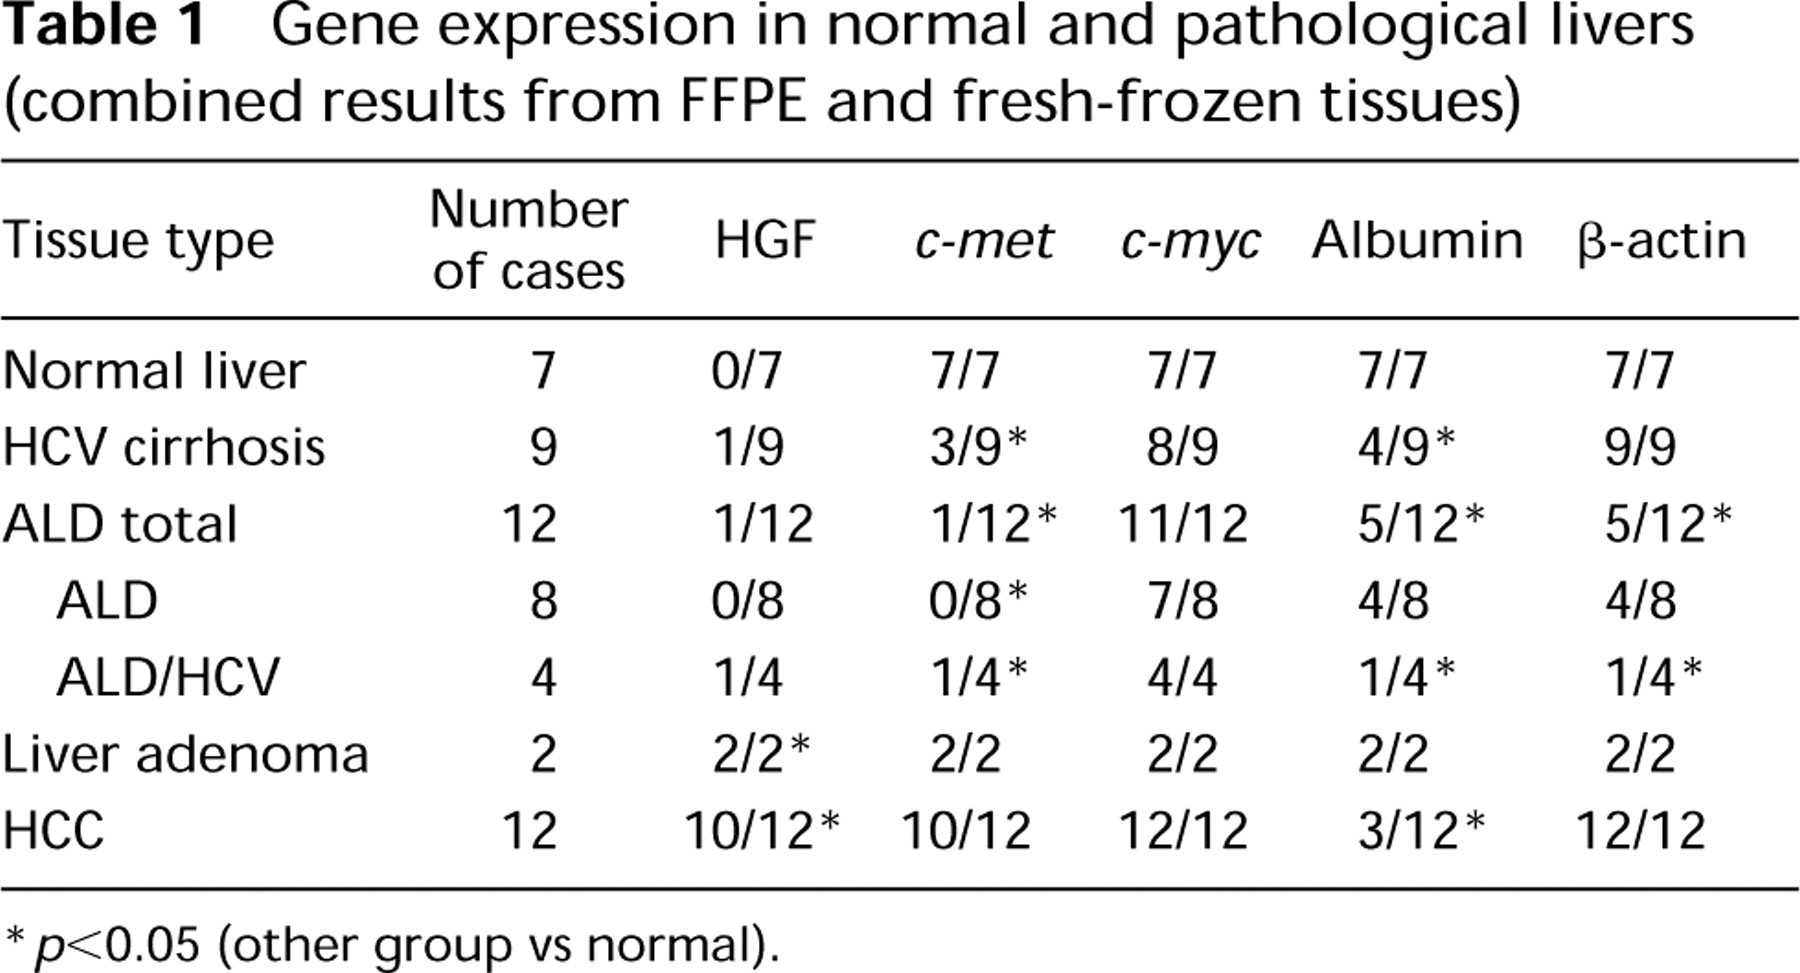
∗ p<0.05 (other group vs normal).
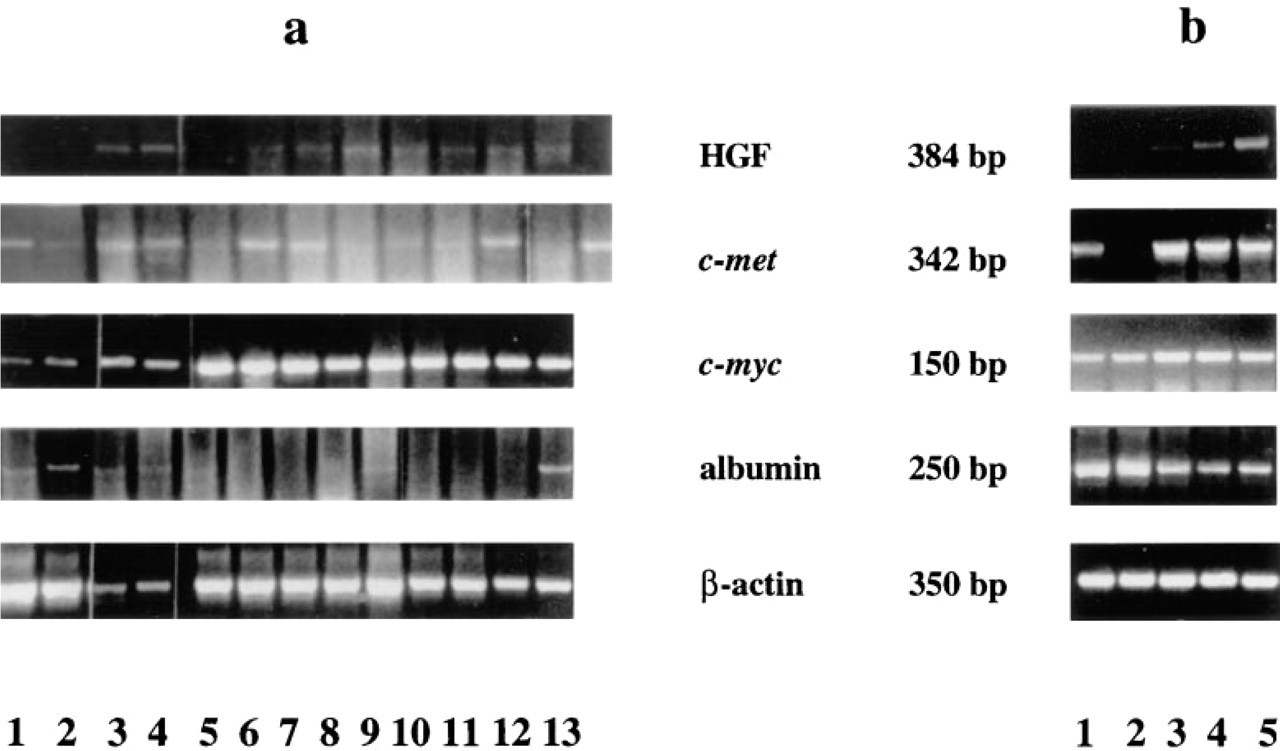
Ethidium bromide-stained agarose gel of PCR products amplified in the same experiment using cDNA samples to study gene expression of HGF, c-met, c-myc, albumin, and β-actin. (
HCV Cirrhotic Liver HGF gene was expressed in one of nine HCV cirrhoses. c-met was expressed in three of nine, c-myc in eight of nine, and albumin gene in four of nine cases (Figure 1; Table 1).
Alcoholic Liver Disease HGF mRNA was detected in one sample of ALD/HCV cihrrotic liver. c-met mRNA expression was also found in this case (Figure 1b), but not in any of the other 11 ALD specimens examined. In contrast, c-myc was expressed in 11 of 12 samples and albumin mRNA was detected in five cases (Table 1).
Liver Adenoma All genes studied were expressed in both adenomas examined (Figure 1; Table 1).
Hepatocellular Carcinoma HGF and c-met genes were expressed in 10 of 12 cases, c-myc in 12 cases, and albumin in only three cases (Figure 1; Table 1).
β-Actin Gene Expression β-Actin gene (a positive control) was expressed in all normal livers, HCV cirrhoses, liver adenomas and HCC. In ALD, β-actin gene was expressed only in five of 12 samples: four of eight ALD and one of four ALD/HCV (Figure 1; Table 1). Because other genes studied, such as c-myc and albumin, were expressed in ALD, lack of β-actin expression is not likely to be an artifact.
HGF and c-met Protein Expression
HGF antibody in normal liver gave little or no staining (Figure 2a). In cirrhoses and at the HCC periphery, specific staining was observed in bile duct (Figures 2b and 2c) and sinusoidal (not shown) cells. Surprisingly, in five of six HCC cases analyzed, tumor hepatocytes were also stained (Figures 2b and 2c).
Expression of c-met protein (HGF receptor) was seen in hepatocytes and biliary epithelial cells of normal, cirrhotic and malignant livers (Figures 2d-2f). c-met protein was revealed in all cases, but in normal liver the staining intensity was usually weaker compared with HCC and some areas of cirrhotic livers (Figures 2d and 2f). In HCC, tumor hepatocytes and epithelial cells of tumor-adjacent bile ducts were positive for both HGF and c-met protein on serial sections (Figure 3). On sections treated with antibodies neutralized with the respective antigens, the staining for HGF and c-met protein was greatly diminished or absent (Figure 3).
Discussion
In this study, gene and gene product expression in normal and diseased liver tissue was determined in an attempt to improve our understanding of the molecular events leading to the development of cirrhosis and liver tumors. To this end, we used markers known to be involved in liver regeneration (HGF/c-met system), cell proliferation (c-myc proto-oncogene), and differentiated, hepatocyte-specific function (albumin), and studied the expression of their genes and of HGF/c-met gene products.
Simultaneous analyses of 36 formalin-fixed and 11 fresh-frozen tissues yielded qualitatively similar data. Some quantitative differences noted (Figures 1a and 1b) could be due to partial mRNA degradation during routine tissue fixation and processing (Finke et al. 1993). Therefore, the sensitive RT-PCR method can be recommended for retrospective studies of gene expression in archival liver material. It may be most useful for cases in which only small amounts of biopsy tissue are available.
No HGF gene expression was detected in normal livers by RT-PCR, and little if any HGF protein expression was revealed immunohistochemically. Similar data were obtained previously in a rat model of chronic liver injury and in livers from alcoholic patients (Aldana et al. 1994). In addition, HGF had not been found immunohistochemically in normal liver without cirrhosis or chronic hepatitis (Yoshinaga et al. 1993).
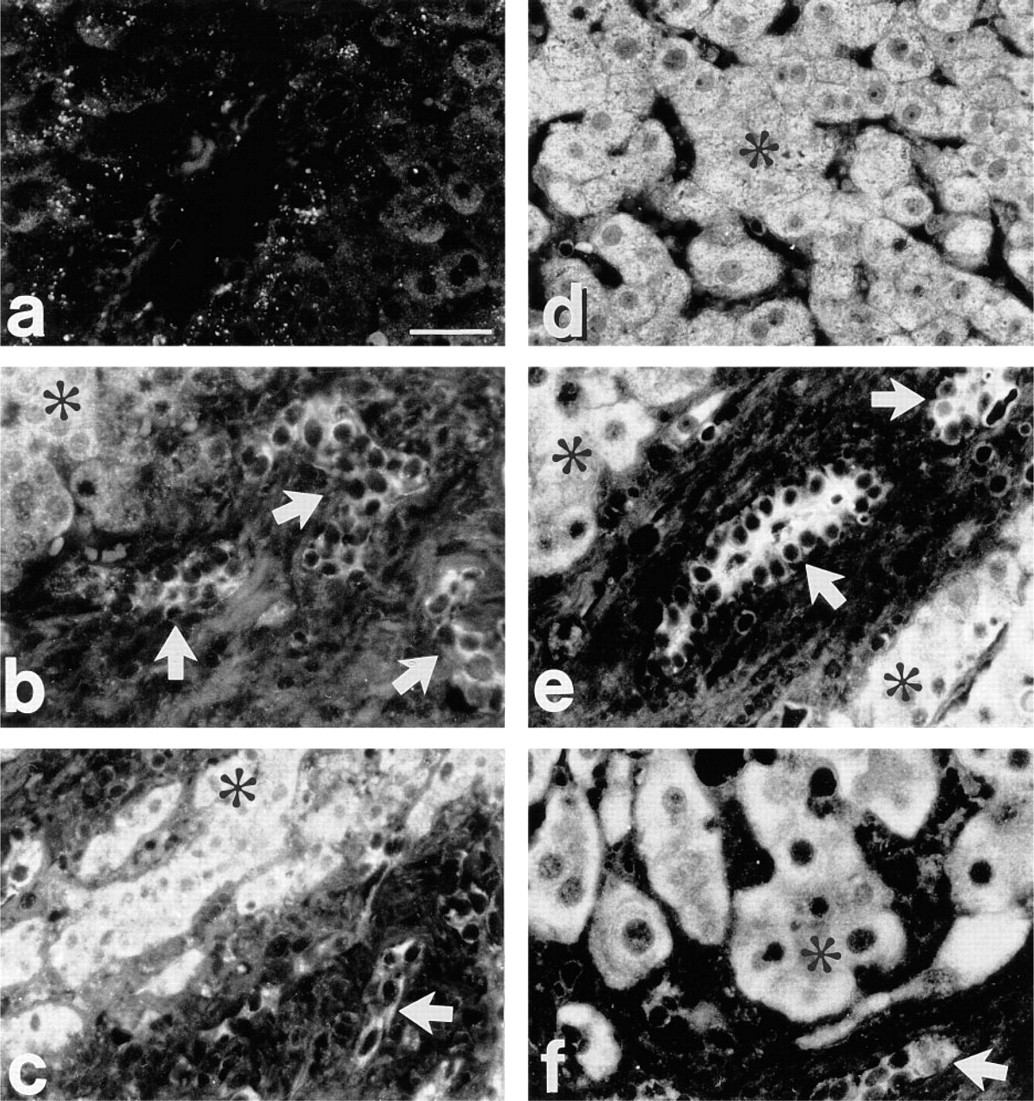
Expression of HGF (a-c) and c-met protein (d-f) in FFPE liver tissues. (
For a reliable analysis of gene expression, it is important to use normal tissue as a control rather than a tumor-adjacent tissue. Indeed, the expression levels of certain genes, including c-met and c-myc, were shown to be very similar in liver tumors and tumor-adjacent histologically uninvolved areas, but higher than in normal liver (Boix et al. 1994; Gan et al. 1993). Therefore, tumor-adjacent tissue apparently has tumor-induced changes in gene expression. The use of such tissue could explain some previous findings of HGF expression in “normal” liver (Selden et al. 1994). In the present study, utilizing only normal donor livers without evidence of any liver disorders, we were unable to find HGF expression even by sensitive RT-PCR. Our data are in good agreement with previous results on animal liver tissue (Rong et al. 1993; Cooper et al. 1992).
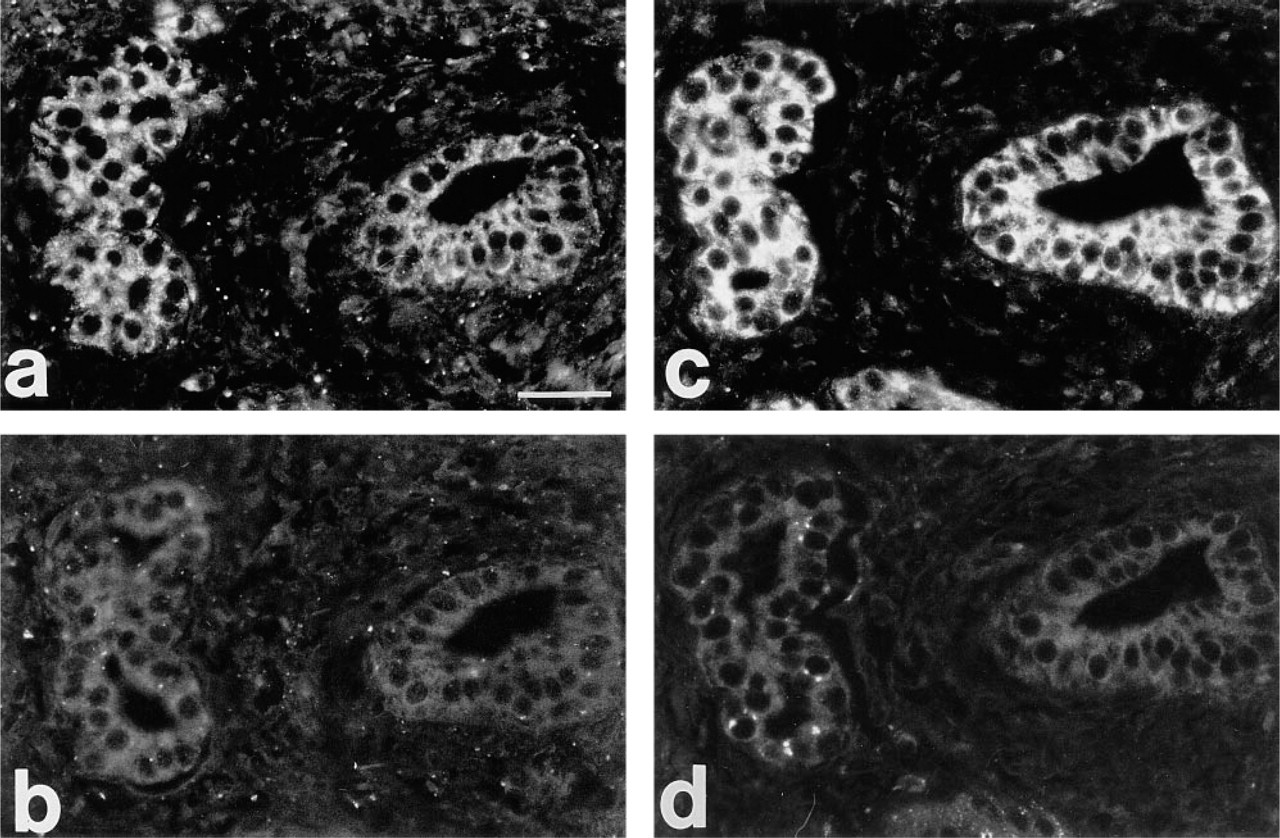
Antibody neutralization by the antigen. Serial sections of an HCC tissue are shown. (
HGF absence in most cirrhoses (Table 1) may be due to inhibition of its expression by transforming growth factor-β (Matsumoto et al. 1992), which is overexpressed in cirrhosis. A reported elevation of serum HGF levels in liver cirrhosis patients might result from its excessive synthesis in other organs, such as lungs and spleen, but not in liver (Matsumoto and Nakamura 1992; Shiota et al. 1995).
Contrary to normal and most cirrhotic livers, HGF expression was readily detected by RT-PCR in both adenomas studied and in 10 of 12 HCC samples. HGF expression by RT-PCR has been found previously in corneal cells, cultured embryonic lung fibroblasts and fibroblast cell lines (Wilson et al. 1993). We describe the first use of a sensitive RT-PCR method to detect HGF gene expression in normal and diseased human liver. By immunofluorescence, specific HGF staining was also revealed in most HCC cases, contrary to normal livers. It was seen in cells of tumor-adjacent bile ducts and, surprisingly, in tumor hepatocytes (Figure 2). This staining was interpreted as specific, because (a) controls without primary or secondary antibodies, with nonspecific primary antibodies, and with antibody neutralization were negative (routine specificity controls; Figure 3), and (b) the staining was absent in normal livers. Therefore, the results of both RT-PCR and immunofluorescence show for the first time HGF overexpression in HCC compared to normal liver.
Overexpression of c-met has previously been observed in animal tumors (Rong et al. 1993; Cooper et al. 1992). Two reports (Selden et al. 1994; Suzuki et al. 1994) documented c-met expression in HCC by Northern blot analysis in eight of 18 (44.4%) and in six of 19 cases (31.6%), respectively. Suzuki et al. (1994) found c-met protein expression in 16 of 23 HCC (69.6%), concluding that Northern analysis was not sensitive enough for studying c-met mRNA expression. Recently, c-met protein overexpression in HCC was reported, compared to benign and normal tissues (Grigioni et al. 1995). While confirming these results, we were able to document the expression of mRNA for both c-met and HGF genes in more than 80% of HCCs, using a more sensitive RT-PCR method. c-met protein was mainly expressed in hepatocytes and bile duct epithelium of normal, cirrhotic, and neoplastic tissues (Figures 2d–2f). The staining intensity was higher in cirrhotic and neoplastic tissues, although the immunofluorescent method provides essentially qualitative data. By RT-PCR, we also reproducibly observed more intense c-met bands in HCC compared to normal liver (Figure 1). On the basis of these results, we can assume that the c-met gene, together with the HGF gene, was overexpressed in liver tumors compared to normal tissues. Our findings are in full agreement with data obtained using quantitative Northern analysis (Grigioni et al. 1995).
On the basis of the following, we believe that by use of our optimized PCR procedure it was possible to correlate the intensity of a PCR band with the content of the corresponding mRNA, i.e., with the expression level of the respective gene: (a) We carried out RT-PCR simultaneously for all genes, with the same amount of RNA in each reaction, and primers optimized for the same conditions. (b) In preliminary experiments, we directly tested whether PCR band intensities were proportional to the corresponding RNA content. To this end, five randomly selected samples were analyzed by serial 10-fold dilutions of RT-PCR reactions (Wang et al. 1992). All genes under study were analyzed in each selected sample by this procedure. In all cases, the PCR band intensities were progressively diminished with consecutive dilutions (not shown), indicating proportionality between band intensity and initial content of respective mRNA. (c) When RT-PCR was run for the same gene in separate experiments using the same or different RNA isolates from the same tissue, the band intensity did not show significant variability.
Overexpression of the HGF/c-met system in liver tumors is suggested from the expression of both mRNA and respective proteins. Our immunofluorescence data are also compatible with the existence of two mechanisms of HGF action in HCC. The first one is “normal,” or paracrine, HGF production by sinusoidal, Ito, and Kupffer cells, which occurs in liver growth and regeneration (Di Renzo et al. 1995; Noji et al. 1990). The second one is “abnormal additional,” or autocrine, HGF production, possibly by epithelial (bile duct) and parenchymal (hepatocytes) liver cells in some cirrhoses, and especially in HCC. Such an autocrine mechanism of HGF/c-met interactions was recently suggested from immunohistochemical data in human pancreatic cancers (Furukawa et al. 1995), in NIH/3T3 cells (Rong et al. 1995), and, after HGF transfection in mouse cell lines (Brinkmann et al. 1995), indicating that HGF/c-met autocrine signaling could play a role in tumorigenesis.
The existence of the autocrine HGF pathway in liver tumors can also be suggested from the following data. In LEC rats, which are strongly predisposed to hepatitis and liver cancer, HGF was found immunohistochemically in tumor hepatocytes (Nakayama et al. 1995). Furthermore, the co-distribution of HGF and c-met protein in human HCC cells and structures shown here (Figure 3) agrees well with the autocrine mode of HGF action in HCC, specifically, in tumor hepatocytes and HCC-adjacent bile duct cells. HGF production by the latter cells confirms the idea that the liver tumor is a whole-organ disease (Carr and Michalopoulos 1994). The trapping and accumulation of elsewhere produced HGF in tumor hepatocytes seems unlikely because (a) the HGF staining was virtually absent in normal liver tissue (Figure 2a; see also Yoshinaga et al. 1993), and (b) PCR-revealed overexpression of HGF mRNA in HCC compared to normal should be due primarily to tumor cell production, since in HCC (Kanel and Karula 1992) stromal elements are scarce and do not contain lymphocytic infiltration and normal HGF producers (sinusoidal, Ito, and Kupffer cells).
Some data suggest that in cirrhosis, and especially in HCC, “additional” HGF produced by hepatocytes and bile duct cells may act as a motility and invasion factor stimulating tumor spread. On the other hand, HGF can inhibit growth of some tumor cell lines (Tajima et al. 1992) and HCC cells, unlike normal hepatocytes (Liu et al. 1995; Shiota et al. 1992). It is possible that in tumor development and progression HGF acts as a proliferation factor at early stages (e.g., precancerous lesions and predisposing conditions, including cirrhosis), but that later it modulates differentiation and/or motility of tumor hepatocytes (see Selden et al. 1994).
Another proto-oncogene important for liver regeneration, c-myc, was expressed in almost all of the cases studied. Both adenomas and nine of 12 HCC had an apparently higher c-myc expression level than normal and cirrhotic livers. c-myc is usually expressed in liver early after injury and therefore may reflect regenerative or proliferative processes (Hoffman et al. 1994; Fausto, 1990). It has been implicated in tumor progression and metastasis (Fausto 1990; Yokota et al. 1986; Alitalo et al. 1983). In rat liver regeneration, the expression of oncogenes c-fos, c-myc, and c-ras is elevated. This increase in expression often occurs sequentially, with c-fos followed by c-myc and then by c-ras (Moghul et al. 1994; Fausto and Shank 1987).
In our study, high c-myc expression in liver neoplasms correlated with the elevated levels of HGF/c-met gene expression. At present, the significance of these findings is not clear. It is important to understand how c-myc (coding for a nuclear protein maximally expressed at 2 hr after liver injury) (Fausto 1990) and c-met (coding for a cell surface receptor maximally expressed 30 min after injury) (Moghul et al. 1994) could possibly cooperate. Hunter (1991) proposed that in tumors cooperating oncogenes could act to usurp independent signal transduction pathways that would normally be activated by different growth factors. To better understand oncogene interactions, it will be important to define these independent signal transduction pathways and the ones that synergize. The data presented suggest that HGF/c-met system and c-myc could act synergistically in liver tumorigenesis.
The albumin gene was expressed in all normal livers, in nine of 21 cirrhoses, in both adenomas, and in three of 12 HCCs. Reduction of albumin gene expression appears to be associated with loss of hepatocyte function in cirrhosis and with de-differentiation in HCC.
Our findings demonstrate that a sensitive RT-PCR method can be used successfully to study gene expression in archival liver material. Using this technique, we have shown that (a) results obtained from formalin-fixed and fresh-frozen tissues are qualitatively similar, and RT-PCR is a reliable and sensitive tool for retrospective studies; (b) HGF mRNA is not expressed in normal livers and is induced in adenomas and HCC; (c) the elevated expression of HGF/c-met system in HCC correlates with the high expression of c-myc, and tumor hepatocytes have impaired functions (low or absent albumin expression); and (d) the immunofluorescence results correspond to the PCR data demonstrating overexpression of the HGF/c-met system in neoplastic liver tissue. The distribution patterns of HGF and c-met protein are compatible with both autocrine and paracrine mechanisms of HGF action in HCC, as opposed to its paracrine mode of action in normal liver.
Footnotes
Acknowledgements
Supported by NIH grants DK38763–10 (AAD) and EY10056 (SEW) and by a grant from the Cedars-Sinai Research Institute (AAD).