
Abstract
Folding and chromophore cyclization-oxidation processes of green and cyan fluorescent fusion proteins (GFP and CFP) in subcellular microenvironments of transfected C6 glioma cells were studied by multipixel spectrally resolved microscopy (SRM). Discrete time-dependent spectral transitions were characterized during protein folding and chromophore maturation in the cytosol, nucleus, mitochondria, endoplasmic reticulum (ER), and Golgi. Spectral similarity mapping of fluorophore transition phases demarcated spatiotemporal fluorescence correlation at a subcellular level. Folding stages were characterized by a transition from red-shifted spectral populations in the time interval of 7-10 hr after transfection to a fully matured fluorophore emitting typical GFP or CFP fluorescence after 10-15 hr. The nascent protein revealed an initial focal accumulation in cytosol emitting in the range of 580-680 nm. After 10 hr, mixed pixel population spectra were measured and at 15 hr GFP was visualized in the cytoplasm by its specific spectral fingerprints with maxima at 545 nm. For nucleus- and mitochondrion-targeted CFPs, the mature conformer was discovered only in its final destination, whereas intermediate steps of fluorophore synthesis (at 10 hr) were found in the cytoplasm. Enhanced fluorescence maturation was manifested only by the ER-Golgi-targeted CFP after 10 hr post transfection by spectral imaging. Moreover, only remnants of initial intermediate fluorescent pixels were localized externally to the Golgi framework at 15 hr. SRM assessed the competence of ER-Golgi to maintain efficient CFP folding in comparison to the rest of the cellular compartments.
T
At the end of this stage, the GFP acquires its characteristic absorbance and fluorescence properties (Tsien 1998). Although only a hexapeptide domain within the chromophore is responsible for the fluorescence yield of the GFP, the entire structure of the protein is required to protect the chromophore from the collisional quenching of oxygen and water that promotes photobleaching (Cody et al. 1993; Cubitt et al. 1995; Swaminathan et al. 1997). Without such a protection, denatured GFPs or small proteolytic fragments carrying the chromophore are exposed to jostling water dipoles, paramagnetic oxygen molecules, or cis-trans isomerization, and therefore are totally non-fluorescent (Niwa et al. 1996).
The biological applications of GFP can be understood as tagging applications, which utilize GFP as a powerful reporter protein for monitoring of gene expression and protein localization on a real-time basis after insertion of signal sequences into the gene (Chalfie et al. 1994; Cubitt et al. 1995; Kain et al. 1995; Rizzuto et al. 1995; Ormo et al. 1996). Cellular GFP fluorescence competence was used for 1O2-dependent photobleaching measurements (Greenbaum et al. 2000), while kinetic tracing of GFP may serve as a model for protein folding and post-transcriptional chemical stabilization.
GFP has been successfully targeted to almost every major cell organelle. It has been used to demarcate subcellular compartments when fused to host proteins, including plasma membrane, nucleus, endoplasmic reticulum, Golgi apparatus, secretory vesicles, mitochondria, peroxisomes, and phagosomes (Kain et al. 1995; Ellenberg and Lippincott-Schwartz 1999). Therefore, the size and shape of GFP and the differing pHs and redox potentials of such organelles do not appear to constitute any serious barrier. In general, GFP fluorescence reflects levels of gene expression and, at the same time, GFP is a useful substrate for testing chaperone function at various cellular sites because it provides a continuous nondestructive assay for successful folding. Despite the mass of recent data, however, the physicochemical basis of the green fluorescence cannot be regarded as having been fully defined, nor has the role of protein folding in chromophore formation been solved (Tsien 1998). The assembly of synthetic precursor GFP molecules, protein folding kinetics, and chromophore maturation show a time frame of 5-15 hr to reach final conformation (Nishiuchi et al. 1998).
In the present study, protein folding and fluorophore formation were characterized in glioma cells by spectrally resolved microscopy (SRM), combining fluorescence microscopy with Fourier-transform multi-pixel spectroscopy. Four GFP plasmid constructs were targeted to the cytosol, and, in comparison to the cytosolic wild-type, to the nucleus via SV40 T-antigen NLS, to mitochondria via the targeting sequence of subunit VIII cytochrome C oxidase, and to the ER-Golgi compartments via human galactosyl-transferase sequence. Distinctive spectral families were identified during protein synthesis and chromophore formation that were further used for spectral mapping, the results of which point to subcellular time-dependent evolution of the fully matured fluorescence.
Materials and Methods
Cell Culture
Glioma C6 cells were grown on tissue culture plates (Corning; Staffordshire, UK) in a DMEM medium (Biological Industries; Kibbutz Beit-Haemek, Israel) supplemented with 10% fetal calf serum and antibiotics and were incubated at 37C in a humidified atmosphere with 8% CO2. The cells were re-cultured twice a week, using trypsin-EDTA for detachment.
Cell Transfection
For transient transfection, C6 cells were incubated with serum-free medium for 40 min, followed by 6-hr incubation with transfection solution containing 0.65 μg/ml pEGFP-N1 plasmid (Clontech; Palo Alto, CA) and 6.7 mg/ml lipofectamine reagent (GIBCO-BRL; Rockville, MD) in DMEM. Similarly, pECFP-Nuclear Vector of SV40 T-antigen (three tandem repeats) NLS; mitochondrial pECFP-Mito Vector containing the targeting sequence of subunit VIII cytochrome C oxidase and Golgi apparatus pECFP with a targeting sequence from human β1-4 galactosyltransferase were applied to cell cultures for transfection (Clontech). After transfection, the cells were transferred to an enriched medium containing serum and antibiotic. Green fluorescence could be detected 24 hr after transfection (Ausubel et al. 1995).
Spectrally Resolved Microscopy (SRM)
Fluorescence microscopy of GFP expression 5, 10, and 15 hr after transfection was carried out using an Olympus AX70 microscope equipped with a high-pressure mercury lamp for excitation and a set of filters for blue-violet excitation (band path 420-480 nm), a dichroic mirror (455 nm), and a cut-on emission barrier filter >515 nm. Acquisition of images was always performed by using a X100 objective.
The Fourier-transform multi-pixel spectrometry system, SpectraCube SD-200 (Applied Spectral Imaging; Migdal HaEmek, Israel) consists of an interferometer attached to a light microscope and situated in the parallel beam between an objective lens (infinity corrected) and a lens equivalent to an eyepiece, whose purpose is to form an image on a CCD camera. During a measurement (20 sec), each pixel of the CCD (512 × 512) collects the interferogram, which is then Fourier-transformed to give the spectrum (Malik et al. 1996). As a result, spectral imaging acquires a so-called cube whose appellate signifies the two spatial dimensions of a flat sample (x and y), and the third spectrum dimension representing light intensity at any wavelength. The calculated pixel size in a spectral image is 0.04 μm2. The spectral resolution (FWHM, full width at half maximum) is 5 nm at 400 nm (12 nm at 600 nm) and the spectral range (more than 5% response) is 400-1000 nm (Garini et al. 1996). The cells were inspected for less than 1 min at a time to avoid bleaching.
Spectral Similarity Mapping and Spectral Classification
To segregate GFP fluorescence components, we employed the spectral similarity mapping mathematical function, which calculates the differences between area integrals of one chosen spectrum with respect to all the other spectra composing an image. The comparison algorithm used in this work for similarity mapping is defined by the following function:
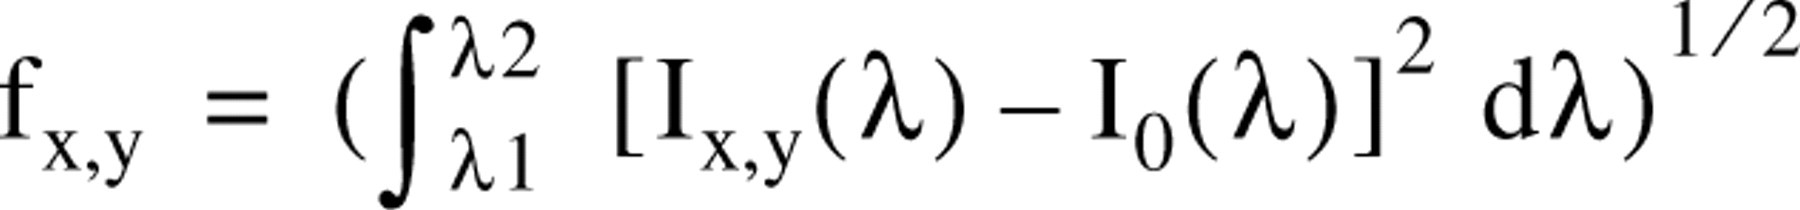
where Ix,y is the spectrum of the pixel of coordinates x and y of the image as a function of λ. The integral stands for an interval over a predetermined spectral range λ1-λ2 and I0 is the spectrum of a reference pixel chosen in a region where the feature of interest is present. The reconstructed similarity map image composed of colored pixels reveals the degree of similarity between the reference spectrum to all other spectra of each pixel composing the image. The brighter the pixel, the more the two spectra are alike (reference to the specific pixel spectrum). By using several reference spectra for similarity mapping and repeating the calculation, a colored image is produced in which each pixel shows its similarity to the reference spectra of the chosen library (Garini et al. 1996).
Results
Initial weak GFP fluorescence detected in the cytoplasm of C6 glioma cells 7 hr after transfection with pEGFP-N1 plasmid was restricted to focal accumulation sites (Figure 1A, a representative cell). The fluorescence spectra of these foci were red-shifted, with a maximum at 630 nm (Figure 1D, 7 hr). After 10 hr, GFP fluorescence increased (Figure 1B), revealing two main pixel population spectra: one confined by a broad fluorescence band with two maxima at 580 nm and at 690 nm, and a second, less intensely fluorescent population with a maximum at 560 nm (Figure 1D, 10 hr). At 15 hr after transfection, GFP fluorescence was significantly amplified, mainly in the center of the cells with a maximum at 545 nm, whereas in the periphery the spectra varied only by their lower intensity (Figure 1D, 15 hr).
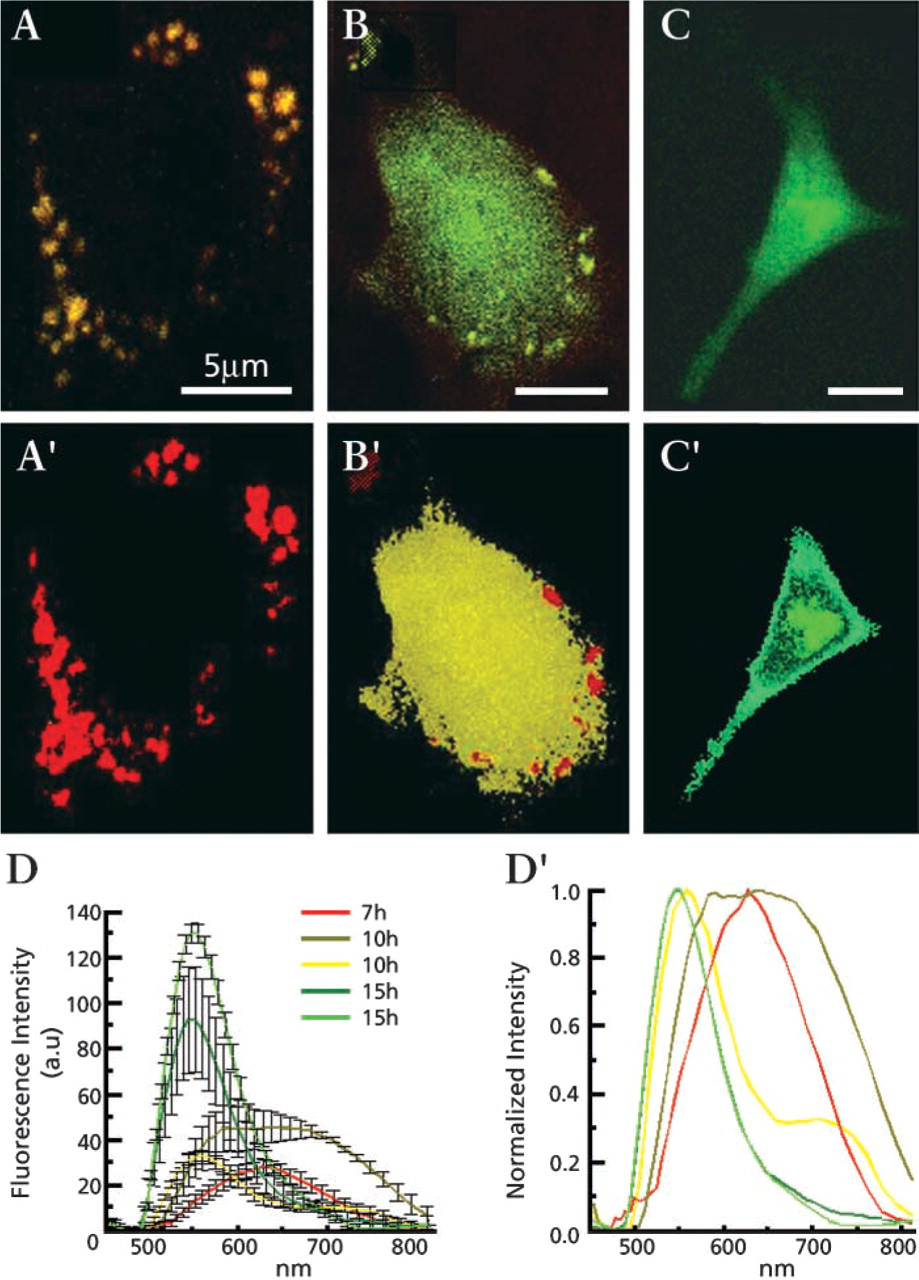
Spectrally resolved fluorescence microscopy of GFP in C6 glioblastoma cells 7
Spectrally resolved microscopy and classification of nucleus-targeted CFP using SV40 T-antigen NLS in C6 cells. Cell fluorescence was imaged 7, 10, and 15 hr after transfection. Representative spectral families were selected and their mean ± SD is presented (Figure 5A) and normalization (Figure 5A′). Using this spectral library for spectral classification, Figures
We applied spectral mapping algorithms to calculate spectral similarities between a chosen spectral library and the other entire pixels of an image followed by reconstruction of classified images (Figure 1A–1C and 1A′-1C′). The steps of this algorithm are as follows. First, we sampled a set of representative spectra (Figure 1D) which were then normalized and designated the “spectral library” (Figure 1D′). Second, for every pixel of the spectral file of a cell (the “cube”), a comparison was made between its measured spectrum and all the spectra of the library. Third, each pixel was identified with the cellular component whose spectrum was most similar to the pixel's spectrum. Fourth, each pixel was displayed in a simulated color previously established as identifying one specific spectral component; the end product was a “classified image.” The spectrally normalized library of Figure 1D′ was applied to spectral similarity mapping of Figures 1A–1C, forming classified spectral images in which each pixel is identified by one of the colors of the spectral library. Figures 1A'-1C' highlight the spatial time-dependent accumulation of GFP in the cells during fluorophore formation and protein folding. The classified spectral images of Figure 1B′ (10 hr after transfection) revealed two types of GFP deposits. These species are spectrally separated but are hardly distinguishable in the original image. Figure 1C′, at 15 hr, shows mature GFP all over the cell, with intensity variations due to local differences in its concentration.
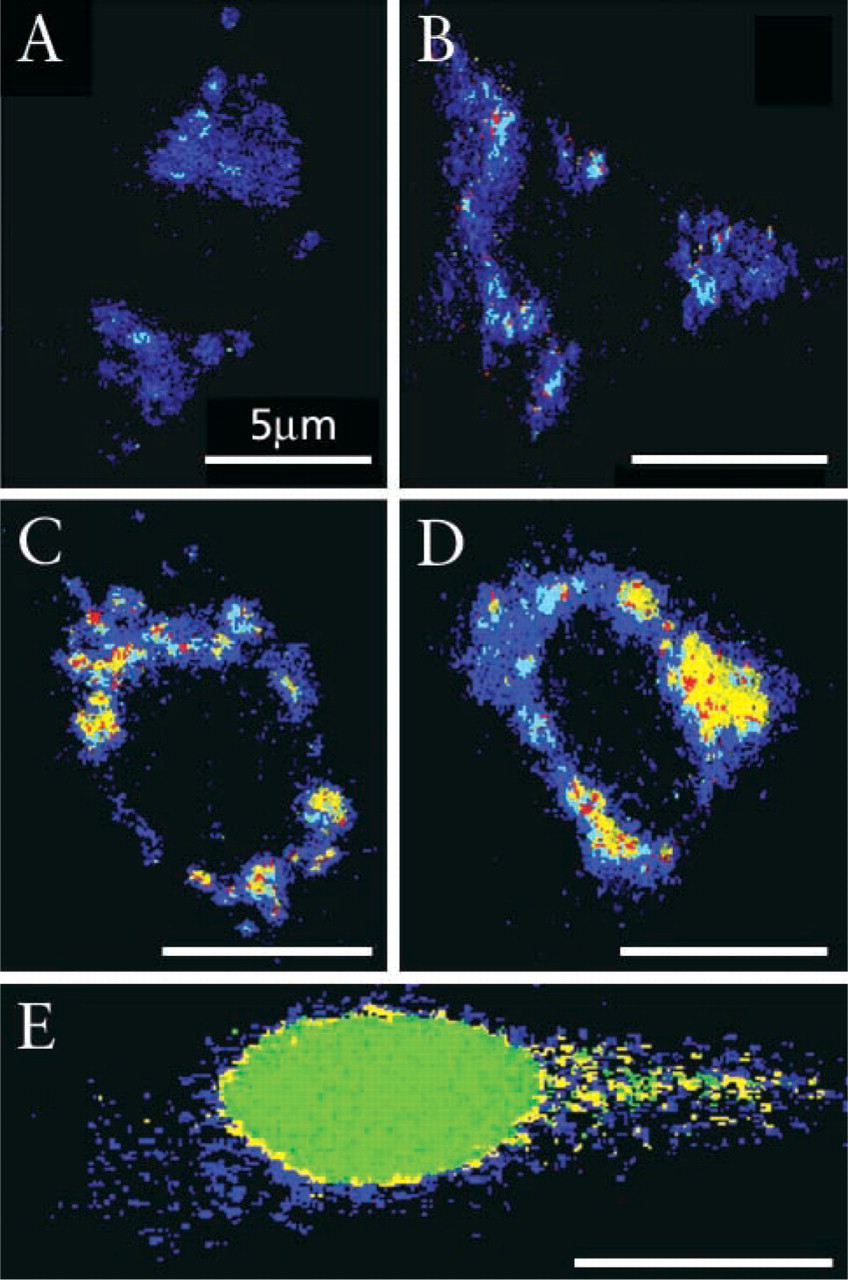
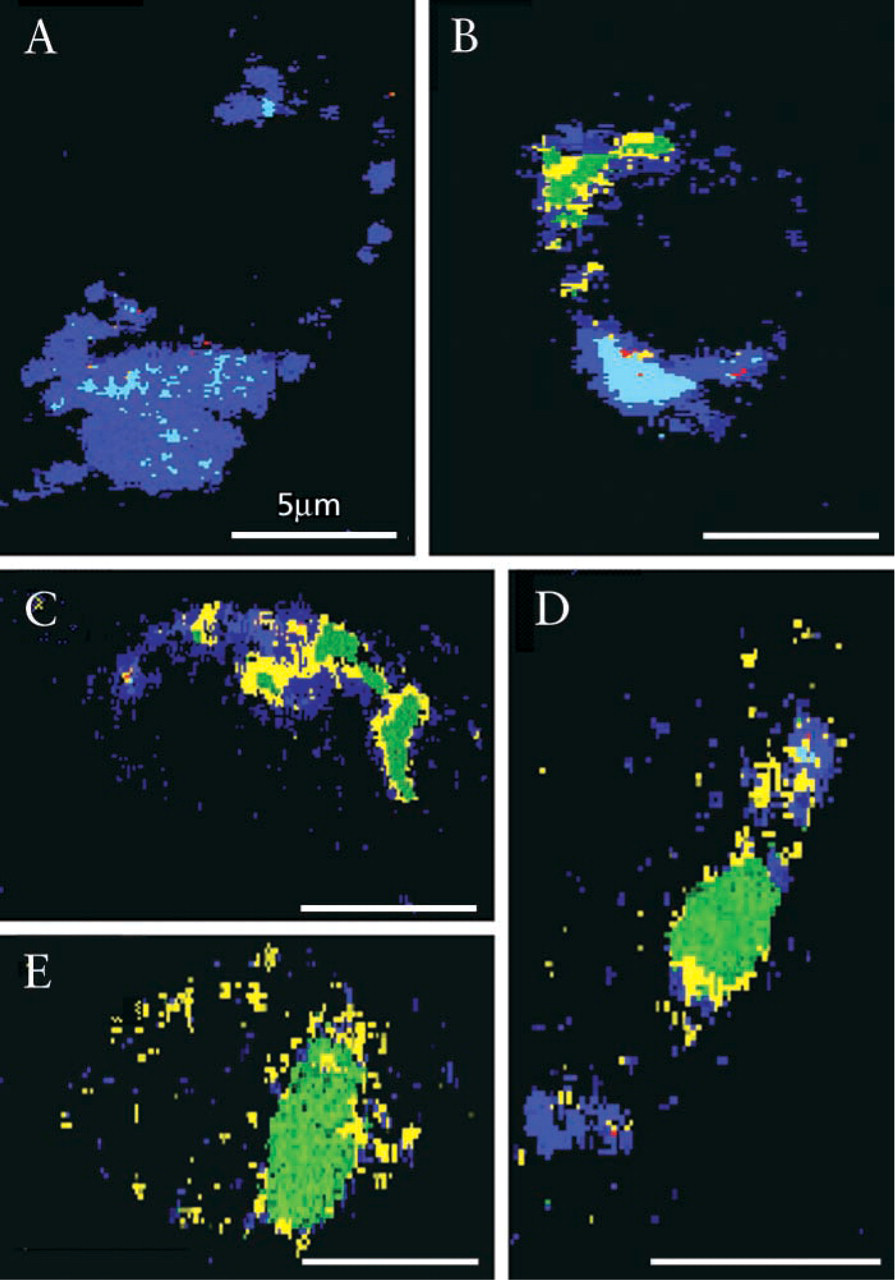
Targeting of nuclear CFP (Figure 2) was induced by transfection with an SV40-nuclear vector inserted into pECFP. The classification images of the transfected C6 glioblastoma cells (at 7, 10, and 15 hr) were recorded and reconstructed. Figures 2A and 2B, classified by using normalized spectra 5A-5A′ imaged 7 hr after transfection revealed primary large cytoplasmic deposits emitting broadband red-shifted CFP species. At 10 hr, cytoplasmic fluorescent patches, with spectral characteristics slightly blue-shifted depicting a minor peak at 560-580 nm, were visualized accumulating in the cytosol (Figures 2C and 2D, classified by using normalized spectra 5A-5A′, 10 hr). Fifteen hours after transfection the nucleus was highly loaded with CFP, revealing intense fluorescence with characteristic spectra of 530 nm (Figure 2E; spectra 5A-5A′, 15 hr). Spectral classification of the images revealed mature folded protein and fluorophore that was restricted to the nucleus, whereas the minor cytosolic CFP fraction showed spectral properties of unfolded chromophore. The perinuclear fluorescence did not signify fully formed CFP fluorophore.
Transfection with the pECFP-Mito vector containing a targeting sequence of subunit VIII cytochrome C oxidase of the C6 glioma cells targeted the CFP to mitochondria. Cytosolic protein synthesis of red fluorescent CFP species was seen after 7 hr (Figure 3A, classification image using normalized spectra 3C, 7 hr calculated from 5B-5B′). Fluorophore intermediate maturation was observed in the cytoplasm after 10 hr (Figure 3B), emitting a mixture of shifted fluorescence (Figures 5B–5B′, 10 hr), with only very slight fingerprint traces depicting fully mature chromophore. Folded mature CFP of 530-nm fluorescence was detected only in mitochondria restricted to the last post transfection time lapse (Figures 5C and spectra 5B-5B′, 15 hr).
CFP targeting to ER-Golgi was carried out with the pECFP plasmid carrying the human β 1,4-galactosyl-transferase sequence by transfection. Seven hr after transfection of the C6 cells, red-shifted CFP species occupied most of the cytosol (Figure 4A, classified by using normalized spectra Figures 5C–5C′, 7 hr). Spectra shown in Figures 5C–5C′, acquired after 10 and 15 hr post transfection, reveal four populations with maxima in the range of 530-630 nm. Blue-shifted fluorescence bands begin to be detected in the cells very early after 7 and 10 hr post transfection, concentrated in narrow elongated arches (Figures 4B and 4C, respectively, classified by spectra 5C-5C′, 10-15 hr). The transitory organelles depicted in Figure 4C are most likely endoplasmic reticulum or early Golgi envelopes, emitting typical fluorescence at 545 nm.
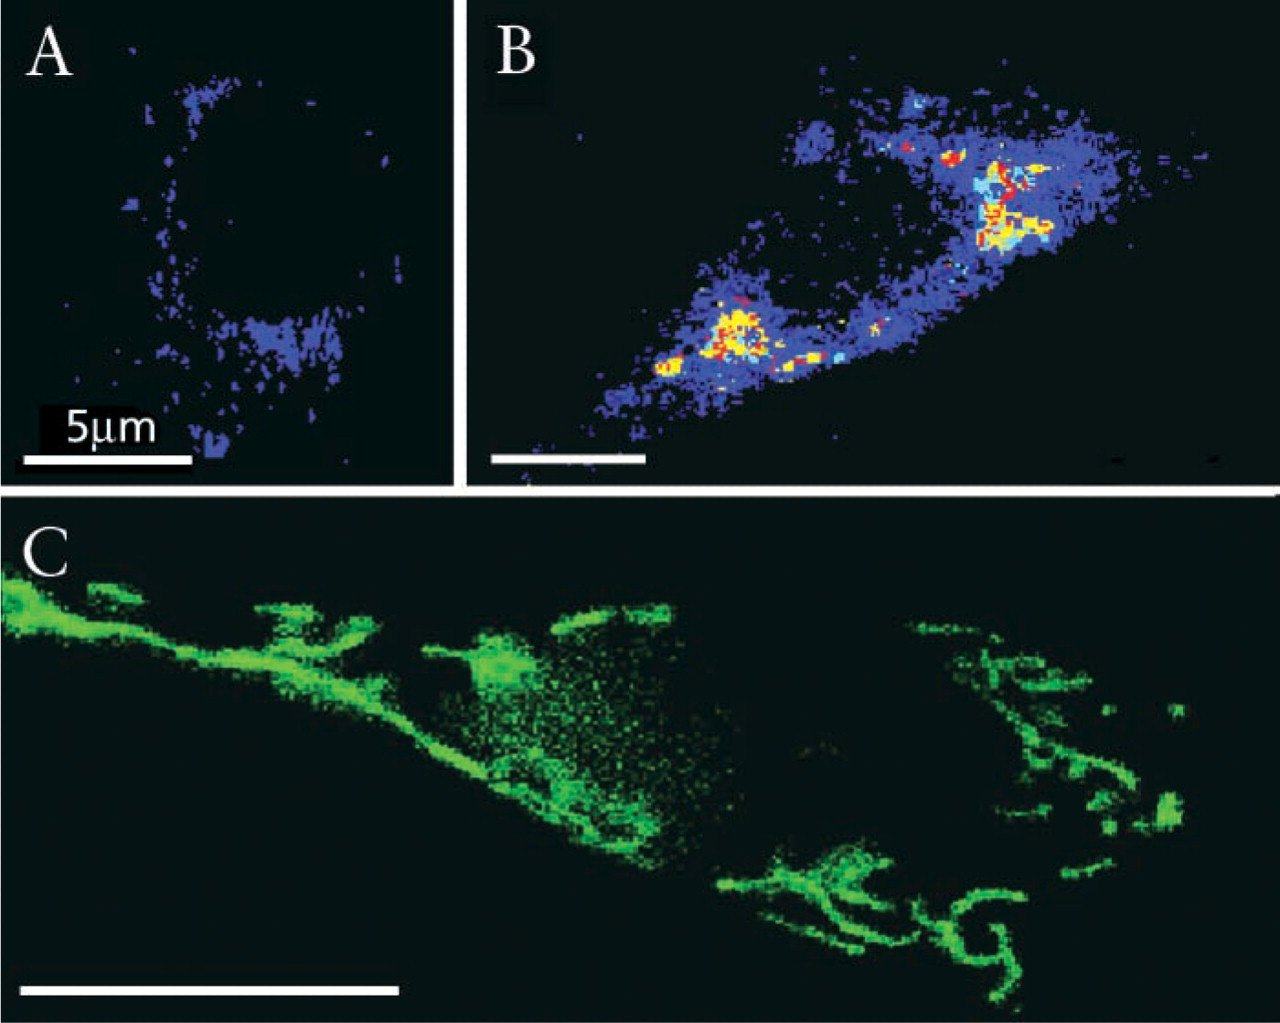
Spectrally resolved microscopy and classification of mitochondrion-targeted CFP using subunit VIII cytochrome C oxidase signal sequence after 7, 10, and 15 hr after transfection in C6 cells. Cell fluorescence was imaged, representative spectral families were selected, and their mean ± SD is presented in Figure 5B and normalization in Figure 5A′. Using this spectral library for spectral classification, Figures 5A–5C were produced, in which each pixel is assigned one of the colors of the spectral library of Figure 5B′.
At 15 hr, the third time, most of the fluorescence was seen in a central cytoplasmic domain, probably representing the Golgi compartment (Figures 4D and 4E), characterized by the dominant 535-nm spectral population (Figures 5C–5C′, 15 hr) reflecting a majority of mature CFP fluorophores.
Discussion
Spectrally resolved microscopy of GFPs targeted to four different subcellular compartments in the C6 glioblastoma-transfected cells revealed a time-dependent process of protein synthesis, folding, and chromophore maturation. As a general phenomenon, early granular cytosolic deposits of GFP emit red-shifted fluorescence 7 hr after transfection. The appearance of red-shifted GFP spectra was described to be a result of chromophore photoactivation (Elowitz et al. 1997) Throughout this post-transfection interval, three major biochemical processes take place: synthesis of GFP mRNA, translation of the polypeptide and, lastly, protein folding. The newly formed GFPs are the result of post-translational amino acid modification, involving meticulous chemical reactions of chromophore oxidation and cyclization, which were evident during the time interval of 7-15 hr after transfection. In parallel, specific GFP organelle-targeting and translocation processes were visualized at 10-15 hr after transfection.
Among the factors affecting the detectability of GFP, the major factor is the efficiency of the post-translational modification of internal chromophore formation. This modification was shown to be dependent on several factors, including the availability of cellular chaperones, hindrance to folding induced by unspecific binding to host proteins, solubility vs aggregation, and chemicophysical determinants such as temperature and availability of O2 affecting the rate of cyclization/oxidation (Reid and Flynn 1997). Moreover, the extinction coefficient and fluorescence quantum yield of GFP in a subcellular microenvironment is subject to the state of protein dimerization, photoisomerization, and bleaching (Tsien 1998). For fluorescent proteins, it has been demonstrated that excitation spectral changes are a function of protein aggregation due to local high protein concentration (Ward and Bokman 1982).
Spectrally resolved microscopy and classification of Golgitargeted CFP using galactosyltransferase signal peptide after 7, 10, and 15 hr post transfection in C6 cells. Cell fluorescence was imaged, representative spectral families were selected, and their mean ± SD is presented in Figure 5C and normalization in Figure 5C′. Using this spectral library for spectral classification,
Unlike conventional microscopy, SRM can discriminate minute spectral differences using the spectral mapping algorithms. The power of the spectral similarity mapping algorithms, based on spatial-spectral differences, was in the delineation of the entire step-by-step subcellular protein translocation reactions with simultaneous monitoring of the maturation status of the chromophore. Therefore, spectral shifts from red green and blue of the GFPs during the late post-translational modifications, uncovered by SRM, clearly demarcated subcellular compartments that were involved in the chromophore maturation process. SRM also made possible the depiction of transitional vesicular elements in the ER-Golgi cistern a pathway, using images that can be resolved by conventional microscopy only when using a set of narrow-band filters is used.
The main concern when conventional microscopy is used is the transformation of a 3D cell into a 2D flat image caused by the superimposition of cell structures, a problem that can be resolved to some extent by confocal microscopy. Spectrally resolved microscopy has the same drawback, with the results showing spatial mixtures of shifted pixel spectra, which most probably are due to 3D superimposition. Even when this limitation is taken into consideration, the spectral classification images reveal borders of small ER-Golgi trafficking elements from the background cytoplasmic fluorescence.
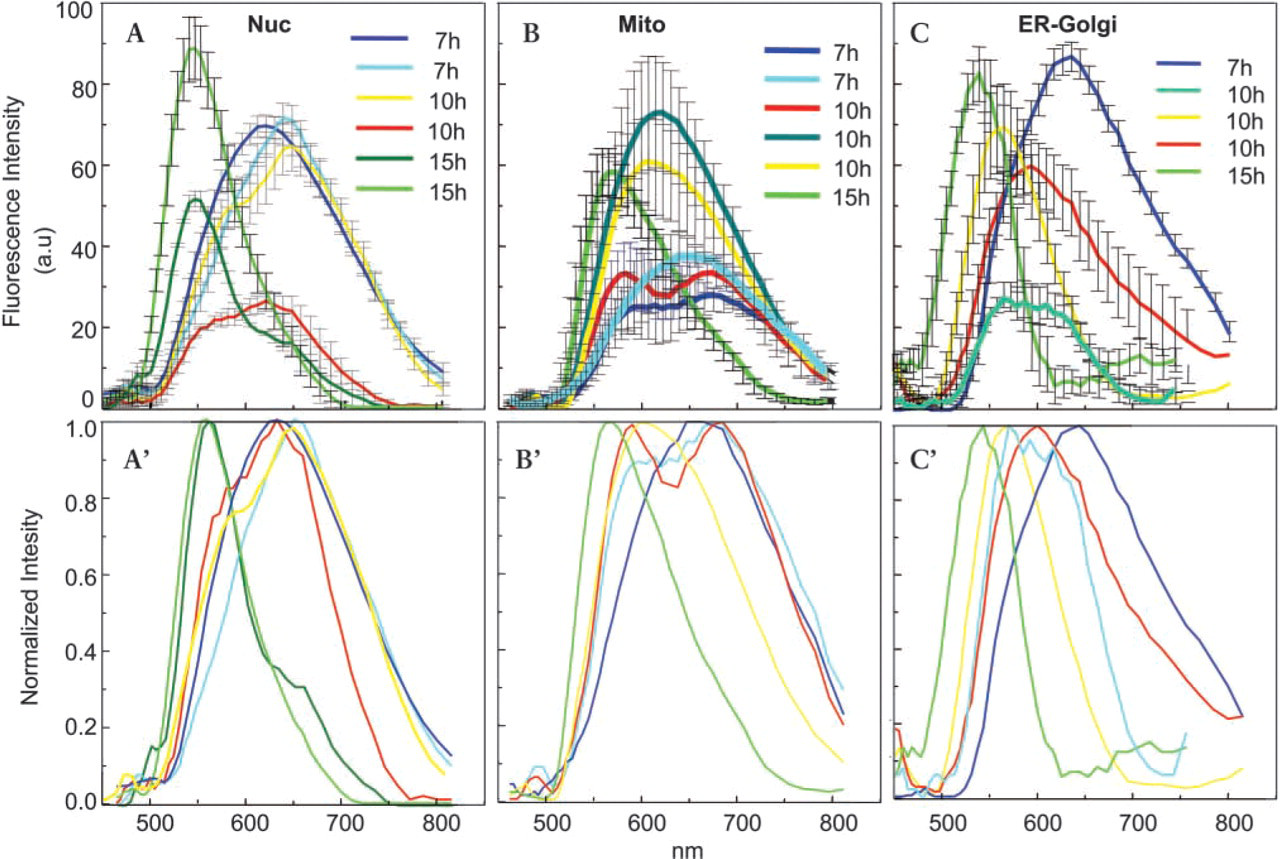
Fluorescence spectra of nucleus-, mitochondrion-, and Golgi-targeted CFP analyzed by Fourier-transformed multi-pixel spectroscopy using the SpectraCube system of the cells in Figures 2–4. Cell fluorescence was imaged after 7, 10 and 15 hr. Representative spectral families (different colors) were selected and their mean ± SD is presented (
Early red-shifted fluorescence of GFP species were described under anaerobic environment conditions and intense illumination (Elowitz et al. 1997). Under such conditions chromophore oxidation could not be accomplished. The appearance of initial GFP foci, emitting red-shifted fluorescence rather than diffuse signals in the cytosol 7 and 10 hr after transfection (Fig 1A′ and 1B′), can be attributed to aggregation effects of the nascent polypeptide during its synthesis in the highly crowded macromolecular environment. Protein synthesis is a considerably slower process than formation of collapsed intermediates, which could bury hydrophobic aggregation-prone stretches of the nascent chains away from the solution. The rate of chain elongation in eukaryotes is approximately 4 amino acids/sec, and therefore a polypeptide of 250 residues would require more than 1 min for its synthesis. Identical GFP chains synthesized on neighboring ribosomes in a polysome may be especially prone to aggregation. Thus, the release of nonnative polypeptides into the cytosolic solution might lead to formation of aggregates (Frydman 2001).
The cellular chaperone machinery is specifically recruited to bind to ribosomes, and it protects nascent chains and folding intermediates from non-productive interactions. The quality control mechanisms in the ER ensure the structural integrity of proteins delivered further to the Golgi and the secretory pathways. Folding of ER proteins is generally coupled to disulfide bond formation and other post-translational modifications, and therefore certain ER chaperones are specialized to assist in these processes (Frydman 2001). Therefore, earlier detection of fully folded ER targeted CFP emitting its mature spectrum seen clearly after only 10 hr post transfection can be interrelated to the chaperone-rich environment in the ER.
In contrast, mitochondrion-targeted CFPs emit the typical matured fluorescence only after translocation, which initiates final folding of organelle (Figure 3C′). The folding of the nucleus-targeted CFP is expected to have kinetics of protein folding and chromophore formation similar to those of the cytosolic GFP, which is clearly shown in Figure 2C′. Mitochondrial protein import can occur post-translationally in vitro, but in vivo there is evidence that co-translational import is possible. From the present results, one can deduce that mitochondrion targeted CFP is imported only by the post-translational mechanism. It has been confirmed that proteins to be imported are unfolded on the outside with the help of chaperones (cytoplasmic HSP70) and that matrix proteins are also first received by a matrix HSP70 chaperone and then delivered to a large chaperonin complex composed of HSP60 and CPN10 peptides. The latter assists in proper folding and assembly to the native functional structure. There are two distinct TIM complexes, TIM23 for import of soluble matrix proteins and TIM2 for import and membrane insertion of integral inner membrane proteins with multiple transmembrane helices (Bauer et al. 2000).
Now that many of the folding steps have been kinetically defined, the contribution of chaperones and chaperonins to the rates and extent of fluorescence are likely to be measured using combined transfection and expression of these factors in cytosol and organelles. The mechanisms of successful protein folding and further post-translational modifications in subcellular microenvironments are particularly critical questions of concern regarding most proteins. Our present finding makes SRM, in combination with future confocal optics, a useful substrate for testing these effects.