
Abstract
We used intensity and fluorescence lifetime microscopy (FLIM) of 3T3 nuclei to investigate the existence of AT-rich and GC-rich regions of the nuclear DNA. Hoechst 33258 (Ho) and 7-aminoactinomycin D (7-AAD) were used as fluorescence probes specific for AT and GC base pairs, respectively. YOYO-1 (Yo) was used as a dye that displays distinct fluorescence lifetimes when bound to AT or GC base pairs. We combined fluorescence imaging of Ho and 7-AAD with time-resolved measurements of Yo and took advantage of an additional information content of the time-resolved fluorescence. Because a single nucleus could not be stained and measured with all three dyes, we used texture analysis to compare the spatial distribution of AT-rich and GC-rich DNA in 100 nuclei in different phases of the cell cycle. The fluorescence intensity-based analysis of Ho- or 7-AAD-stained images indicates increased number and larger size of the DNA condensation centers in the G2/M-phases compared to G0/1-phases. The lifetime-based study of Yo-stained images suggests spatial separation of the AT- or GC-rich DNA regions in the G2/M-phase. Texture analysis of fluorescence intensity and lifetime images was used to quantitatively study the spatial change of condensation and separation of AT- and GC-rich DNA during the cell cycle.
Keywords
F
In this study we combined steady-state fluorescence imaging of the nuclear DNA with FLIM to take advantage of the information content of the time-resolved fluorescence. Specifically, we used Hoechst 33258 (Ho) and 7-aminoactinomycin (7-AAD) as AT-and GC-specific stains, respectively (Netzel et al. 1995), to look for AT-rich and GC-rich regions of DNA in 3T3 nuclei at various stages in the cell cycle. Because these dyes show similar lifetimes in both AT-and GC-rich regions (Lakowicz 1999b; Murata et al. 2000a,2001), we used the fluorescence intensity to obtain spatial information on AT- and GC-rich DNA condensation in nuclei. In addition, we examined nuclei stained with YOYO-1 (Yo), an intercalating nonspecific dye that shows base pair-dependent decay times. Yo displays lifetimes of 1.5 and 4.1 ns when bound to (dAdT)10 or (dGdC)6, respectively (Sailer et al. 1997). For Yo we used FLIM in an attempt to identify spatial separation of AT- and GC-rich DNA instead of condensation of DNA.
One approach to looking for AT- or GC-rich regions of DNA would be to examine the same nuclei stained with each of the three dyes. For such an experiment one expects the relative brightness of 7-AAD and relative lifetime of Yo to spatially coincide and locally bright regions of Ho-stained cells to coincide with relative minima of the Yo lifetimes. However, it was not feasible using our methodology to label the nuclei with the three probes and image the intensities and lifetime of each probe. Therefore, we adopted an alternative approach. We used texture analysis (Hara-lick et al. 1973; Tzay and King-Sun 1986; Cecile et al. 1999; Murata et al. 2001) to characterize the spatial distribution of intensities and lifetimes in 300 nuclei, where each 100 of cells was stained with one of the three probes. The results of our texture analysis were interpreted in terms of the spatial distribution and separation of base pairs in the nuclei.
Materials and Methods
Cells and Culture Conditions
Mouse fibroblasts (3T3 Swiss albino) were grown at 37C in glass-bottomed dishes (Mat Tek; Ashland, MA) containing Dulbecco's modified Eagles's medium with 10% calf serum.
Fixation and Cell Staining
The cells in the dishes were fixed in 70% ethanol (4C for at least 30 min). After rinsing, the cells were stained with 0.4 mM Ho, 10 mM 7-AAD, or 0.5 mM Yo. All the experiments were carried out at room temperature in 10 mM Tris-HCl buffer, pH 7.5, containing 100 mM NaCl. All these probes were obtained from Molecular Probes (Eugene, Oregon).
Measurement of Fluorescence Intensity and Lifetime Imaging
All fluorescence imaging experiments were done on a homo-dyne frequency-domain instrument based on the Zeiss Axiovert 135TV inverted fluorescence microscope. The Ho fluorophore was excited at 335 nm by a frequency-doubled output from the synchronously-pumped DCM dye laser. The Yo and 7-AAD were excited by an output of the mode-locked Ar+ laser at 514.5 nm. The pulsed laser excitation was directed to the microscope by a quartz optical fiber which was continuously shaken during data acquisition to randomize the excitation light field. The microscope worked in the epi-illumination mode and was equipped with the Zeiss C-Apochromat ×40/1.2 water immersion objective and a ×1.6 Optovar insert. The Zeiss FT 395, Omega 515DLRP, and Omega 595 DRLP dichroic mirrors were used for Ho, Yo, and 7-AAD, respectively. Fluorescence from the sample was isolated by broad-band interference filters Omega 450DF65, Intor 550/40, and Omega 635DF55 for Ho, Yo, and 7-AAD, respectively. The sample emission was directed to the Hamamatsu C5825 high-speed image intensifier and registered by the Photometrics PXL scientific-grade, slow-scan, cooled CCD camera. The correct focus was adjusted on the nuclear margins. For time-resolved experiments with Yo, the gain of the image intensifier was modulated at 75.468 MHz using an output of the PTS 300 synthesizer phase-locked to the master oscillator of the pumping Ar+ laser mode locker. Eight images, with the detector phase equally spaced over 360°, were acquired for each lifetime measurement. Data were analyzed by a method described elsewhere (Lakowicz and Berndt 1991; Lakowicz et al. 1994). During the steady-state experiments with Ho and 7-AAD, the modulation of the intensifier was turned off. Because of a high gain of the image intensifier, the illumination level of the sample was attenuated by neutral-density filters to the level that no detectable photobleaching was observed for Ho and Yo stains. The antifade reagent β-mercaptoethanol in the concentration of 1 μl/ml was added to the samples stained by 7-AAD to decrease the extent of photobleaching well below 0.5% during the acquisition of the images. The acquisition times of the individual images were adjusted to be about a second for each of the three dyes. To correct for any possible long-term excitation intensity drifts, the fraction of the excitation light separated by a beam splitter was continuously monitored by a power meter. This was especially important for the cell cycle analysis when the steady-state fluorescence intensity was used to evaluate the total amount of the DNA in the nucleus. Histograms of the integrated fluorescence intensities from 100 nuclei were constructed and a position within the cell cycle was assigned to each cell, depending on the amount of DNA detected by the steady-state fluorescence intensity.
Cell Cycle Analysis
The fluorescence intensity of each nucleus is related to the amount of DNA in the nucleus. We measured the total fluorescence intensity emitted from the nuclei and constructed DNA histograms for the cell cycle analysis.
Texture Analysis of Fluorescence Intensity and Lifetime Imaging
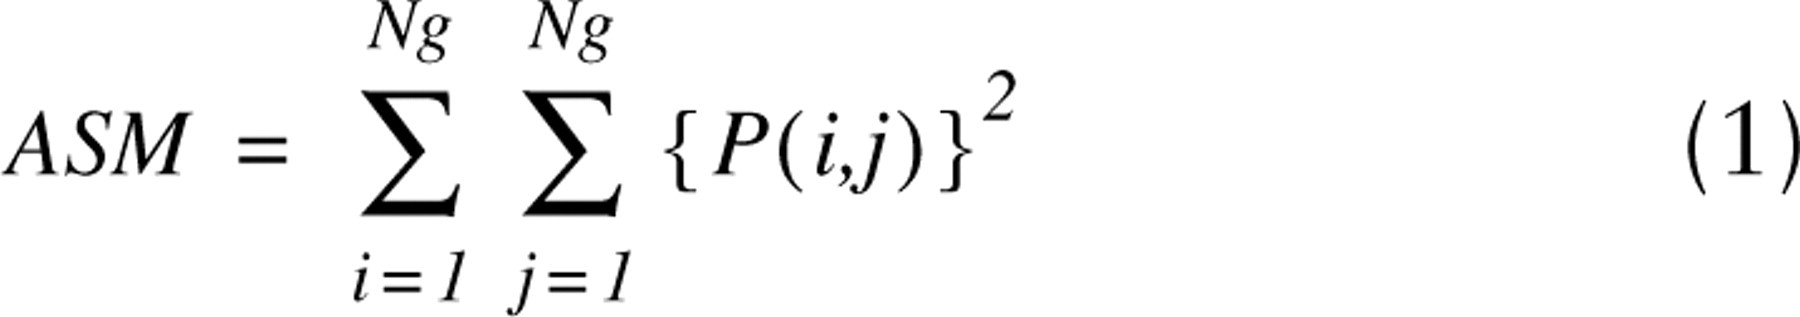
The fluorescence intensity images of 100 cells stained with Ho and 7-AAD and lifetime images of 100 cells stained by Yo were measured. A texture of the images was characterized by texture parameters that were calculated from cooccurrence matrices P(i,j) (Haralick et al. 1973; Tzay and King-Sun, 1986; Murata et al. 2001). The matrices were constructed from 8-bit gray-level images after their normalization to the same average pixel values. For practical purposes, we selected from all possible texture parameters only three parameters that are independent of nuclear size and shape. The parameters are also independent descriptors of fluorescence intensity images and lifetime images. The selected parameters are the angular second moment (ASM, Eq. 1), which characterizes image homogeneity, the sum variance (SVar, Eq. 2), which reveals image heterogeneity, and the difference variance (DVar, Eq. 3), which describes contrast of the image:
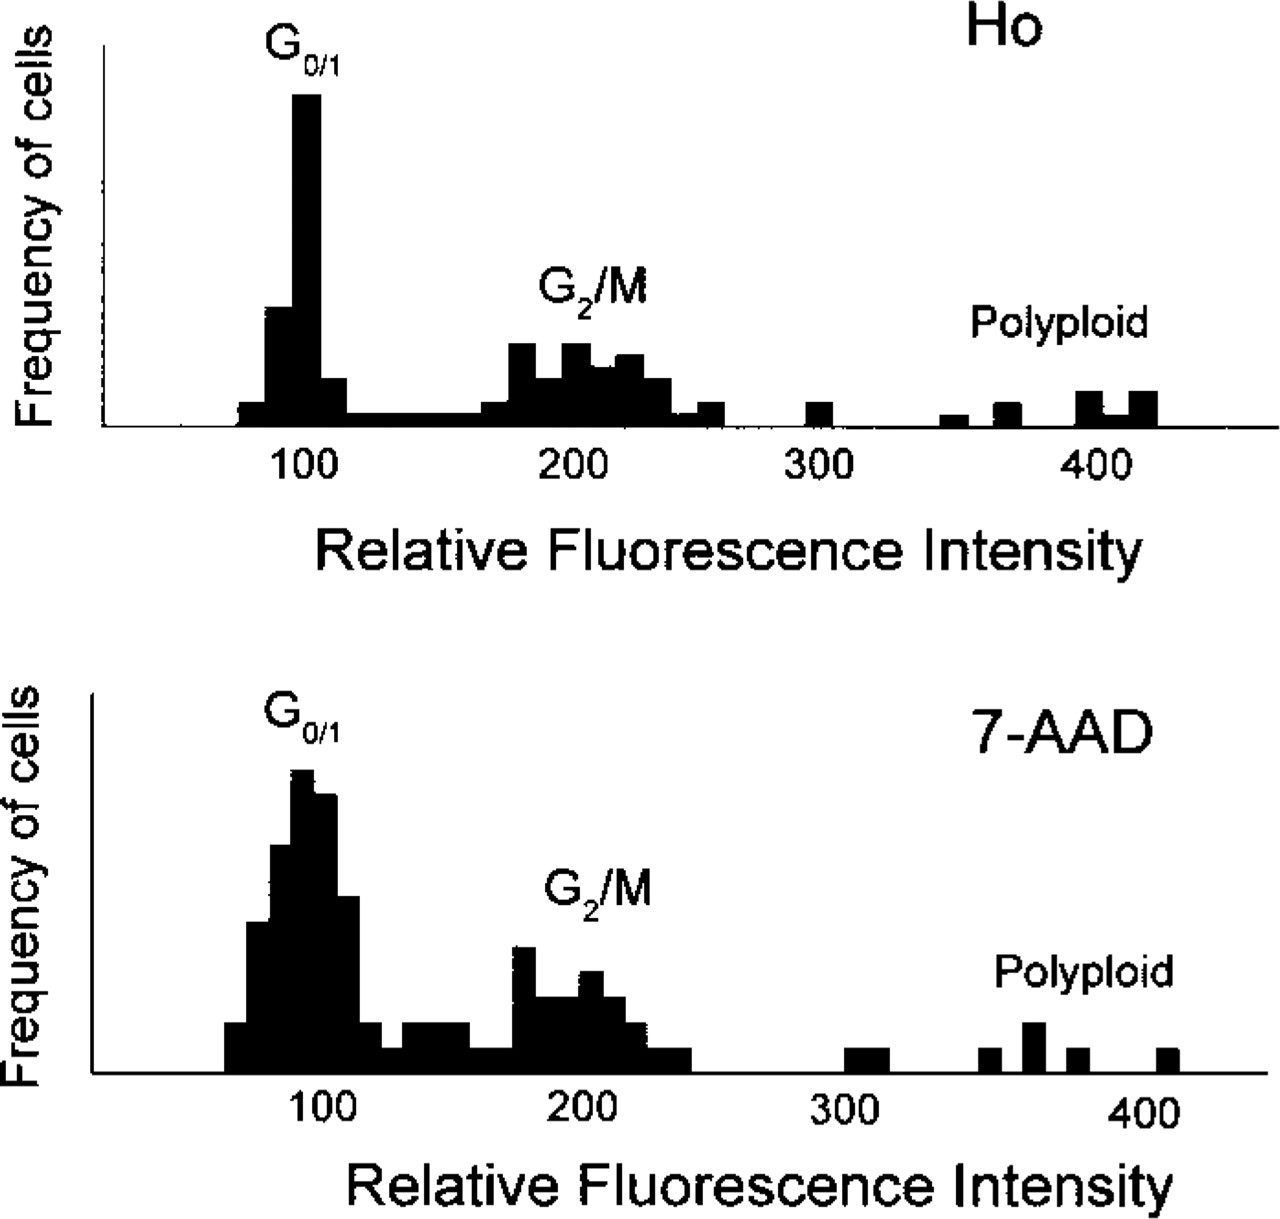
DNA histograms obtained from the fluorescence images of 100 nuclei stained with Ho and 7-AAD.
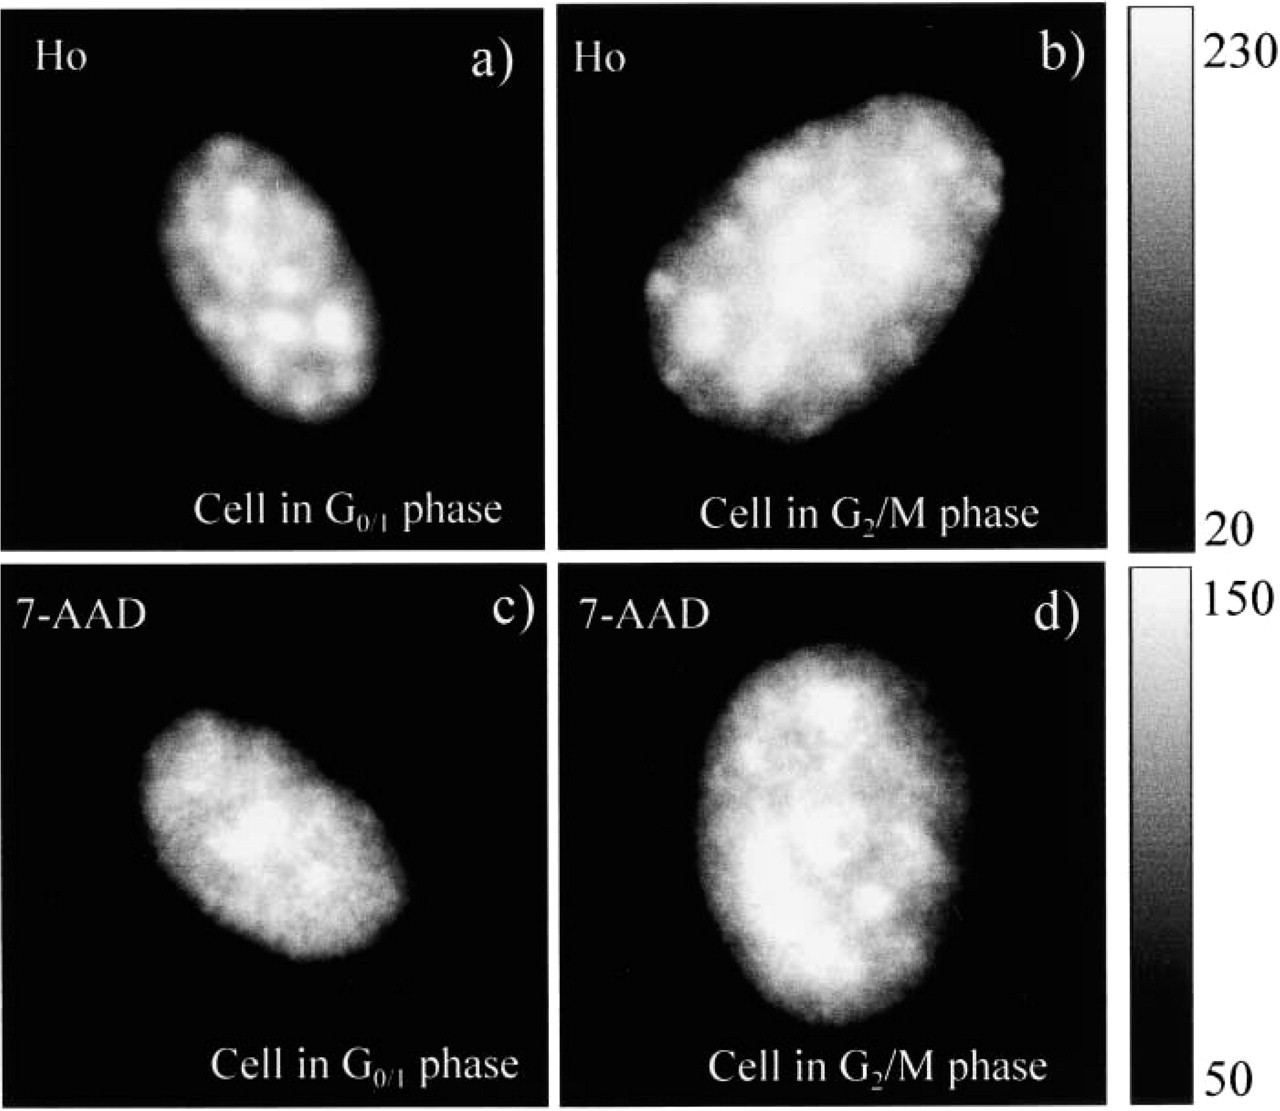
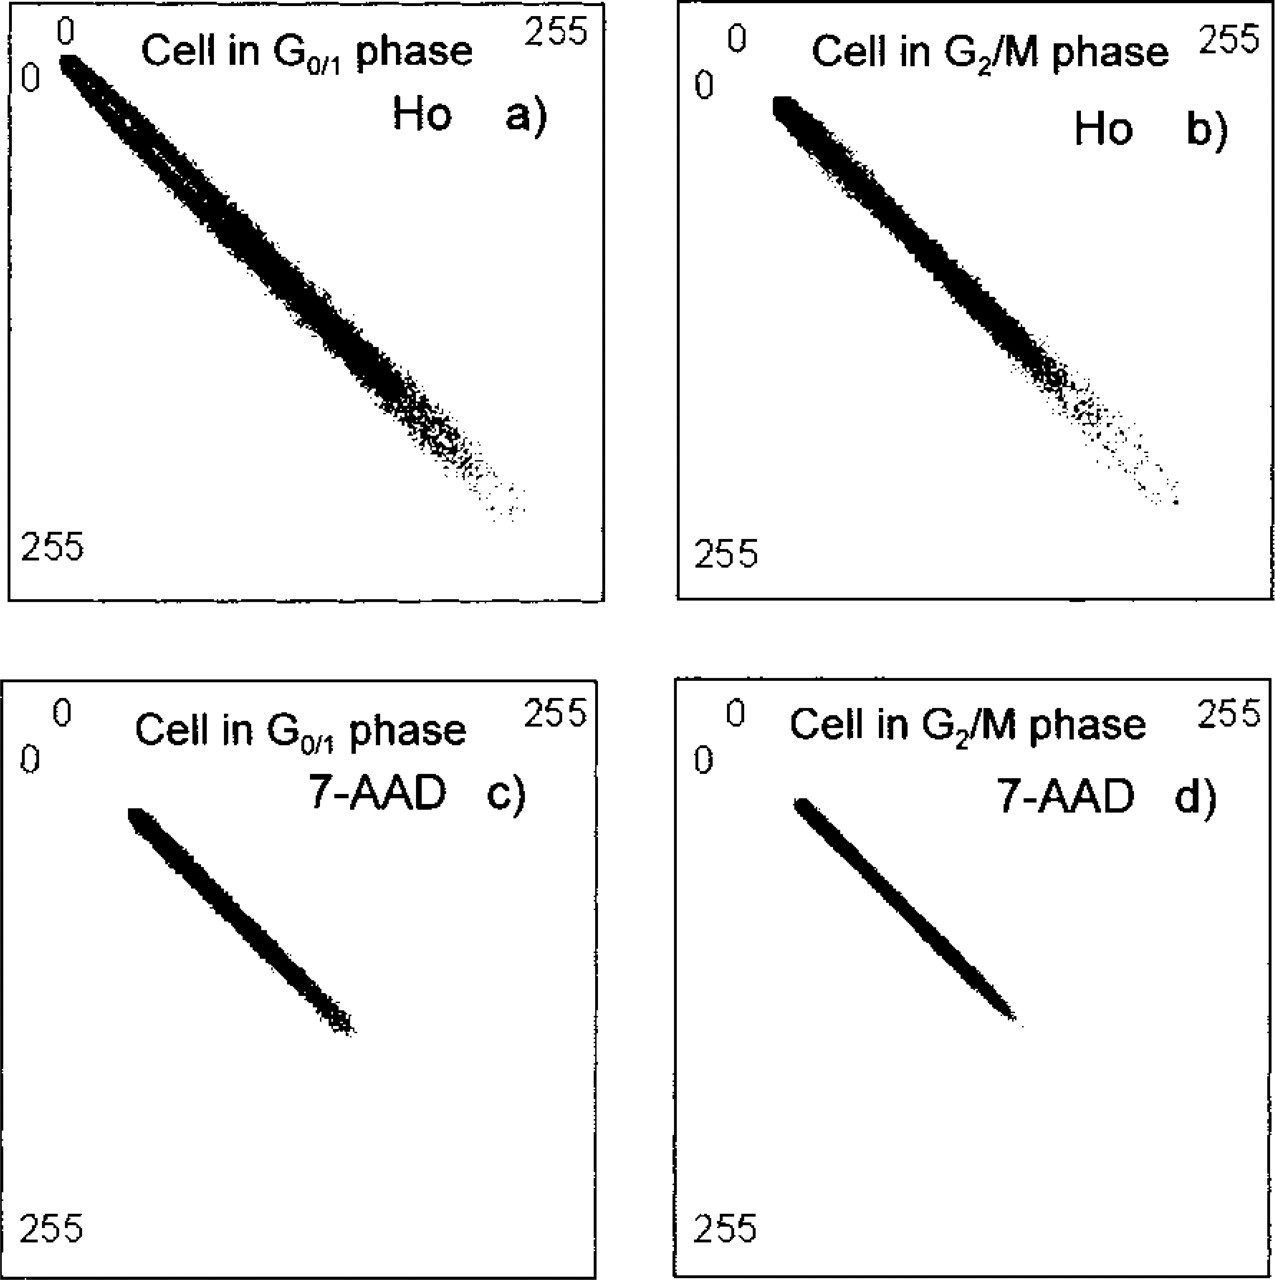
Fluorescence intensity images of nuclei in G0/1 and G2/M-phases stained by Ho and 7-AAD. Pixel values of the background were set to 0. The bright spots in the
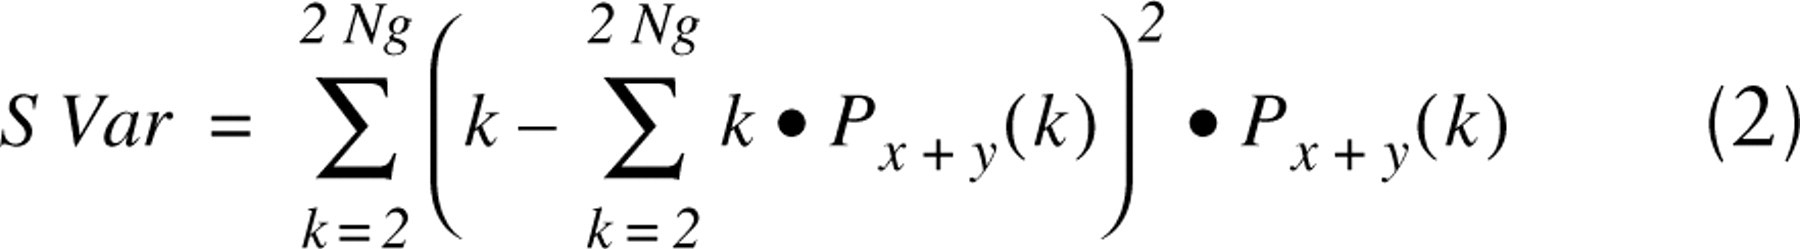
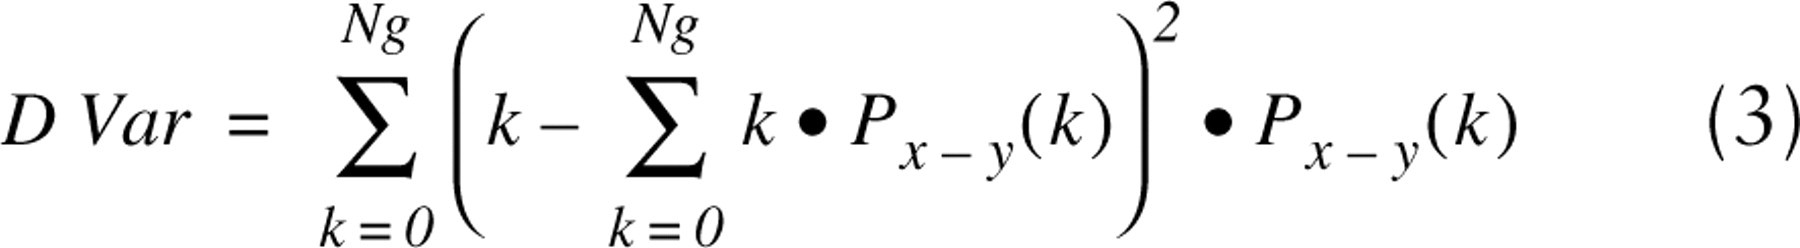
The terms Px+y(k) and Px-y(k) are defined as follows:
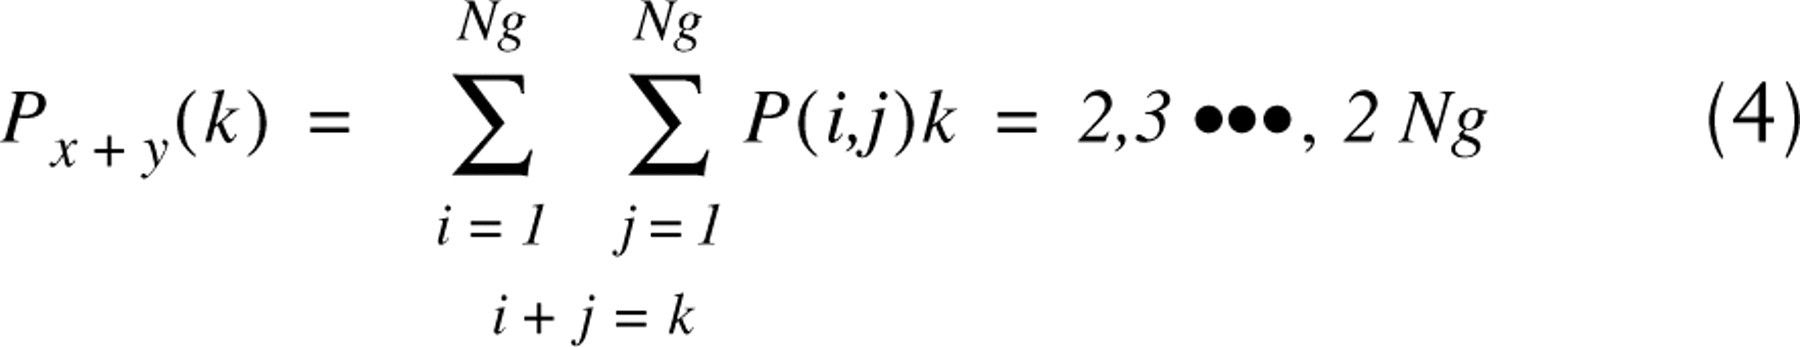
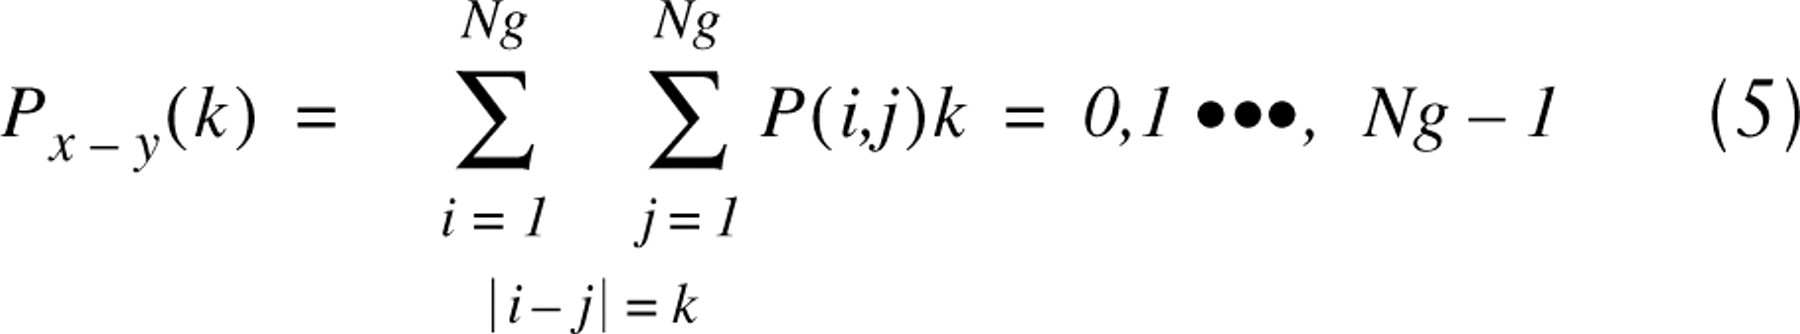
where P(i,j) is the (i,j)-th entry in a normalized gray-tone spatial-dependency matrix (co-occurrence matrix) and Ng is the number of distinct gray levels in the image. The parameters (ASM, SVar and DVar) were calculated for every nuclear image from the ensemble of 100 stained cells. In particular, we calculated mean value of the texture parameter by averaging values obtained from four angular co-occurrence matrices constructed for angles 0, 45, 90, and 135°. A one-pixel correlation distance was used for construction of the matrices.
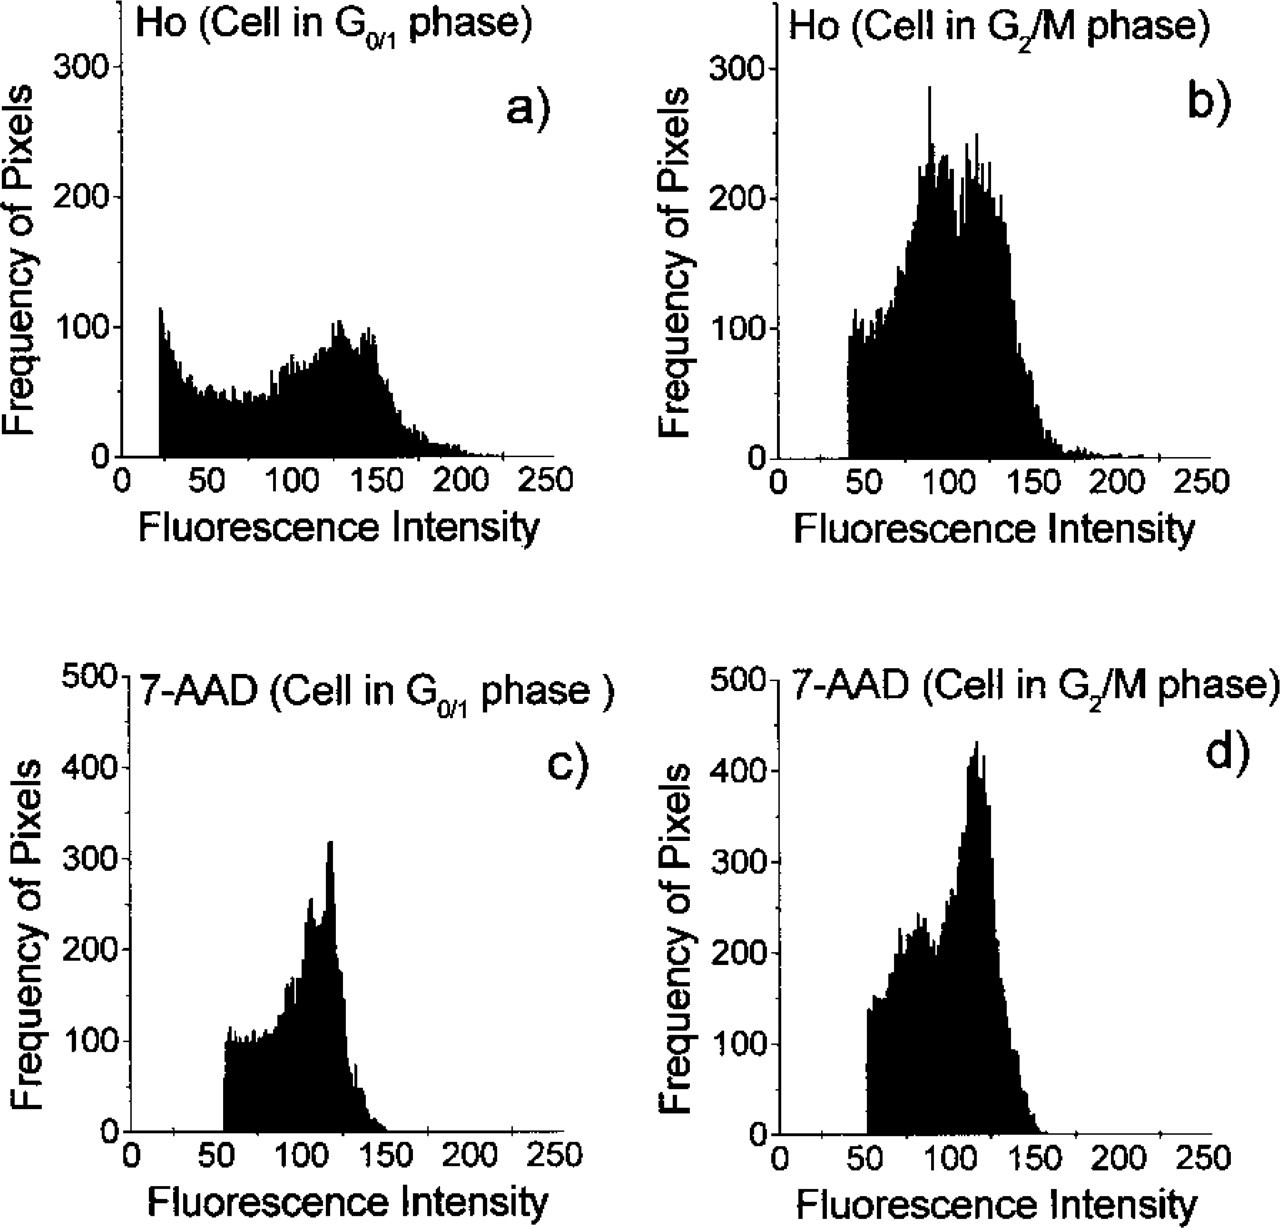
Histograms of fluorescence intensity images from a cell stained with Ho or 7-AAD. Histograms
Co-occurrence matrices of fluorescence intensity images from cells stained with Ho or 7-AAD. The co-occurrence matrices were constructed from the images normalized to the same average intensity. The co-occurrence matrices
Results
Three different fluorescent DNA probes were used to study cell cycle-dependent changes of the DNA distribution pattern in nuclear DNA of 3T3 fibroblasts. The Ho and 7-AAD were chosen for their ability to specifically bind and strongly fluoresce in the AT- and GC-rich regions of DNA, respectively (Sailer et al. 1997). Because the lifetimes of both Ho and 7-AAD are insensitive to the DNA composition and the lifetime images are expected to be flat (Lakowicz 1999b; Murata et al. 2000a,b; Murata et al. 2001), these dyes were used for the steady-state fluorescence intensity imaging of the AT- and GC-rich regions of nuclear DNA. Information on the DNA configuration obtained by the intensity imaging was compared to the results of the lifetime image analysis of the nuclei stained with the nonspecific dye Yo, which is known to have different binding modes and different lifetimes in AT and GC base pairs (Netzel et al. 1995).
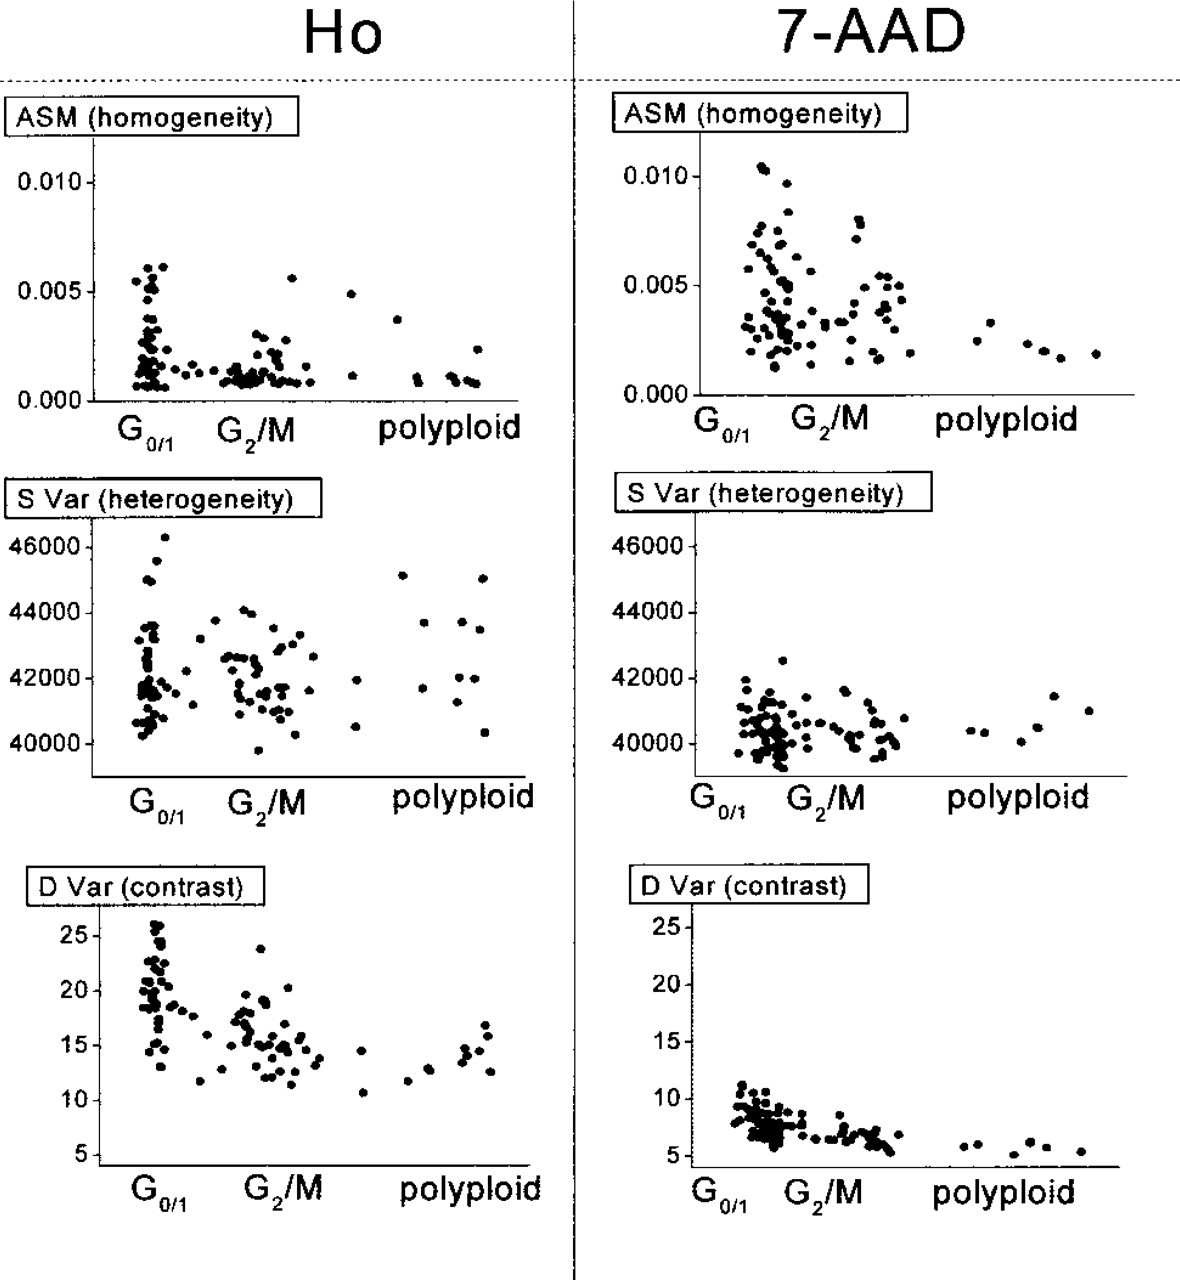
Results of the texture analysis performed on the fluorescence intensity images of 100 nuclei stained with Ho and 7-AAD. The analyzed images were normalized to the same average intensity. The scattergrams show the relation between texture analysis parameters and the cell cycle.
Fluorescence Intensity Imaging of Ho and 7-AAD
Figure 1 shows a histogram of integrated fluorescence intensity originating from the cell nucleus for an ensemble of 100 cells. The histogram clearly shows two distinct peaks. Because the total fluorescence intensity is proportional to the DNA content, which varies during the cell cycle, the peaks can be assigned to cells in the particular stage of the cell cycle. For simplicity, the peak with the lowest intensity belongs to the cells in the G0/1-phase, which possess a single set of chromospheres. The second peak, with approximately doubled fluorescence intensity, belongs to the cells in the G2/M-phase, which contain double the amount of DNA. Cells with even higher fluorescence intensity are anomalous polyploid cells. Having constructed the histogram from Figure 1, we can assign to the each cell a position within the cell cycle. From the shape of the histogram we can also conclude that Ho is more suitable for the cell cycle analysis than 7-AAD, as it gives better separation of the intensity peaks.
An example of the intensity images of cells stained by Ho or 7-AAD is shown in Figure 2. The Ho-stained images exhibit higher heterogeneity and a higher number of bright spots compared to the images of the 7-AAD-stained cells (Murata et al. 2000a). The bright spots in Figures 2a and 2b and Figures 2c and 2d are AT-rich and GC-rich regions, respectively. It appears that the AT-rich regions are more localized than the GC-rich regions. This finding is supported by the histograms shown in Figure 3. The histograms exhibit broader intensity distribution for Ho-stained cells.
Comparison of the images from Figure 2 reveals that the nuclear area of the cells in the G2/M-phase is almost two times larger than that in the G0/1-phase. In addition, the number of bright spots that represent AT- or GC-rich regions is increased in the G2/M-phase compared to the G0/1-phase. The same morphological changes can be traced in histograms and co-occurrence matrices of those images, Figures 3 and 4, respectively. In particular, the co-occurrence matrices of the normalized images from Figure 2 show different gray-scale amplitudes (Figure 4). This can be seen from the length of the pattern aligned along the diagonal of the matrix. The Ho-stained nucleus shows a higher amplitude of the intensity profile compared to the 7-AAD-stained nucleus. Assuming smooth intensity change, this observation suggests that the AT-rich DNA is more localized than the GC-rich DNA. An analysis of the patterns in the perpendicular direction (parallel to the other diagonal) can give a qualitative estimate of the image contrast. The broader the distribution in this direction, the higher contrast the image has. Visually, there is a smaller contrast in the images in the G2/M-phase (Figure 4). This finding is confirmed by the texture analysis of the whole ensemble of cells. Figure 5 shows results of the cell cycle-related texture analysis of 100 fluorescence intensity images of nuclei stained separately by Ho and 7-AAD. For both dyes, the ASM value is higher for nuclei in the G0/1-phase compared to the nuclei in the G2/M-phase. Because the increased value of ASM indicates higher homogeneity of the image, the result suggests more homogeneous spatial distribution of the DNA in the G1/0-phase. The decreased homogeneity in the G2/M-phase arises from the increased size and number of the bright spots. In particular, both AT- and GC-rich DNA regions seem to become more condensed and localized in the G2/M-phase (Silvia et al. 1991; Evelyne and Pierre-Marie 1992; Santisteban and Brugal 1995; Cecile et al. 1999; Murata et al. 2000a,2001).
Modulation (
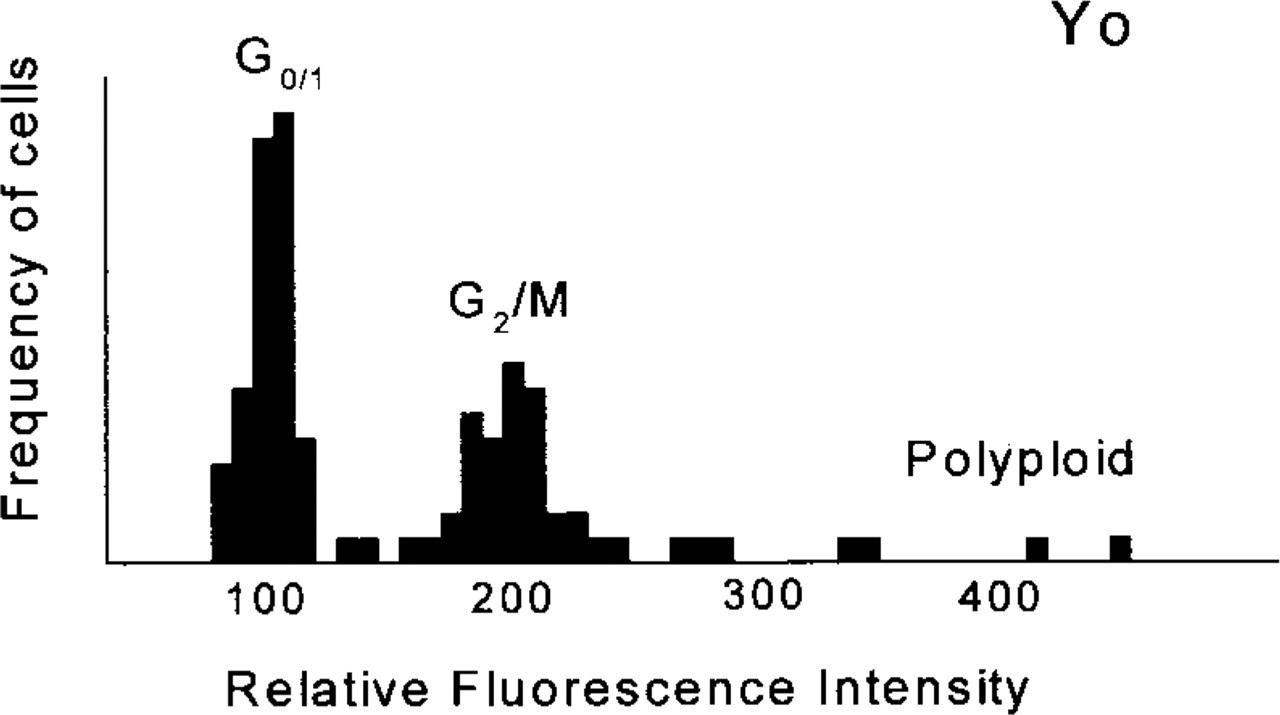
DNA histogram obtained from fluorescence images of 100 Yo-stained nuclei.
The SVar parameter, describing the distribution pattern along the upper left &RR; lower right diagonal of the co-occurrence matrix shows no dependence on the cell cycle. The result suggests that the overall amplitude of the intensity changes does not depend on the cell cycle.
The DVar values, characterizing mean contrast of the image, show that nuclei in the G2/M-phase exhibit comparatively lower contrast than nuclei in the G0/1-phase. The DVar decreases with a decreasing contrast and is related to the steepness of the intensity changes. Because the amplitude of the intensity changes stays constant, the decreased contrast means that the intensity changes take place over a greater distance. In other words, constant value of SVar and decreased values of DVar indicate larger size of the condensed DNA regions in the G2/M-phase.
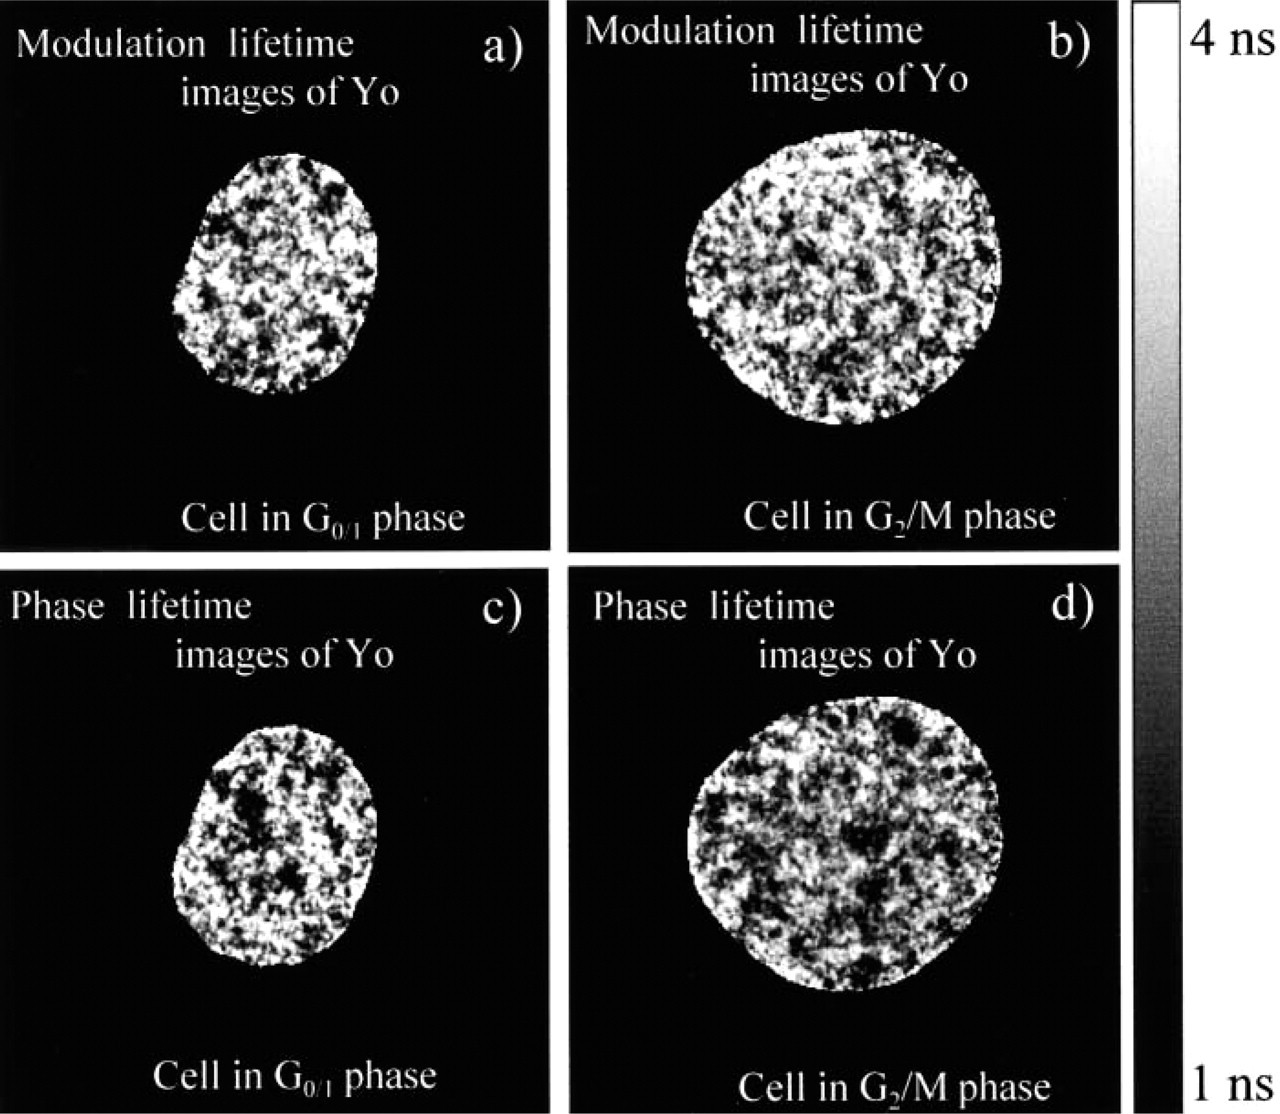
Modulation and phase lifetime images of nuclei in the G0/1 and the G2/M-phases stained with Yo. The bright areas in the modulation lifetime images (
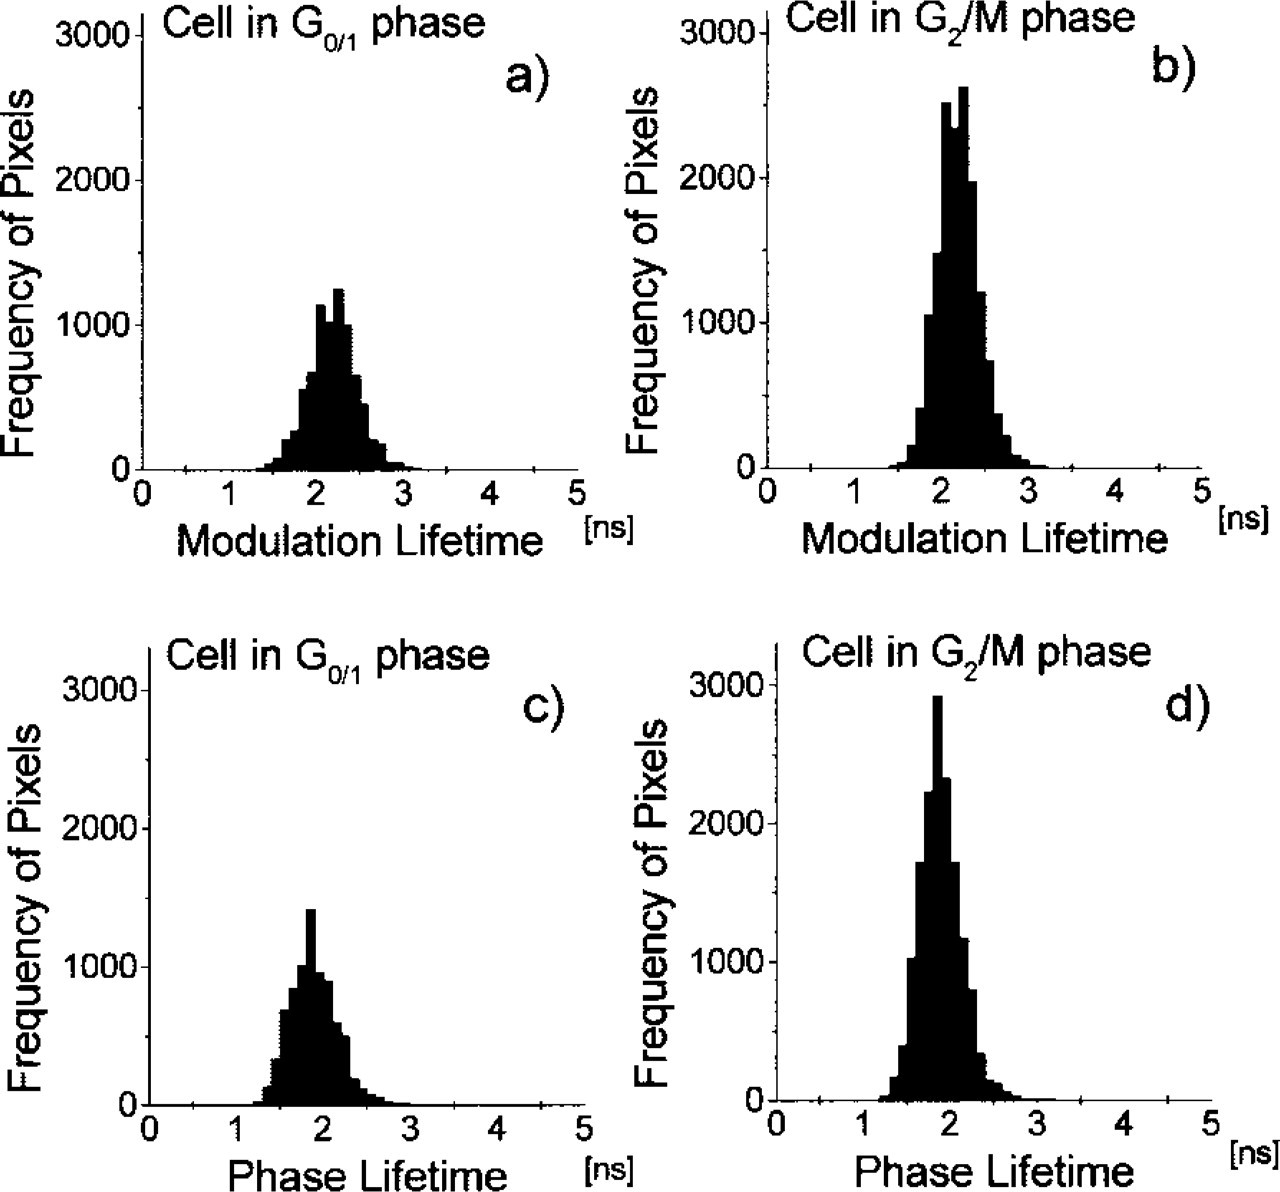
Histograms of the lifetime images from the cell stained with Yo. The histograms (
Fluorescence Lifetime Imaging of Yo
The spatial distribution of the AT- and GC-rich regions of the YO-stained nuclear DNA was studied by the lifetime imaging. Yo is a nonspecific DNA dye with a lifetime sensitive to the local environment. In an in vivo study it was observed that the fluorescence decay of Yo in poly[dG-dC] is close to a single exponential with a mean lifetime of 4.12 nsec. In the poly[dA-dT] the mean lifetime shortens to 1.48 nsec and fluorescence decay becomes highly heterogeneous (Netzel et al. 1995). Because lifetimes are insensitive to the fluorophore concentration, lifetime images of Yo-stained nuclei are unbiased by a spatial variation in the DNA concentration and give complementary information to the results of Ho and 7-AAD intensity imaging.
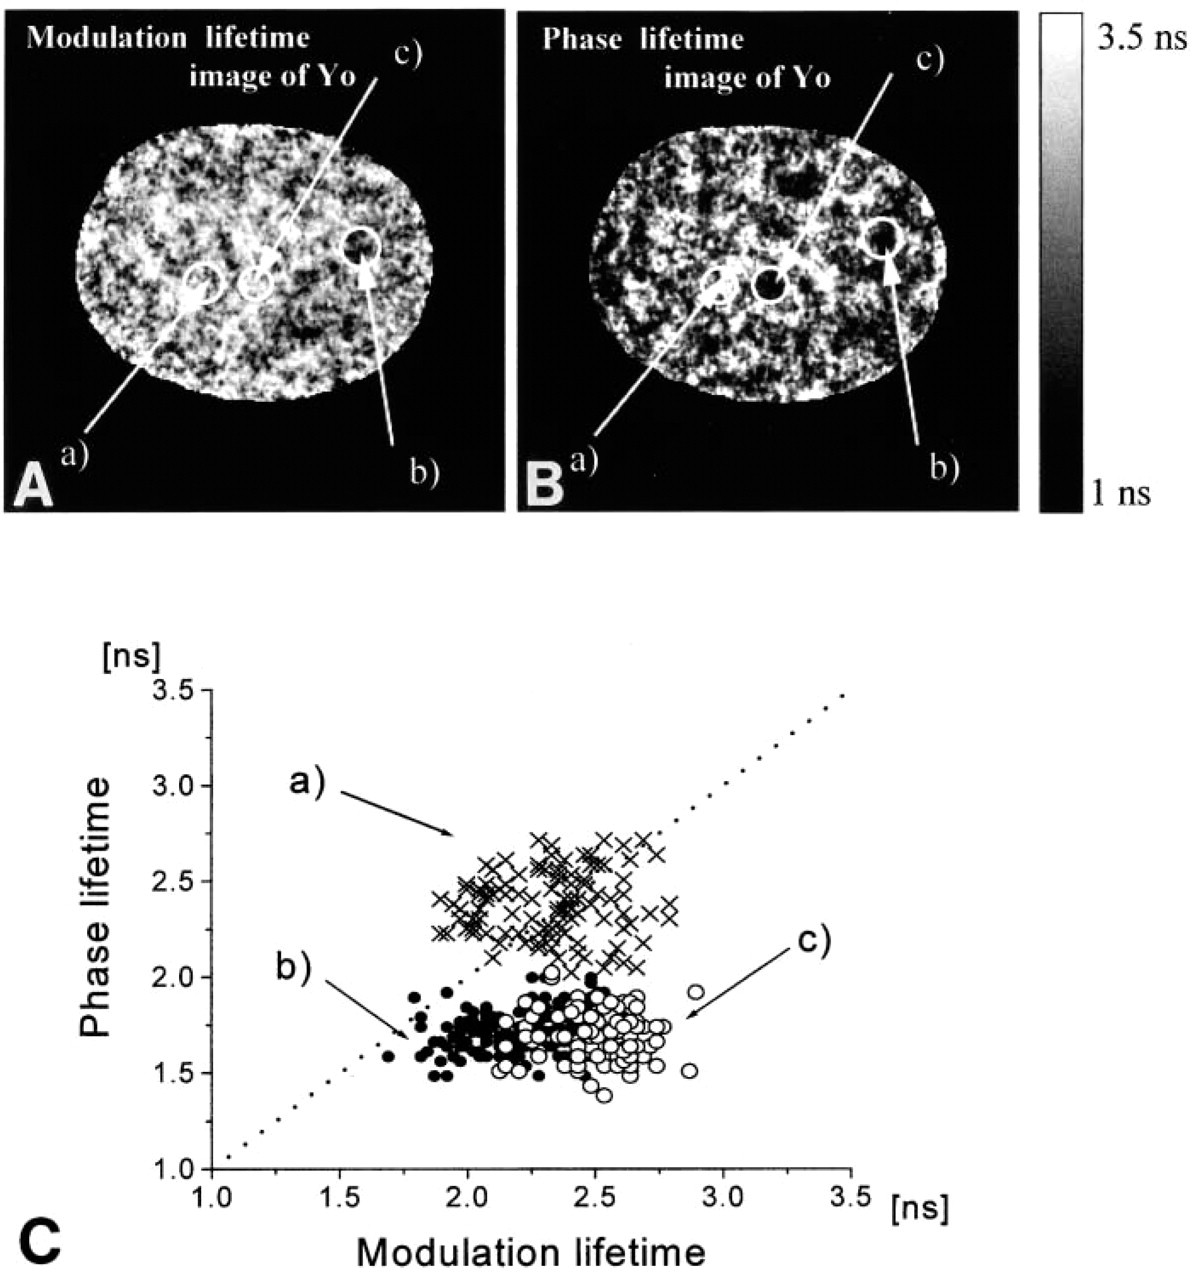
Figure 6 shows the modulation and the phase lifetime image of the Yo-stained nucleus. As expected, both images exhibit significant spatial variations of lifetimes. The lower panel shows correlation between modulation and phase lifetime on a pixel-to-pixel basis. The lifetime image of the nucleus contains three classes of regions. In the first class, the values of the phase and modulation lifetimes are close to each other (Figures 6A-6C, Region a). This is an indication of the mono-exponential intensity decay and of the high GC:AT ratio. Region b is characterized by both lifetimes being shorter. Moreover, the phase lifetime is substantially shorter than the modulation lifetime. This is an indicator of fluorescence decay heterogeneity. Such decays are expected to be measured in regions containing excess of AT base pairs. The fluorescence decay in the third region (Region c) is heterogeneous with lifetimes close to the values found for nonspecific DNA (Netzel et al. 1995).
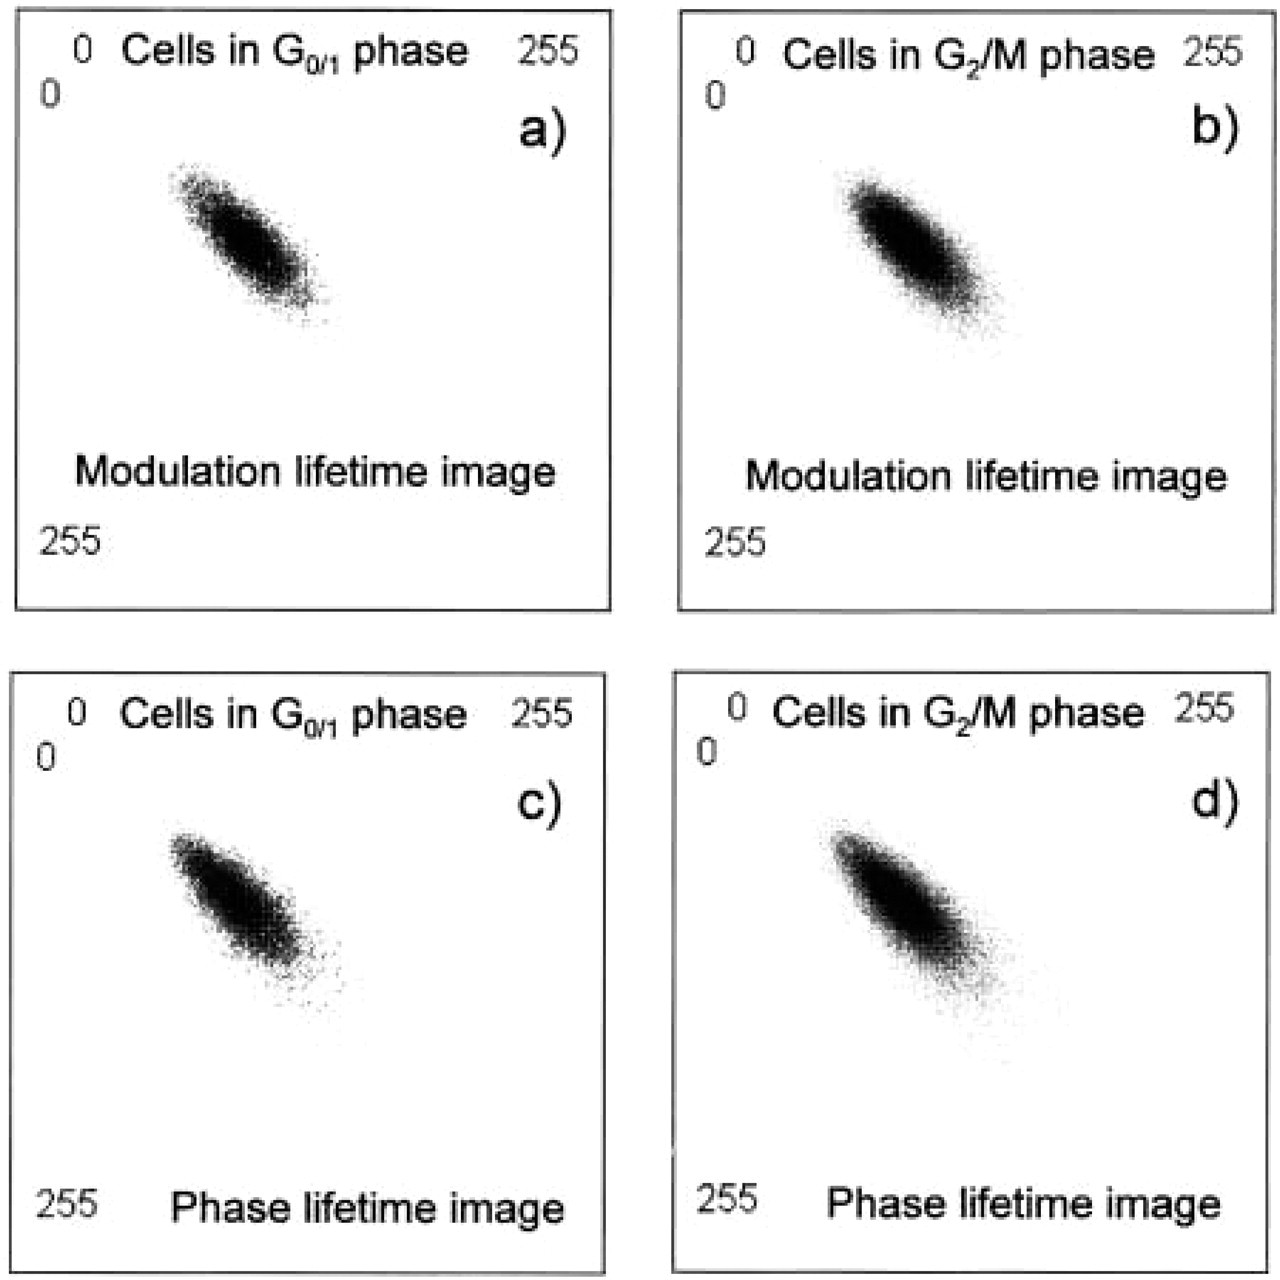
Co-occurrence matrices for the lifetime images from Figure 8. The co-occurrence matrices were constructed from images normalized to the same average value. The co-occurrence matrices (
Figure 7 shows cell cycle analysis of the ensemble of 100 Yo-stained cells. Cells were indexed and sorted according to their total fluorescence intensity and position within the cell cycle. Figures 8 and 9 show an example of modulation and phase lifetime images of randomly chosen cells in the G0/1 and G2/M-phases and corresponding pixel-based lifetime histograms. The co-occurrence matrices of the images from Figure 8 are presented in Figure 10. All lifetime images display spatial heterogeneity of lifetimes. The phase lifetime images of cells in the G2/M-phase exhibit larger size and larger number of the low-lifetime dark spots, which is a indication of an excess of AT base-pairs (Figures 8c and 8d). This effect appears to be weaker in the modulation lifetime images (Figures 8a and 8b). Histograms presented in Figure 9 display broad unimodal lifetime distributions centered near 2.2 nsec and 1.9 nsec for modulation and phase lifetime, respectively. However, the co-occurrence matrices of both the phase and modulation lifetime images from Figure 8 show similar characteristics. In particular, the size of the pattern aligned along the top left to the bottom right diagonal reveals slightly larger amplitude of the lifetime variation in the G2/M cell compared to the G0/1 cell (Figure 10). This single cell-based observation was confirmed by the statistical analysis of 100 cells, which shows increase of the SVar value in the G2/M-phase (Figure 11).
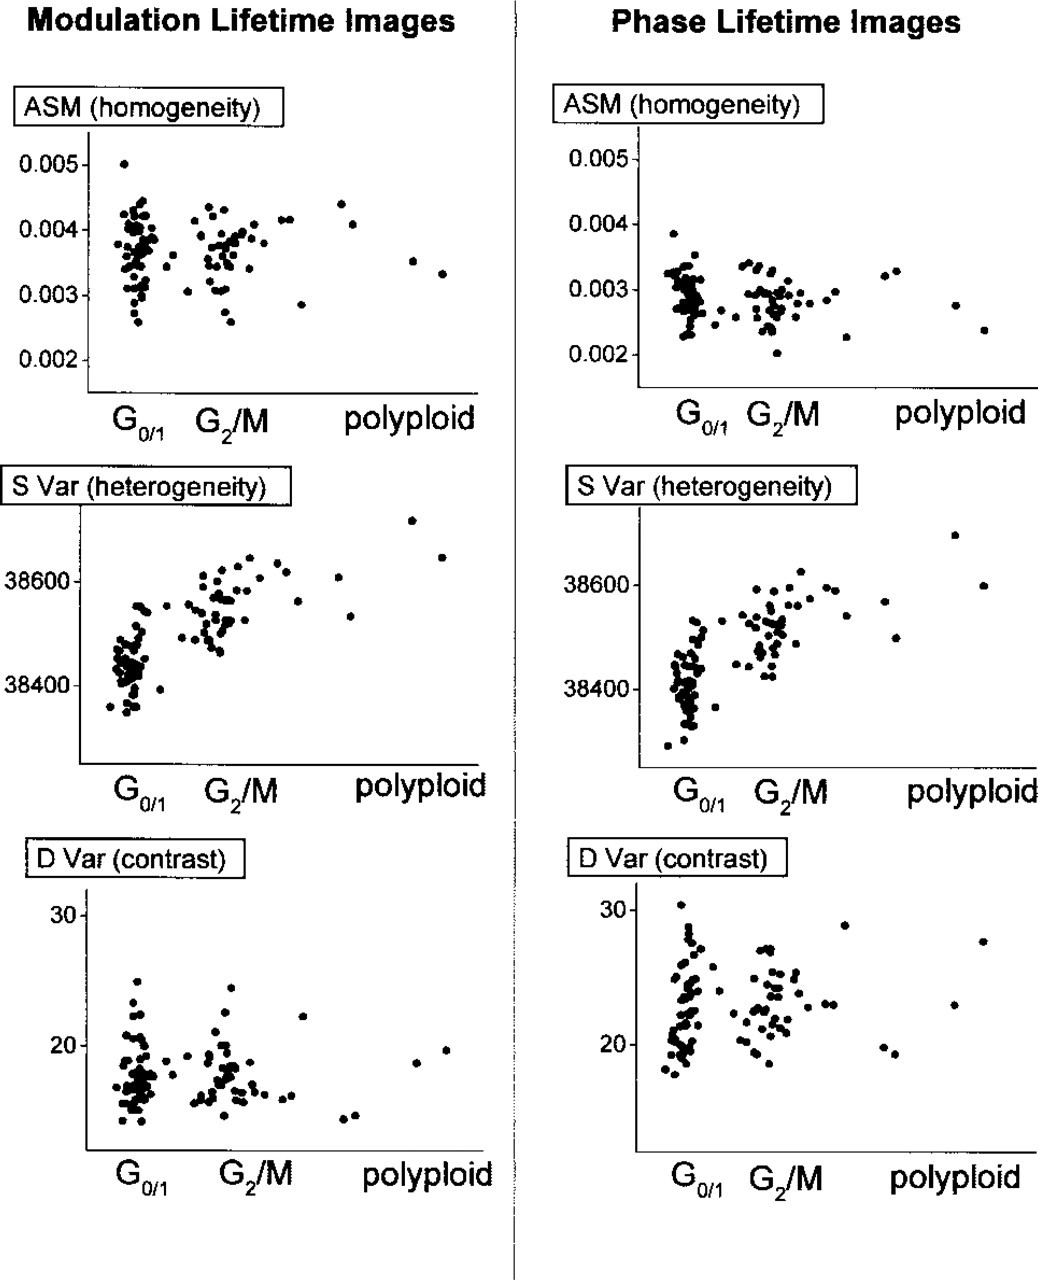
Results of the texture analysis performed on the modulation and phase lifetime images of 100 nuclei stained with Yo. The analyzed images were normalized to the same average intensity. Scattergrams show relation between texture analysis parameters and the cell cycle. Whereas values of ASM and DVar do not show significant dependence on the cell cycle, the value of SVar becomes higher in the G2/M-phase.
Figure 11 shows cell cycle-dependent statistical analysis of the co-occurrence matrices for all 100 cells. Whereas values of ASM and DVar show no statistically significant dependence on the cell cycle, the value of SVar becomes higher in the G2/M-phase. For a constant value of DVar, the value of SVar should increase with the size of the domains. Our result indicates spatial separation of the AT- and GC-rich DNA regions in the G2/M cells. Invariance of ASM and DVar is consistent with the observed independence of the mean lifetime on the cell cycle (Figure 12). This result is in accord with the knowledge that the overall amount of nuclear DNA changes during the cell cycle but that the global AT:GC base pair ratio remains constant.
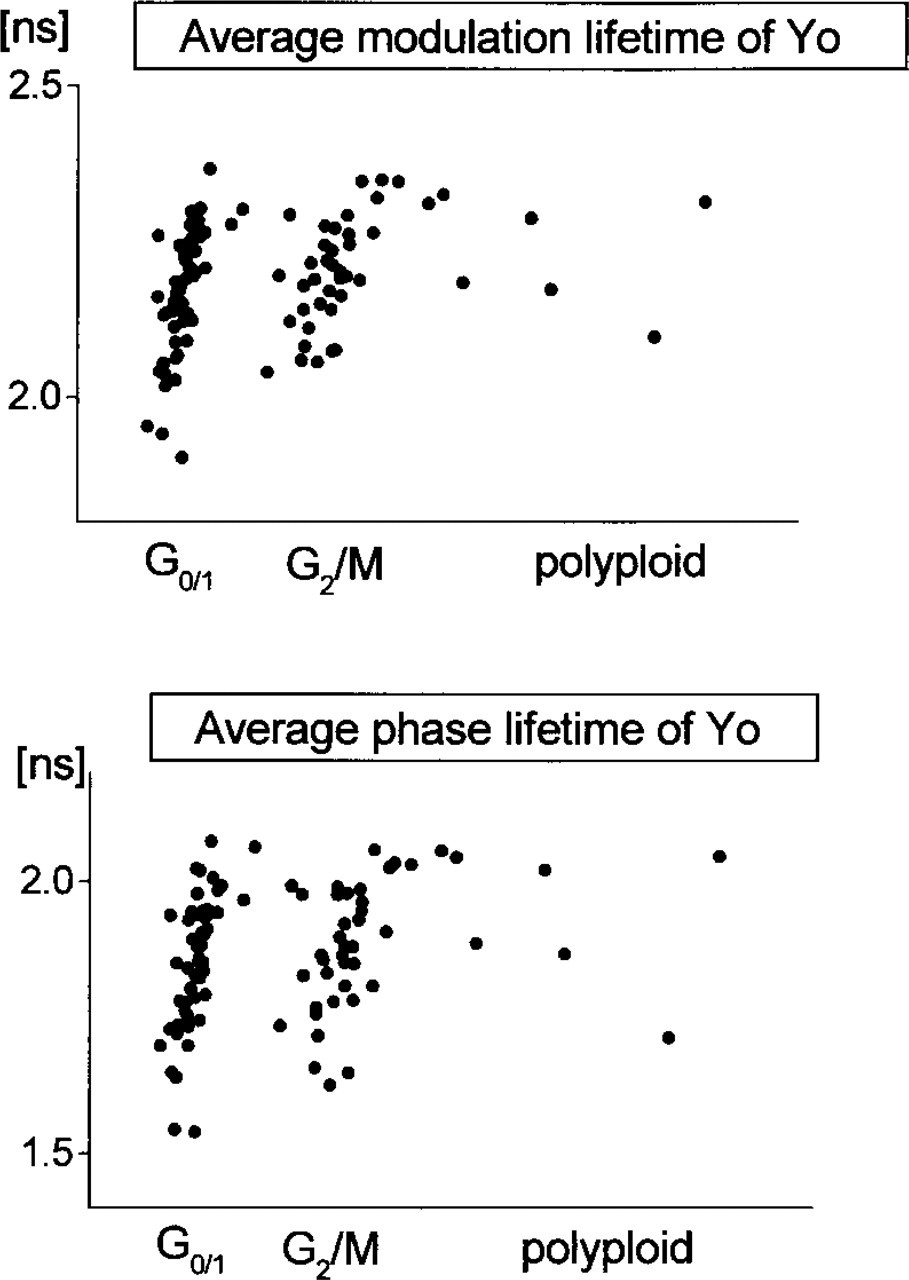
Cell cycle-dependent scattergrams of the average lifetime for 100 nuclei stained with Yo. The mean values of the average modulation and phase lifetimes of 100 cells are (2.2–0.1) nsec and (1.9–0.1) nsec, respectively. The average lifetime does not exhibit dependence on the cell cycle.
Discussion
In this work we studied cell cycle-associated spatial changes of AT- and GC-rich regions in an ensemble of cells by texture analysis. We considered the structural changes of DNA in terms of the relative spatial separation as well as the condensation of the AT- and GC-rich regions in the nuclei. Texture analysis of the fluorescence intensity images gives informative data on the DNA condensation in nuclei, as was reported by a number of groups (Silvia et al. 1991; Evelyne and Pierre-Marie 1992; Tround et al. 1992; Santisteban and Brugal 1995; Cecile et al. 1999). However, the fluorescence intensity analysis cannot reveal the spatial separation of the AT- and GC-rich DNA regions in nuclei. Such information can be accessed by FLIM with DNA probes exhibiting environmentally sensitive lifetimes. This is the main reason why we combined the fluorescence intensity imaging with the lifetime imaging of the nuclei.
Nuclei stained by AT-specific Ho and GC-specific 7-AAD reveal bright fluorescence in locations with a high concentration of DNA. The texture analysis of the intensity images indicates that, compared to the G0/1-phase, in the G2/M-phase the DNA concentration becomes spatially more heterogeneous with increasing number and size of the spatially well-defined condensation centers.
The fluorescence lifetime images are independent of the local DNA concentration (Lakowicz and Berndt 1991; Lakowicz et al. 1994). The phase and modulation values, even if measured at a single modulation frequency, result in unique apparent phase and modulation lifetimes (Lakowicz 1999a). For single exponential decay the apparent phase and modulation lifetimes are the same. For a multi-exponential decay, the phase lifetime is always shorter than the modulation lifetime (Kilin 1962; Spencer and Weber 1969; Murata et al. 2000a,b). Because Yo displays distinct fluorescence lifetimes with single or multiple exponential fluorescence decay after binding to AT, GC, or nonspecific base pairs (Netzel et al. 1995), the phase and modulation lifetime patterns reveal relative spatial localization (separation) of AT- and GC-rich DNA in the cells (Figure 6). The AT- and GC-rich regions appear to be spatially separated in G2/M-phase (Figure 11).
In conclusion, the steady-state fluorescence intensity-based texture analysis shows condensation of the AT- and GC-rich DNA. Lifetime images reveal a spatial relation between AT- and GC-rich regions. Both steady-state fluorescence intensity and the lifetime-based texture analysis reveal significant rearrangement of the nuclear DNA during the cell cycle.