
Abstract
The purpose of the present study was to establish a rapid and reproducible method for quantification of tissue-infiltrating leukocytes using computerized image analysis. To achieve this, the staining procedure, the image acquisition, and the image analysis method were optimized. Because of the adaptive features of the human eye, computerized image analysis is more sensitive to variations in staining compared with manual image analysis. To minimize variations in staining, an automated immunostainer was used. With a digital scanner camera, low-magnification images could be sampled at high resolution, thus making it possible to analyze larger tissue sections. Image analysis was performed by color thresholding of the digital images based on values of hue, saturation, and intensity color mode, which we consider superior to the red, green, and blue color mode for analysis of most histological stains. To evaluate the method, we compared computerized analysis of images with a ×100 or a ×12.5 magnification to assess leukocytes infiltrating rat brain tumors after peripheral immunizations with tumor cells genetically modified to express rat interferon-γ (IFN-γ) or medium controls. The results generated by both methods correlated well and did not show any significant differences. The method allows efficient and reproducible processing of large tissue sections that is less time-consuming than conventional methods and can be performed with standard equipment and software. (
Keywords
E
Assessment of immune histochemistry can easily be performed using computerized techniques, encompassing digital image analysis (Norazmi et al. 1990; Fermin et al. 1992, 1995; Ong et al. 1996; Lehr et al. 1999). By computerized image analysis, both stained objects per section and the percentage of the area or objects stained compared to the total area can be calculated. In addition, the intensity of the staining analyzed, corresponding to epitope abundance, can be estimated, although this requires more refined methods of computation and standardization (Matkowskyj et al. 2000). The use of computerized digital image analysis has made it possible to quantify larger samples of tissue in a more time-efficient and unbiased way (Belien et al. 1999; Kraan et al. 2000) compared with manual counting of a limited number of high-power fields. However, there are limitations and potential drawbacks with current procedures of computerized image analysis, such as susceptibility to variations in staining and the use of complicated methods of analysis. Because of the adaptive features of the human eye, computerized image analysis appears to be more vulnerable to variations in staining than manual image analysis. Consequently, standardization of the immune histochemical procedure has been considered essential to minimize the variability of the method and to achieve better reproducibility (Johnsson et al. 1994; Karlsson et al. 1994; Mesker et al. 1994).
An additional limitation is that the low resolution of video cameras has restricted the analysis to high-magnification images. A feasible but time-consuming way to overcome this has been to merge several images into a collage before the calculations are performed (Ikeda et al. 1997). Recently, the use of digital scanner cameras and other high-resolution digital cameras has increased the resolution substantially compared with older video cameras.
The aim of this investigation was to optimize the procedures of staining, image acquisition, and computerized image analysis in the evaluation of immunohistochemical staining of leukocyte epitopes. Specifically, we have validated the method in investigating differences in leukocyte infiltration in rat brain tumors after peripheral immunizations with tumor cells genetically modified to express rat IFN-γ compared with medium controls.
Materials and Methods
Animals and Animal Procedure
Syngenic inbred Fischer 344 male rats were used in all experiments. The rats were bred at the animal facility of the Wallenberg Laboratory by continuous brother–sister matings. The rats were kept in an environment controlled for temperature and humidity and all animal procedures were performed according to the practices of the Swedish Board of Animal Research. Animals were sedated with either 0.52 ml/100 g animal (weight below 330 g), 0.55 ml/100 g animal (weight between 330 and 370 g), or 0.57 ml/100 g animal (weight over 370 g) of ketalar/Rompun.
Tumor Cells and Immunizations
The N32 rat brain tumor model and the use of INF-γ secreting tumor cells for immunizations of animals with established intracerebral tumors have previously been described (Siesjö et al. 1993; Visse et al. 1999). Immunizations were performed 10 days after intracerebral tumor cell inoculation. On Day 24, when the first rat of the control group showed neurological symptoms, all rats were sacrificed.
Primary Antibodies
The following primary antibodies were used: anti-rat TCR-αβ clone R73 and anti-rat macrophage clone ED-2 (Serotec; Oxford, UK).
Preparation of Tissue Sections
After sacrificing the rats, the brains were dissected from the skull and 0.5-cm thick slices, including the injection site, were snap-frozen in liquid nitrogen-cooled isopentane at −55C before being stored at −80C until sectioning. Four-μm thin brain sections were cut at −20C with a cryostat (Leica; Wetzlar, Germany), mounted on standard glass slides, and then air-dried for 30 min. Slides were wrapped in aluminum foil and placed in heat-sealed plastic bags for storage at −80C until further processing. Before staining, the slides were thawed for 30 min and fixed in RT acetone for 10 min. After rehydration in TBS (Tris-buffered saline: 50 mM Tris, 145 mM NaCl, pH 7.6) for 5 min, the slides were mounted in a Shandon Cadenza automated immunostainer (Shandon; Pittsburgh, PA).
Immunohistochemistry
Briefly, the sections were blocked for 20 min with 5% donkey serum (Jackson Immunoresearch; West Grove, PA) and then incubated with the primary antibody for 60 min. After washing with TBS, sections were incubated with a biotinylated secondary antibody (donkey anti-mouse biotin, cat# 715-066-151; Jackson Immunoresearch) for 30 min. Sections were then washed and incubated for 30 min with streptavidin-horseradish peroxidase (Jackson Immunoresearch). Finally, the sections were detached from the immunostainer, incubated for 5–10 min with 3-amino-9-ethylcarbazole (AEC +) (DAKO; Glostrup, Denmark), and then rinsed in running tapwater before counterstaining with Gill's hematoxylin (Vector Laboratories; Burlingame, CA). Slides were mounted wet in Histotec (Serotec) permanent aqueous mounting medium, without coverslips and dried at RT.
Digital Analysis of Tissue Sections
Sections were visualized with a standard light microscope (Tx-60, Olympus) and captured with a three-color charge coupled device (3CCD) RGB (red–green–blue) Practica ColorScan with a resolution of 2696 × 3590 pixels (Schneider Feinwertechnik; Dresden, Germany) through an Adobe Photoshop plug-in (version 5.0; Adobe Systems, Mountain View, CA). The images were saved in a TIFF format (Tagged Image File Format) for analysis with Image-Pro Plus 3.0 software (Media Cybernetics; Silver Spring, MD). The entire tumor area was scanned to a single image using a ×12.5 magnification at a resolution of 100 ppi (pixels per inch). The approximate scanning time per image was 30 sec and required 3.1 MB of hard disc space. To create an image covering the entire tumor area using a ×100 magnification, 6–20 images were scanned at a resolution of 100 ppi. A single image of the entire tumor area was created in Adobe Photoshop by merging the separate images. To automatically calculate the stained area, representing single cells or sheets of cells within the tumor, the Image-Pro Plus image analysis program was used. A schematic demonstration of the steps in the analysis is shown in Figure 1. Images were first pre-processed using the following techniques to enhance red immunostaining. First, the “Contrast Enhancement” tool was used to increase the brightness of the image and to increase the contrast between stained particles and background. Next, the “Flatten Background” filter was used to even out background variations due to irregularity of light in the images and to further increase the contrast between stained particles and background (Figure 1A).
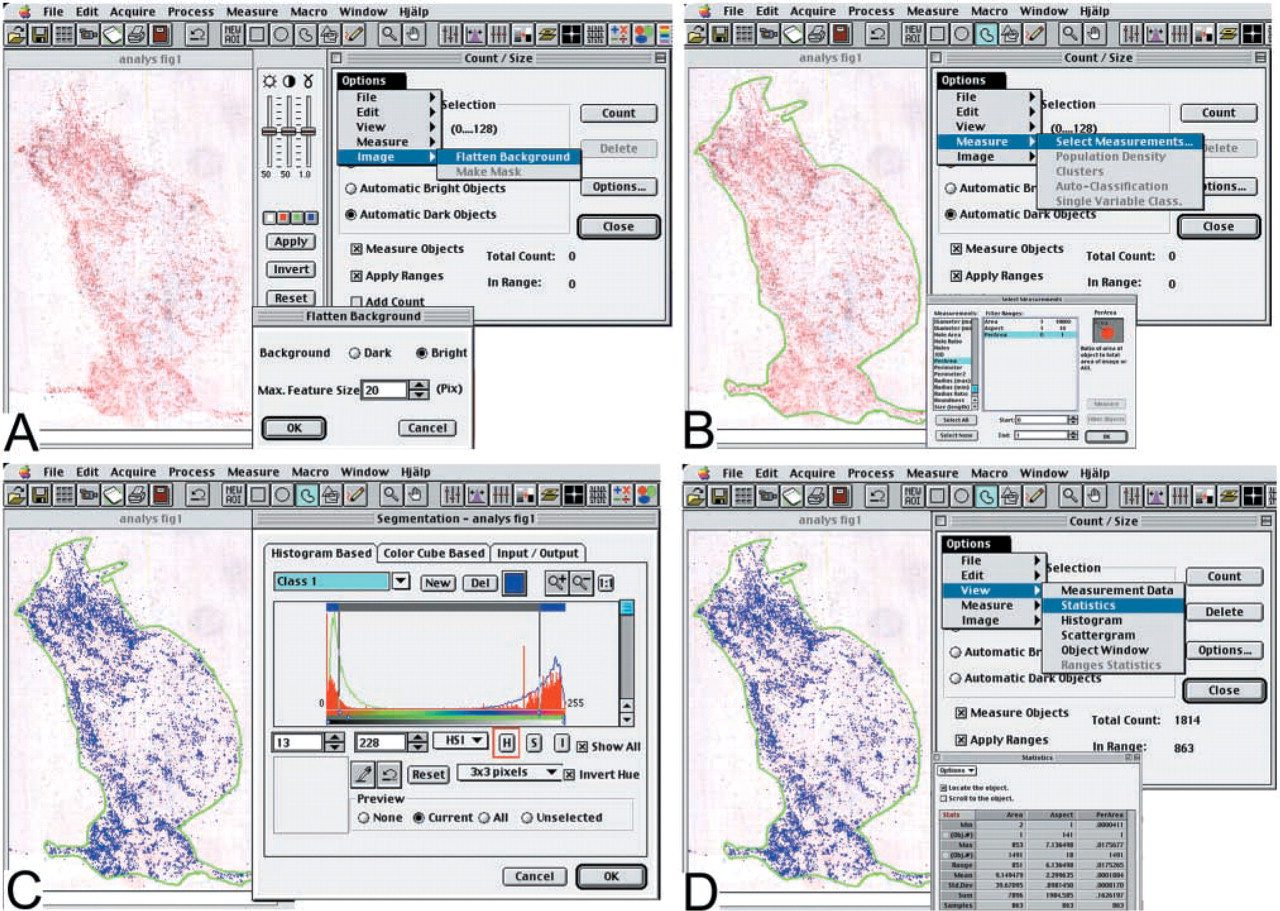
Schematic demonstration of the steps in the Image-Pro Plus image analysis software. (
The “Irregular Area of Interest” was used to select the area to be measured, representing the total tumor area. To define the size and shape of the particles to be identified the command “Select Measurements” in the “Measure” menu in the “Count/Size” dialogue box was used. The following parameters were defined. The “Area” range was set from 1 to 10,000 pixels to exclude larger artifacts, but included sheets of cells that are not separable from each other. The “Aspect” value or the ratio between the major and minor axes of the stained object was set from 1 to 10 to exclude narrow and long objects that probably represent microscopic and staining artifacts. The “PerArea” or the ratio of stained area compared to the area of interest was set from 0 to 1 (Figure 1B).
To manually set the thresholds of the color range, representing red immunostaining, the command “Select Colors” in the “Count/Size” dialogue box was used. The histogram-based mode of color threshholding was used. Scanned images were converted from the RGB color mode to the HSI (Hue–Saturation–Intensity) color mode and the three HSI parameters were manually gated between 0 and 255 while the accuracy was checked with a pseudo-color. In this way the thresholds could be set to exclusively encompass the specific staining (Figure 1C).
The command “Count” from the “Count/Size” dialogue box was used to calculate the percentage of stained area out of the previously cropped total area. Under the “View” menu in the “Count/Size” dialogue box, data were presented in the “Statistics-Sum” window (Figure 1D).
Statistics
Coefficients of correlation between the results obtained by analyses of high- or low-magnification images in Figure 2 were calculated using DeltaGraph 4.5 (DeltaPoint; Monterey, CA). Error bars in Figure 3 indicate standard deviation (SD) of the variation in analysis on three different occasions. The significance of the difference between groups in Figure 3 was determined by using the non-parametric Mann–Whitney U test with p values less than 0.05 being considered statistically significant. The test was performed using StatView (Abacus Concepts; Berkeley, CA).
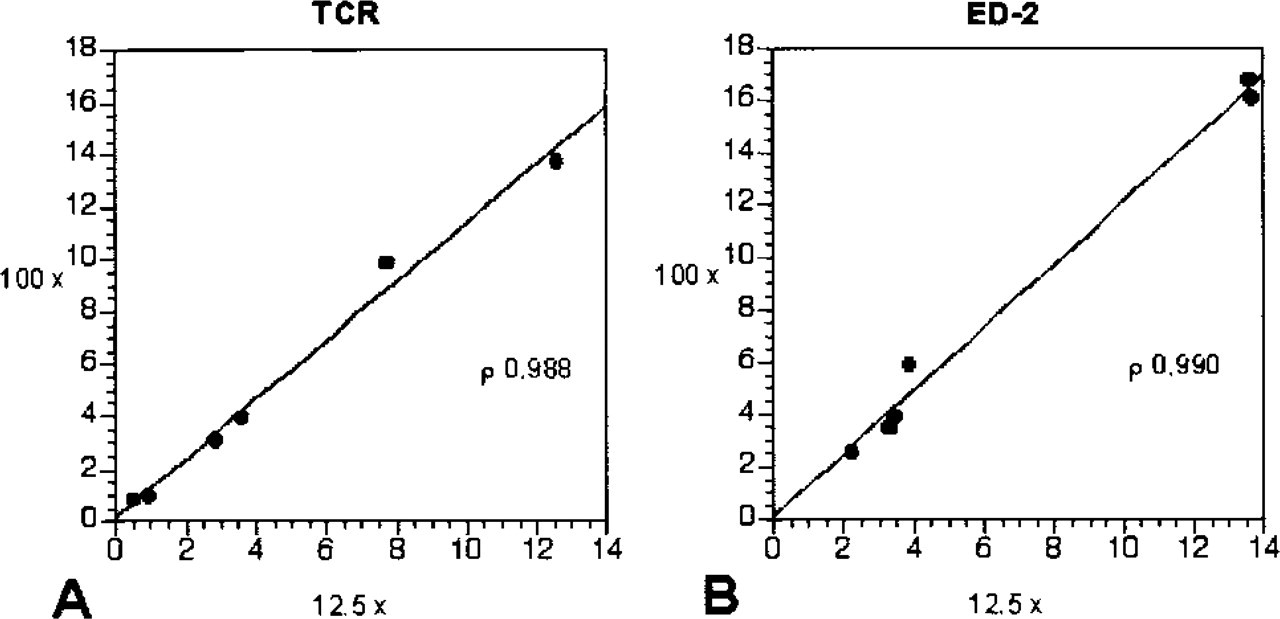
Comparison of the results from the image analysis using high- and low-magnification images for infiltration of TCR+ cells (
Results
Standardization of the Immunohistochemical Procedure
To standardize the procedure, it was essential to (a) minimize the variation of incubation times, (b) minimize the variation of reagent volumes and concentrations, and (c) optimize the staining intensity.
Variations of the time, volume, and reagent concentrations were minimized by use of the automated immunostainer. However, because the glass slides were positioned vertically in the immunostainer, this sometimes resulted in a vertical staining gradient. Therefore, we positioned three brain tumor sections at fixed locations on each glass slide and routinely used only the middle sections for analysis to avoid uneven staining intensity. To optimize the staining intensity, the color development was visually controlled in the microscope. Once the optimal staining time was noted, all slides were stained for the same period of time. The best contrast and minimal background staining was achieved using the peroxidase-based substrate AEC +. The use of alkaline phosphatase-based chromogens resulting in blurred staining.
Correlation of Computerized Image Analysis Between High- and Low-magnification Images
Comparison of the results from the image analysis using high- and low-magnification images for infiltration of TCR+ and ED-2+ cells (Figures 2A and 2B) between the N32-IFN-γ and control groups correlated strongly, as indicated by the correlation coefficients of TCR ×100/×12.5; ρ = 0.988 and of ED-2 ×100/×12.5; ρ=0.990. Therefore, there was no significant difference between the results generated by image analysis of either magnification. Low-magnification, high-resolution images can therefore be used to extract the same information as low-resolution, high-magnification images.
Variability of the Computerized Image Analysis
To study the operator-related variation of the computerized image analysis, brain tumor sections from each group (N32-IFN-γ and control) were stained with antibodies against TCR and ED-2 (Figures 3A-3D). The images were captured once and analyzed by the same person on three different occasions. The results from the analysis of images captured using a ×12.5 magnification were compared with the results from images captured using a ×100 magnification. The differences between groups in infiltration of TCR-positive cells were significant (p = 0.0495), whereas the differences in infiltration of ED-2-positive cells between groups were not (p = 0.1266). The same results were obtained irrespective of the analysis method used. On the basis of the data obtained, we conclude that the variations among the different occasions were relatively small but did not alter the outcome between the groups.
Merging of Images Compared to Capture of the Total Area in One Low-magnification Image
Figure 4 shows images of TCR infiltration in a brain tumor captured at ×12.5 magnification (Figure 4A) or several merged images at ×100 magnification (Figure 4B). The images were merged as described in Materials and Methods. The merging procedure is feasible and suitable for analysis but is significantly more time-consuming than using the low-magnification image.
Discussion
The purpose of this study was to elaborate a time-efficient and reliable method to analyze infiltrating leukocytes in rat brain tumors. To achieve this goal, the procedures had to be standardized with respect to staining, image acquisition, and image analysis. We describe a technique that facilitates the analysis of large tissue sections, encompassed in a single image, in a fast and reproducible way.
To minimize variations in the color spectra of the chromogen produced by differences in incubation time and reagent amounts, we used an automated staining method. Several investigators have argued that standardization of the immune histochemical method is necessary if computerized methods are to be used (Johnsson et al. 1994; Karlsson et al. 1994; Mesker et al. 1994; Mosedale et al. 1996). However, in this study color development was performed outside the automated stainer because using a fixed staining time for all batches tends, in our hands, to give uneven staining. This will probably not influence the amount of positively stained cells/tissue but could affect measurements of intensity among different batches or samples.
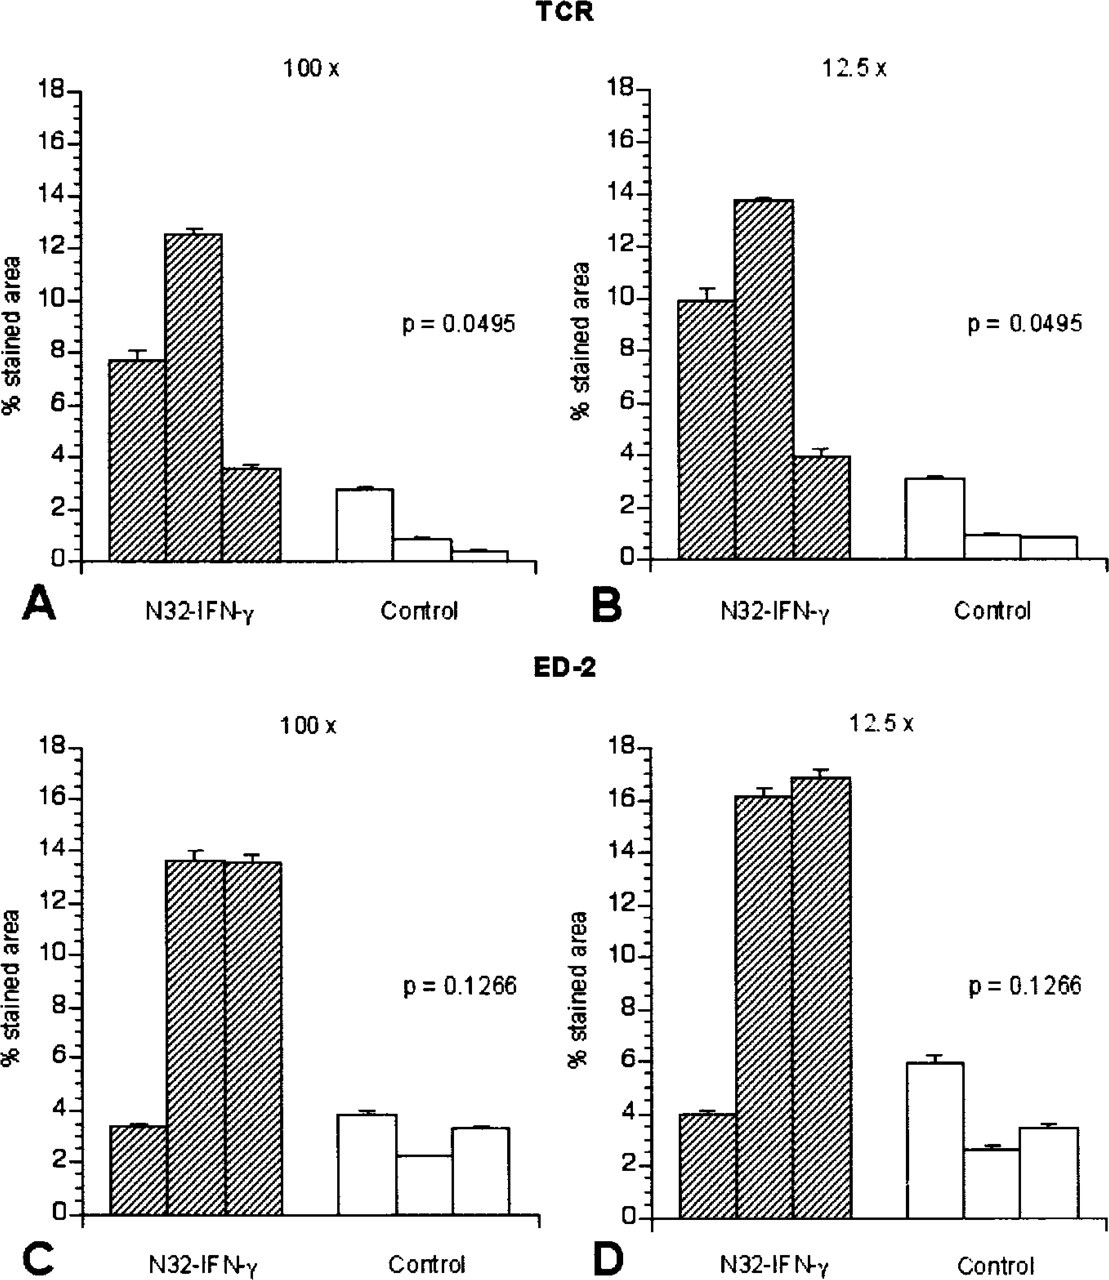
Operator-related variation of the computerized image analysis. Brain tumor sections from each group (N32-IFN-γ, n = 3, and control, n = 3) were stained with antibodies against TCR (
The resolution of a captured image depends on the capacity and quality of the CCDs of the camera. For image acquisition we used a scanning camera, which further increases the resolution by moving the CCD across the object. The scanning procedure prolongs exposure time but this was well compensated for by the overall time saving of the total image acquisition process. It took approximately 30 sec to scan a single image with a ×12.5 magnification. To cover the same area with a ×100 magnification took at least 20 min, because from six to 20 images had to be scanned and then merged before the analysis could be performed. The increase in efficacy of the procedure was not coupled to decreased accuracy of the analysis outcome, because we found no significant difference between samples that were analyzed with a ×100 or a ×12.5 magnification.
Although the digital analysis can be performed in several image manipulation software packages (Lehr et al. 1999; Matkowskyj et al. 2000; Ruifrok 1997), we found obvious advantages using software dedicated to technical image analysis, such as Image-Pro Plus. In contrast to other software packages, those tailored for image analysis are focused on features such as delineating the AOI and gating (thresholding) of histograms, as well as statistical computation and presentation, and are superior tools in terms both of accuracy and time efficiency.
Results from several groups have demonstrated the relative advantages of using different color mode standards in digital analysis. As discussed by Lehr et al. (1999), image analysis using the RGB color mode is more suitable to use on images with constant color spectra. Images from immunostained tissues are often composed of complex color spectra owing variations in both saturation and intensity of the stains. Since histological chromogens never contain a single pure color, the use of the RGB color mode can sometimes be problematic. Several investigators have demonstrated that the use of the HSI color mode can overcome these difficulties (Fermin and Degraw 1995; Kohlberger et al. 1996). Colors with very similar spectra can easily be separated using the HSI color mode, since it describes a color as it is perceived by the human eye, separating the information on color brightness (saturation) and light (intensity) from color hue. In computerized image analysis, the final measurement of the stained area is based on gating or thresholding of the respective RGB, HSI, or HSL histograms. The thresholding can be performed either manually or automatically. Some investigators have advocated the use of automated thresholding, e.g., thresholding by computer software, because of better reproducibility between different sessions (Kohlberger et al. 1996). We do not consider this a reliable method because it assumes an image with excellent contrast and brightness of color. By manually gating the histograms and thus visually checking the overlay of a pseudo-color on the stained objects, the superior adaptive and discriminating feature of human visual perception can be optimally utilized. Some investigators have proposed the use of manual gating with fixed thresholds (Willemse et al. 1994). However, the use of this has two major drawbacks. First, it does not take into account the variations in staining and light intensity among different images. Second, it does not recognize that the fixed gating may be based on a non-representative image. Therefore, we have used manual gating for each individual image, analogous to how different images are perceived by the human eye.
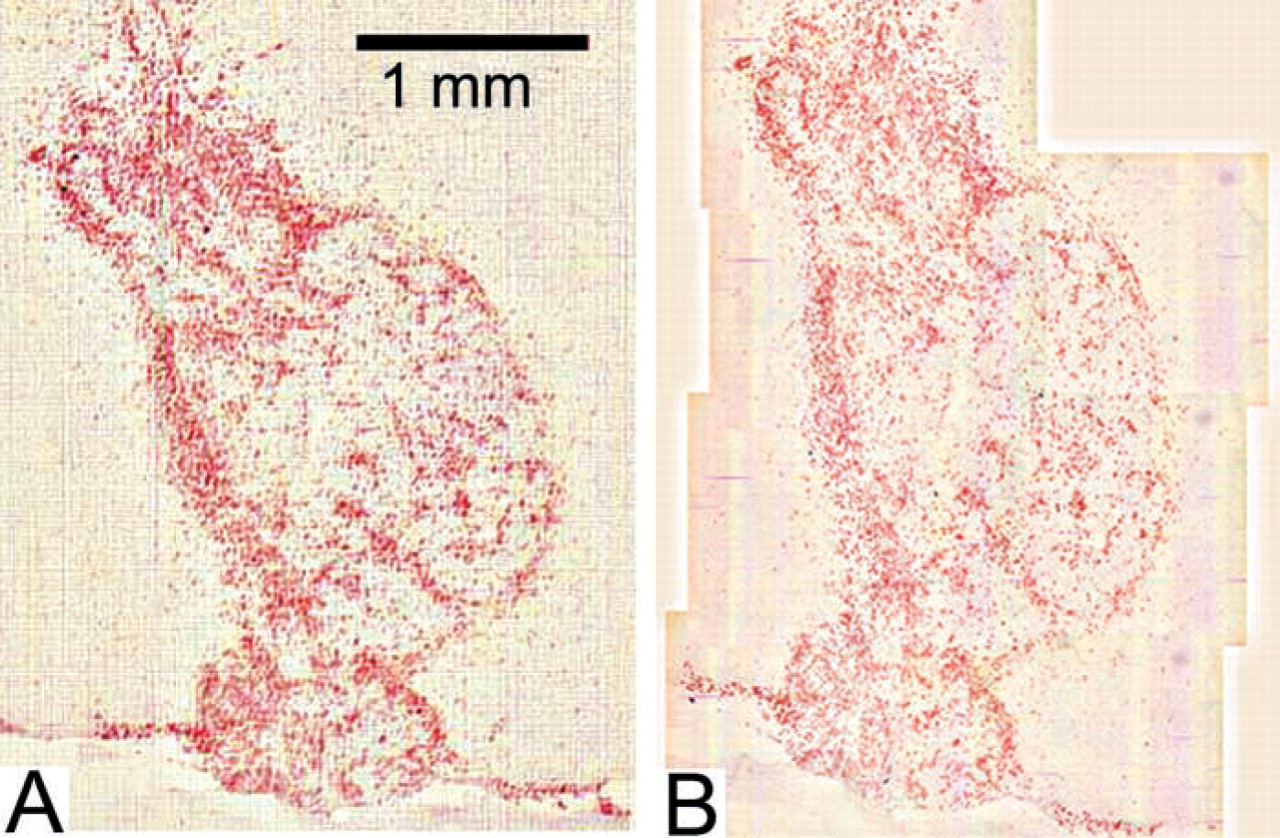
Immunohistochemical staining of TCR infiltration in a brain tumor captured at either ×12.5 magnification (
Although some investigators have proposed that intraobserver variations are more profound than interobserver variations in digital analysis (Jagoe et al. 1991), we agree with the contrary view proposed by other investigators (Johnsson et al. 1994; Mosedale et al. 1996). The qualification of a single observer lies not only in diminished variations but also in accumulation of superior skill and experience. Although we have recorded minor intraobserver variations, these have not influenced the outcome. Therefore, to minimize variations we recommend that the same observer should analyze all sections in a single batch.
Several investigators have elaborated methods to further refine the image analysis and overcome the disadvantages of color thresholding and acquisition of color information as described here (Lehr et al. 1999; Matkowskyj et al. 2000). Although this may be beneficial in analysis of variations in concentration of an expressed epitope, we do not believe it to be necessary in quantification of cell (e.g., leukocyte) infiltration.
In conclusion, we believe that computerized image analysis can, under optimal conditions, be used as “cytometry of solid tissue.” However, this can be achieved only if the procedure is time-efficient and reproducible. To facilitate and optimize the procedure of digital analysis of immunohistochemical sections, we have standardized the immunohistochemical method, captured low-magnification images with a digital scanner camera, and modified the computerized image analysis. In this way, analysis of large samples can be achieved in a time-efficient and reproducible manner.
Footnotes
Acknowledgments
Supported by grants from the Childrens Cancer Foundation of Sweden, the Crafoord Foundation, the Jonas Foundation, the Minerva Foundation, the Skane Region Funds, and the Hedvig Foundation.
We thank Eva Gynnstam for excellent technical assistance.