Abstract
While many acknowledge that nonprofits influence education, we know little about how many there are, where they cluster, when they emerged, and what types exist. Without empirical data, we are limited in understanding their role in education. Using data from 233,897 US nonprofits, we note 29 types grouped within three clusters: educational institutions, professional school improvement organizations, and associational groups. Spatially, they are prevalent in large states and cities, but the top 500 cities only make up half of them. Temporally, there has also been an explosion of education nonprofits founded since 2010—driven by professional rather than associational organizations. The study also highlights the intricacies of using quantitative tax data for future research.
Keywords
Introduction
Contemporary politics is changing US education, with the federal government threatening research and service grants, various states turning to school voucher programs, and local education foundations threatening equitable financing of education (Jabbar et al., 2022; Murray et al., 2019; Trinidad, 2025; US Department of Education, 2025). Many organizations driving or experiencing these changes are nonprofits, created for socially and mutually beneficial purposes rather than to generate profits for shareholders (Powell & Bromley, 2020b). In this article, we focus on organizations classified as 501(c)(3) 1 under the Internal Revenue Code, which include public charities, private foundations, and certain religious organizations—further limited to those focused in education. To ensure clarity, we employ the widely used term “nonprofit” to refer to organizations that operate under 501(c)(3) tax-exempt status instead of the more specific terms “501(c)(3) organizations” or “public charities” (IRS, 2025).
Although studies of nonprofits in education have documented their influence on politics (DeBray et al., 2020), support in implementing policies and programs (Honig, 2004; Peurach, 2011), threats to public institutions (Reckhow & Snyder, 2014), and contribution to inequalities in funding and social access (Bridwell-Mitchell, 2017; Nelson & Gazley, 2014), we know little about how many there are, what types are most common, where they are concentrated, and when they were founded. Nonetheless, such information can enrich studies of education policies, politics, leadership, and sociology. This paper is motivated by three questions: (1) What are the different types of education nonprofits? (2) What is the relative proportion of these nonprofits? (3) How are these nonprofits distributed across space and time?
This holistic view of education nonprofits first provides an opportunity to understand the variety of “influences” on US public education. Although many scholars focus on philanthropies and research-practice partnerships (Ball, 2008; Farrell et al., 2022), our inattention to other nonprofits can narrow our aperture over the subtle ways education changes. Second, the absence of an education nonprofit census can prevent a fuller understanding of why and how they reduce or increase inequalities. Third, knowing the quantitative distribution of nonprofits in an area is a helpful context in qualitatively studying education policies and politics. Fourth, researchers, policymakers, and school leaders can use this national analysis to understand their local ecology of nonprofits. Fifth, this paper is an attempt at rigorous descriptive research that details the intricacies and limitations of the data and makes transparent the various ways the data can be used and adapted (Loeb et al., 2017). Because this is, to our knowledge, the first study to document the ecology of US education nonprofits, we also note how future studies can use the data and advance this literature.
To preview the findings, we highlight three clusters of education nonprofits: educational institutions, professional school improvement organizations, and associational groups. We further subdivide these into ten groups like preschool-grade 12 schools, postsecondary institutions, fundraising and school support organizations, fraternities/sororities, and parent–teacher groups. Spatially, nonprofits are concentrated in large states, and to an extent, large cities. However, the 500 cities with the most number of nonprofits only constitute half of all nonprofits—highlighting the local character of these groups. Temporally, significant numbers of nonprofits have been established each year since 2010 and are driven by professional organizations focused on education services, fundraising, and scholarships—highlighting the greater rationalization of the field.
We limit our study to contemporary organizations the Internal Revenue Service (IRS) categorized as 501(c)(3), which comprise the largest group of tax exempt organizations and capture the public charity, religious, and private foundation dimensions of nonprofit activity. However, this choice may omit other organizations including labor unions, trade associations, and fraternal organizations. We rely on 2022 to 2024 data from the IRS Form 990, which is required of nearly all tax-exempt organizations except for churches or association of churches (Allen et al., 2024). However, because only entities with gross receipts of $50,000 or more file a full 990 Form, our analysis may omit smaller entities like K-12 booster clubs, parent–teacher organizations, and other smaller, single-school-supporting organizations. Our data include public charities that receive support from the government and private foundations that are created to distribute money to public charities and individuals (National Center for Charitable Statistics, 2024). We note in the subsequent sections the limitations of the data, particularly as it concentrates on nonprofits that are registered and report to the IRS.
Literature Review
Qualitative Studies on Improvement Science and Education Politics
Many studies of nonprofits in education are often qualitative research focused on particular cases (e.g., Success for All and Teach for America) or particular sectors (e.g., education philanthropy and advocacy). Adapting Rowan’s (2002, 2008) conceptualization of the school improvement industry, Trinidad (2023) has suggested three types of “school improvement organizations,” namely, philanthropic, direct school support, and research/advocacy organizations. Studies of these organizations attempt to contribute to fields like improvement and implementation science that highlight how organizations help schools strengthen and adapt their practices (Bryk, 2015; Lewis, 2015) as well as education politics that highlight nonprofits’ influence over school processes and contestation over education reforms (Horsford et al., 2018).
Studies have highlighted the role of professional school improvement nonprofits like whole-school reform organizations (Peurach, 2011), research-practice partnerships (Farrell et al., 2022), intermediary organizations (Honig, 2004), and implementation networks (Russell et al., 2015). They often note advantages of nonprofits as they become providers that collaborate with schools to use and improve practical knowledge (Peurach & Glazer, 2012). Some have also noted these organizations’ affordances in mediating policymakers and implementers as they provide new resources like knowledge, political ties, and administrative supports (Eddy-Spicer et al., 2020; Honig, 2004). A different set of organizations that have been shown to positively influence schools and students are community-based organizations that are often led by youths and community members (Baldridge, 2020). Ethnographic studies of these after-school programs and out-of-school initiatives illustrate how they can be particularly helpful for refugees and minoritized students’ identity formation, critical consciousness, and academic preparation (Cureton, 2023; Sulé et al., 2021).
Studies on the politics of education highlight concerns that networks of research, advocacy, and philanthropic organizations can influence the types of changes schools and districts adapt. They document how advocacy organizations disseminate information to shape public opinion that advantage particular individuals like pro-charter school board candidates (DeBray et al., 2020). Critical studies also suggest that foundations act as hubs that mobilize charter management organizations, think tanks, and media to support neoliberal school reforms (Scott et al., 2009; Scott & Jabbar, 2014). The strong influence of organizations is particularly evident in studies of education philanthropy as large education foundations have increasingly funded “jurisdictional challengers” that provide alternatives to traditional public sector institutions (Reckhow & Snyder, 2014, p. 186). Studies have suggested the role of venture philanthropy in promoting policies affecting teacher preparation programs and charter school reform networks (Saltman, 2010).
Collectively, qualitative studies of education nonprofits provide important insights into improvement science, community-based organizations, education politics, and state-society relations. However, the focus on specific nonprofits or sectors of nonprofits can mask how these organizations form an ecosystem with specific organizational niches. Thus, the present research intends to zoom out from these qualitative studies to show the larger ecosystem and document the various types of organizations outside the public school system.
Quantitative Studies and Education Inequalities
The relatively recent availability of data and the interest in the various ways nonprofits can impact education have led to a number of quantitative studies on how nonprofits can influence student outcomes and educational inequalities (Bridwell-Mitchell, 2017; Bridwell-Mitchell et al., 2023; Murray et al., 2019; Nelson & Gazley, 2014). However, many of these studies are often limited in terms of place or sector.
In two studies using data from New York City schools, E.N. Bridwell-Mitchell notes the unequal distribution of partner organizations. Using data from partnerships between 211 high schools and 1098 organizations, Bridwell-Mitchell (2017) shows that already advantaged schools in terms of having more experienced teachers were more likely to have partners while previously disadvantaged schools with a large proportion of low socioeconomic status students were less likely to partner with organizations. In a subsequent study, Bridwell-Mitchell and colleagues (2023) find that the following factors are associated with increased exam scores: longer school-nonprofit partnership, partner organizations in the same field, and partners that provide instructional resources. Taken together, they note the role of nonprofit partners in supporting schools but caution that this may lead to inequitable outcomes if already advantaged schools receive more.
Aside from professional organizations, associational organizations like parent–teacher groups (PTGs) can also provide support to schools through effective fundraising, creation of social capital, and building trust among constituents (Powell & Bromley, 2020a). A study of North Carolina schools has shown that even as PTGs can form in a variety of contexts, the PTGs that have an annual revenue of $50,000 or more primarily formed in affluent and predominantly white schools (Murray et al., 2019). In another study focused on Illinois schools, similar patterns were found as fundraising PTGs were more likely to support whiter and wealthier-serving schools (Mackevicius, 2022). A US national study noted how direct school support nonprofits like boosters, PTGs, and local education funds were more likely to be in relatively larger districts and districts with higher tax revenues per pupil (Nelson & Gazley, 2014). Taken together, these studies illustrate how nonprofit presence may contribute to rather than reduce inequalities across school districts.
Another set of organizations that form part of this ecosystem but is often unincorporated is the set of private nonprofit K-12 schools and higher education organizations. Arum and Kepins (2020) have attempted to describe the characteristics of schools and universities using data from the National Center for Education Statistics. Their research notes the differences in the make-up of public, charter, secular, and religious K-12 schools. They also highlight the demographic and financial distribution of public, for-profit, and nonprofit higher education institutions and add a literature review of nonprofit intermediaries in education (Arum & Kepins, 2020). Other studies and meta-analyses have also noted how private and charter schools—often part of the nonprofit sector—have small positive test score consequences for traditional public schools (Figlio et al., 2024; Jabbar et al., 2022).
Inasmuch as other studies have documented various aspects of education nonprofits, they are often specific to particular locations (e.g., New York City, North Carolina, and Illinois) or to particular sectors (e.g., school-supporting nonprofits and K-12 schools). Nonetheless, there is value in an integrative perspective that shows these different types of education nonprofits and how they are distributed across the United States.
Descriptive Analysis of Nonprofits
Because of the immense variety of US nonprofits, a number of studies have focused on first describing the distribution of these organizations. The temporal and spatial distributions of nonprofits have been common ways of describing of the sector. Temporally, Horvath and Powell (2020) show the increased number of foundations since the 1990s, which includes the increase in funding and the new forms they have taken. Studies on the increase of nonprofits have noted how the greater affluence of Americans explains this nonprofit expansion as individuals buy more services from these nonprofits and as the government delegates services to them as well (Hammack, 2001; Morgan & Campbell, 2011). Some have noted how the types of organizations established have also changed over time as social, fraternal, union, and religious organizations comprised 62% of founded organizations before 1960 but were only 28% after 2010. In their stead, more recently established organizations focus on political, professional, and research activities directed at particular issues like housing, education, and arts (De Vries et al., 2023).
Spatially, scholars have investigated the role nonprofits play in cities and in supporting social and civic activities. Brandtner and Dunning (2020) provide various illustrations of how nonprofits cluster in cities, with the largest concentrations being in cities like New York, Los Angeles, Washington DC, Chicago, and Boston. They also highlight how urban nonprofits support civic capacity, participate in urban governance, convene elites, support the city’s cultural identity, and build up the physical environment (Brandtner & Dunning, 2020). Using data on the density of civic-supporting nonprofits for every US county, de Vries and colleagues (2023) find that more “civic opportunities” existed in counties with a greater share of college educated and non-Hispanic White residents and have a lower federal poverty rate. While some have suggested a “government failure theory” as nonprofit density is negatively associated with the size of the government and positively associated with government fragmentation (Jeong & Cui, 2020), others have shown how nonprofits perform varying functions like being a (1) supplement to government efforts, (2) complement that partners with state agencies, or (3) challenger to public institutions (Young, 2000). These studies highlight the importance of interrogating local and locational dynamics of nonprofits.
Across these studies noting the distribution of US nonprofits, none have provided specific focus on the education sector. However, the diversity of nonprofits in education—ranging from K-12 and higher education institutions to large national philanthropies, small local booster clubs, professional research organizations, and associations of parents—highlights the need to uncover a broad view of this ecology. To understand this ecology, we focus on providing a rigorous and transparent descriptive analysis that identifies the key constructs, illustrates observable patterns in the data, and interprets those patterns (Loeb et al., 2017).
Data and Method
Data are from the unified IRS 990 Business Master File (BMF), obtained from the National Center for Charitable Statistics (NCCS) by July 2024. The Internal Revenue Service (IRS) releases BMFs that are comprehensive records of tax-exempt organizations in the United States. Many research studies involving nonprofits use the BMF as a sampling frame since it contains the universe of tax-exempt organizations (Brandtner, 2022; De Vries et al., 2023). The unified BMF has one row for each organization that was operating between 1989 and 2024, inclusive of around 3.5 million charitable organizations, foundations, associations, and social clubs. To provide a contemporary picture of nonprofits in education, we limited the dataset to nonprofits that were categorized as “ED” and operating between 2022 and 2024. The IRS has the National Taxonomy of Exempt Entities (NTEE) codes, where the “B” category is characterized as education organizations. Further below we provide details about the NTEE codes, the choices we make, and some limitations in using them.
We performed a number of procedures to clean the dataset and diagnose its appropriateness for our research purposes. First, we limited it to data from US-based nonprofits in all 50 states and the District of Columbia. We excluded nonprofits based in non-US states or have missing data on the state field (n = 572). Second, we removed duplicate organizations (n = 100) because some nonprofits transitioned from a private foundation to public charity (or vice versa) during different years. We used the Employer Identification Number to identify these duplicates and retain their most recent data. Third, we limited our data to nonprofits that have filed an IRS Form 990 between 2022 and 2024 to bound our analysis to organizations that are contemporarily active. In connection to this, there were 11,097 nonprofits that last filed their IRS Form 990 in 2020, which denotes the disruption of the COVID-19 pandemic as only 4416 organizations had their last filing in 2019. In total, the dataset includes 233,897 nonprofits.
In this section, we provide the many intricacies of the data and the choices we as authors made. We note that the data had a number of limitations. However, we carefully thought through these limitations and are transparent about our choices. We also provide alternative ways of using the data to potentially answer other questions or to use in future research investigations. Although there are constraints in our descriptive analysis, we argue that it provides an important first step in understanding the ecology of education nonprofits.
Nonprofit Types
We use the IRS NTEE codes to categorize 29 major types of organizations (e.g., B01 as Alliances and Advocacy, B12 Fundraising Orgs, B21 Preschools, B43 Universities, and B94 Parent-Teacher Groups). 2 The letter denotes the major group (e.g., A = arts, B = education, and X = religion) while the two numbers denote activity area and type of organizations (e.g., B11 = single support fundraising and B12 = fundraising for multiple organizations). In some cases, a third digit is used to specify the sector (e.g., B112 as fundraising for K-12 schools). If this coding with subsequent numbers were used, there would be 169 unique categories. To create a more manageable number of categories, we focused on the 29 major types using one letter and two digits. Thus, we subsumed other codes into the parent code (e.g., B112 and B113 are part of B11). We then renamed the nonprofit clusters based on shorthand of the IRS descriptions like “Parent-Teacher Groups,” “Scholarship,” and “K-12 Schools.”
Using our knowledge of the literature, these 29 types were also clustered into ten broader categories. For example, single support organizations and fundraising organizations were clustered into a broader “Fundraising” category. K-12 Schools, Preschools, Elementary, and High Schools were clustered into “P-12 Schools.” Technical assistance, student services, and education services were clustered into “School support.” We grouped these ten categories into three clusters of educational institutions, associational groups, and school improvement organizations, with one set of uncategorized organizations.
Organizations were considered “Educational Institutions” if they were formal institutions of learning such as Pre-K to Grade 12 schools, colleges, universities, and libraries. They were “Associational Groups” if they brought together individuals with shared interests or identities like PTGs, fraternities, and professional associations. They were “School Improvement Organizations” if they provided some professional service like scholarship, fundraising, research, or advocacy. It must be noted that “school support organizations” (e.g., education services, student services, and technical assistance) form part of the larger group of “school improvement organizations” (inclusive of fundraising, scholarship, and advocacy organizations). Although an imperfect categorization because we are unable to verify each organization’s work, they provide at least a cursory understanding of the current ecosystem.
The use of the IRS NTEE codes is motivated by our desire to be as faithful to the government records as possible. 3 NCCS created its own NTEE codes that closely mirror the IRS one, but we did not use it because of this principle. Further, NCCS recently created a new coding with a three-letter industry code (EDU = education, UNI = university, and ART = arts), one-letter major group (B for education), two-number group division (B11 for single support organization), and a two-letter organizational type (RG = regular nonprofit and AA = advocacy). Future research may study the alignment of these different coding mechanisms.
Using the NTEE “B” category is useful but may hide other organizations that work on education but not categorized with this code. For example, some philanthropies may fund education initiatives but may use the “T” category for grant-making foundations. Some arts or health organizations may primarily work with schools but are categorized under “A” or “E” categories, respectively. Moreover, some research organizations within universities do not file their own IRS Form 990 because the larger university files it. Thus, they are not counted as a research organization even if they are. Because IRS officers assign these categories based on application and mission documents, these categories may be imperfect given an officer’s inaccurate understanding of an organization, changes in an organization’s mission, or the possibility to be categorized using two or more codes. While these codes may have limitations when looking at individual organizations, the NTEE codes do facilitate aggregate analysis, tabulation, and comparison of nonprofits. Thus, despite the imperfections, the categories can still provide useful information. With the advancement of artificial intelligence and natural language processing, future research may compare NTEE codes with trained data that can reclassify different types of organizations.
Founding Year
The IRS Form 990 has a field for the year an organization received nonprofit tax-exempt status, which we use as a proxy for organizational founding like other studies (De Vries et al., 2023). Although the year of reception of tax-exempt status often matches when organizations were founded, there are limitations to their use given the complex history of legislation regarding tax-exempt organizations. 4 Although the earlier years may not be as reliable to use (nonprofits founded pre-1960), the later years can proxy for organizational founding. A focus on the later years may also highlight the more recent trends for the types of organizations that have been founded. We use the year variable to show the trend within the past 125 years (1900–2024), particularly attentive to the spikes in the number of nonprofits founded each year.
Location: State and City
Our dataset has information on the most recent address for each organization, which has been subsequently geocoded for the longitude and latitude, and matched with a Census Block. For the purposes of this research, we use the state and city where organizations are located to provide a descriptive view of the ecology of education nonprofits. The state variable included all fifty states and the District of Columbia.
Because some cities are similarly named (e.g., Albany, NY and Albany, CA), the city variable was merged with a state variable to create the main city location. Upon further investigation, New York City was coded as New York, Bronx, Brooklyn, etc. Thus, we combined the five boroughs to make up NYC. It must be noted that we define “city” as a legally defined local government classified as a municipality, town, or township (U.S. Code § 5302). This does not necessarily match with local school districts since some cities can have more than one district while some cities combine to form a district. Moreover, certain census tracks may be shared across various school districts—making the exact district location difficult to pin down. Thus, for the present paper, we focus on city and state analysis, and plan to perform district analysis in future studies.
Another factor to note with the location data is its reliance on what the organization files as their mailing address. This may not always align where they serve or operate, particularly for organizations that serve in or fund several places. This is a common challenge for nonprofit researchers performing geospatial analysis. Because our present goal is to provide a high-level summary of the distribution of these nonprofits, we aim to start with using this location data even if this has limitations.
Organization Names
There are two organizational name variables, one called “current” and the other called “secondary.” All organizations have a current name but only around 72,000 of the 230,000 organizations have a secondary name. Secondary names may be the organization’s acronym, a chapter of the organization (e.g., university chapter of an honor society), a college alumni class of a university, or a local parent–teacher group of the larger state organization. For the purposes of comprehensively accounting for the different types of organizations, we have concatenated the two names to create the name variable. Because some words may be duplicated (e.g., PTA in the main name and Bloomfield School PTA), we remove duplicate words in our analysis and also remove stop words like “of,” “the,” and “for.”
Exploratory Data Analysis
American statistician John W. Tukey is best known for the boxplot and his unwavering support of exploratory data analysis (EDA). Tukey (1977) makes the distinction between exploratory and confirmatory data analyses, with the former highlighting the careful identification of structures, patterns, and information from the data. While much of social sciences have emphasized the latter, particularly with the focus on causal inference (Gangl, 2010), performing rigorous exploratory analysis is an important first step to identifying social phenomena. EDA is an approach to simplifying data and using tools like descriptive statistics and data visualization to detect patterns in a highly efficient manner (Páez & Boisjoly, 2022). We perform various ways of visualizing and identifying patterns in our data in both univariate and bivariate ways. To map the types of nonprofits, we use Sankey diagrams that show the flow of organizations into larger clusters. To highlight the spatial and temporal distribution of nonprofits, we use bar graphs that help us assess the states, cities, and years with significant numbers of nonprofits. We also explore bivariate relations using scatterplots (e.g., nonprofit density and state population) and interrogate spikes in the dataset. We did not perform spatial data analysis but plan the next phase of the project to focus on this. We see our study as a first step in understanding education nonprofits; future studies can explore new research questions the present study does not yet focus on.
Findings
Types of Organizations
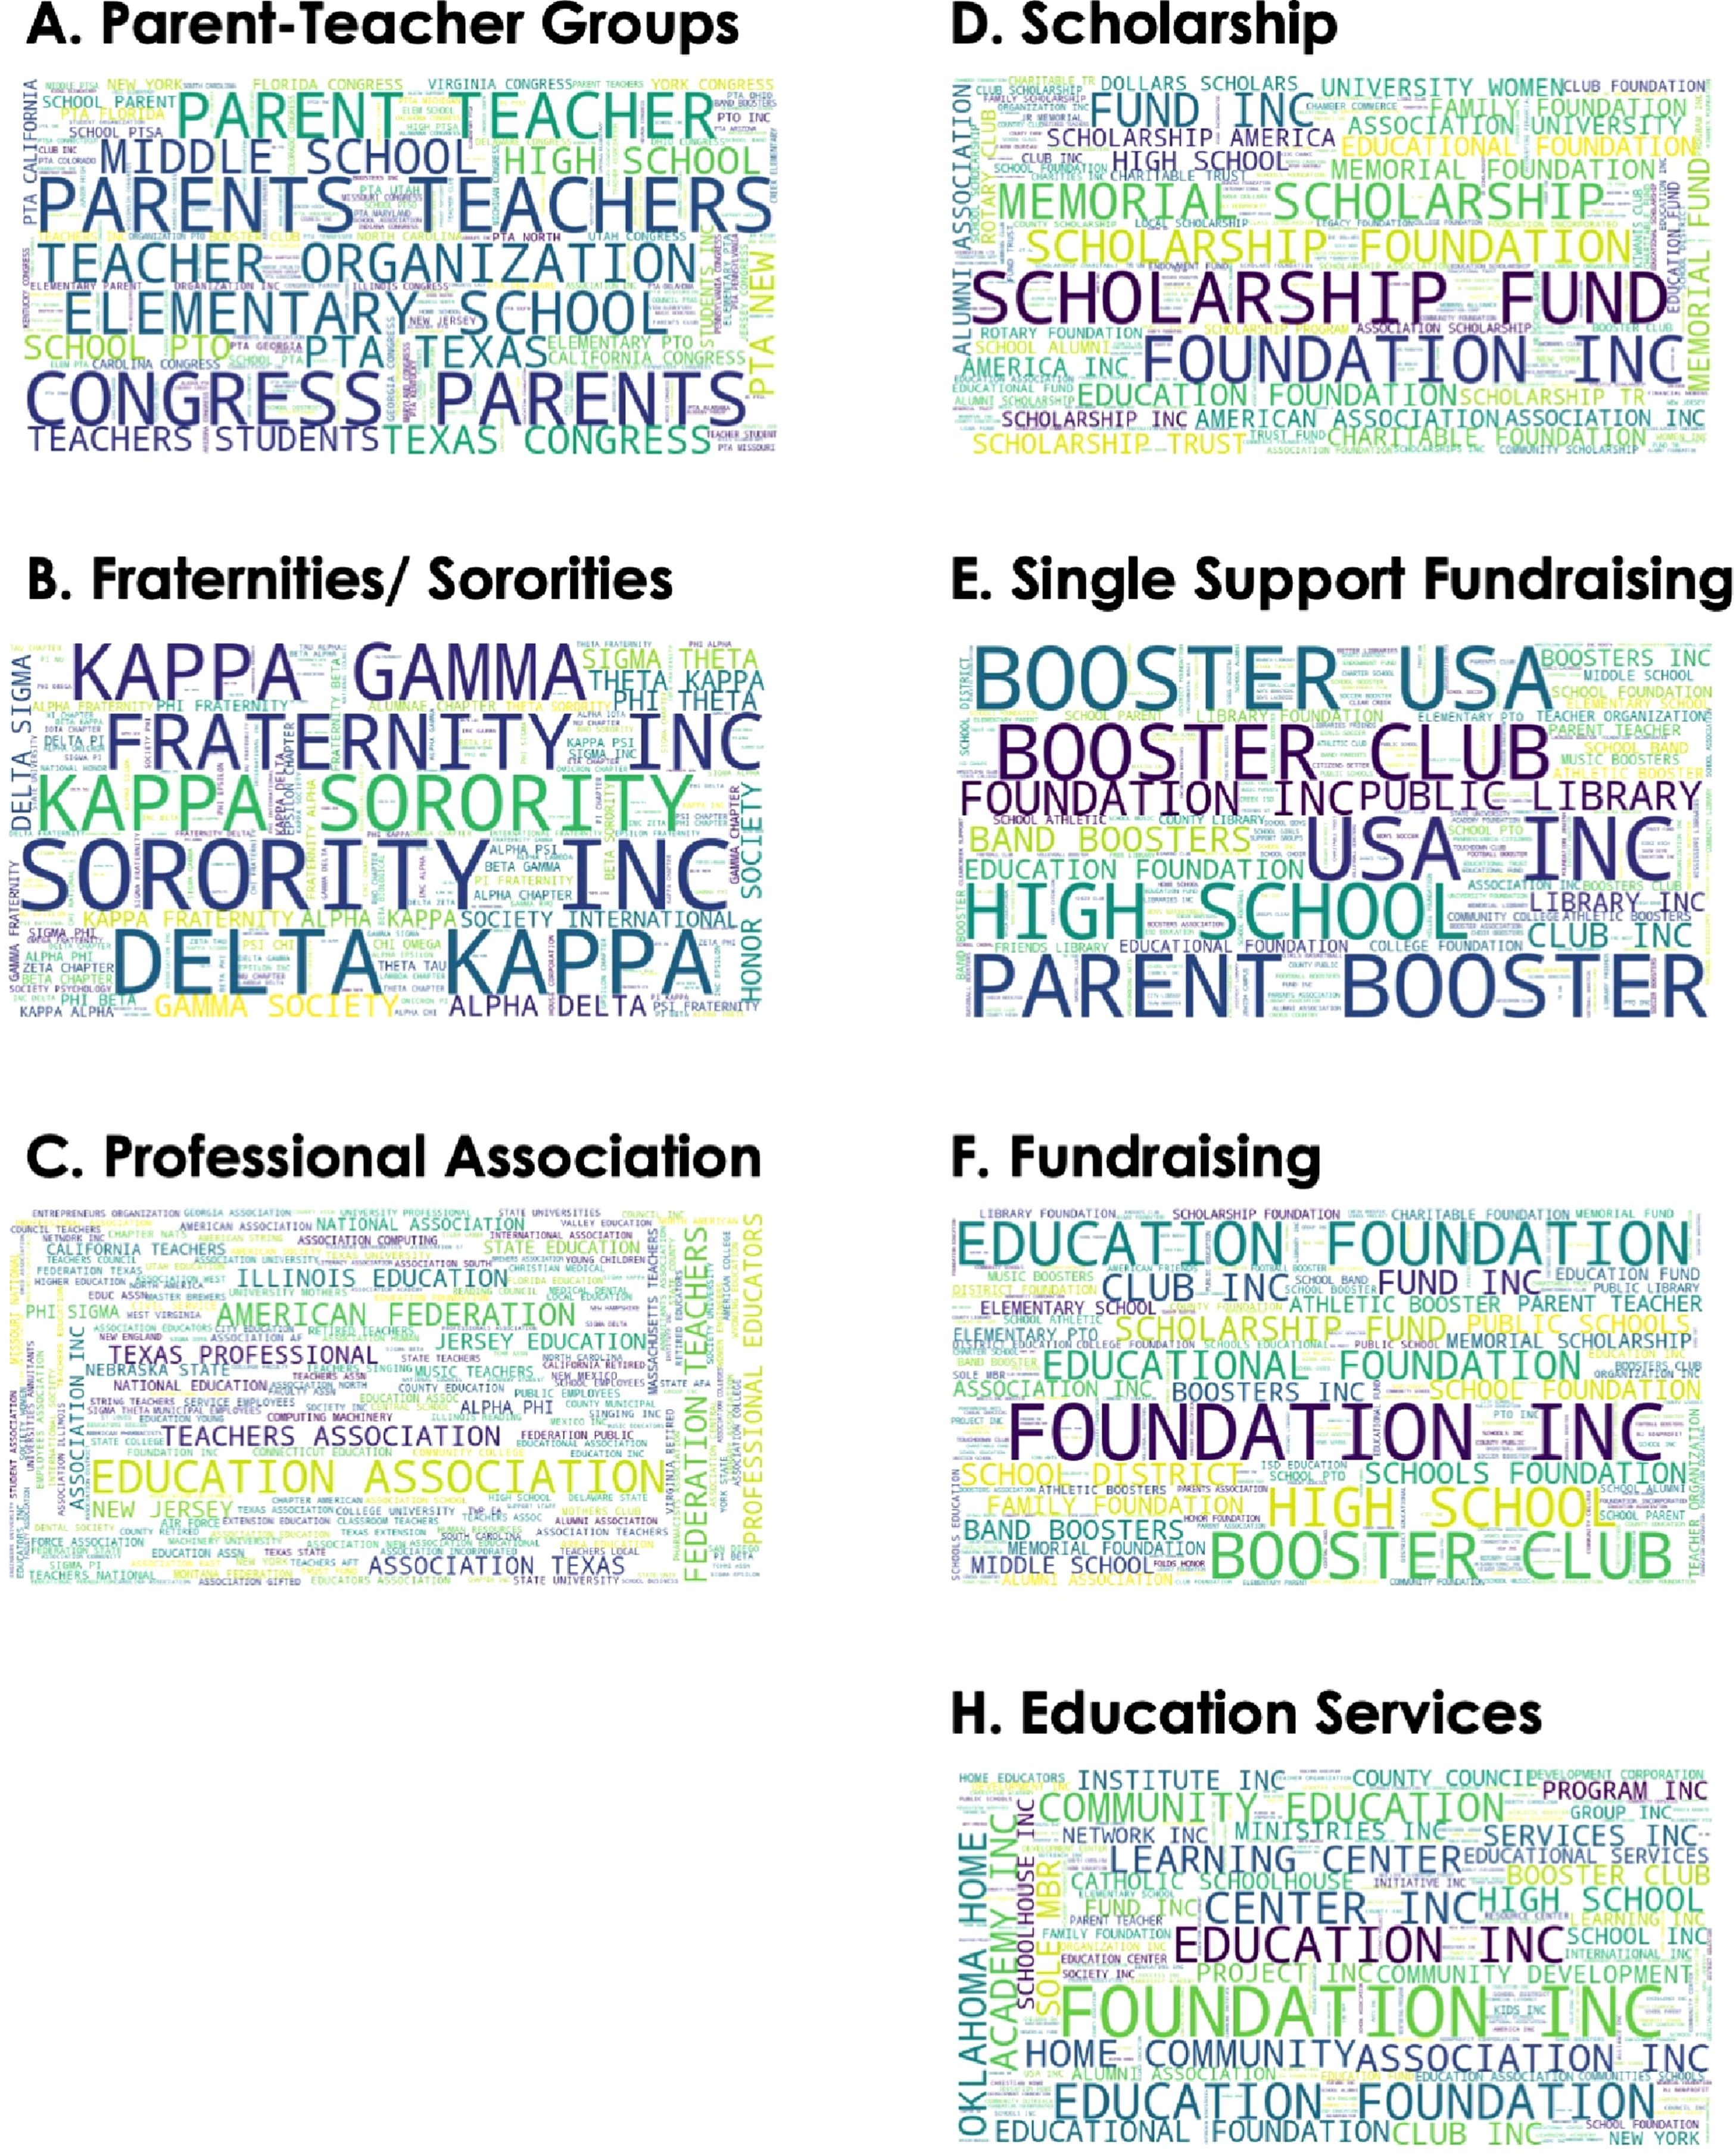
We highlight three broad clusters of nonprofits: educational institutions, professional school improvement organizations, and associational groups. Figure 1(a) presents these clusters further disaggregated into 10 groups and 29 types of organizations, with the width highlighting their relative proportion with each other. Figure 1(b) provides the number of active charities that were categorized in each of the 29 types, suggesting the organizational types with the most number. Appendix Figure A1 provides the relative frequency of words (i.e., bigrams) for the top seven types of organizations. Types of education nonprofits. Panel A groups 29 types of organizations into ten groups and three broad clusters. Panel B provides the number of nonprofits per type of organization.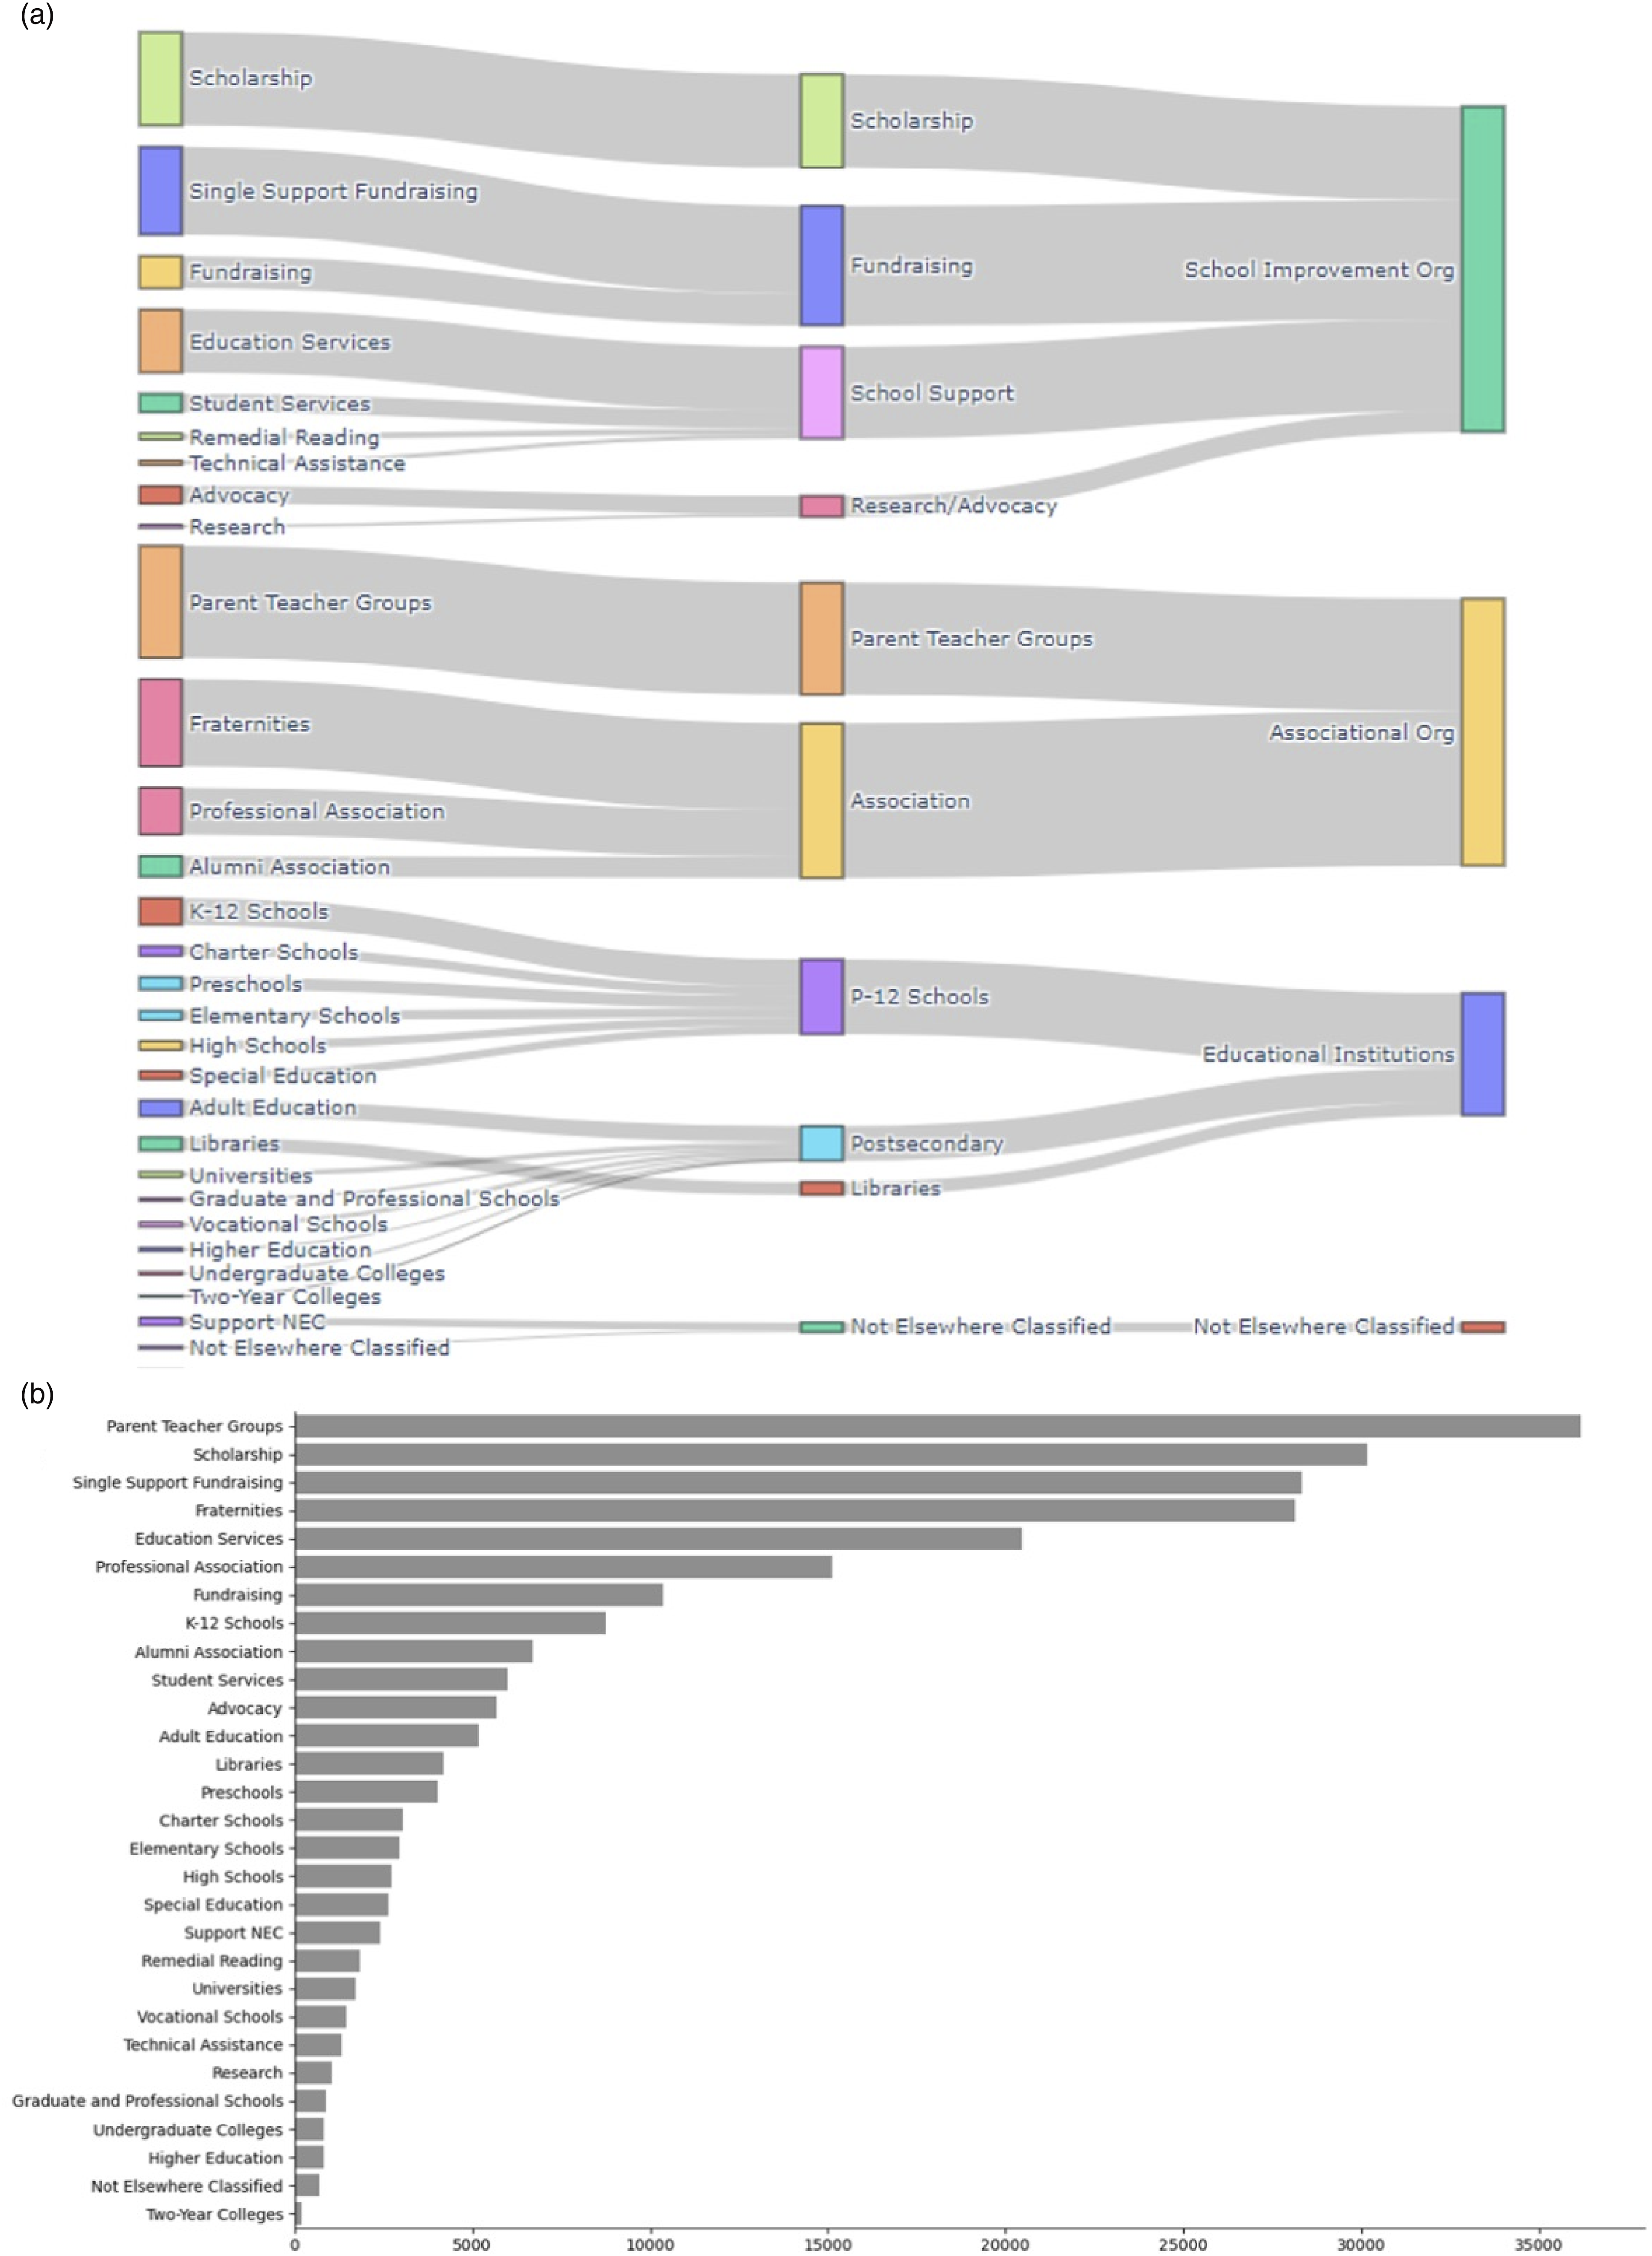
The largest cluster is School Improvement Organizations, with scholarship, fundraising, school support, and research/advocacy organizations. Scholarship organizations are nonprofits that provide financial assistance for students to meet their educational or living expenses. Many of these are education foundations, scholarship funds, memorial funds, and scholarship trusts. Closely related to scholarship nonprofits are two types of fundraising organizations: Single-support fundraising organizations are nonprofits that support and raise funds for single institutions in the education sector while regular fundraising organizations raise funds for multiple organizations. The former include band and athletic booster clubs, “Friends of,” and education and library foundations; the latter include local education funds, community foundations, and groups supporting a district or a set of schools. The scholarship and fundraising organizations make up the majority of school improvement organizations with 30,163 scholarship, 28,319 single-support fundraising, and 10,348 fundraising organizations.
Included in this cluster are school support organizations that provide services directly to schools and research/advocacy organizations that have a less direct impact on individual schools but work with districts and policymakers (Trinidad, 2023). Many school support organizations provide education services, student services, remedial instruction, and technical assistance. Education service is the fifth most numerous type of education nonprofit with 20,470 organizations. These service-providing organizations are diverse as they provide programs with the formal system or used to supplement traditional curriculum. The relative word frequencies show that learning centers, community programs, and education foundations constitute this group. Research and advocacy organizations are separately categorized in the NTEE codes, but they round up the school improvement organization cluster. It must be noted though that the research organizations are potentially undercounted, given that many research groups and researchers are based in universities and do not necessarily file a separate IRS tax form.
A second cluster of organizations include Associational Groups 5 . Parent–teacher groups form the largest group, followed by fraternities and sororities, professional associations, and lastly, alumni associations. Many parent–teacher groups (PTGs) were parent–teacher associations, organizations, and congress—with many organizations being chapters of larger organizations like the Texas Congress of Parents and Teachers. PTGs form the largest group of nonprofits with 36,173 organizations belonging to them. Similar to PTGs, fraternities and sororities also have different chapters in different university locations and form the fourth largest group of nonprofits with 28,120 fraternities and sororities. Professional associations are often associations, learned societies, and professional federations that bring together individuals with an interest in some education profession or vocation like teachers. These professional associations are the sixth largest category with 15,111 organizations. To round up this cluster, alumni associations are groups whose members are graduates of particular educational institutions.
Educational Institutions form the third cluster of education nonprofits, inclusive of Pre-K to Grade 12 schools, postsecondary institutions, and libraries. In the K-12 group, there are 8,744 categorized as private non-profit K-12 school, 3,044 non-profit charter schools, and 4,040 preschools. The postsecondary group is composed of adult education, universities, graduate, and professional schools that create a robust ecosystem as well (see Arum & Kepins, 2020 for a more detailed discussion). Libraries also constitute a small part of these educational institutions. There is a small fourth “cluster” of nonprofits, NEC - Not Elsewhere Classified, which is a group of unclassified organizations whose major purpose is unclear or cannot be accurately assigned to the previous codes. This cluster also includes support and fundraising organizations that help NEC organizations.
This section highlights the variety of nonprofits working in and around education, with many of them falling under either educational institutions, professional improvement organizations, or associational groups. Although various studies have highlighted specific sectors of education nonprofits (e.g., philanthropy, PTGs, and research-practice partnerships), the information presented in this section illustrates the relative number of these organizations vis-à-vis each other. In particular, associational groups are dominated by PTGs and fraternities/ sororities while improvement organizations are dominated by scholarship and fundraising organizations—suggesting that nonprofit activity in education often includes financial supports. Future sections on the temporal distribution of these types of nonprofits will provide more insights into how these organizations have shifted throughout the years.
Spatial Distribution
Education nonprofits often cluster in states and cities with large populations. The five states with the greatest number of nonprofits were California, Texas, New York, Florida, and Illinois (see Figure 2(a)). When comparing the number of nonprofits and state population, the most populous states also have the most number of nonprofits (see Figure 2(b)).
6
One exception to this trend is the District of Columbia, which has significantly more nonprofits than the number of individuals residing there. This is driven by the presence of organizations focused on lobbying and policymaking in Washington DC (De Vries et al., 2023). Despite the trend on nonprofit density in more populous states, there remain variations on the spatial distribution of nonprofits. Nonprofits by US state. Panel A provides the number of education nonprofits per state, inclusive of District of Columbia. Panel B presents a scatterplot of each state’s number of nonprofits and 2023 state population (US census estimate), both in log units.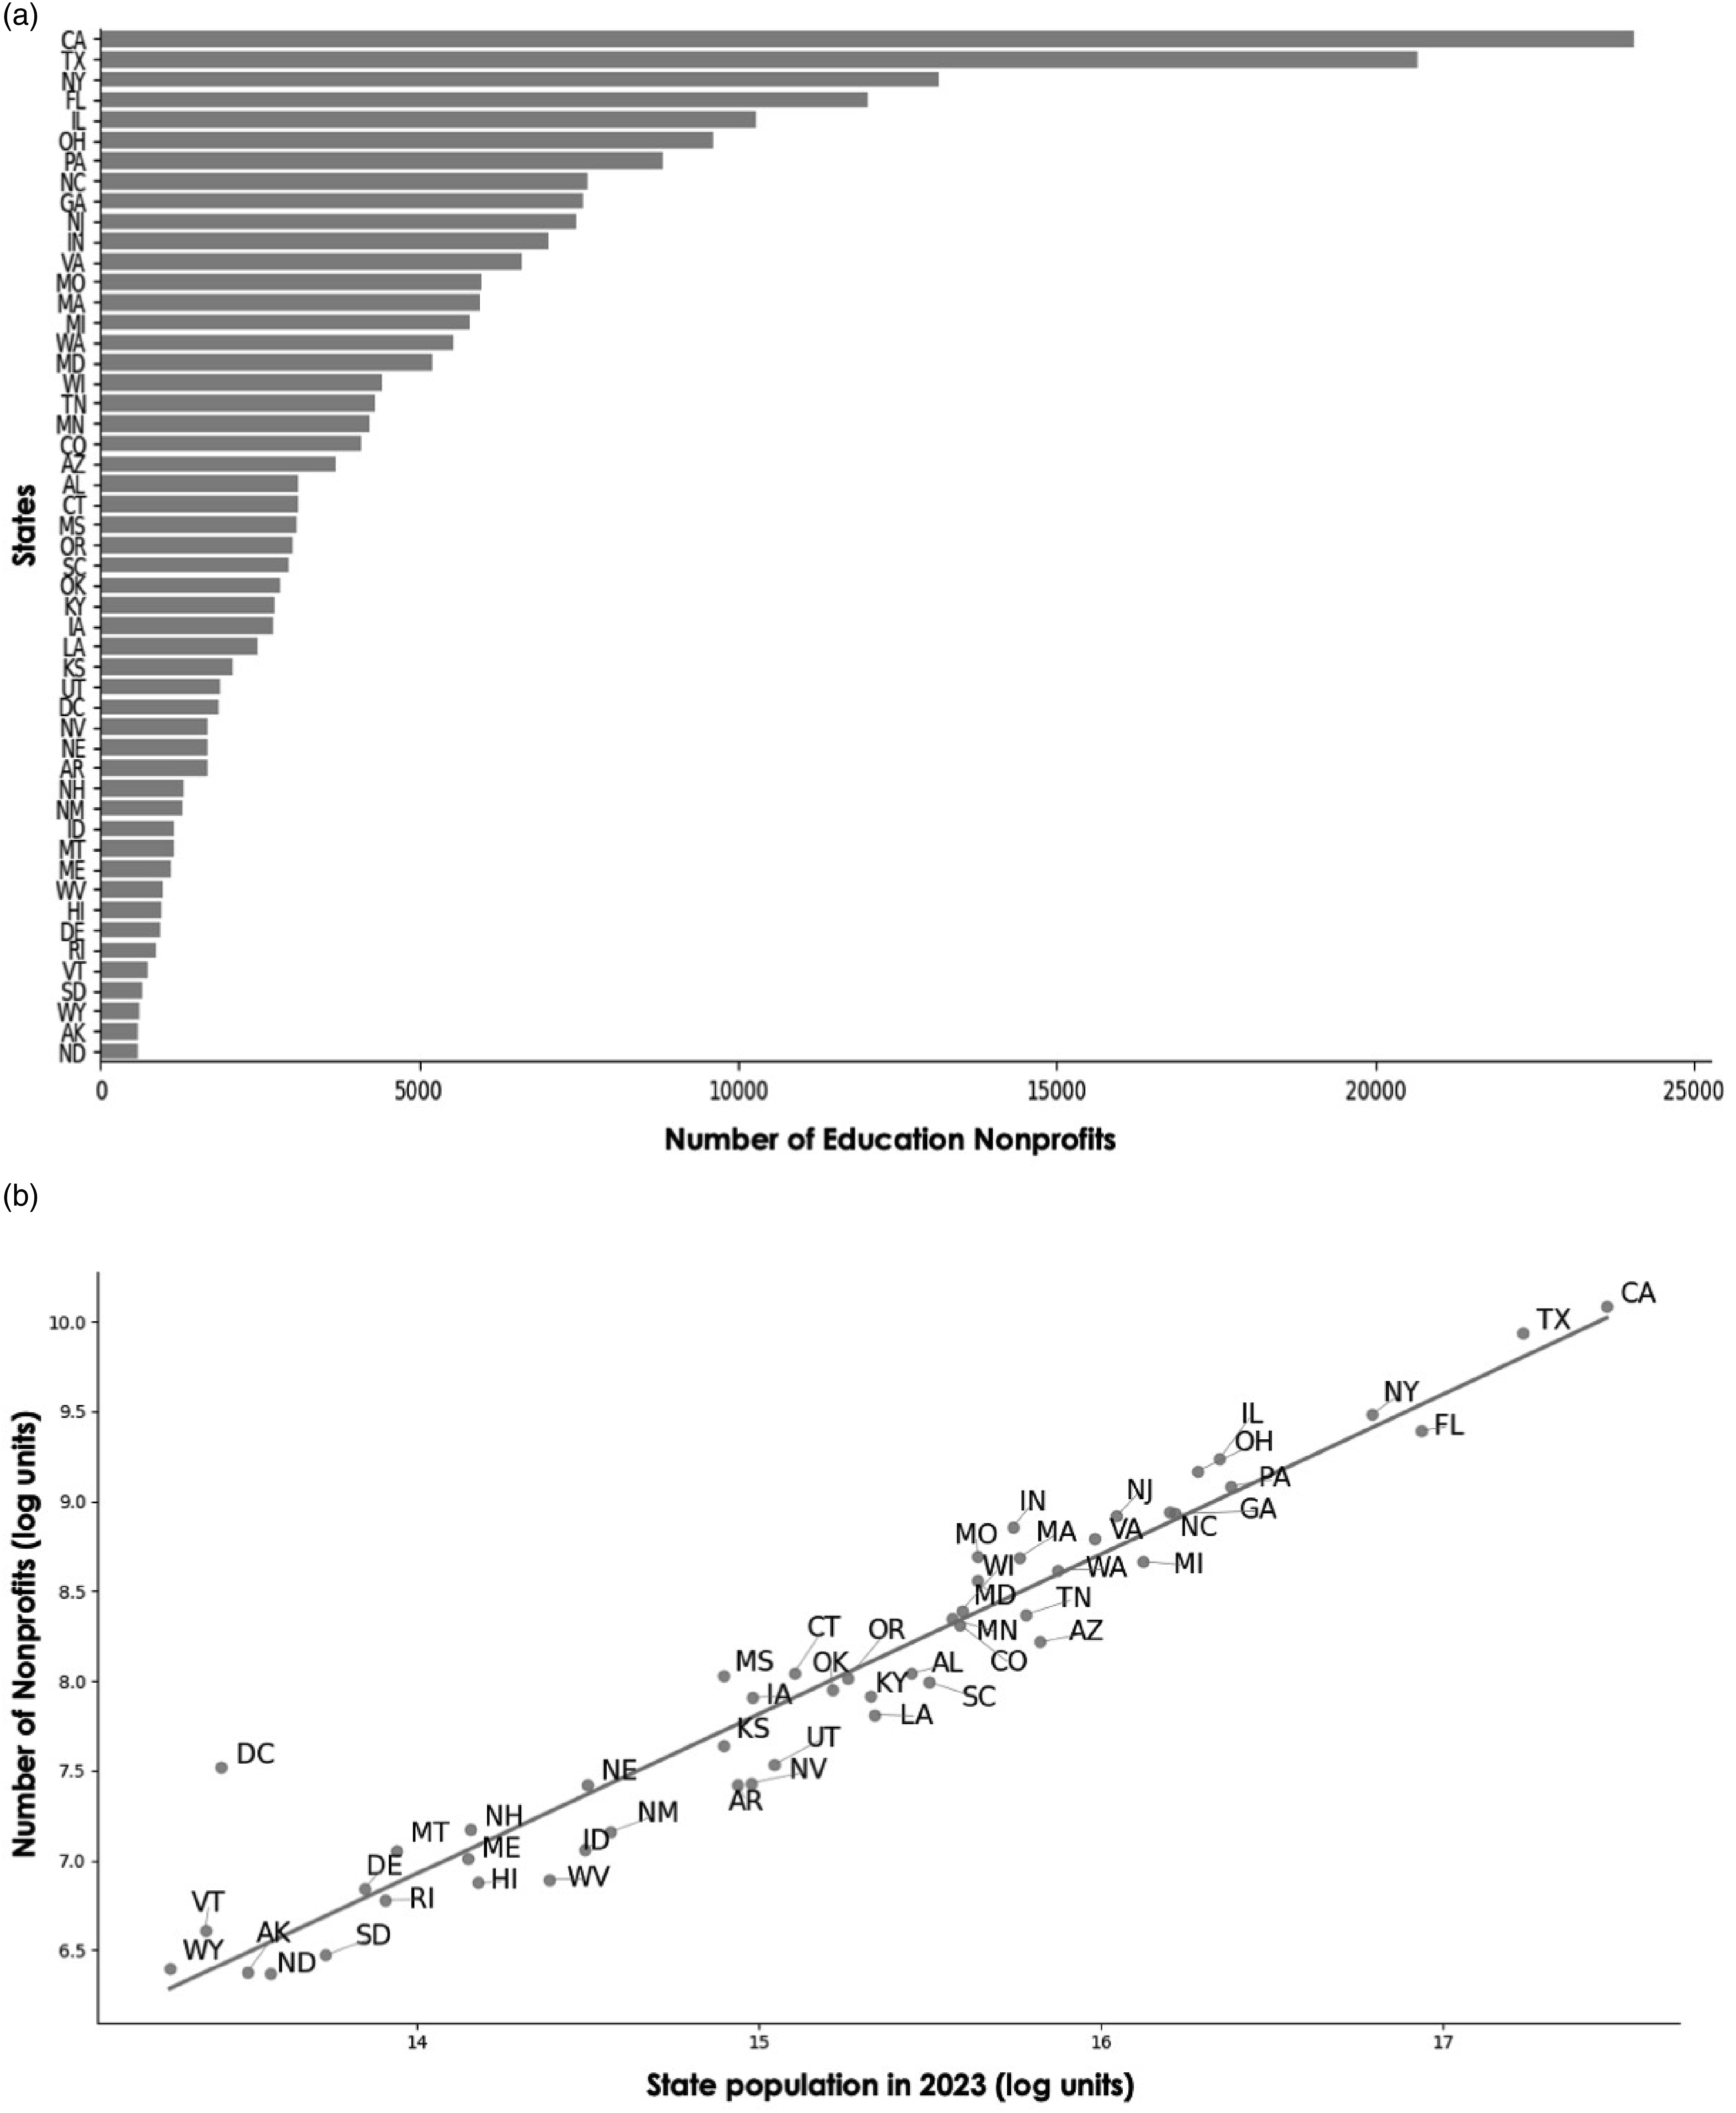
Cities are key spaces for nonprofit activity (Brandtner & Dunning, 2020), particularly as associational organizations support schools and professional organizations work with large urban school districts. Figure 3 presents data on the distribution of nonprofits across the top 30 cities. Although large cities like New York and Chicago have equally large number of nonprofits, relatively smaller cities like Dallas, Austin, Houston, and Indianapolis have a large share of nonprofit organizations. In investigating these cities, we found different types of organizations that drive these large numbers. In Austin, there were 889 professional associations—a lot of these driven by 782 chapters of the Association of Texas Professional Educators “based” in Austin. In Indianapolis, there were 1277 fraternities and sororities—many of which had individual chapters in other places but were “headquartered” in Indianapolis (e.g., Alpha Xi Delta had more than 100 chapters registered there). Thus, these large numbers in particular cities are at times driven by organizations that are headquartered in these cities and that use this city address for their other chapters. Such dynamics may explain why Los Angeles with its large city population only ranks 10th in terms of the number of education nonprofit organizations. Nonprofits by US city. Panel A presents the top 30 cities with the greatest number of nonprofits. Panel B illustrates a scatterplot of the top 30 cities and their city population in 2023 (US census estimate), both in log units. Panel C provides the relative proportion of nonprofits present in the top 50, top 100, and top 500 cities by the number of nonprofits.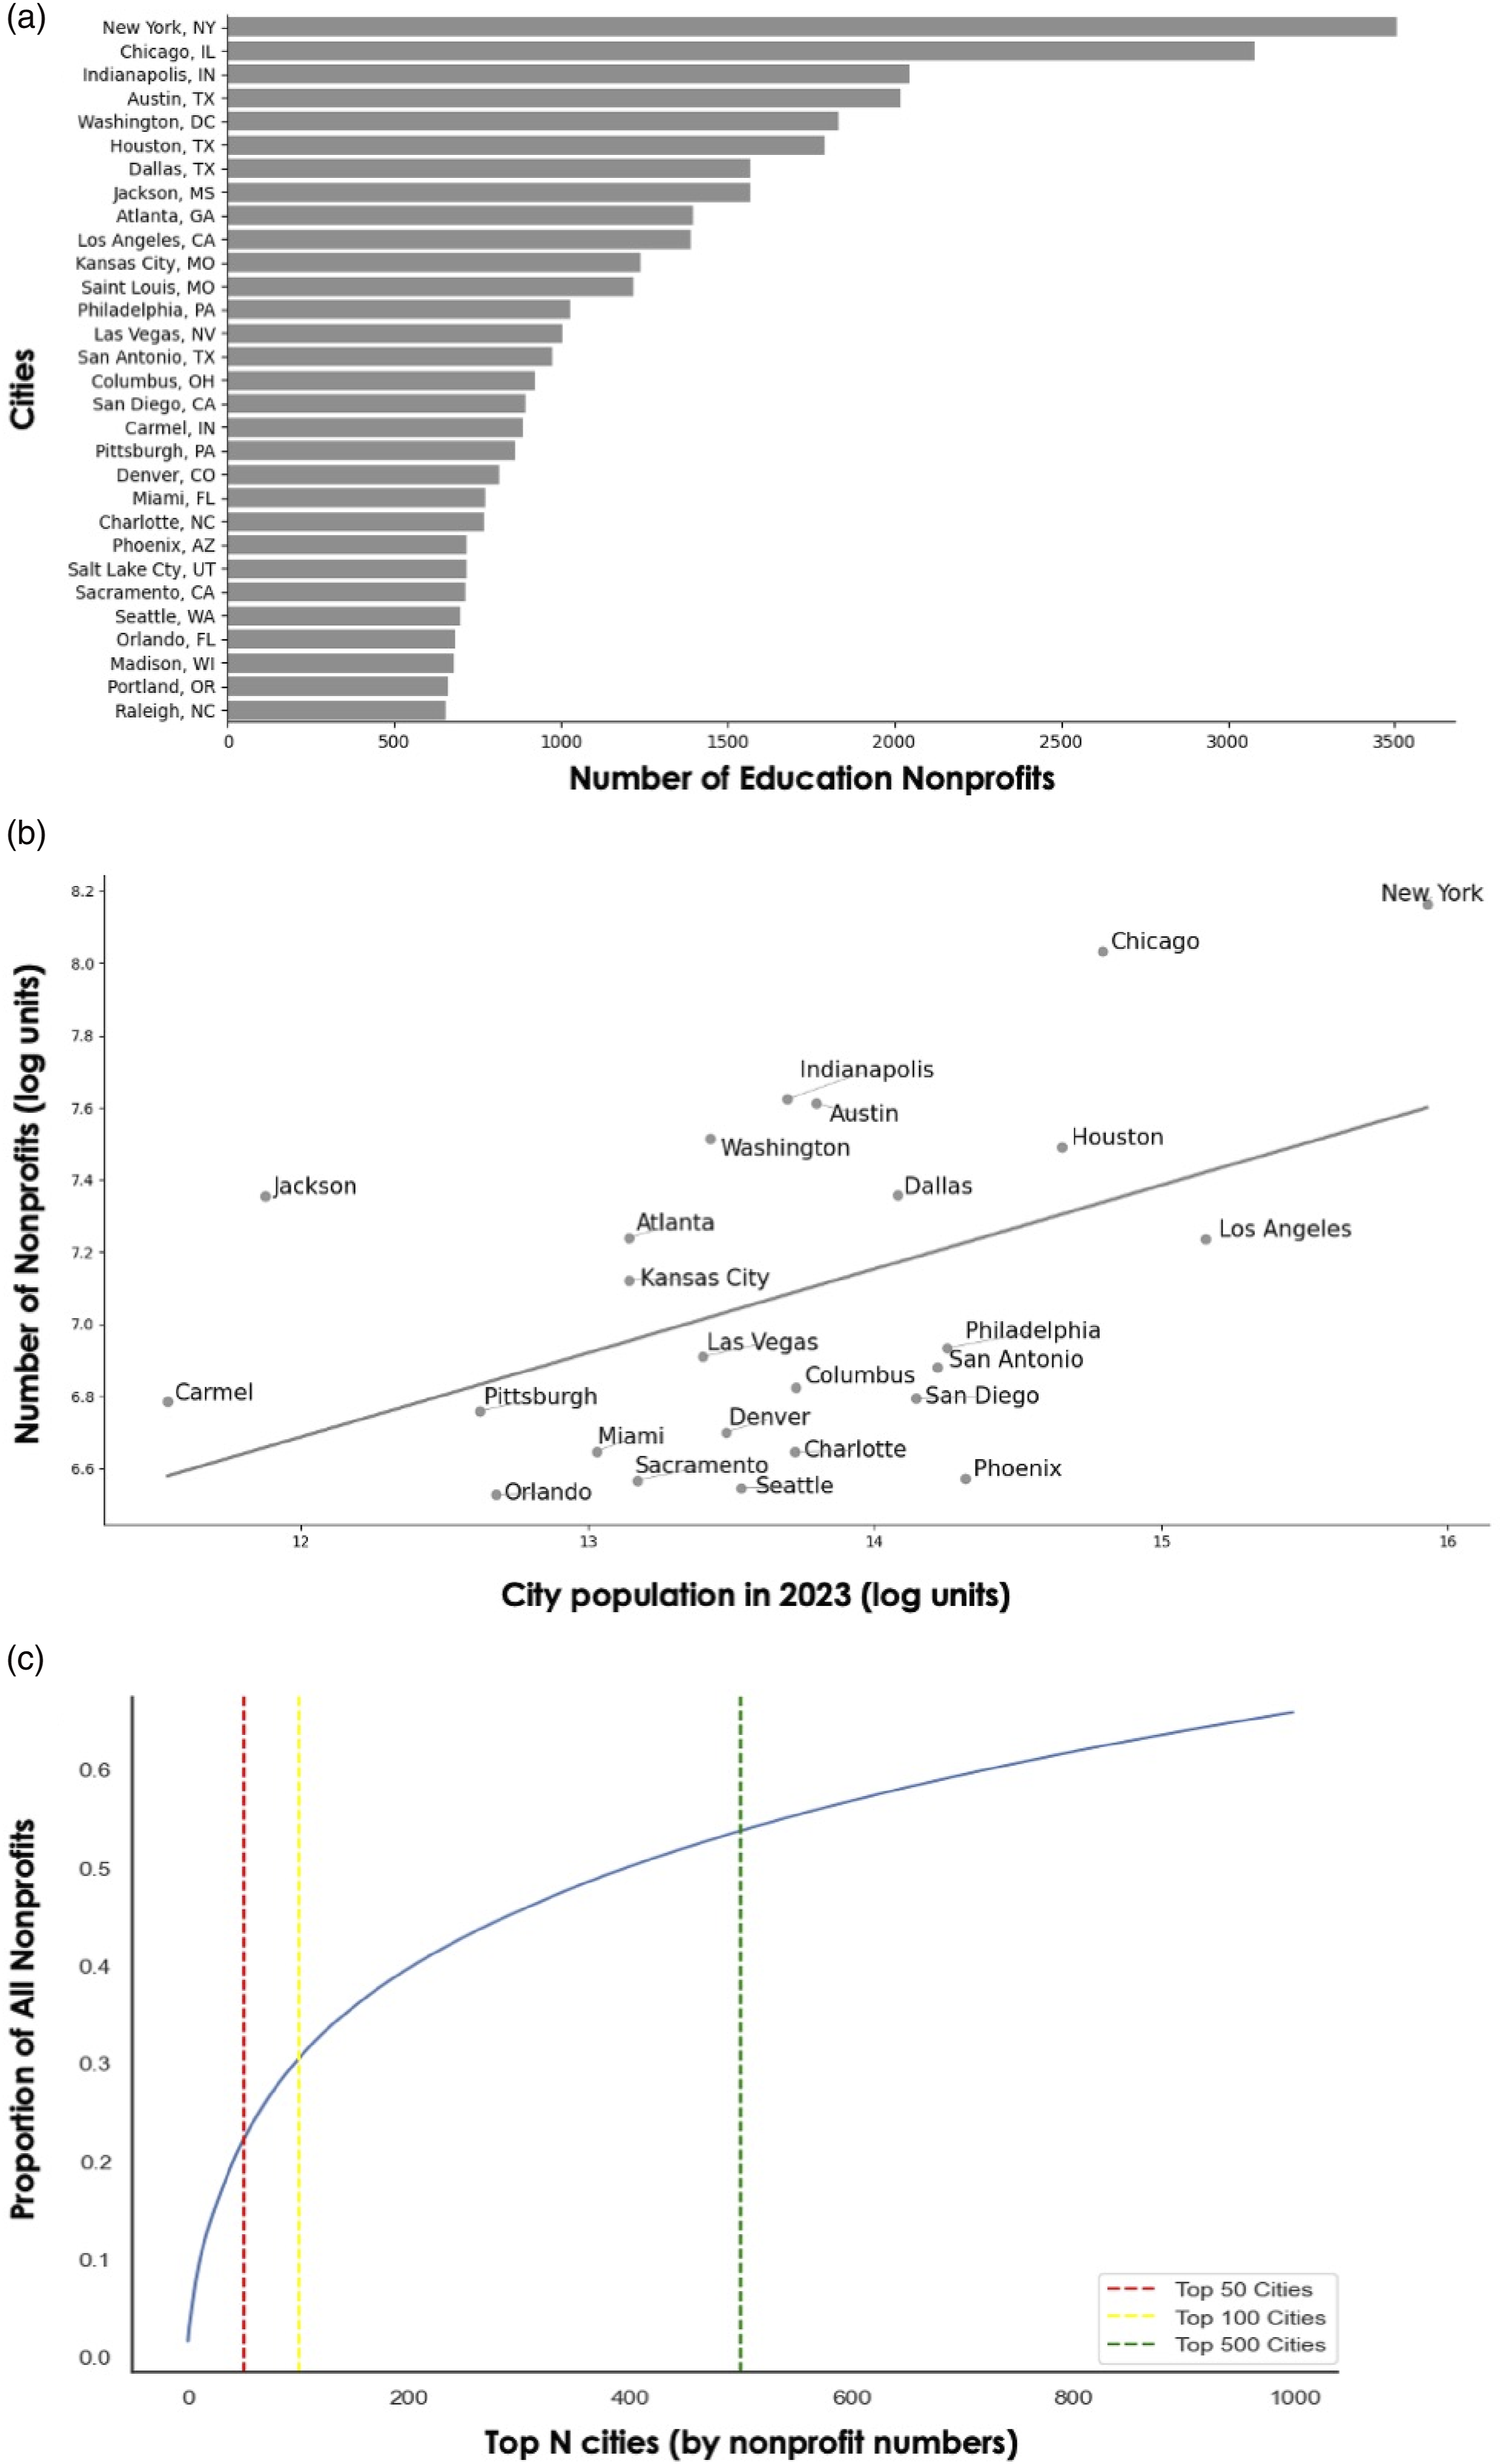
This is an important empirical finding and caution, particularly if researchers plan to use the location variable. Unlike the state distribution, the density of nonprofits in cities does not necessarily correlate as well with the population in those cities because of this difference between where nonprofits are “headquartered” and where they actually serve (see Figure 3(b)). Nonetheless, the present study provides an approximation of the nonprofit density across local areas and the caution in using these numbers.
Figure 3(c) presents the proportion of nonprofits represented in the top N cities. The top 50 cities in terms of the number of education nonprofits comprise just 21.91% of the education nonprofits analyzed. If extended to the top 100 cities with the most number, they only make up 30.31%. Even the top 500 cities only make up 53.70% of all nonprofits, suggesting that many education nonprofits are widely distributed across various smaller towns and municipalities. This suggests that many nonprofits are specific to and aligned with K-12 school districts across urban and non-urban areas.
Temporal Distribution
The number of nonprofits established each year has increased, particularly since the 2010s. Figure 4 presents the number of organizations that were given tax-exempt status for every year since 1900, a proxy for organizational establishment. As seen in the previous Figure 2(b), Texas, California, New York, Florida, and Illinois were the states with the most number of education nonprofits; Figure 4(a) presents data on the number of nonprofits established per year, and how they were distributed across these five states and the other states. Interestingly, there are particular spikes in the data which have been driven by specific states: In 1943, there were 1,933 nonprofits founded in California. In 1954, 1,340 nonprofits were established in New York. In 1967, there were 2,188 nonprofits founded in Texas. Upon further investigation into these spikes, we found that these organizations were mostly PTGs, driven by organizations like PTA California Congress, and PTA Texas Congress. Thus, chapters may be using the original organization’s reception date of tax-exempt status as their own. Further qualitative and historical investigations are needed to understand the dynamics of how and when PTGs receive tax-exempt status. Number of nonprofits established per year. The figure presents the number of nonprofits that were granted tax-exempt status (a proxy for organizational founding) for every year from 1900 to 2024. Panel A further provides the distribution by state, with top 5 states and other states in gray. Panel B provides the distribution by nonprofit type, with the top 5 types and other types grouped in cerulean.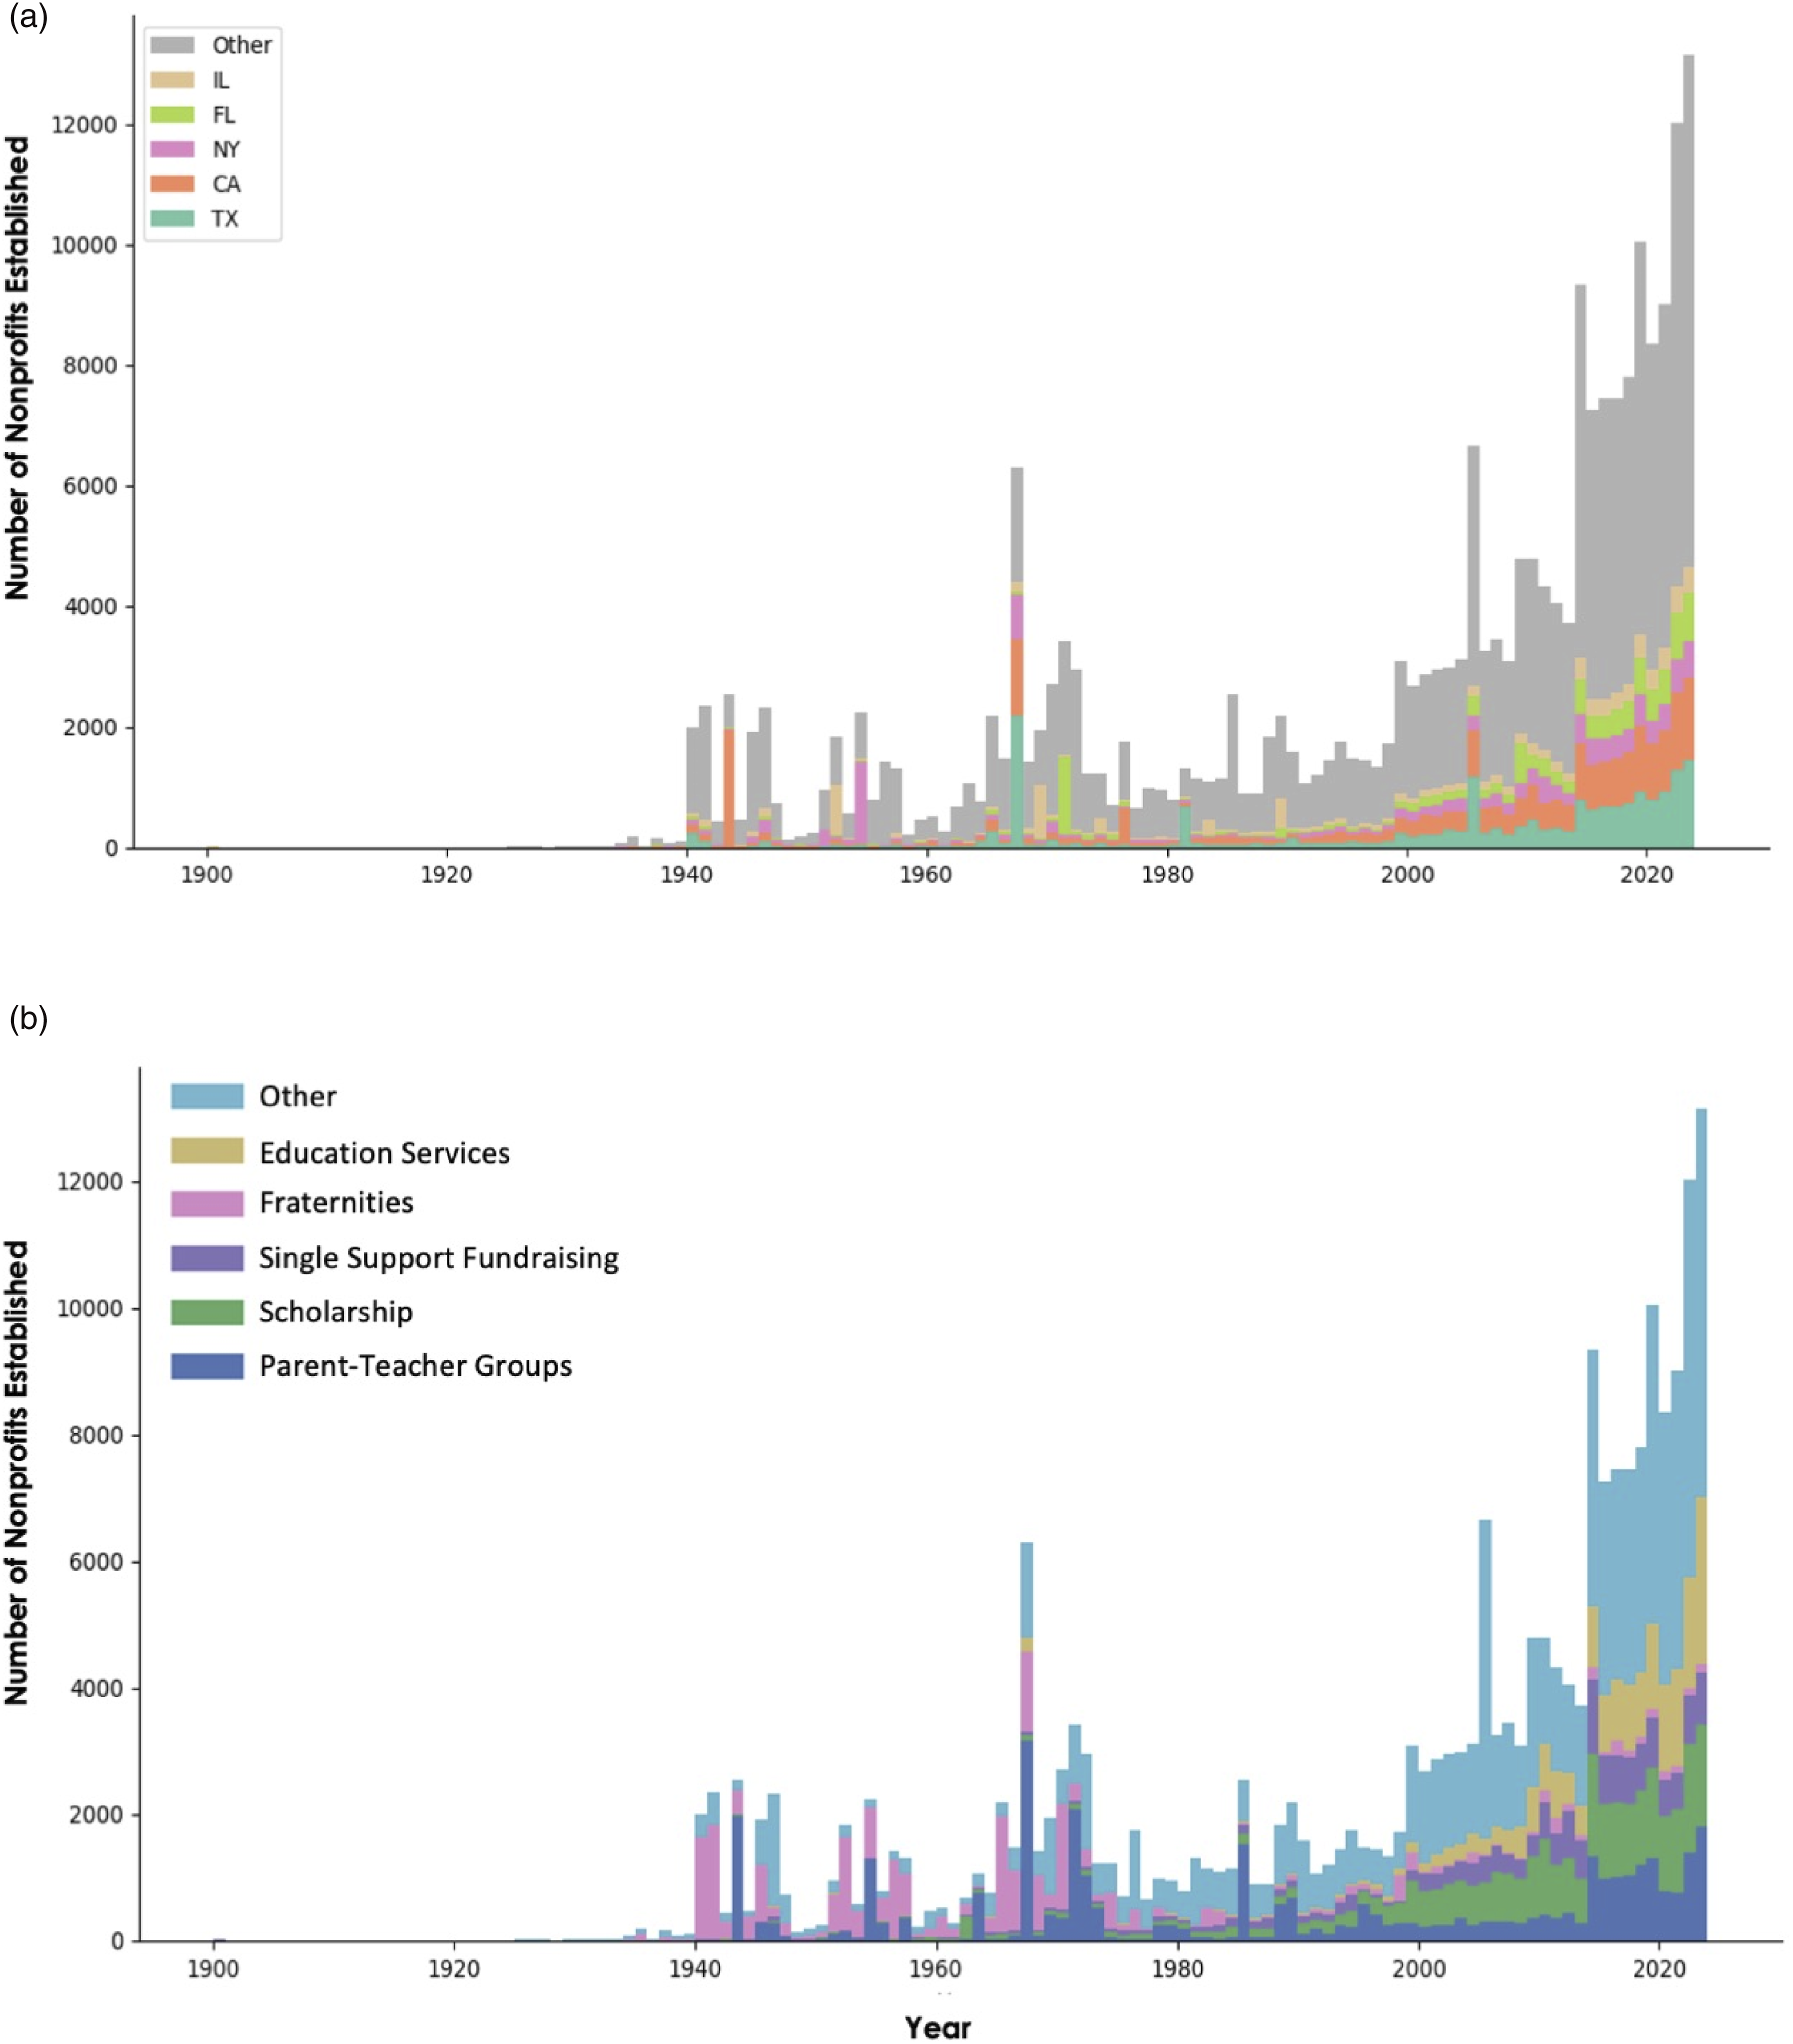
Many of the organizations that were recently founded (i.e., post-2010) were professional organizations providing education services, fundraising, and scholarship. In contrast, many of the organizations founded pre-1970 were associational groups like fraternities, sororities, and parent-teacher groups. Figure 4(b) illustrates that organizations founded toward the left side were in color pink or dark blue, which denote fraternities/sororities and PTGs, respectively. However, on the right side, many more organizations were in color green (scholarship), purple (single support fundraising), and gold (education services). Moreover, there has been a significant proportion of other organizations that have been established in recent years. We interpret this trend as the growing rationalization and professionalization of education nonprofits—a trend that has been documented more generally in the nonprofit sector (Hwang & Powell, 2009; Mosley, 2020).
To supplement this observation, we estimated the proportion change in the number of nonprofits before 1970 and after 2010. Figure 5(a) illustrates the decrease in the proportion of associational nonprofits (fraternities, sororities, PTGs, and professional associations) established between pre-1970 and post-2010. In contrast, we see an increase in the proportion of founded professional organizations providing education services, scholarships, advocacy, and various forms of fundraising. This does not necessarily mean that there has been a decline in associational organizations. Rather, there has been a lot more professional organizations founded in recent years and as a result, the nonprofit ecology has become a lot more diverse in terms of activity. Figure 5(b) illustrates that more than 50% of founded organizations before 1970 were associational organizations. Between 1970 and 2010, proportions have become more heterogenous with fundraising, scholarship, and education service organizations. After 2010, a lot more organizations founded concentrated on providing scholarships, services, and funds. Proportion change in nonprofits established, pre-1970 versus post-2010. Panel A provides the change in the relative proportions of the nonprofits established per type, comparing before 1970 and after 2010. Panel B presents the percentage of nonprofits that were established according to each type, before 1970, between 1970 and 2010, and after 2010.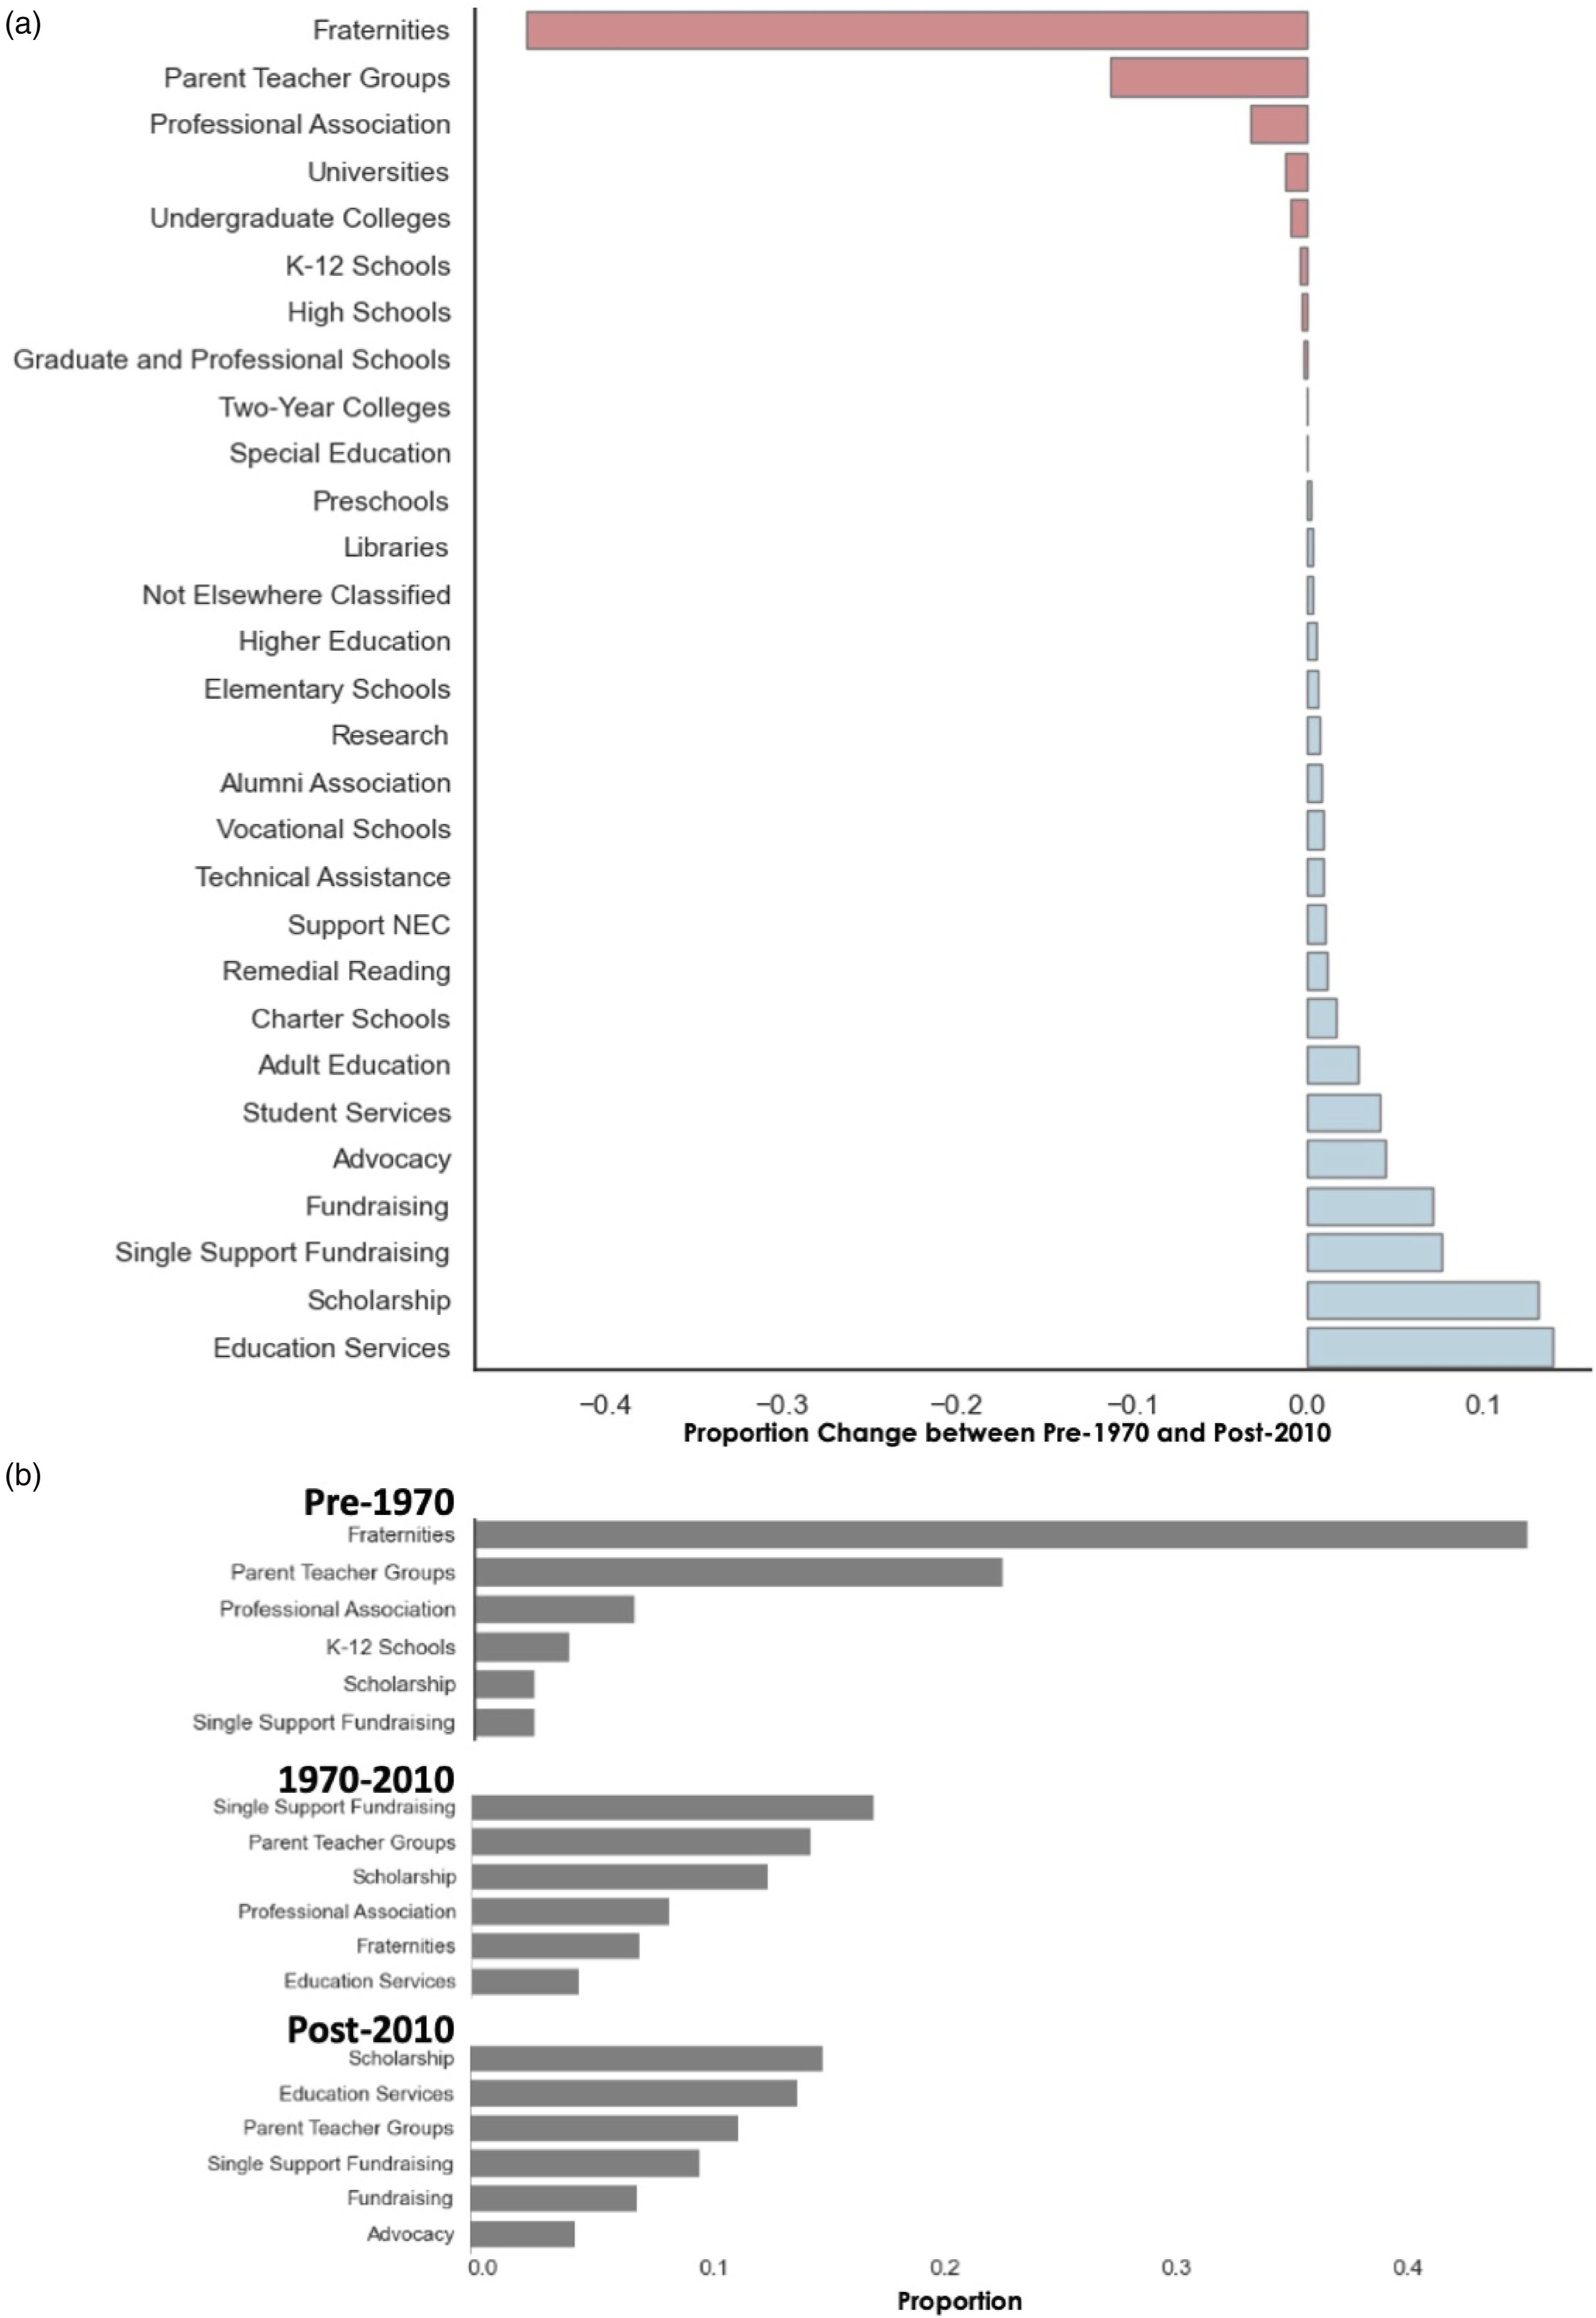
Although future studies have to investigate the cause of this greater professionalization and diversity of the education nonprofit field, we offer a number of possible explanations: (1) the presence of various government grants in supporting education services, (2) the greater influence of research and professional development organizations, (3) changes and decentralization in funding that demanded greater philanthropic support, and (4) the increasing costs of college that have led to a greater reliance on scholarship programs.
Discussion
The ecosystem of education is changing, with states turning to vouchers, nonprofit charter schools partnering with for-profit management organizations, education foundations emerging in wealthy districts, and research and service grants being threatened by federal budget cuts (Lavertu & Tran, 2025; Murray et al., 2019; US Department of Education, 2025). In this present climate, researchers need a better understanding of the outside-school factors affecting education. Our paper contributes to this by (1) providing a preliminary description of the variety of education nonprofits, (2) noting empirical findings from nonprofit records, and (3) highlighting the intricacies of working with nonprofit tax data.
Implications for Research and Methods
Understanding the ecology of US education nonprofits helps clarify the wide variety of potential factors influencing education. For education politics and policy, it highlights how change can come not only from philanthropic, advocacy, or research organizations but also from education service providers and professional associations. For education sociology, it shows that inequalities may arise not only from differences in schools but also from differences in local civic capacities. For education leadership, it highlights how school leaders have to transact and negotiate with more organizations given the recent increase in nonprofits.
Theoretically, the paper presents opportunities to extend studies in education policy, politics, and sociology. Policy studies have often relied on government policies, but numerous non-government entities like education nonprofits can affect which policies are enacted and how they are implemented (Trinidad, 2024, 2025). The categorization of the different nonprofits can be a useful starting point for deeper research on particular sectors or on the interactions across different sectors. Studies of education politics have often focused on the ways professional nonprofit and philanthropic organizations influence education governance (Ball, 2008; Marsh et al., 2021). However, little is discussed about the interaction between professional and associational organizations, which may be a generative place for new research to emerge. Sociological studies have recently documented the role of school-based and/or school-supporting nonprofits on unequal distribution of resources (Bridwell-Mitchell et al., 2023; Mackevicius, 2022; Murray et al., 2019). Further studies can explore the role played by the presence and density of professional nonprofits in particular areas.
Methodologically, the paper can support other researchers in using the IRS data to answer many other important questions. We endeavored to provide extensive discussions on the intricacies and limitations of the data. Complementing previous work using the dataset (Lampkin & Boris, 2002; NCCS, 2024), we show the ways education researchers can use the 29 NTEE categories, how these can be grouped into clusters, and how they may be investigated spatially and temporally. The data have a number of strengths like its being the most comprehensive longitudinal and national source of educational charity information (as some nonprofits are in other parts of the tax code), its providing a way to sample education nonprofits, and its being a starting point for further qualitative studies by enumerating the wide variety of potentially interacting organizations.
Implications for Practice and Policy
School leaders and education policymakers need to understand the various organizational actors influencing their actions and decisions. For school and district leaders, the understanding of these various nonprofits can help them determine which nonprofit types can be supportive of their efforts and can caution them with potential pitfalls. For policymakers, understanding the types of organizations in their states and cities can signal where civic capacities or professional service providers may be present or lacking. For individuals interested in improving education, this paper shows the wide variety of organizations outside schools they can support or work in.
Limitations and Future Research Directions
We note a number of limitations in our data and study. First, it relies on reporting 501(c)(3) organizations, which may mask other organizations filing in other tax codes and organizations subsumed into larger organizations (e.g., research center in a larger university that files the IRS tax form). Second, the categorization of nonprofit types (i.e., IRS NTEE codes) may be limited if missions have changed, if organizations have multiple purposes, and if human coders make a mistake. This can be investigated with comparisons to new nonprofit categories and by using text analysis of organizational websites (Powell et al., 2016). Third, we found that founding year data may not always be accurate, particularly as some PTG chapters may have used the founding date of the larger state organization, thus inflating the nonprofits established during certain years. Fourth, this descriptive study failed to answer important questions regarding nonprofits’ contribution to learning outcomes, inequalities, as well as school and state politics.
We see these limitations as helping initiate new research questions. Future research can use surveys of education service organizations regarding differences and impact of community-based, youth-led, professional fee-paying, or supplemental education organizations (Baldridge, 2019; Burch, 2009). Historical studies of education nonprofits like PTGs, teachers unions, and fundraising organizations can clarify why many groups had received tax-exempt status during similar years. Ethnographic studies in cities similar to the one by Fuller (2022) can support the understanding of interorganizational activities and partnerships. The current data can help with the purposive sampling of education nonprofits or cities. Further investigative work can also be done with nonprofit financial data as other (less nationally comprehensive) datasets are available like the IRS 990 Electronic Filing Database that “consists of millions of files containing individual returns that include over 2000 fields from the 990 forms and schedules” (Lecy, 2023). Other studies can also focus on (1) the emergence of private schools and charter schools, particularly in states that are turning to voucher systems, (2) the creation of education foundations in wealthy districts that threaten equitable funding of schools, and (3) the response of research and service providers to federal budget cuts. We hope our research can initiate further studies into various aspects of education nonprofits as our aim is to open important lines of inquiry for more scholars to study this wider ecology.
Conclusion
Our paper presents an overview of the ecology of US education nonprofits, with three core insights: (1) Nonprofits can be grouped broadly into three clusters—educational institutions, school improvement organizations, and associational groups—and more specifically into 10 categories and 29 types. (2) State population size and number of nonprofits are correlated, but there are a lot of variations at the city level. (3) Nonprofits’ date of establishment suggests that recent years have seen the rise of more professional rather than associational organizations as the proportion of fundraising, scholarship, and education service organizations have increased. The exploratory analysis provides empirical evidence for deeper investigation of trends and some methodological support on using nonprofit tax data. In this paper, we aim not so much to provide definitive answers regarding questions about education nonprofits but to motivate new lines of inquiry for generative research to emerge.
Footnotes
Acknowledgment
The authors thank the editors and the three anonymous reviewers who provided important comments and suggestions.
Declaration of Conflicting Interests
The author(s) declared no potential conflicts of interest with respect to the research, authorship, and/or publication of this article.
Funding
The author(s) disclosed receipt of the following financial support for the research, authorship, and/or publication of this article: This work was supported by University of California (Regents Junior Faculty Fellowship).
Notes
Appendix
Relative word frequency of nonprofits according to type (top seven). Panels A to C are bigrams of associational groups while Panels D to H are bigrams of professional school improvement organizations.