
Abstract
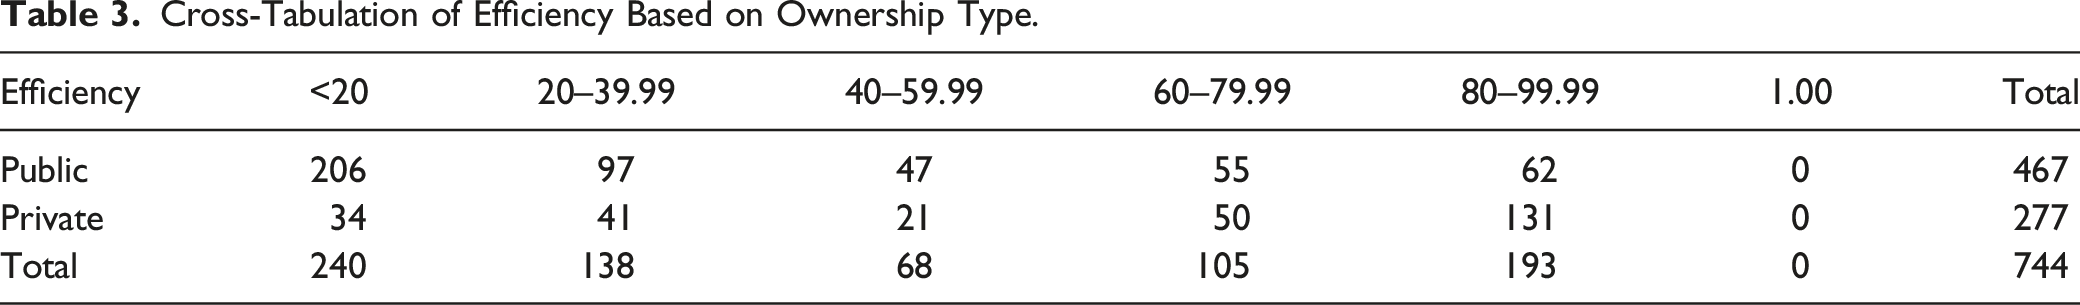
Despite huge investments in the educational sector, many countries in Africa have not fared well in the education indices. This study examined the effect of teaching equipment and teachers’ effort on learning outcomes in 744 Nigerian primary schools using Stochastic Frontier and Ordinary Least Square regression. The mean technical efficiency was 0.43 which showed most of the surveyed schools were technically inefficient. Also, 42.8% of public primary schools operate below 20% efficiency level as against 12.3% in private primary schools. Factors influencing efficiency include school ownership type, visits from the Local Government Education Authority Student-Teacher ratio, and school hygiene.
Background to the Study/Problem Statement
Education remains a very vital tool for the development of the capacity of citizens of any nation (Boateng et al., 2020). Thus, the government’s effort at ensuring inclusive and equitable quality education and to promote life-long opportunities for all should be a key requirement for achieving the new Sustainable Development Goals (SDGs). Education occupies a central place in the current global policy discourse on service delivery (Amin & Ntembe, 2021). The performance indices of the Nigerian educational sector on the Millennium Development Goals (MDGs) are worrisome. The country parades a large army of out-of-school children and young adults with limited literacy and numeracy skills. Nigeria currently has the highest number of out-of-school children in Africa estimated at 10 million (UIS-UNICEF, 2015). According to the US Embassy United States Embassy, 2012a, United States Embassy (UIS), 2012, less than 33 percent of primary school children will proceed to senior secondary school.
Educational development in Nigeria is undermined by poor budgetary allocations. Over the years, Nigerian budgetary allocation to education has been below 10 percent of total expenditure. Meanwhile, recurrent activities account for 70 percent of the expenditure on education (Edame & D Eturoma, 2014; Isah, 2006). Again, the budgetary allocation to education has been decreasing consistently for the past 5 years (Kolawole, 2016). In fact, between 2011 and 2015, Nigeria allocated NGN306.3bn (7.6 percent), NGN400.15bn (8.43 percent), NGN426.53bn (8.7 percent), NGN493bn (10.7 percent), and NGN492.034bn (8.7 percent), respectively (Kolawole, 2016). This expenditure figure is below the UNESCO recommended 29 percent of national expenditure which should be allocated to education. Also, the inability to evaluate the outcomes and the process in concrete terms makes planning difficult. Thus, for accessibility and quality outcome, there is the need to evaluate the efficiency of the schools to better understand investment priorities in the Nigerian educational sector. This will help in measuring the quality-of-service delivery quantitatively towards prioritizing efficiency (Newberry, 2007). Efficient service delivery has been defined as the provision of services in a way that provides value for money and high performance while instituting structures and processes to ensure sustainability (Sirkoi et al., 2021). Therefore, the investment in the sector will be based on measurable goals so that planning becomes more robust and efficient.
It is a well-known fact that government allocates resources for the provision of public goods to achieve a set of economic and social objectives (Edame & Eturoma, 2014). The efficient allocation of resources to achieve the goals is important for macroeconomic stabilization and economic growth (Gonand et al., 2007). The insignificant impact of huge investments on educational systems in Africa in literature has been associated with the incentives and processes. The development of the educational sector is bedeviled by inadequate physical infrastructures, the insufficient number of textbooks, and a large student-teacher ratio. Scaling up of investment in the educational sector may facilitate a greater expansion in the provision of public services, but increased flows will also bring challenges in managing and delivering that extra service. For instance, building schools is a good thing, but the new school will do little good unless it is filled with teachers who are paid well enough to show up regularly to teach, and students who are well fed to learn. Therefore, an increase in the allocation of resources needs to be complemented with improved staff welfare to achieve the much-needed development.
This study is premised on the need to understand the ease of access, quality of, and constraints to service delivery in the Nigerian primary schools. Literature is inconclusive on the set of indicators used in measuring the quality-of-service delivery. Most indicators used in literature focused on development outcomes rather than the process through which the outcomes were created (Bold et al., 2010). The efficiency and effectiveness of government expenditure, quality, and availability of human capital in the educational sector have not been properly captured. This study, therefore, seeks to fill the gap around the efficiency and effectiveness of Nigerian schools to guide policymakers, development partners, and other key stakeholders on investment priorities and policy varieties required to improve the educational sector. Accurate information resulting from the internalization of the indicators will help citizens engage their governments and challenge them to do more. This becomes important when they are evaluated based on the outcomes and underperformance. In addition, this study is relevant to the fourth Sustainable Development Goal (SDG) targeted at ensuring inclusive and equitable quality education and promoting life-long learning opportunities for all. It is against this backdrop that this study investigates some correlates of learning outcomes in Nigerian primary schools to guide policymakers.
Objectives of the Study
The specific objectives of the study are to: (i) Assess the current state of service delivery in the Nigerian Primary Schools. (ii) Determine the efficiency of service delivery in the attainment of learning outcomes. (iii) Examine the determinants of efficient service delivery in the Nigerian Primary Schools. (iv) Identify and prioritize the constraints to efficient and effective service delivery in the Nigerian Primary Schools.
Theoretical Framework, and Literature Review
Theoretical Framework
The theoretical foundation of this study is premised on the contemporaneous educational production model. The origin of the contemporaneous educational production model dates to Coleman et al. (1966). In Coleman et al. (1966) report, input-output analysis reflects information on management, integration, accountability, and finance of elementary and secondary schools, however, the relationship became known as economic functions by economists through semantic changes. The term education production function developed from the concept of a production function, which describes the maximum feasible output from different sets of inputs (Hanushek, 1979). Education production function/model is generally a statistical analysis that shows the relationship between students’ outcomes-dependent variable and student’s characteristics, his/her family background, characteristics of his/her peer in the school as well as characteristics of his school-independent variables (Boateng et al., 2020).
Conceptually, the educational production relationship is dynamic and its analyses are cross-sectional. Therefore, measures of its inputs are contemporaneous, some educational inputs are proxied by observable features and they are not measured directly. There is a divergence between the educational production model and its empirical model and proper interpretations of empirical results of the conceptual model require a series of implicit assumptions (Hanushek, 1979). The contemporaneous educational production model premises on some assumptions, namely: (i) Only contemporaneous inputs matter to the production of current achievement. (ii) Contemporaneous inputs are unrelated to unobserved innate ability and unobserved past educational inputs. (iii) There is the possibility of omission of important variables in the model which consequently may lead to errors of measurements. (iv) The estimation of its model is based on the observed behavior of schools.
Estimated education production function/model has been criticized based on interpretations of their analyses. Most educational production models are estimated either in linear or logarithmic forms, however, different functional forms yield different results, meaning that their results cannot be generalized for forecasting (Arshad, 2012). Two, aggregation problem, education outcomes data is at the individual student level, but only aggregated data about school is taken into consideration. This may lead to measurement errors in the analysis. Three, endogeneity problems are often encountered when estimating an educational production model (Glewwe, 2002). Four, it does not consider the possibility of non-reproducible skill differences. In addition, multicollinearity in educational data is commonplace (Bowles & Levin, 1968), data on the education production model is not exceptional because often, there are correlations among its regressors. The possibility of dynamic choices in the selection of inputs is, however, uncertain.
Despite, the shortcomings of the model, its choice in the study is because it is the foundational root of other educational production models. Hanushek (1979) contended that previous studies on education production used only contemporaneous inputs because data on historical inputs were very limited and most times inaccessible. In addition, its overall analytical power cannot be ignored in educational research.
Review of Empirical Literature
Laura and Rutkowski (2008) explored the various pressures that national education systems in the Asia and Pacific countries face in the development and negotiation of educational policy. These pressures include shifts in expenditure, issues of access and equality, and the changing composition of student enrollments, including the increase of girls in primary education. In their view, primary education is a public responsibility while tertiary is a private investment connected closely with human capital development. They also concluded that in addition to the fact that increased education of girls bridges the gap of gender inequality, it has been a major concern of international organizations that educating girls brings higher returns, which makes investment in them more economically efficient.
Internal efficiency is the flow of students from the point of admission to the point of graduation or completion with minimum dropout and repetition (Dufitumukiza, 2020). Efficiency in education, otherwise referred to as internal efficiency explains the technical and functional relationship between the inputs and outputs of an education system (Arogundade & Belo, 2019). The output is the number of successful completion of the course of study or modules or grades while inputs include teachers, textbooks, furniture, and other materials used in the teaching and learning process (Adeyemi, 2012). Therefore, Winkler and Sondergaard (2008) studied the efficiency of public education in Uganda. Their findings were that the internal efficiency of primary education is low. They also reported ghost teachers, absenteeism, and inefficient allocation of resources account for inefficiency in primary education in Uganda. Winkler and Sondergaard (2008) also found there was an existence of inefficiencies in secondary schools education which can be attributed to low workloads, poor teacher deployment, and high teacher salaries. Similarly, Kolawole and Ogbiye (2020) found the majority of the public secondary schools in Ekiti State, Nigeria, have moderate resource utilization while few (11%) were assessed as low. The study also found a significant and positive relationship between resource utilization and internal efficiency.
Rowland (2008) discussed the importance of service quality as a means of achieving a competitive advantage in higher education. The work employed a qualitative approach in Singaporean higher institutions. The findings revealed that the perception of tertiary students as either customers or products will have a direct impact on the dynamics created within and outside the learning space. Similarly, it was found that quality service in higher education should aim at offering experiences that promote dialogue, inquiry, and reflection in the long term. Rowland (2008) came up with two-fold values: (1) the way programs are run and (2) the quality of students who graduated. The study found out that service quality is a complex and volatile issue, largely driven by contextual unpredictability and complexity.
Akinsola (2012) investigated resource utilization and internal efficiency in Nigerian Secondary Schools. The study was conducted in 250 out of 774 local government areas of Nigeria. Akinsola (2012) found a correlation between physical resource utilization and repetition rate, fail-out rate, and graduation rate in Nigerian public secondary schools. The study found that infrastructure is critical to the achievement of efficiency in the educational sector.
Afolabi and Ayeni (2012) investigated the relationship between teachers’ performance of instructional tasks and the academic performance of students. The study found teachers were most involved in the development of learning guides and periodic assessment of students’ learning. However, teachers were less involved in the review and upgrade of learning guides, grading of students’ assignments/exercises. Based on the findings of the study, the learning outcomes of students can be improved through quality assurance, improved curriculum delivery, and the goal-oriented interrelationship between stakeholders.
Deale and Hovda (2006) established the fact that, though service may not be the primary driving factor for a school set up, in the long run considering the increasing competition among schools, excellent service delivery may cause a distinction of a particular school from all others. In their opinion, it is still unclear what constitutes service delivery in the educational sector. The reason is that many educational institutions do not see themselves as offering services to stakeholders and therefore, evaluating service does not yet seem useful.
Bada et al. (2020) examined the effectiveness of teachers in Nigerian Secondary Schools. The study found leadership styles, defining school missions, and managing instructional materials and delivery are key success factors influencing the learning outcomes of students in Nigerian schools. According to Bobe and Cooper (2020), effective teaching is a combination of teacher behavior, teacher knowledge of the subject matter, and students’ and teachers’ beliefs or attitude towards improving the performance of students. Therefore, effective teaching and students’ approaches to learning remain key correlates of the quality of the learning experience.
The previous studies that were reviewed in this section provide a clear understanding of the factors that could potentially determine the efficiency and learning outcomes of students. This was particularly relevant in determining the models and the variables that would be included in the study. We replicated some of the approaches used previously or in countries other than Nigeria in this study. The next section provides information on the methodology including the study area, type and sources of data, and the analytical techniques.
Materials and Methods
Scope of the Study
Nigeria has an estimated population of 174.5 million people with over 250 ethnic groups (Ademola et al., 2014). This study used secondary data collected from four states in Nigeria. The States are Ekiti (South-West), Niger (North- Central), Anambra (South-East), and Bauchi (North-East). The data was sourced from the Service Delivery Indicators (SDI) data on the World Bank website. The data was collected in 2013 from 760 primary schools out of which the information from 744 schools was used for this study. The data contains information on the learning environment including infrastructure, teachers’ and students’ performance, and monitoring systems in both public and private schools in Nigeria.
Sampling Technique
This study utilized the SDI data that was collected by the World Bank. The stratified random sampling technique was used to select eligible respondents for the study. Stratified random sampling is a method of sampling that involves the division of a population into smaller sub-groups known as strata from which samples will be randomly drawn. The sampling strategy was designed aiming to produce state representative estimates and estimate a proportion with an absolute error of three percentage points for a variable proportion of 0.5 with 95 percent of confidence per state (World Bank, 2014). The strata were used according to ownership, location (urban/rural), and socioeconomic poverty status. The allocation was made in proportion to the size of each sub-stratum within public and private schools. The schools were then selected using a simple random sampling technique. In addition, replacement schools were pre-selected based on a predetermined replacement order within the strata.
Analytical Techniques
The first objective was analyzed using descriptive statistics such as graphs, charts, tables, frequencies, averages, and correlation analysis. The second objective was analyzed using the Ordinary least squares (OLS) method. The dependent variable here was the efficiency indices/scores generated and these were regressed against some independent variables selected from the dataset. The third objective was measured using the Stochastic Frontier Model and the fourth objective was measured using descriptive analysis and the identified variables were ranked in order of their importance as revealed by the results of Principal Components Analysis.
Ordinary Least Square
Ordinary least square regression was used to analyze factors influencing efficiency in primary schools. The implicit form of OLS is given as

Explicitly the model can be expressed as Y = Technical Efficiency Indices X1 = Number of Visits from Federal Ministry of Education X2 = Student-teacher Ratio X3 = Record of Pupils’ Continuous Assessments (Dummy, Yes/No) X4 = location (Dummy, Urban, or Rural) X5 = Textbook used by the teacher (Dummy, Yes/No) X6 = Teacher writes on the blackboard (Dummy, Yes/No) X7 = School Owner (Dummy, Public or Private) X8 = Teacher visits individual pupil ((Dummy, Yes/No) X9 = Hygiene/Cleanliness (Dummy, Clean or Not Clean) X10 = Availability of School Management Team (Yes/No) X11 = Number of Visits from State Ministry of Education X12 = Number of Visits from LGEA μi = Error term

Stochastic Frontier Analysis
There are two approaches to efficiency estimation in literature. They are parametric and non-parametric approaches. The non-parametric approach includes Data Envelope Analysis (DEA) and Free Disposable Hull Analysis (FDH) Cazals et al., 2002). The non-parametric approach does not impose functional form specification on the production frontier without any assumption on the error term. The drawback of this approach is the lack of statistical testing procedures to determine the confidence level in the inefficiency score, based on which the production frontier can be evaluated.
The parametric approach which included Stochastic Frontier was proposed by (Aigner et al., 1977), (Meeusen & van den Broeck, 1977) and (Adewuyi et al., 2013). Stochastic Frontier has enjoyed wide application in literature because it allows for random errors (Mohammed et al., 2013). Therefore, lower performances are traced to random noise beyond respondents’ control and inefficiency (Mohammed et al., 2013). For this study, the stochastic frontier was used to estimate technical efficiency. Technical Efficiency is defined as the maximum level of output obtainable from a given basket of inputs given the level of technology (Girei et al., 2013). It is important to measure efficiency for the following reasons: (i) It is a benchmark on which the performance of productive units or responsibility centers can be based. (ii) One could determine the factors that account for the good performance or otherwise of productive units to improve performance. (iii) Policymakers can be guided on the policy varieties/options or monitoring mechanisms that can enhance the performance of productive units (Girei et al., 2013).
The Stochastic Frontier Model assumes an additive dichotomous error term. On one hand, a component that explains the effect of inefficiency relative to the stochastic frontier. Generally, a school is said to be technically efficient if the observed production outlay (Y, X) satisfies the Cobb-Douglas Production Frontier, where Y is the output and X is the vector of input for the firm (Taru et al., 2011). Therefore, a firm is technically inefficient if Y< f(X) simply because the firm operates below the production frontier (Taru et al., 2011)
The production function is given by: Y = f(Xi, β) (3) Where Y = Students’ Test Scores Xi = Vector of Parameters
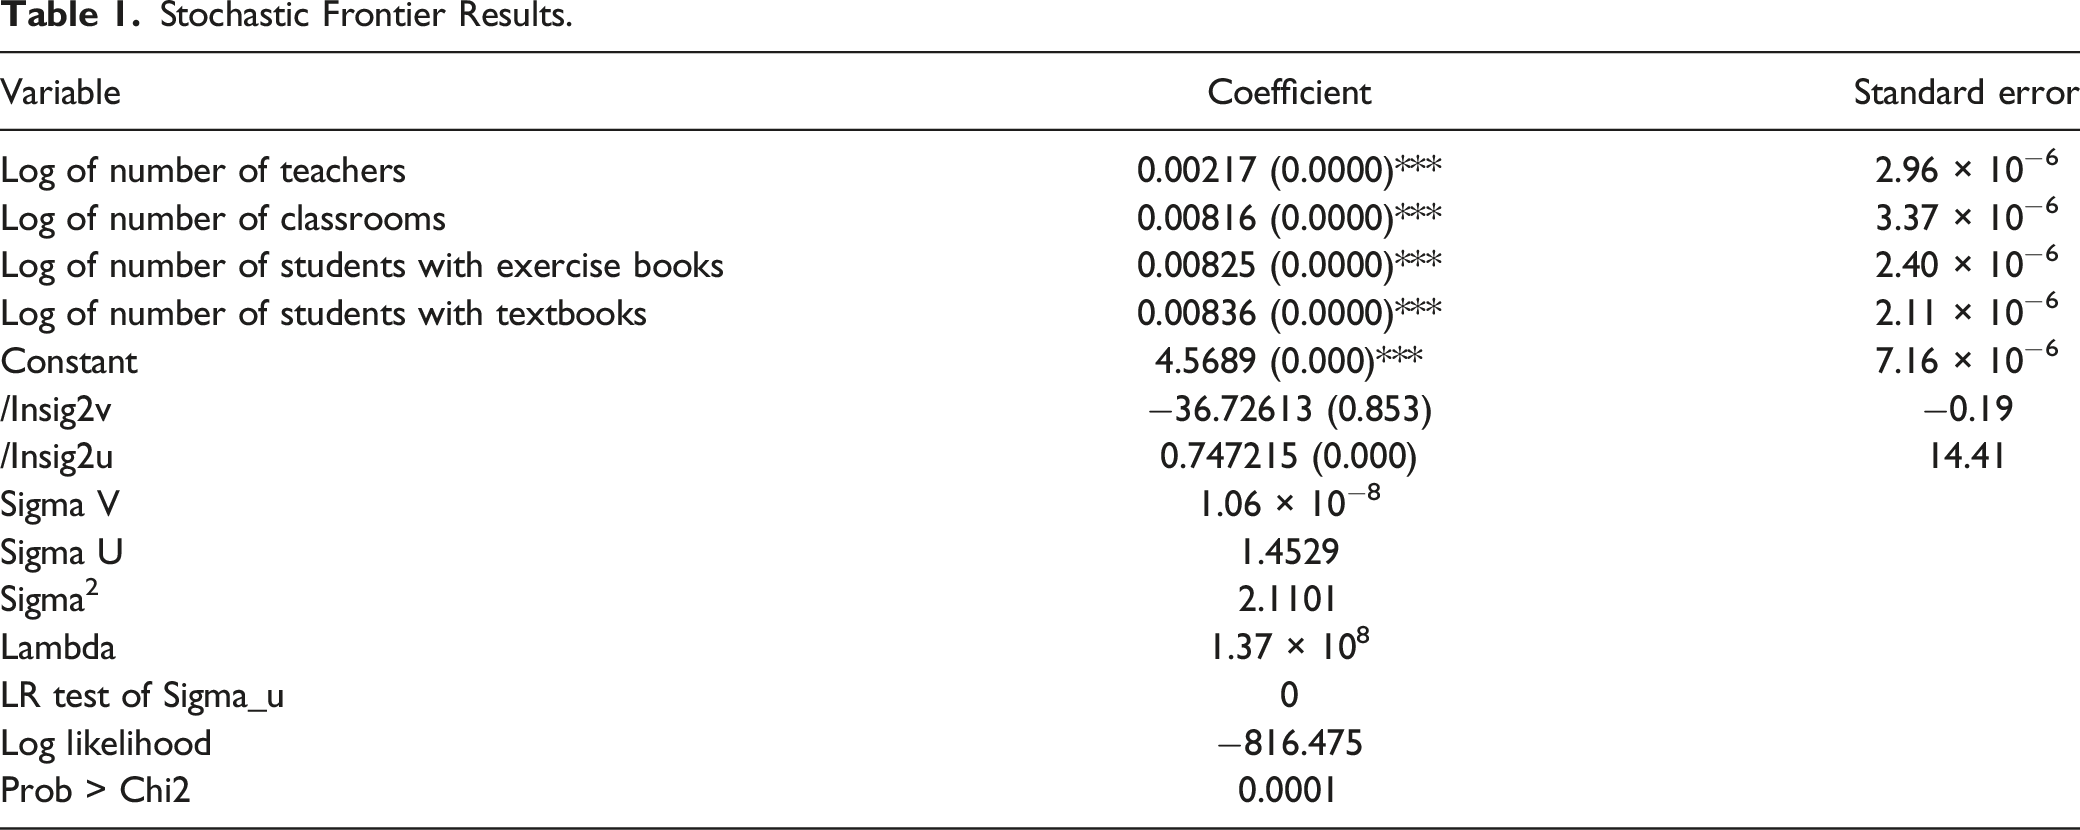
The empirical model of the stochastic production function frontier applied in the analysis of efficiency of the Educational Facilities is given by Where Y = Students‘ scores X1 = Number of Teachers X2 = Number of Classrooms X3 = Number of Students with Textbook X4 = Number of Students with Exercise book and pen
The key findings were discussed in the next section to proffer evidence-based recommendations for the issues raised.
Results and Discussion
State of Service delivery
The state of service delivery was captured with the conduct of teachers within the classroom as observed. The result presented in Figure 1 shows that the majority (60 percent) of the teachers used the local language as the medium of instruction. This indicates most of the classes were taken in the local language. Therefore, there is a need to mix both local language and English in teaching pupils. This will help improve their understanding of English. Teacher assigning homework to pupils.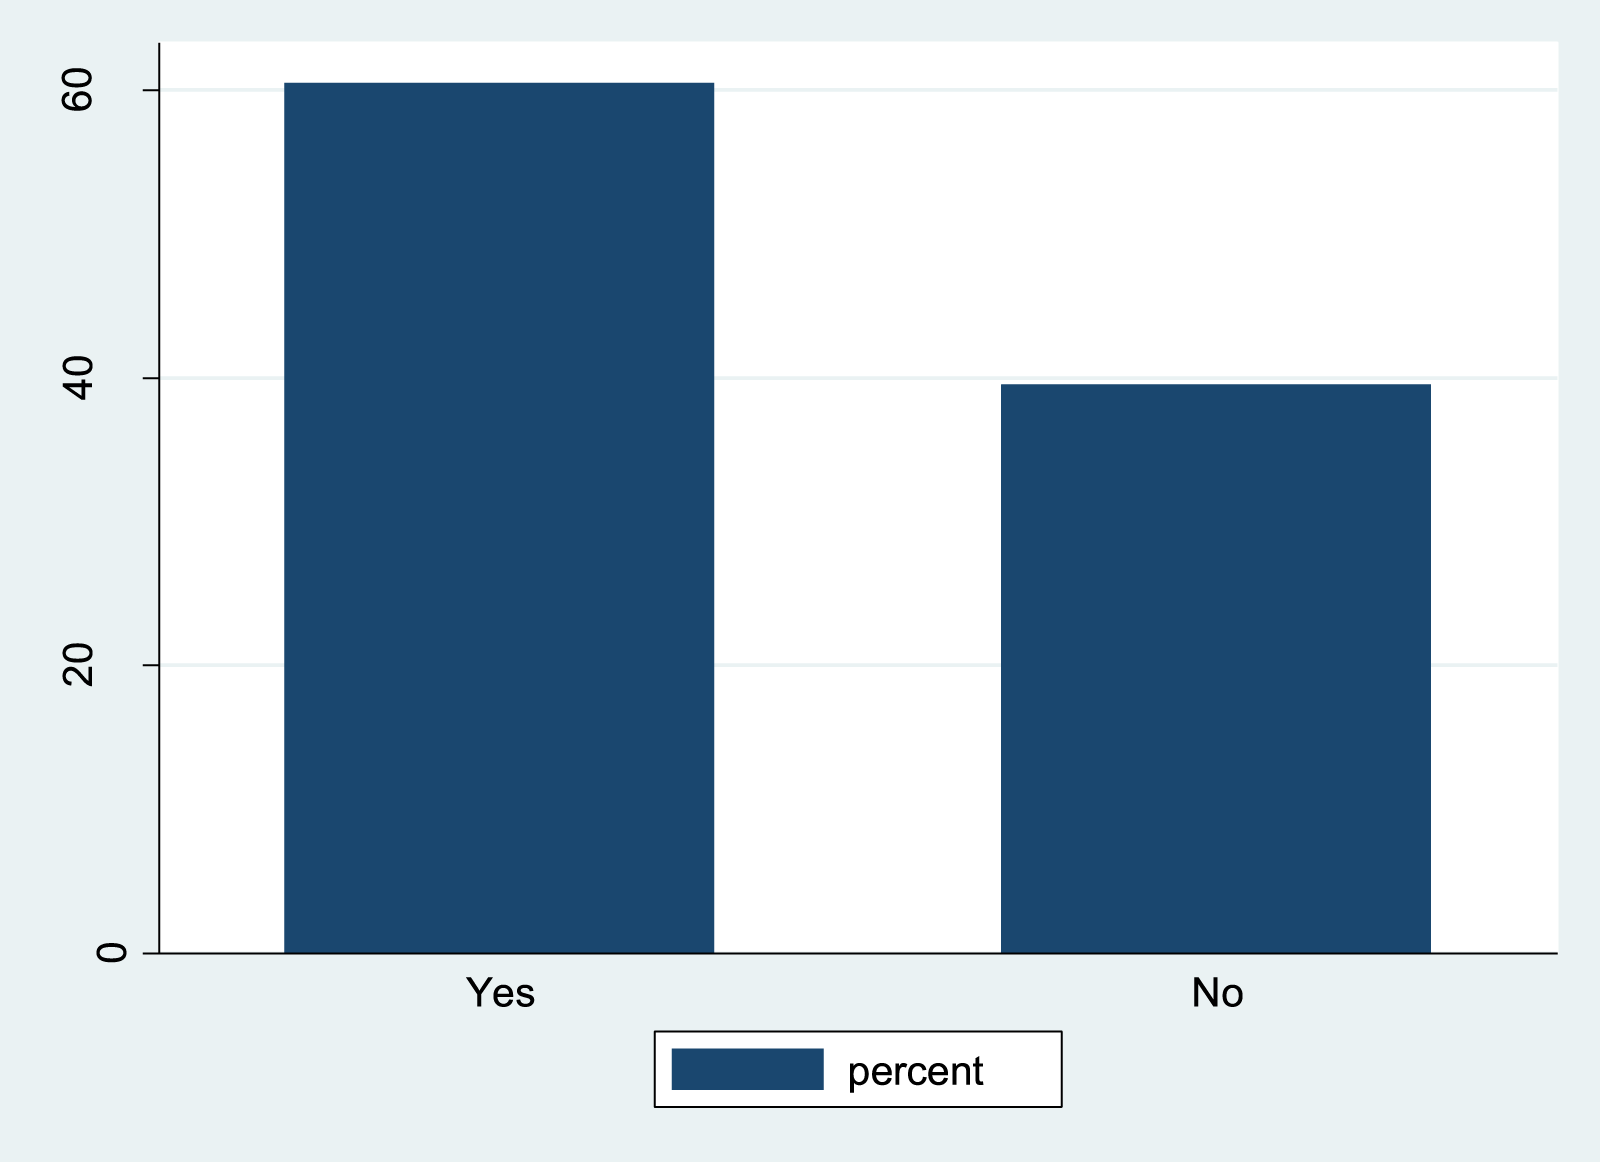
The majority of the teachers (60 percent) did not assign homework to the students (see Figure 2). This indicates the teacher might not get feedback on how well the pupils understood what was taught. This could be as a result of the large population of students and the stress of grading them individually. Teacher summarizing lesson at the end of the class.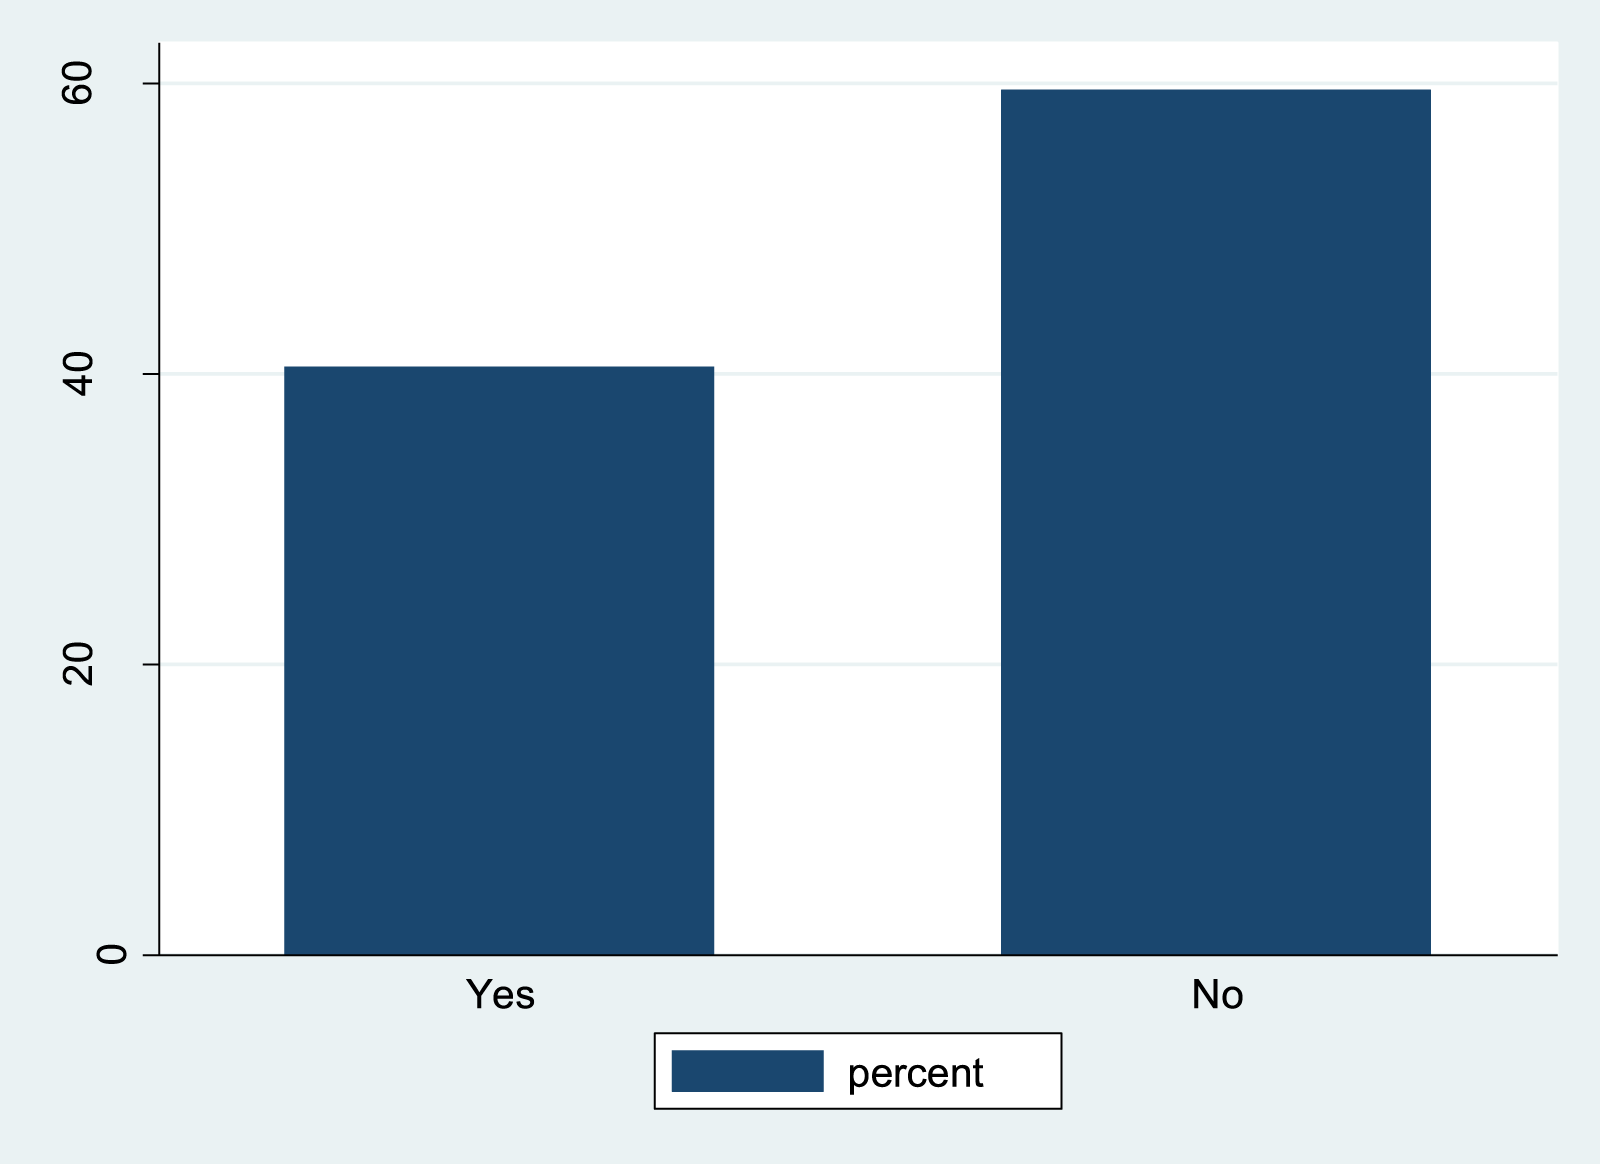
The result presented in Figure 3 shows the percentage of teachers who summarized what they taught students at the end of the class. Above 60 percent of the teachers summarized at the end of the class. There is a need to improve on this because the summary will help the students to recall what they were taught. Specifically, the lessons learned and “take-away points” were emphasized in the summary. Teacher asking follow-up questions.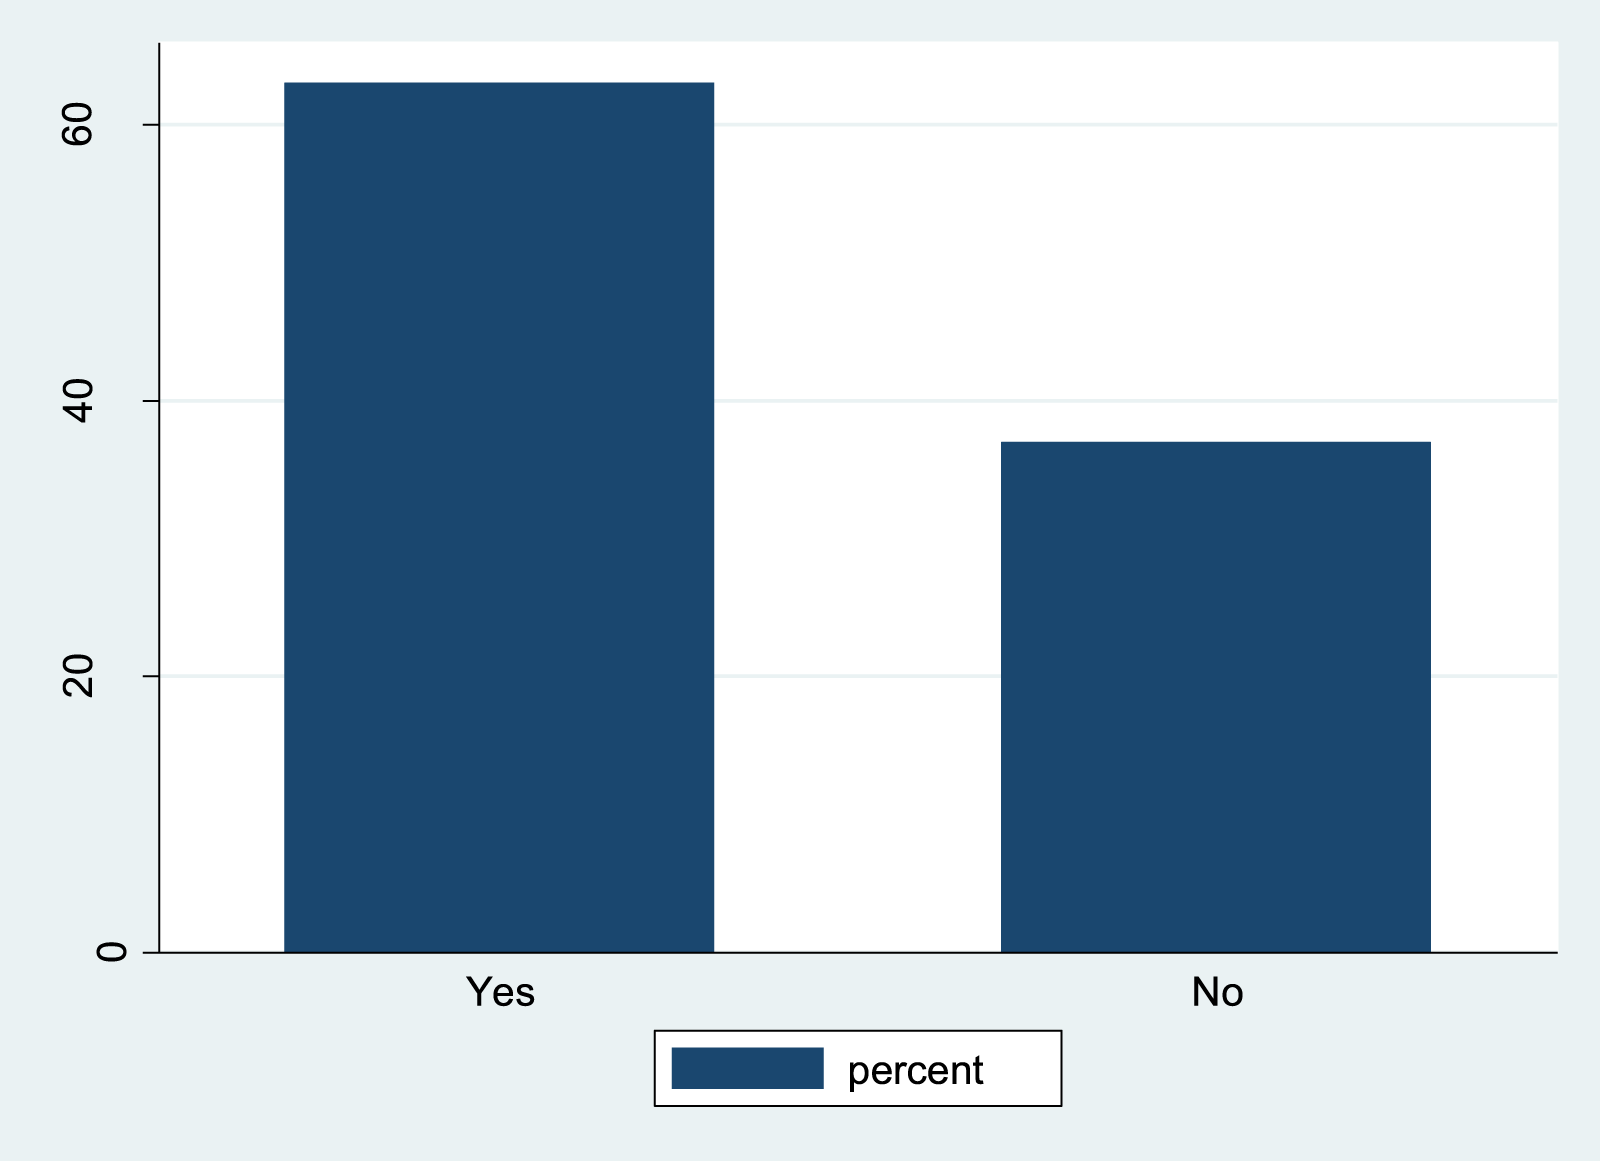
The result presented in Figure 4 reveals that the majority of the teachers asked questions that required pupils to recall information from the lesson. This, if done properly will expose the points pupils did not understand properly and misconceptions. This would result inefficient service delivery as the weaknesses of the pupils would be identified and quickly addressed. Teacher giving feedbacks in the form of encouragement, praises, or moral strengthening.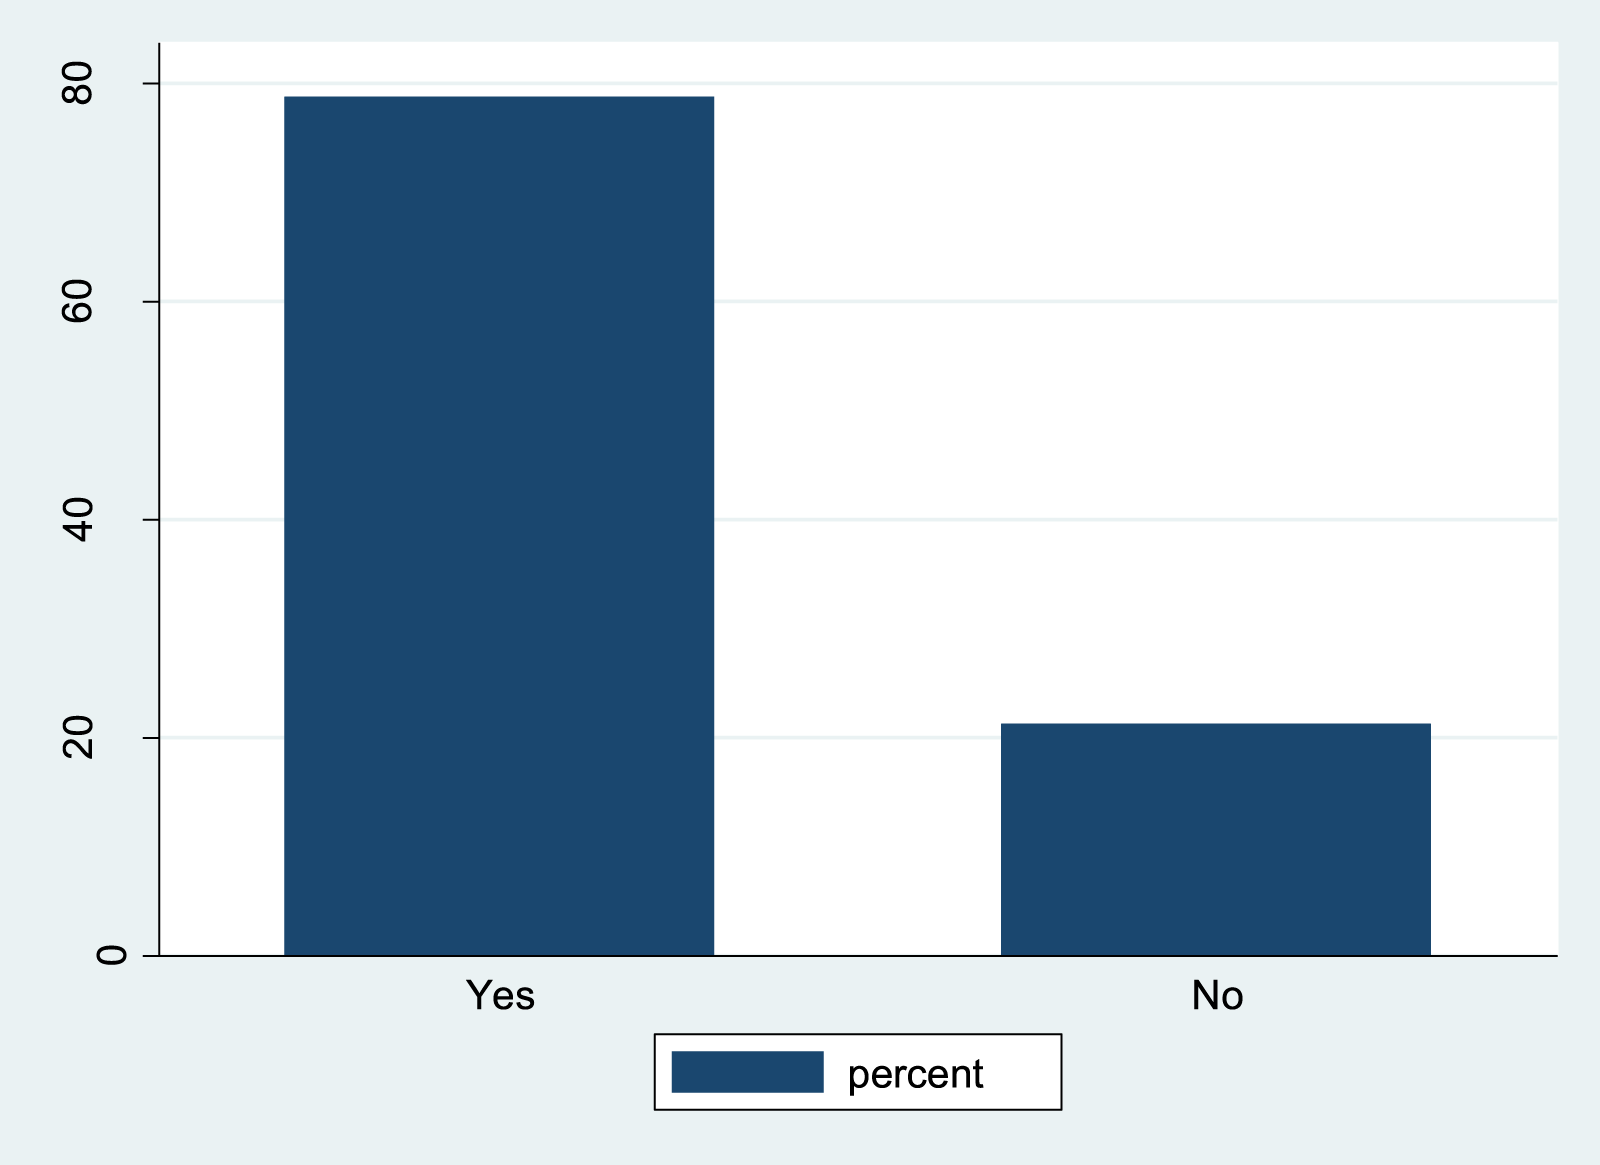
The result as shown in Figure 5 indicated that 33.3 percent of the teachers never gave feedback in the form of encouragement or praise. However, the majority of the teachers encouraged the pupils when they did well. There is a need to encourage the pupils each time they perform well to boost their morale and encourage others. Teacher giving feedback on pupils’ mistake.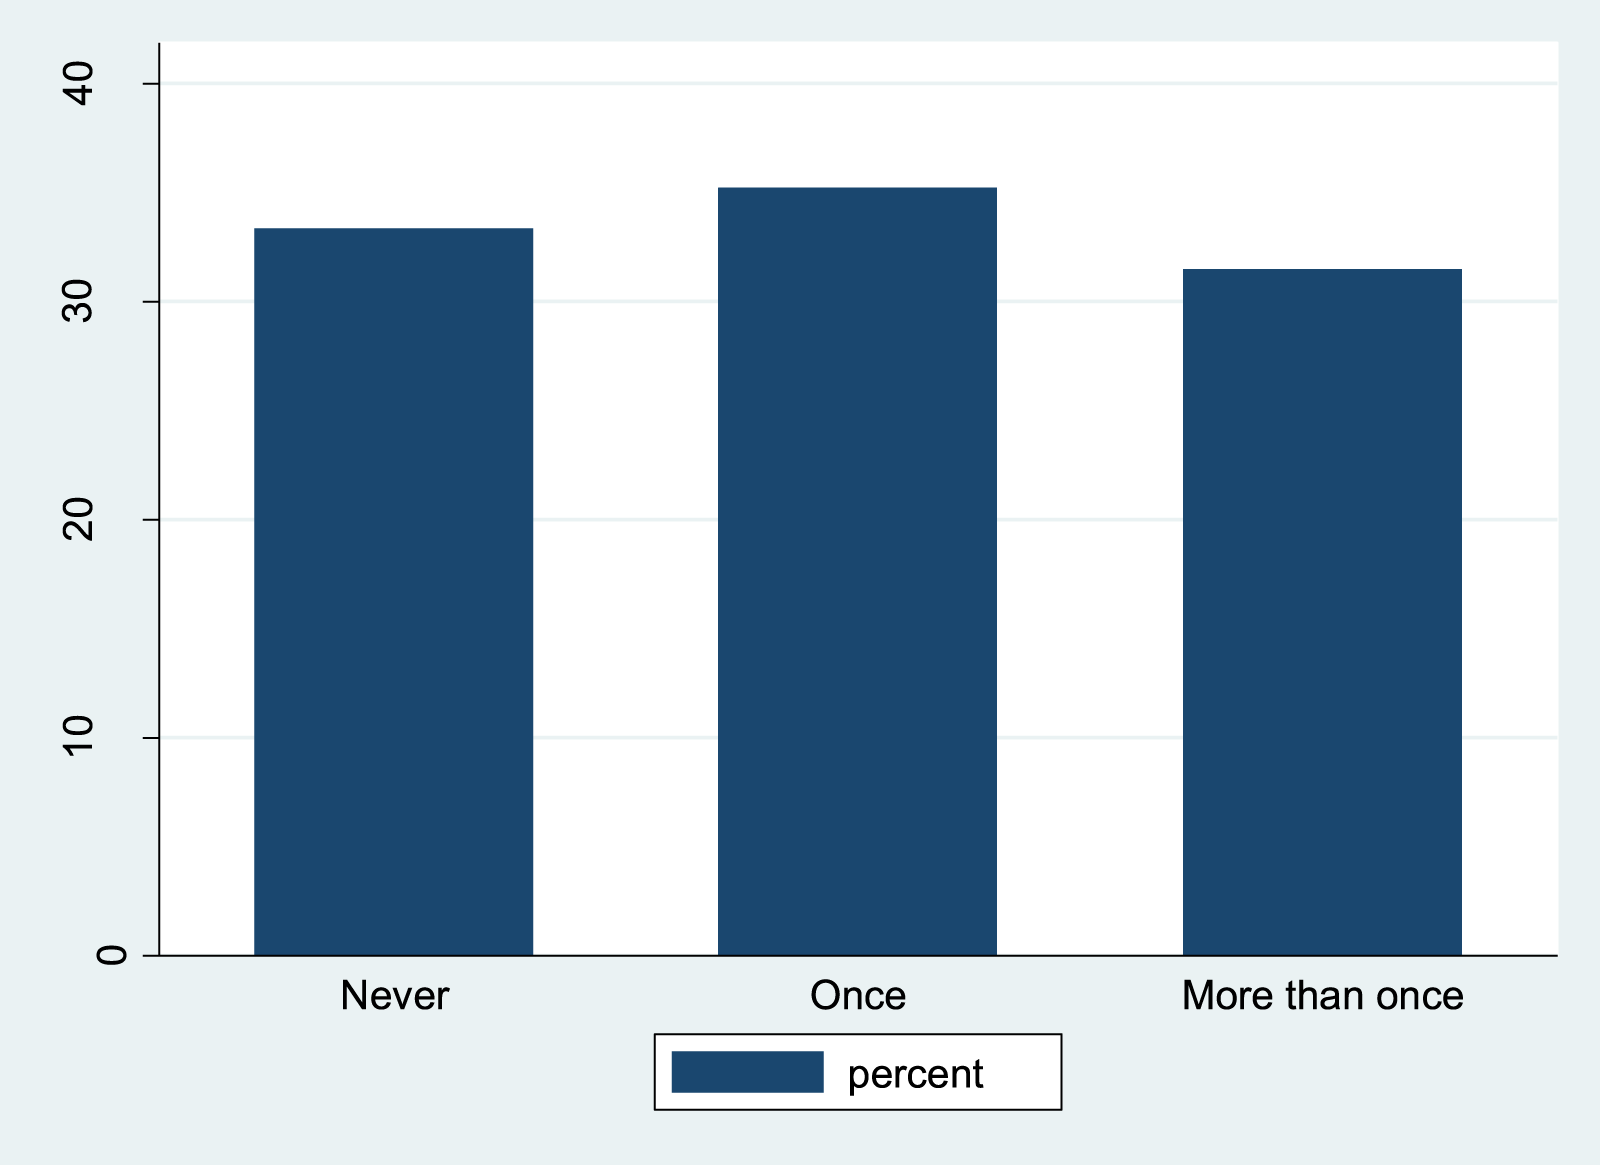
According to the result presented in Figure 6, 27 percent of the teachers never gave feedback to correct the mistakes on the part of the pupils. This shows that mistakes made by the pupils go uncorrected and they never get to know their shortcomings. Therefore, there is the need for all teachers to give pupils feedback to correct mistakes. Teacher asking learners to demonstrate what they have learnt.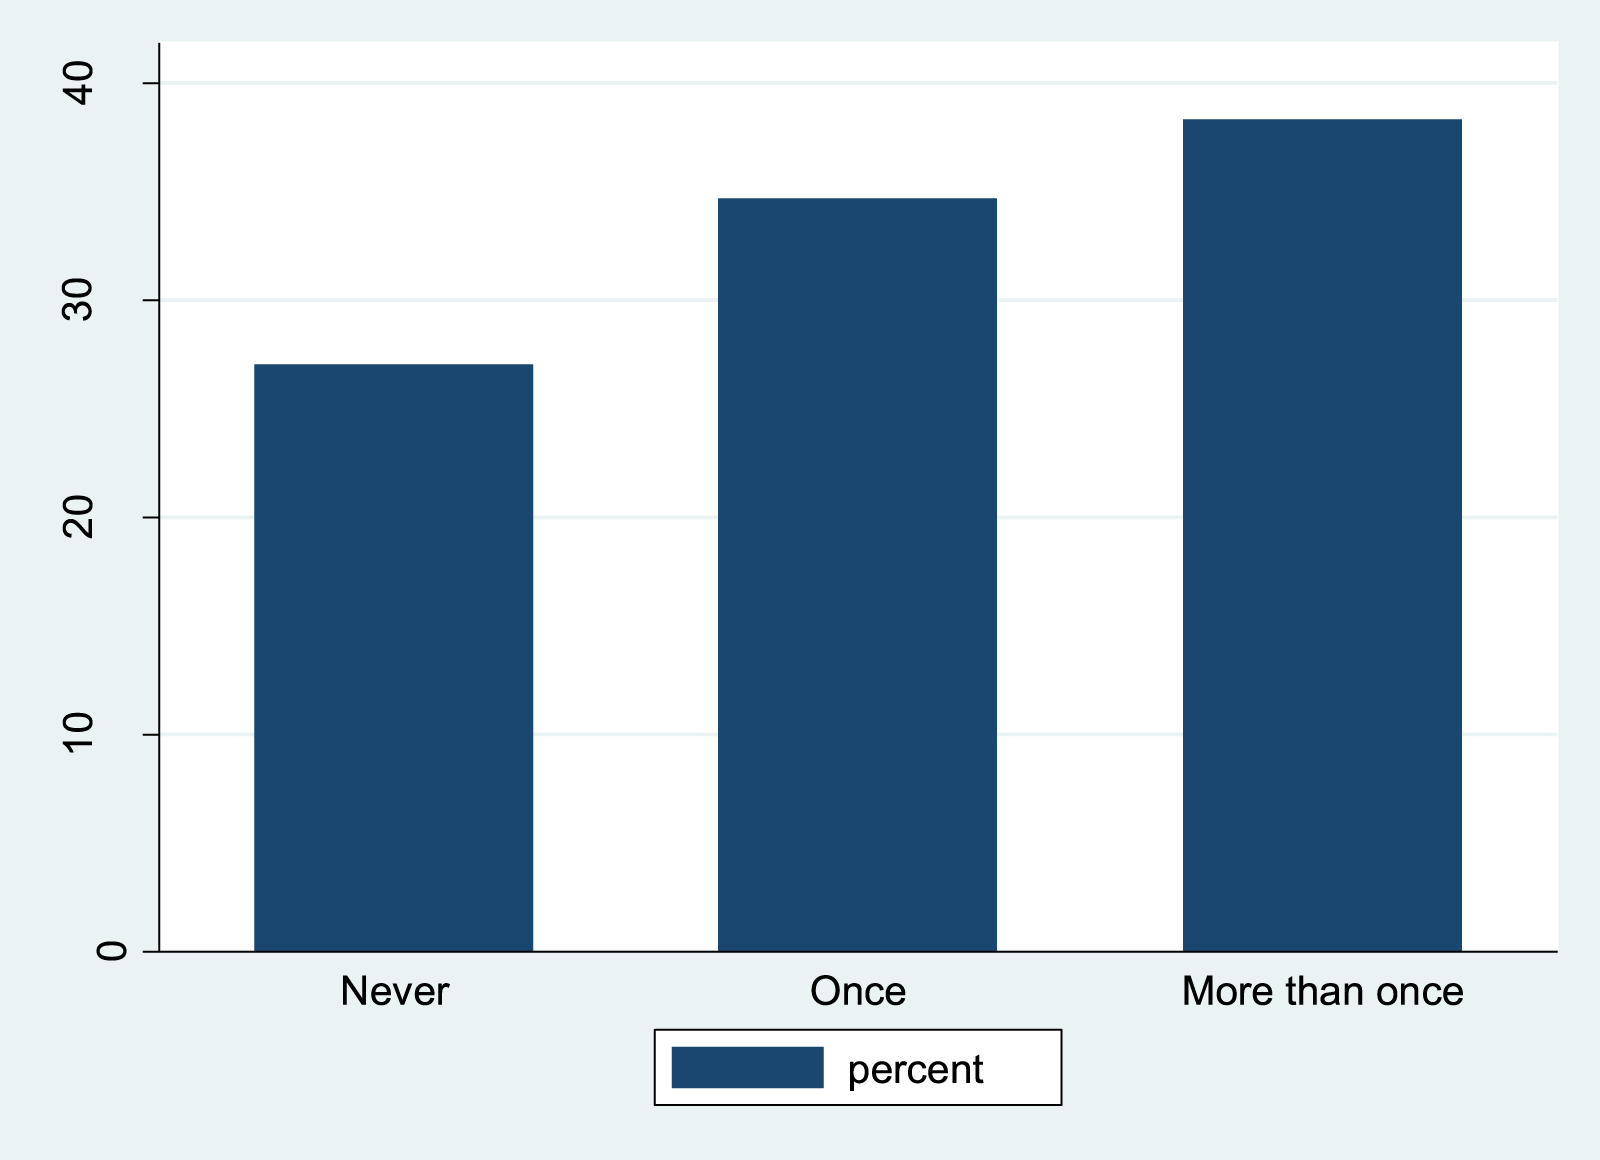
The result presented in Figure 7 shows that the majority of the teachers asked pupils to demonstrate what they learned. However, about one quarter (24 percent) of the teachers did not ask pupils to demonstrate what they had learned. This shows the teacher might not know the inadequacies of his/her pupils and how much they have learned. Teacher asking learners to demonstrate what they have learnt.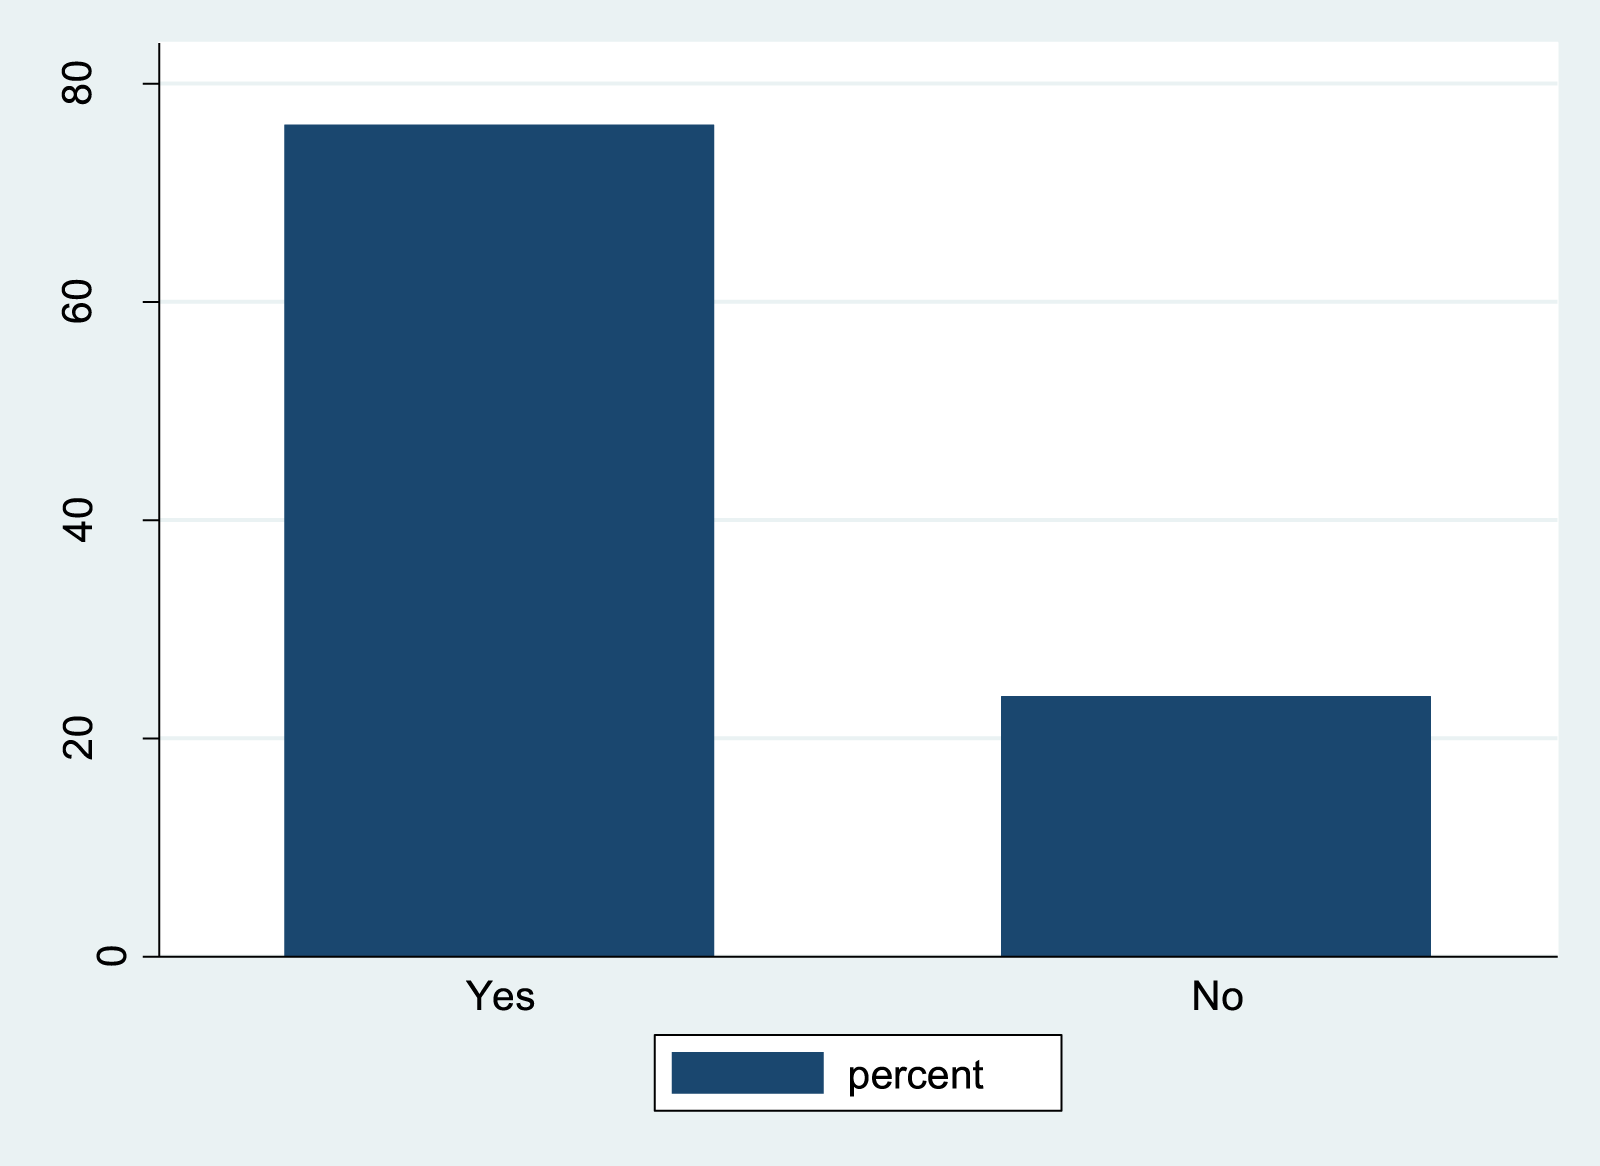
Input Variables in the Nigerian Primary Schools
Stochastic Frontier Results.
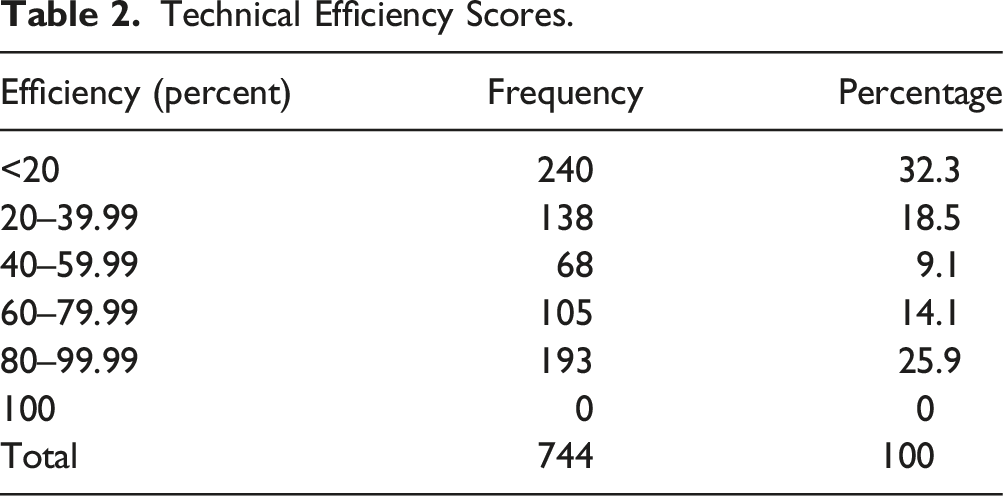
Technical Efficiency Scores.
Cross-Tabulation of Efficiency Based on Ownership Type.
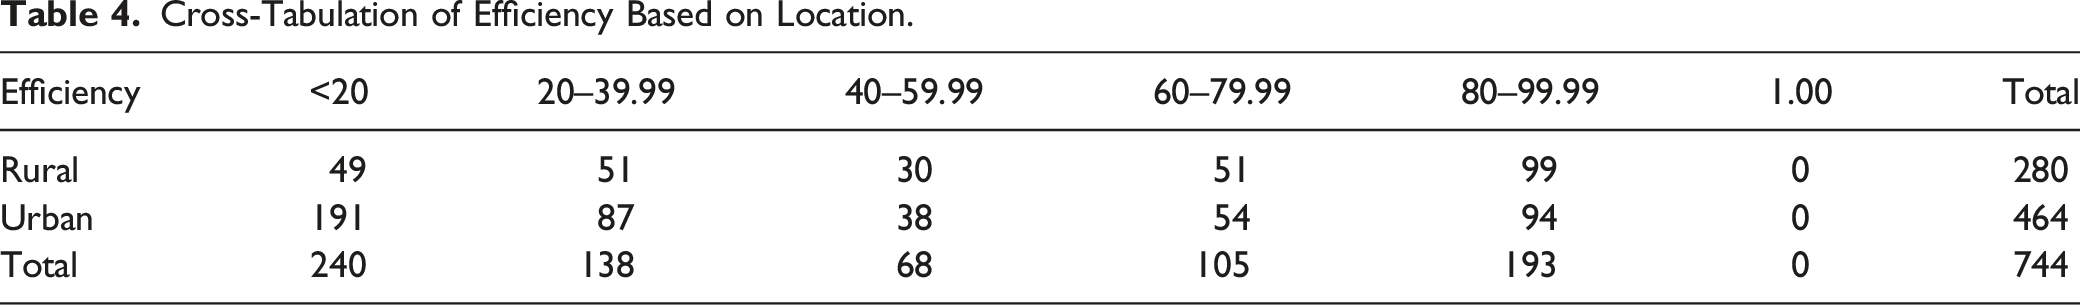
Cross-Tabulation of Efficiency Based on Location.
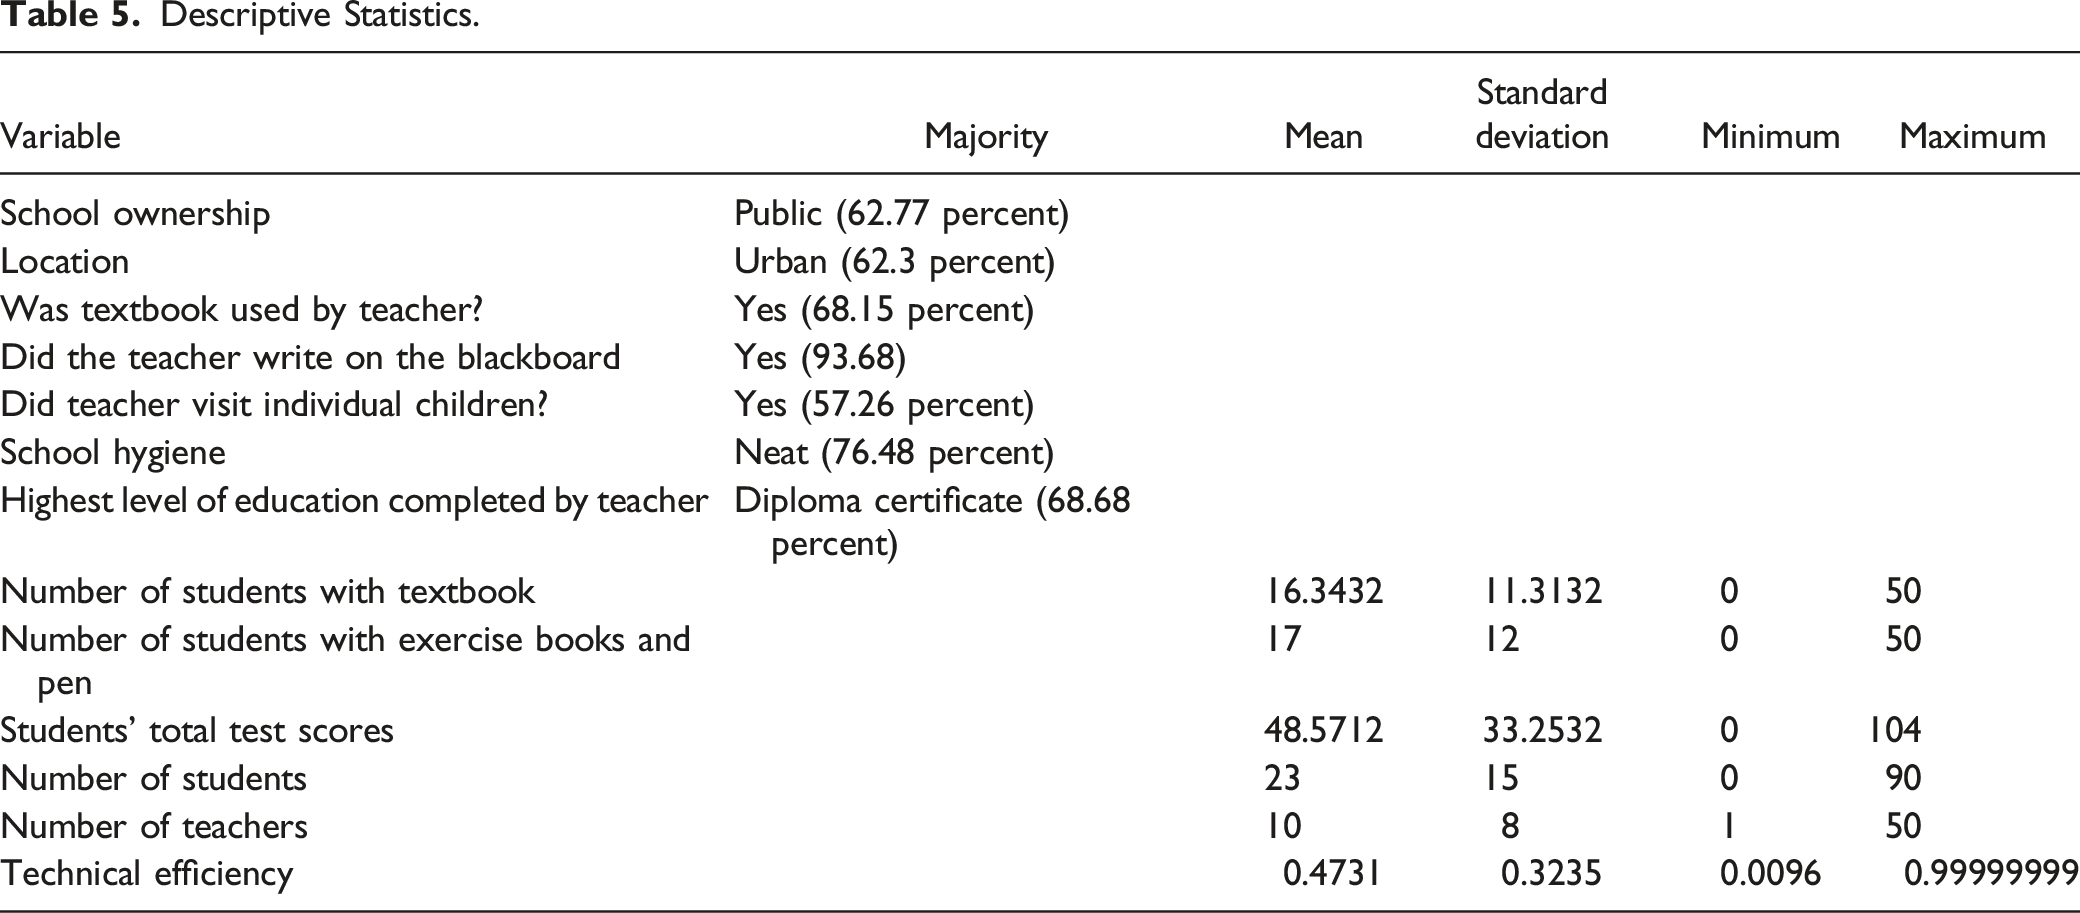
Descriptive Statistics.
Determinants of Technical Inefficiency.
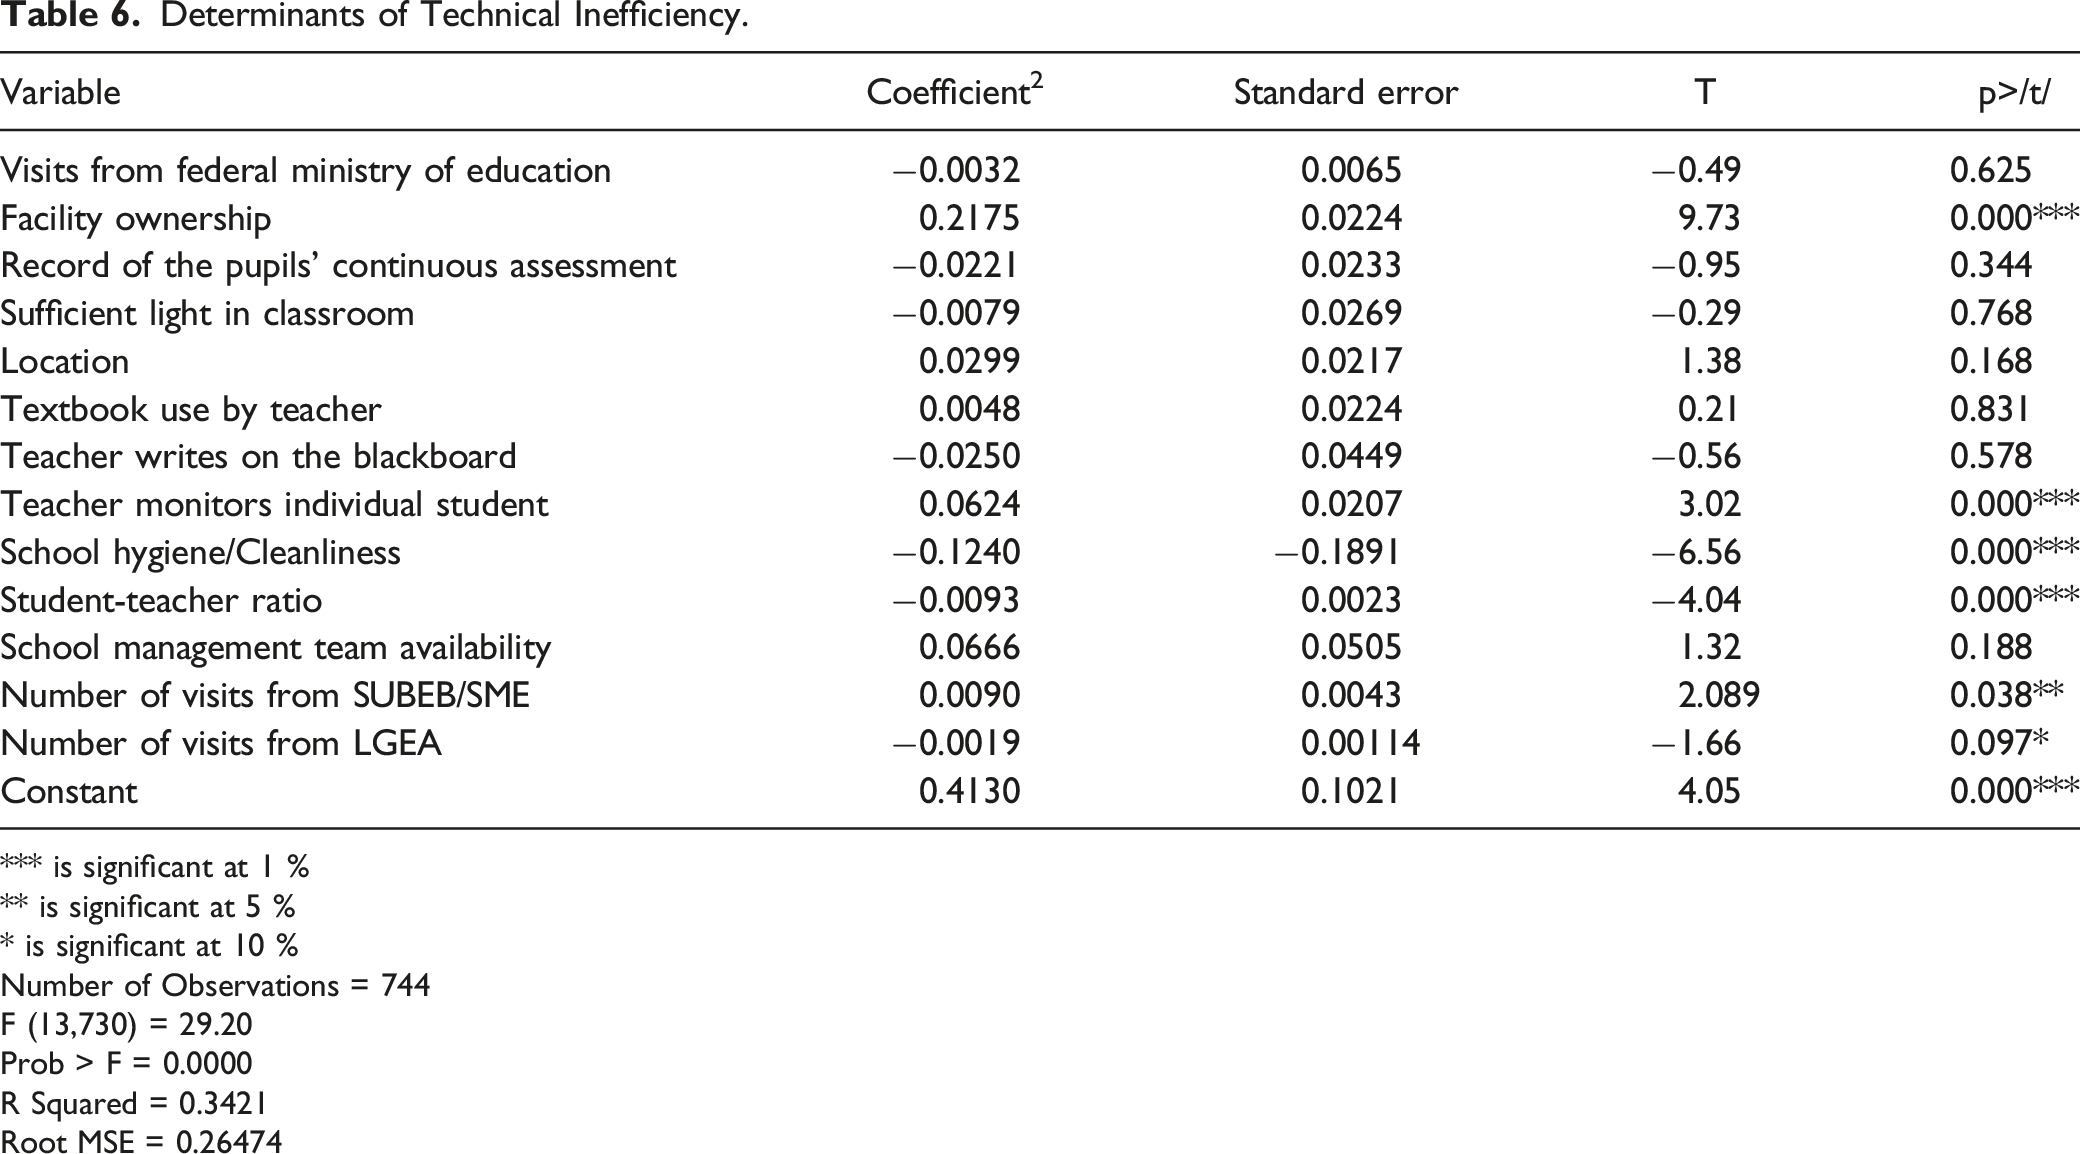
*** is significant at 1 %
** is significant at 5 %
* is significant at 10 %
Number of Observations = 744
F (13,730) = 29.20
Prob > F = 0.0000
R Squared = 0.3421
Root MSE = 0.26474
Facility Ownership
The results presented in Table 6 show a positive and statistically significant relationship (p < 0.000) between school ownership and inefficiency. This implies the majority of the schools owned by the government are inefficient. This is because the bulk of the surveyed facilities is owned by the government. This could be a result of the dominance of public-owned schools in the country. Generally, public-owned schools rely on the already inadequate funding and infrastructure for their operations. This is consistent with the findings of Pereira and Moreira (2007).
Teacher Visiting Individual Student
There exists a positive and statistically significant relationship between monitoring of students by teachers and inefficiency. This could be because most teachers visited the students individually and they still performed woefully in the examinations. This is against the a priori expectation because visiting students individually should help the teacher understand the specific weaknesses of the students. This will result in demand-based teaching given the prevailing conditions. However, Badamas (2021) reported that the teacher’s personality could affect the learning outcomes of primary school pupils.
School Hygiene/Cleanliness
There exists a negative relationship between school hygiene and inefficiency in the surveyed educational facilities. This implies neat schools are more efficient than dirty ones. This could be because conducive and congenial learning conditions can stimulate students’ performance.
Teacher-Student Ratio
There is a negative relationship between the teacher-student ratio and inefficiency in schools. This implies low teacher-student ratio does not necessarily translate to efficiency. This is in line with the findings of Pereira and Moreira (2007), Adeyemi (2012), and Amin and Ntembe (2021).
Number of Visits From State Ministry of Education or State Universal Basic Education Board (SUBEB)
There exists a negative relationship between the number of inspection visits and inefficiency in Nigerian schools. This might be due to the limited number of monitoring visits from the State Ministry of Education or SUBEB.
Number of VISITS from Local Government Education Authority (LGEA)
Visits from Supervisory Agencies.
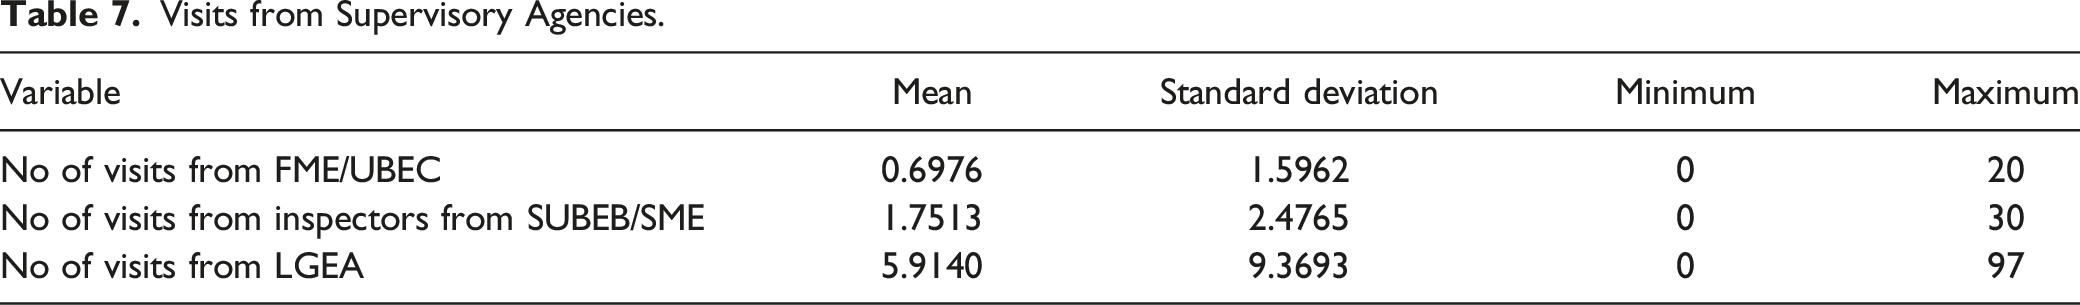
Where FME/UBEC means Federal Ministry of Education/Universal Basic Education Commission.
SUBEB/SME represents State Universal Basic Education Board/State Ministry of Education
LGEA means Local Government Education Authority.
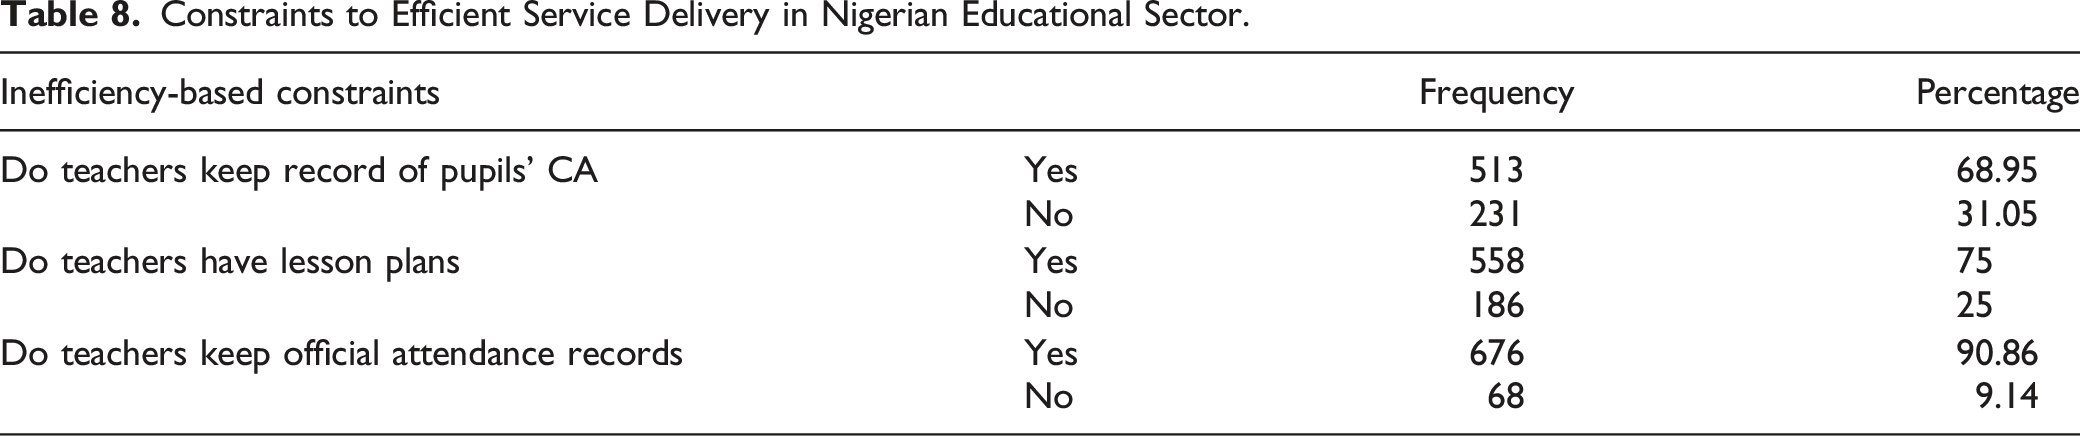
Constraints to Efficient Service Delivery in Nigerian Educational Sector.
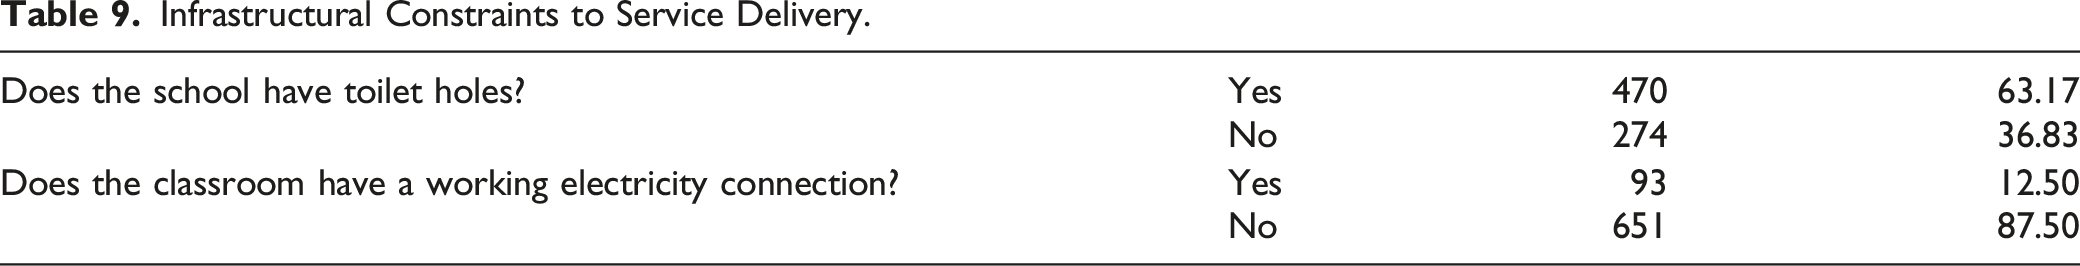
Infrastructural Constraints to Service Delivery.
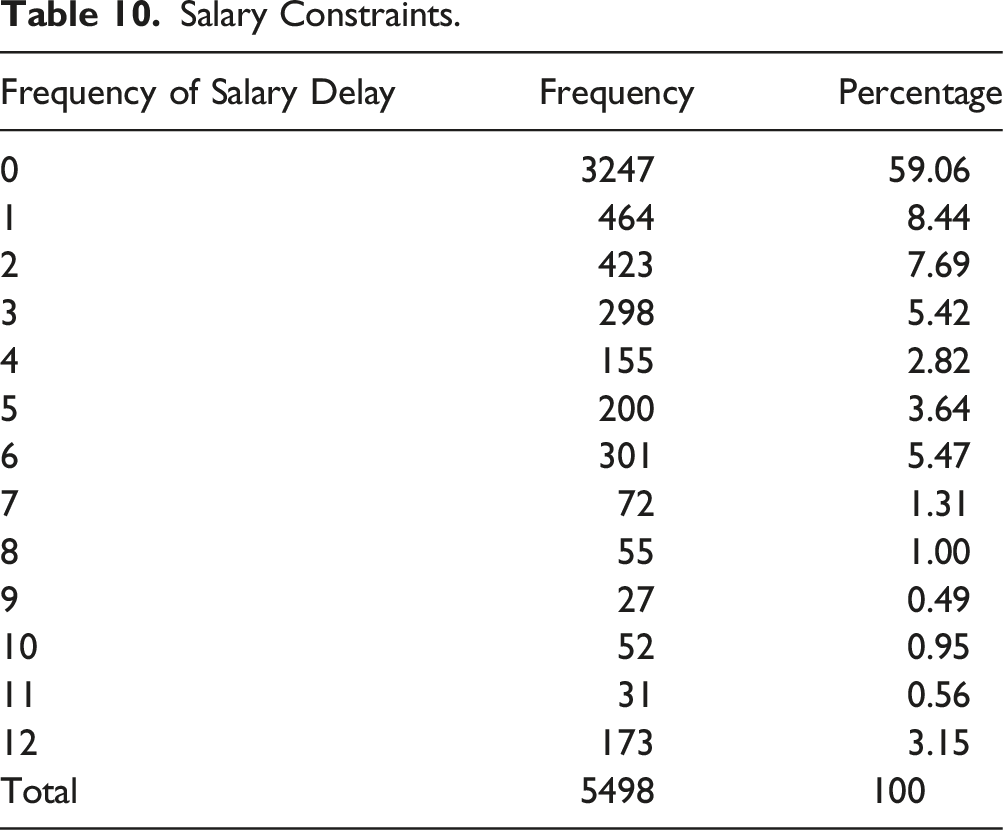
Salary Constraints.
Main Constraints to Efficient Service Delivery in Nigerian Primary Schools
The constraints to efficient service delivery were subjected to Principal Components Analysis to identify the most important constraints. The data were subjected to KMO and Barlett’s test to determine the appropriateness or otherwise of the model. The KMO value was 0.686 and Barlett’s test was significant at 1 percent which shows the model is appropriate. The PCA selected 6 out of 17 identified constraints in the data set. The six components extracted account for 60.33 percent of the total variability of the data (see Table 2 and Figure 8). The results as presented in Tables 1 and 2 show lack of electricity connection, teachers writing on the blackboard, teacher individual monitoring, review of homework, lesson plans, and lighting constraints are the main constraints to performance in the Nigerian primary schools. Did the teacher use local language as a medium of instruction.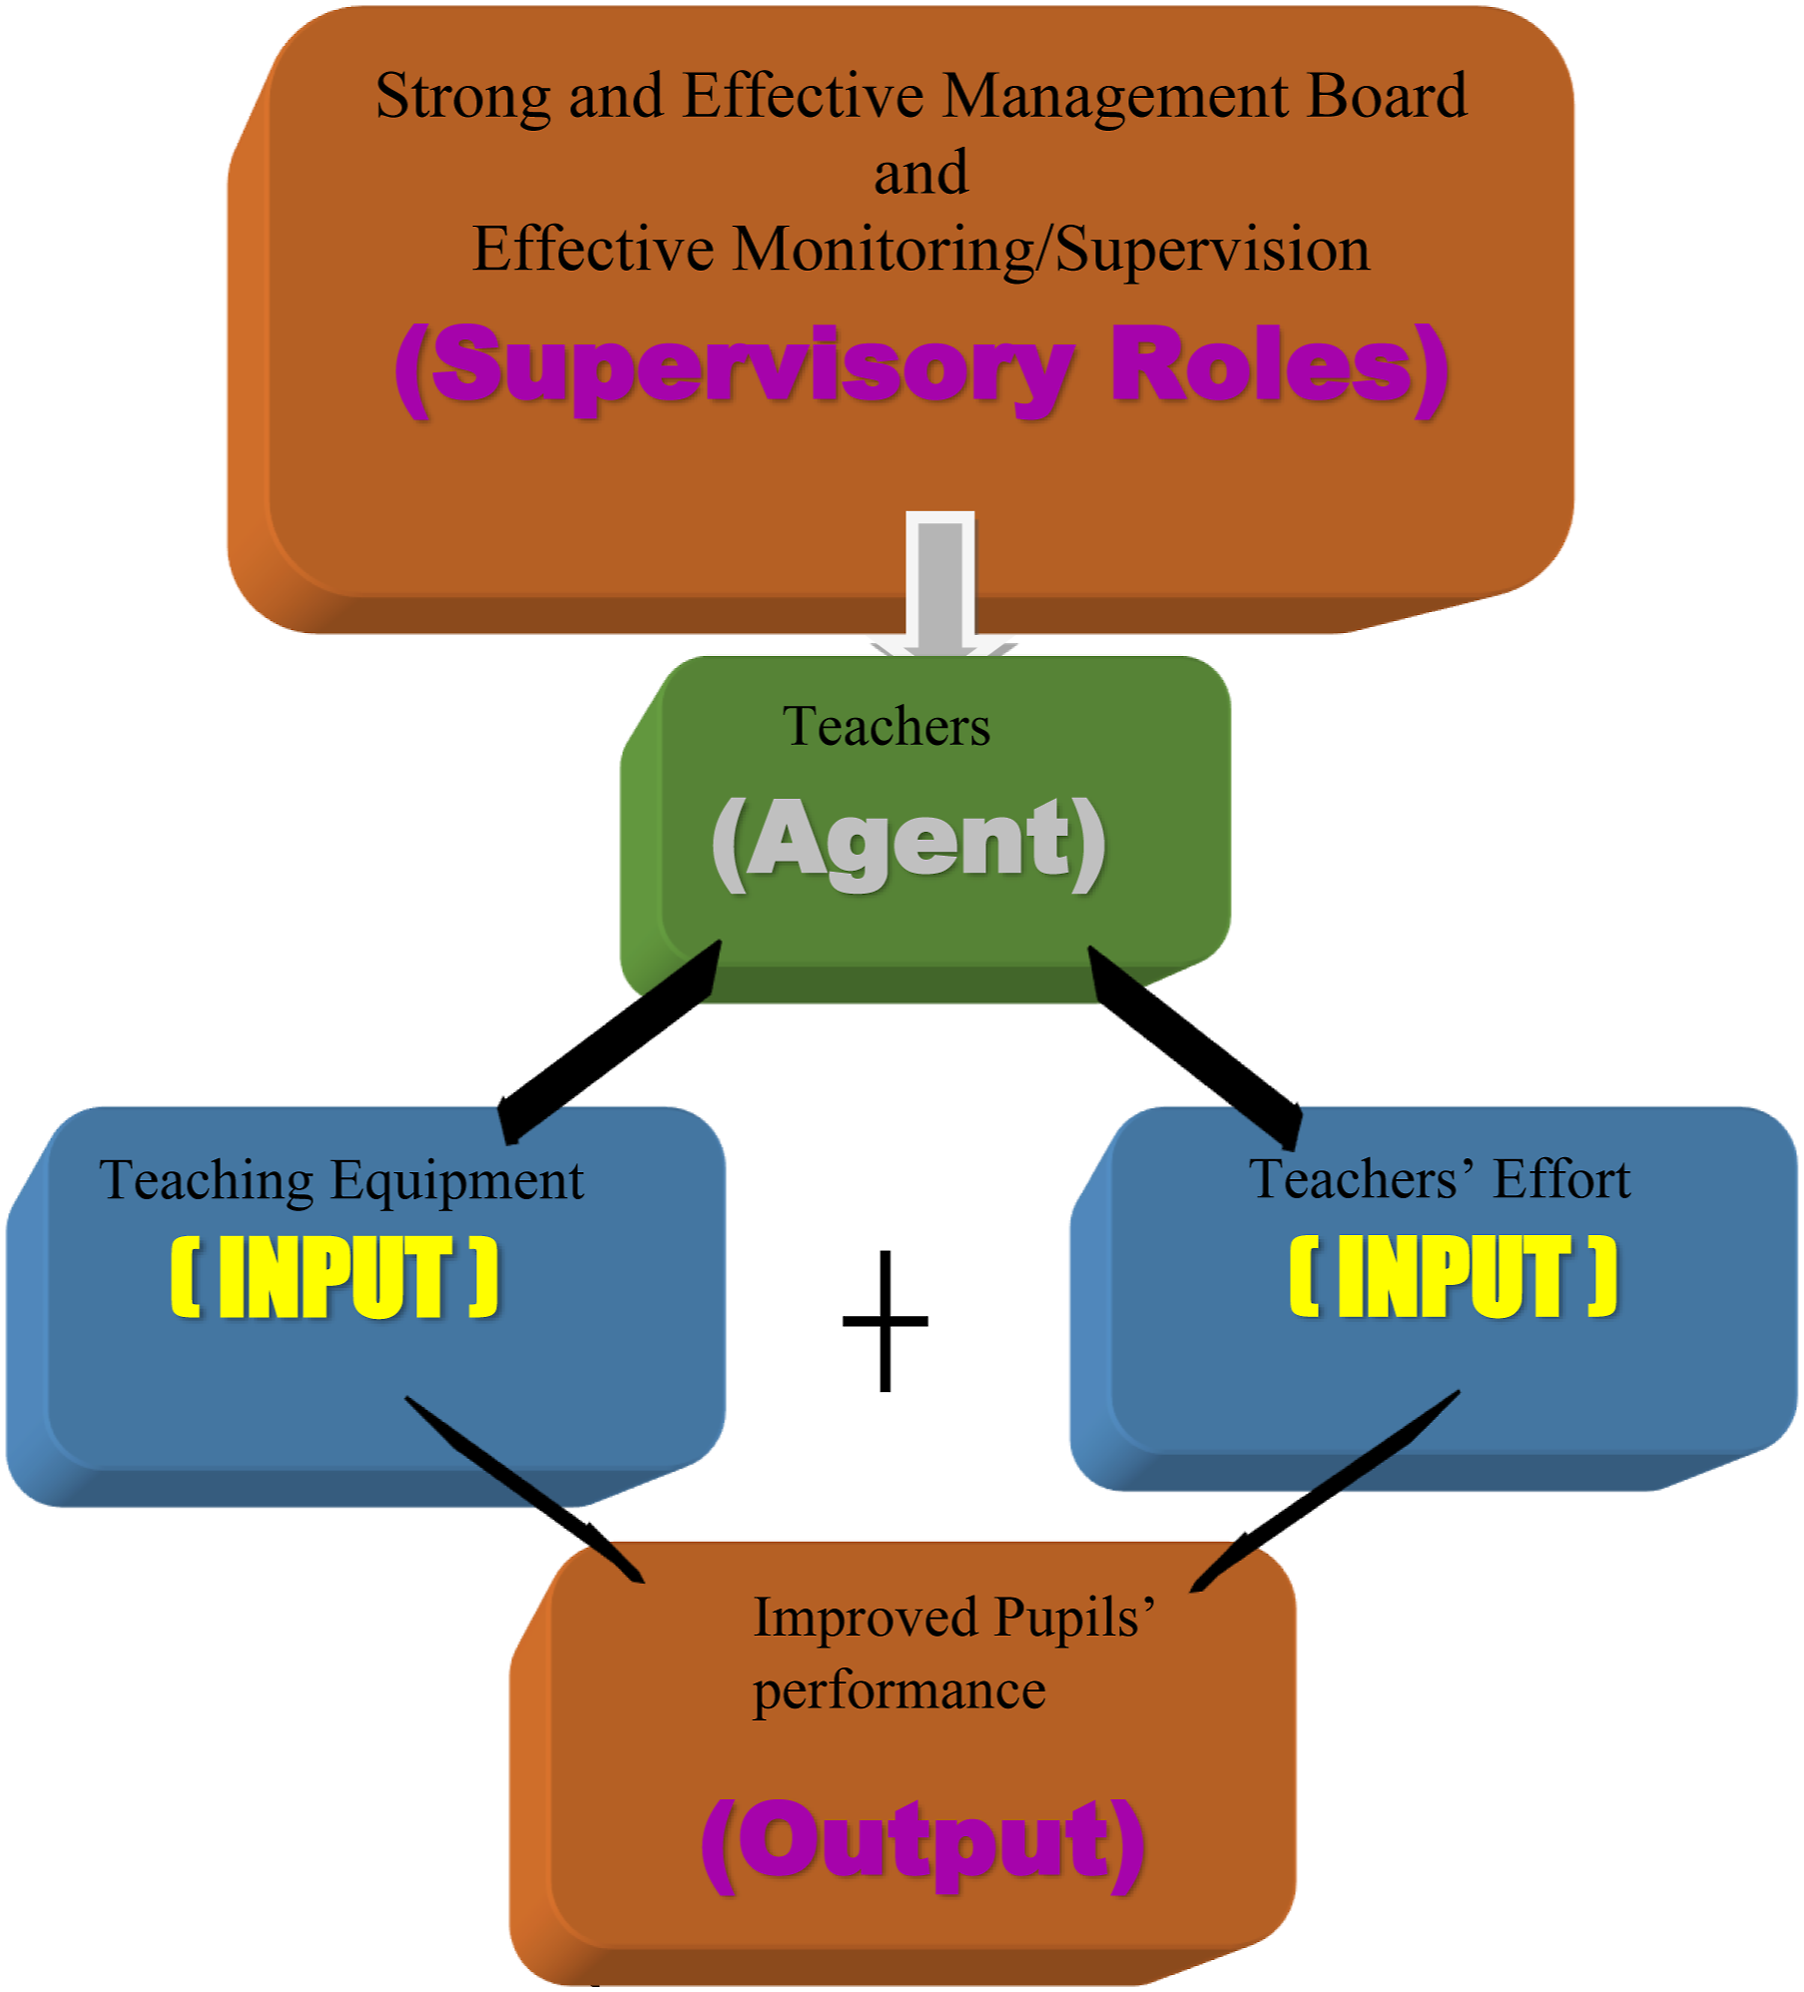
Limitations of the Study
The authors utilized school-level information in providing insights into the correlates of learning outcomes in Nigerian primary schools. However, there are other factors such as nutrition, family structure, security, and socioeconomic status of caregivers that were not captured in this study due to data limitations. In addition, the school was used as the unit of analysis thus providing limited information on the unique characteristics of individual teachers. This implies that critical information including years of experience, education, sex of teacher, satisfaction, and quality of service were not analysed for this study due to data limitations. However, while the study provided rich insights into the improvement opportunities in the Nigerian primary schools using technical efficiency and principal components analysis, further studies should be commissioned to better understand the other factors listed above.
Conclusion
This study estimated the efficiency of schools using Stochastic Frontier Analysis (SFA) while Ordinary Least Square (OLS) regression was employed to investigate possible causes of technical efficiency. The study examined the performance of the Nigerian primary schools and its effect on learning outcomes. A total of 744 educational facilities were surveyed and 62.8 percent of the schools are owned by the government. About 62 percent of the schools are located in urban Nigeria. The current state of service delivery leaves more to be desired. The study found the majority (60 percent) of the teachers in the surveyed primary schools did not assign homework to pupils. Again, about 40 percent of the teachers did not summarize the lesson at the end of the class. Exactly 33 percent of the teachers did not give feedback in terms of encouragement, praises, and moral strengthening. Also, 27.02 percent of the teachers did not give feedback correcting pupils’ mistakes in the surveyed schools. In terms of efficiency, 50.8 percent of the surveyed schools operate at less than 40 percent efficiency level. Again, 31.9 percent of the teachers do not use textbooks and 30.5 percent of the teachers do not keep records of students’ continuous assessments. Also, 42.8 percent of the teachers do not visit students individually to be sure they copied the right notes and understood what was taught.
The study found the determinants of efficiency in Nigerian schools are facility owner, a teacher visiting individual students, school hygiene/cleanliness, teacher-student ratio, and the number of visits from LGEA. The performance of the educational sector in Nigeria is undermined by infrastructure deficits, delays in teachers’ salaries, and teacher-specific inefficiency.
The study recommends increased and monitored investments in the educational sector to address the infrastructure deficits. Government should employ more qualified teachers into the Nigerian primary schools to reduce the teacher-student ratio and improve performance of students. Based on the findings of this study, it is important that teachers are paid on time and well-remunerated to improve motivation and performance. Finally, monitoring or inspection visits by education officers from LGEA to schools should be intensified to ensure compliance with the job schedule.
Footnotes
Acknowledgments
The authors are grateful to the Africa Economic Research Consortium and World Bank for the SDI data and reviews of this paper.
Declaration of Conflicting Interests
The author(s) declared no potential conflicts of interest with respect to the research, authorship, and/or publication of this article.
Funding
The author(s) received no financial support for the research, authorship, and/or publication of this article.
Ethics Approval and Consent to Participate
The manuscript has not been submitted or published anywhere either in part or in full. The manuscript is submitted solely to this Journal because the focus falls within the scope of this Journal. All necessary protocols were observed in the use of data.