
Abstract
We used the generalized propensity score method to estimate the differential effects of five Early Child Care and Education (ECCE) experiences (Prekindergarten, Head Start, Center-based Child Care, Home-based Child Care, and Parental Care) in reducing math and reading achievement gaps between boys versus girls, Latinx versus Whites, and Blacks versus Whites. Findings revealed differential effects of ECCE in reducing gender and racial achievement gaps. However, results indicated that significant gender and racial gaps still exist despite ECCE experiences and that these gaps widen throughout the elementary and middle school years.
Keywords
Introduction
Academic achievement gaps are described as the differences in education outcomes between groups of children and are based on the average performance level for the two groups (e.g., the difference in achievement scores between Blacks vs. Whites or boys vs. girls). Academic achievement gaps are a pernicious problem, and this problem is influenced by societal structures like socioeconomic disparities and segregation. Reardon and colleagues (2014) demonstrate that there are gaps in achievement when comparing White children to Black and Latinx children, but these gaps have been narrowing over time. Yet, Condron and colleagues (2013) have found achievement gaps to be driven by racial segregation. In fact, it is precisely because of societal structures and policies that we recognize, and agree with, those colleagues who explain that the paradigm around the achievement gap is problematic, especially for Black children (Gardner-Neblett et al., 2021).
From a research and policy perspective, we still believe it is important to examine achievement gaps because they provide evidence of educational disparities, especially since we know that socioeconomic differences and social policies like school segregation drive such gaps. As such, it is also important to examine achievement gaps because it provides information about which groups to target for educational interventions and resources that may help to level the playing field of unfair societal structures. Much research has focused on gender and racial gaps during elementary, but a growing body of literature demonstrates that these gaps also exist before formal school, and these early gaps have similar long-term effects on later academic achievement, persistence in schooling, health outcomes, wage earnings, and incarceration rates (Aratani et al., 2011; Brandlistuen et al., 2021; Heckman & Karapakula, 2019). As such, the ability to understand whether early child care and education (ECCE) experiences can reduce or mitigate these gaps and allow children to enter formal schooling on par with their peers is an important investigation. The purpose of this paper is to examine the educational intervention of enrollment in early childhood education programs and whether such programs can narrow achievement gaps across kindergarten (K) through eighth grade.
Racial and Gender Gap Differences
For the past several decades, K-12 education policy has been focusing on such gaps to understand how children’s demographic characteristics are related to their performance on achievement tests. Sizeable math and reading achievement gaps exist among gender and racial-ethnic subgroups and vary depending on the sample that is analyzed, the educational outcome measure that is used, and the school grade levels in the United States (e.g., Bloom et al., 2008; Joo, 2010; Ladd, 2012; McGraw et al., 2006; Reardon, 2011; Robinson & Lubienski, 2011; Tate, 1997).
Regarding race and ethnicity, Reardon and colleagues (2014) demonstrate there are gaps in achievement when comparing White children to Black and Latinx children, but these gaps have been narrowing over time, and studies have found such gaps to be driven by racial segregation (Condron et al., 2013). More specifically, the Latinx-White math and reading achievement gaps narrow during kindergarten and Grade 1, then they remain stable throughout the later elementary grades, whereas the Black-White math and reading gaps are exacerbated from K to Grade 5 (Reardon & Galindo, 2009). Rock and Stenner (2005) summarize the size of such gaps at kindergarten by reporting the effect sizes across several students; they report that Black-White achievement gaps across a variety of school readiness skills (e.g., math, language, and social-emotional) range from .01 to .95 (adjusted) and .40 to 1.71 (raw). In this same paper, they also report the Latinx-White achievement gap ranges: .06 to .21 (adjusted) and .01 to .72 (raw). Thus, in their synthesis, Rock and Stenner (2005) demonstrated that these gaps range from small to large, and that they are present even when children first begin formal school at kindergarten. that
In terms of gender, scholars have found that boys have a math advantage throughout elementary school that narrows during middle school; on the contrary, girls have a reading advantage that begins in kindergarten (Curran & Kellogg, 2016) and tends to persist throughout schooling, except for in a group of very high achieving students where boys and girls perform similarly (Robinson & Lubienski, 2011). Recent research from Reardon and colleagues (2019) shows, on average across thousands of school districts within the United States, that there are achievement gaps between boys and girls in terms of reading (i.e., girls having higher scores) but not math; however, these gaps change based upon the socioeconomic status of the district such that in school districts with higher socioeconomic status boys tend to outperform girls in math but not in reading.
Policy makers have looked toward how to ameliorate these gaps by providing educational opportunities that can transcend district-level socioeconomic status and segregation. Early childhood care and education (ECCE) programs is one such policy tool; however, the question remains as to how much ECCE might narrow the achievement gap over the course of several education years (from K to grade 8). The literature is conflicting about the effects of early education experiences on children’s achievement throughout elementary school. In fact, several studies show that by first grade the positive benefit of ECCE dissipates over time (Jenkins et al., 2018), and some scholars believe that this is due to those children not having ECCE experiences “catching up” with their peers, especially when those children are in classrooms with rich instruction (Magnuson et al., 2007b). Research on the Tulsa prekindergarten program demonstrates positive effects of the program well into middle school (Gormley et al., 2018). Thus, there is more to be understood about the effects of ECCE throughout the elementary and middle school years, and our study contributes to the literature by not only exploring these questions over time but also exploring them across a variety of ECCE experiences.
ECCE and Achievement Gaps
In efforts to narrow achievement gaps, researchers have noted several policy interventions, including access to quality early childhood care and education (ECCE) experiences such as Prekindergarten (Pre-K; early education for children 3–4 years of age), Head Start/Early Head Start (HS; a comprehensive early childhood education program for low-income children birth to age 5), Center-based Child Care (Child Care; early education for children 0–5 of age), Home-based Child Care (Home-based; early education for children 0–5 years of age provided in a home), and Parental Care (Parental; children age 0–5 who are not enrolled in Pre-K, HS, Child Care, or Home-based and who are cared for by a parent) as one viable solution. The reason ECCE programs are lauded as a method for reducing achievement gaps is because the effectiveness of these programs is widely demonstrated. For instance, enrollment in quality ECCE prior to the start of Kindergarten (K) has been associated with higher cognitive, literacy, mathematics, and social-emotional outcomes, especially among children facing greater socioeconomic adversity (Burchinal et al., 2002; Elango et al., 2015; Hamre & Pianta, 2005; Yoshiwaka et al., 2013). For example, Magnuson et al. (2007a) reported that the effect sizes for reading and math at kindergarten for prekindergarten compared to parental care are 0.18 and 0.17, respectively.
Further, ECCE programs have the potential to reduce achievement gaps because they may provide children whose families are experiencing socioeconomic hardships, and those who are affected by residential segregation, with an opportunity to receive a higher quality learning environment than they would have received had they simply stayed at home with a parent (i.e., what is categorized as Parental Care in our present study) (Tucker-Drob, 2012). For instance, being enrolled in ECCE exposes children to professional literacy and math instruction delivered by educators, and it also gives them access to a wide range of educational materials, resources, and supplies that they would not have at home. In fact, Tucker-Drob (2012) explains that attending preschool exerts a strong and significant influence on children’s cognitive abilities, even more of an influence than children’s genetic potential, and he found that this environmental influence of attending preschool was even stronger for identical twins who were from low-income or racial-ethnic backgrounds. Unfortunately, Tucker-Drob (2012) also found in their sample that higher income twins were more likely to attend preschool, which means that the very young children who would benefit the most from preschool—those who are socioeconomically disadvantaged—are the least likely to be enrolled.
In the long run, persisting or widening academic achievement gaps may have socioeconomic ramifications for disadvantaged groups, such as a lack of better employment opportunities (Kutner et al., 2007; Ritchie & Bates, 2013), poor household financial decision-making (Agarwal & Mazumder, 2013), lower socioeconomic status (Ritchie & Bates, 2013) and lower health literacy (Zarcadoolas et al., 2005). Therefore, it behooves educators and policy makers to understand how policy interventions like ECCE can successfully narrow such gaps. However, most ECCE studies focused on whether ECCE programs, either center-based child care (Magnuson et al., 2007a), Head Start (Zhai et al., 2011, 2014), or home-based child care (Fuller et al., 2004), improved children’s overall academic achievement. Bassok (2010) investigated the differences of the effects of these programs between demographic subgroups of children, and they also examined the narrowing of these achievement gaps over time (Bassok et al., 2016). However, few studies consider the differences between ECCE experiences, which is a critical component to assess given the inherent structural differences across these experiences. There are many possible reasons why we might expect to see different effects across the ECCE settings. For instance, home-based child care settings compared to center-based care, are more likely to have smaller child-to-adult ratios, mixed age groups settings, and less academic resources (Justice et al., 2019; Vandell, 1996); therefore, children’s experiences in home-based versus child care are not the same. Also, Head Start or Prekindergarten programs are more likely to have educators with additional education and certifications compared to child care or home-based settings (Friedman-Krauss et al., 2021). Lastly, funding mechanisms are also noticeably different across different ECCE settings, in that many home-based programs do not qualify or receive comparable funding resources compared to child care, Head Start, or Pre-K (Friedman-Krauss et al., 2020; Keating et al., 2021).
It is important to investigate whether there are differential effects for ECCE experiences that vary by student demographic subgroups (e.g., gender and race), to assess if the effects of ECCE experiences are moderated by the student demographic variables, or if the student demographic subgroup achievement gaps are varying by the ECCE experiences. The purpose of this study is to examine if there are differential gender and racial achievement gaps from K to Grade 8 that vary as a function of children’s ECCE experiences they had before kindergarten. Such an examination would expand our understanding about whether certain ECCE experiences are better at reducing achievement gaps for certain subgroups throughout elementary and middle school, and we can answer such questions as to which programs might work best for whom.
Differential Effects of ECCE Experiences by Gender and Racial Subgroups
Few studies have set out to examine whether achievement gaps can be reduced due to differential effects of the ECCE experiences on the academic outcomes of children from various racial and gender groups. While several studies indicate that the positive effects of ECCE were mixed (Barnett, 2011; Lipsey et al., 2013), some have found that Pre-K and child care are better at fostering long-term academic gains than Head Start (Curenton et al., 2015). For example, using data from the Early Childhood Longitudinal Study-Birth Cohort (ECLS-B), Bassok (2010) found that non-poor Black children benefitted more from center-based ECCE programs compared to Latinx and White students as measured by reading and math achievement at age four. Gormley et al. (2010) reported that Latinx and Black children, particularly those who received free lunch benefitted from the Oklahoma universal Pre-K program on the math-related domains (i.e., Applied Problems) after 1 year in the program. Furthermore, Joo (2010) found Head Start benefitted lower-income girls for both reading and math throughout middle childhood and adolescence. Results from Chatterji (2005) and Sohn (2012) also suggested that a reduction in racial and gender academic achievement gaps across ECCE experiences was possible over time. Although studies of differential effects of ECCE experiences by gender and racial subgroups existed in the literature, the systematic investigation of such differential effects from elementary school to middle school that use rigorous methods still lacks. Below, we provided more detailed review of the limitations of current studies on this topic and discussed the more rigorous analytical approach that we applied.
Examining Achievement Gaps from K Through Grade 8
Most studies examining ECCE’s effects on academic achievement analyzed samples in elementary school. For example, Chatterji (2005) and Magnuson et al. (2007a) focused on kindergarten to Grade 1; Sohn (2012) focused on Kindergarten to Grade 5. Although these studies have made important contribution for researchers and policy makers to understand the differential effects of ECCE experiences on subgroups from kindergarten to Grade 5, investigating longer term (e.g., Grade 8) differential effects of ECCE experiences are still needed given that children experience marked changes in terms of their social, cognitive, and physical development throughout the time span between early childhood and early adolescence. As the work by Reardon and Galindo (2009) and Robinson and Lubienski (2011) shows, achievement gaps widen and narrow across these developmental time periods. Thus, in this study, we contribute to the literature by examining the differential effects of ECCE and the longitudinal achievement gaps from K to Grade 8.
Methodological Challenges in Estimating Differential Effects of ECCE by Subgroups
Despite this rich body of work on differential effects of ECCE by subgroups, few studies have applied experimental or rigorous quasi-experimental methods to examine these differential effects. Many researchers investigate differential effects of ECCE on race and gender using moderation analysis (e.g., Chatterji, 2005; Gormley et al., 2010; Joo, 2010; Magnuson et al., 2004). In conventional moderation analysis researchers report the coefficient of the interaction term between the treatment variable (e.g., ECCE) and the moderator variable (e.g., race and gender) (Baron & Kenny, 1986). Because the interaction term is symmetric, its coefficient usually has two alternative interpretations: (1) the differential effects of ECCE experiences varying among the moderator subgroups or (2) the differential subgroup achievement gaps varying among ECCE experiences.
Although there is a debate regarding whether the gaps among subgroups should be estimated by controlling for covariates or not (e.g., Gershenson & Holt [2015] estimated both the unconditional and “adjusted” gender and socioeconomic status [SES] gaps conditional on household and student characteristics), recent literature on differential ECCE effects commonly incorporated covariates into their analyses. Bassok (2010) included child and family characteristics in both ordinary least squares (OLS) regression and the inverse probability of treatment weighting (IPTW) methods. Gormley et al. (2005) included demographic and socioeconomic related variables in their analysis with regression discontinuity design. Joo (2010) included child and family characteristics plus neighborhood and school quality in the OLS regression. Note that all analyses, statistically adjusted covariates among ECCE and between the moderator subgroups, that is, the differential effects of ECCE or the differential subgroup achievement gaps were estimated by aiming to keep the children similar on the covariates among ECCE and between the moderator subgroups.
Although the conventional moderation analysis can statistically adjust for covariates, it is still subject to concerns about selection bias due to systematic differences between treatment-by-moderator groups (Dong, 2015). For example, across center-based care settings, White children are probably different on the distribution of covariates (SES, single parents, welfare receipt, etc.) from Black or Latinx children. Furthermore, White children in center-based Child Care are probably different from the White children in other care types (e.g., Head Start or Home-based care). As a result, the impact differences among ECCE experiences on achievement gaps between subgroups may not be solely attributed to the moderator effects if selection bias exists among treatment-by-moderator groups.
Introducing Causal Moderation Analysis Using Propensity Scoring
A few researchers have applied propensity score methods (Rosenbaum & Rubin, 1983) for subgroup analysis to address issues related to selection bias (see Hill et al., 2003; Lochman et al., 2006; Peck, 2003; Schochet & Burghardt, 2007). For example, when the moderator variable is binary, the common practice is to match participants between the treatment and comparison groups within each moderator level. Matching treatment and comparison groups within each moderator level can ensure baseline equivalence, thereby producing unbiased estimates of treatment effects within each particular moderator level. However, if one fails to ensure baseline equivalence among treatment-by-moderator groups, such models may still produce biased interaction effect estimates, which would be problematic because the results for the differences in treatment effects by moderator levels may not be solely due to the moderator variable.
Imai and van Dyk (2004) use generalized propensity score methods to study the main effects of bivariate treatment variables (two continuous treatment variables) using sub-classification. Dong (2015) examines various propensity score applications (stratification, inverse of propensity score weighting, and matching) in analyzing the main and interaction effects of two binary factors through Monte Carlo simulation. Furthermore, using the counterfactual model (Holland, 1986; Rosenbaum, 2002; Rubin, 1974) that is demonstrated in Figure A1 in Appendix A, Dong (2015) and Dong et al. (2022) proposes causal moderation analysis using the inverse probability of treatment weighting (IPTW) (Imbens, 2000). Dong’s (2015) and Dong, Kelcey, and Spybrook’s (2022) causal moderation analysis is used as the methodological framework for this study.
We denote the potential outcome of the achievement level of a student in the Head Start group (Treatment = 1) who is identified as a girl (Moderator = 1) with Y (1,1), in Head Start group (1) who is identified as a boy (0) with Y (1,0), in parental care group (Treatment = 0) who is identified as a girl (1) with Y (0,1), and in parental care group (0) who is identified as a boy (0) with Y (0,0). Then, [Y (1,1)-Y (1,0)] indicates the girls-boys achievement gap in Head Start and [Y (0,1)-Y (0,0)] indicates the girls-boys achievement gap in parental care; [Y (1,1)-Y (0,1)] indicates the treatment effect of Head Start compared to parental care for girls and [Y (1,0)-Y (0,0)] indicates the treatment effect of Head Start compared to parental care for boys. Hence, the effects of Head Start as compared with parental care in reducing the math achievement gap between girls and boys can be indicated by difference-in-difference on the potential outcomes: {[Y (1,1)-Y (1,0)]-[Y (0,1)-Y (0,0)]} or {[Y (1,1)-Y (0,1)]-[Y (1,0)-Y (0,0)]}. This illustration focuses on a binary treatment variable and a binary moderator variable. The framework can be expanded to multi-category treatment and moderator variables (Dong, 2015; Dong et al., 2022). Further technical details are presented at the Analytic Strategy subsection below.
The Present Study
This study aimed to utilize a rigorous quasi-experimental design—causal moderation analysis using propensity scoring to examine the differential effects of five ECCE experiences (Pre-K, Child Care, HS, Home-based, and Parental) on children’s longitudinal (Grade K-8) academic achievement gaps by racial and gender subgroups. Specifically, we addressed the following research question: Are there differential effects among ECCE experiences in reducing gender and racial academic achievement gaps at kindergarten, grades 1, 3, 5, and 8?
Methods
Sample
This study uses data from the Early Childhood Longitudinal Study, Kindergarten Class of 1998-99 (ECLS-K) Kindergarten through Eighth Grade Full Sample. The ECLS-K is a nationally representative longitudinal study of children started with approximately 22,000 children attending kindergarten during 1998-99 school year. Direct cognitive assessments on math and reading were administered at Fall Kindergarten, Spring Kindergarten, Fall Grade 1 (30% subsample 1 ), Spring Grade 1, Spring Grade 3, Spring Grade 5, and Spring Grade 8. In addition, the data included child and family characteristics. We derived two slightly different samples from ECLS-K: (1) A math sample with complete cases on the math outcomes, ECCE indicator, and demographic moderators for gender and race (N = 7,193) and (2) A reading sample with complete cases on reading outcomes, ECCE indicator, and moderators (N = 6,765).
Measures
Outcome Measures: The ECLS-K analytic sample includes six waves of math and reading Item Response Theory (IRT) scale scores constructed by the U.S. Department of Education’s National Center for Education Statistics (NCES). IRT scoring uses a set of common items to vertically equate math and reading scores, which allow us to compare academic achievement gaps across waves of data collection. The outcome measures had high reliability, with Cronbach’s alpha coefficients ranging from 0.76 to 0.88 for math and 0.73 to 0.88 for reading in the six waves of assessment (Tourangeau et al., 2009). We use the standardized mean difference (Hedges’ g) after propensity score adjustment to measure achievement gaps and make comparisons across grades.
ECCE. Following Magnuson, Ruhm, and Waldfolgel’s (2007a), we classify ECCE into five mutually exclusive groups based on the parental response to the fall kindergarten survey for the question “primary type non-parental care at prekindergarten” (variable P1PRIMPK) (U.S. Department of Education, National Center for Education Statistics, 2009). ECCE experiences were categorized into center-based child care (45.8%), Pre-K (4.9%), Head Start (7.6%), other home-based child care by a relative (not a parent), babysitter, family child care, or nanny (25.0%) which we refer to as “Home-based Child Care,” and parental care (16.5%) 2 . While both Pre-K and Head Start are center-based programs, we analyze them separately because Pre-K usually yields larger effect sizes in academic outcomes compared to Head Start programs (Magnuson et al., 2004).
Demographic moderators: ECLS-K includes a composite race variable, consisting of White (non-Hispanic), Black, Latinx (race specified and race not specified), Asian, Native Hawaiian (other Pacific Islander), American Indian or Alaska native, more than one race (non-Hispanic) categories. From the original race variable, we derive four race categories: Black (9.7%), Latinx from any race (16.2%), White (65.0%), and other (9.1%). Gender is also included, where half of the analytic sample were females (50.5%), and the remaining were males (49.5%).
Additional explanatory variables: Covariates are either correlated with outcomes, ECCE or moderators, and include children’s motor skills, height, weight, age at the kindergarten entry, English speaking status at home, parents’ educational level, income, composite SES measure, household structure (numbers of parents and siblings), census region in sampling frame (Northeast, Midwest, South, and West), and locality (urban, rural, or town). These variables were selected given that prior research has shown these variables were related to children’s academic achievement (Joo, 2010; Magnuson et al., 2004).
Analytic Strategy
Missing data: To investigate the longitudinal, differential effects of ECCE experiences in reducing subgroup achievement gaps, we use analytic samples with non-missing values on six waves of outcomes, the main predictor (ECCE experiences), and the demographic moderators (gender and race) at kindergarten entry. We allow missing values in the other covariates and used multiple imputation to address this issue. Based on the formula provided by Rubin (1987, p. 114), to obtain a relative efficiency of more than 99.9%, we imputed 30 times for the math sample (the maximum missing rate is 0.89%) and 15 times for the reading sample (the maximum missing rate is 0.14%).
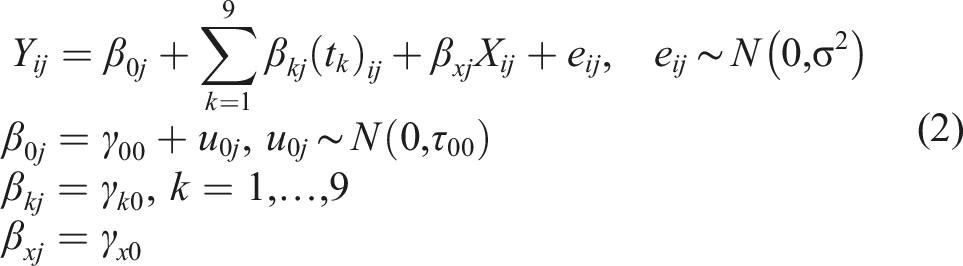
Casual moderation analysis using generalized propensity score methods: Based on the counterfactual model (Figure A1 in Appendix A) we use the causal moderation analysis framework to estimate the differential effect of ECCE experiences in reducing racial and gender math and reading achievement gaps, while accounting for potential bias across comparison conditions (Dong, 2015; Dong et al., 2022). We first convert the two-dimensional design (e.g., 5 × 2 in this study, where 5 represents the number of ECCE experiences and 2 represents the number of levels for the binary coded moderator subgroups) to a one-dimensional design (10 × 1), that is, classifying children into 10 subgroups by combining care type and moderator groups. Across these analyses, Females (1) are compared with Males (0) as the reference group; Latinxs (1) are compared with Whites (0) as the reference; and Blacks (1) are compared with Whites (0) as the reference. We use Model 1 to estimate the generalized propensity score, where k = 1 to 9, and k = 10 serves as the reference group. For example, in the analysis of the gender math achievement, k = 1 is for girls in Child Care, k = 2 is for boys in Child Care, k = 3 is for girls in Pre-K, k = 4 is for boys in Pre-K, k = 5 is for girls in Head Start, k = 6 is for boys in Head Start, k = 7 is for girls in home-based care, k = 8 is for boys in home-based care, k = 9 is for girls in parental care, and k = 10 is for boys in parental care (the reference group). By using the inverse of the generalized propensity scores as analysis weights, we make the covariate distribution in each of 10 subgroups resemble that for the entire sample. We estimate the effects of multi-valued treatment variables using Model 2. Models 1 and 2 are described in detail below.
The generalized propensity score is the conditional probability of receiving treatment k given pre-treatment covariates X:

Model 2 is a random intercept model:
We ran the two-level HLM for each of the 30 and 15 imputed datasets using SAS PROC MIXED procedure. Finally, estimates are pooled from the analysis based on 30 and 15 imputed datasets using SAS PROC MIANALYZE procedure. The longitudinal effects on Grades 1, 3, 5, and 8 are estimated using the same approach. We calculated the effect sizes for the parameters of interest using the Hedges’ g (standardizing the parameters by the pooled standard deviation of the outcome calculated from the unconditional model).
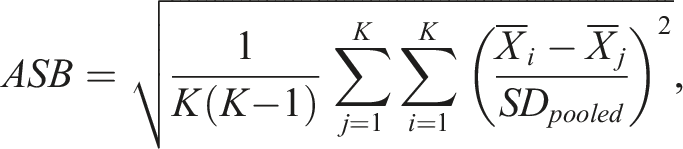
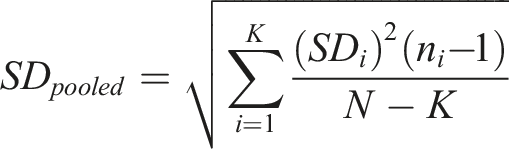
Covariate balance checking: Prior to interpreting the estimates from causal moderation analysis, covariate balance checking is conducted for main and differential effects. There is little guidance in the literature about the covariate balance checking in propensity score analysis concerning more than two groups (Stuart & Rubin, 2007). We propose a covariate balance index for multiple groups, average standardized bias (ASB). The ASB index is defined by
Covariate balance checking among 10 ECCE-by-gender groups after propensity score weighted analysis (math sample).
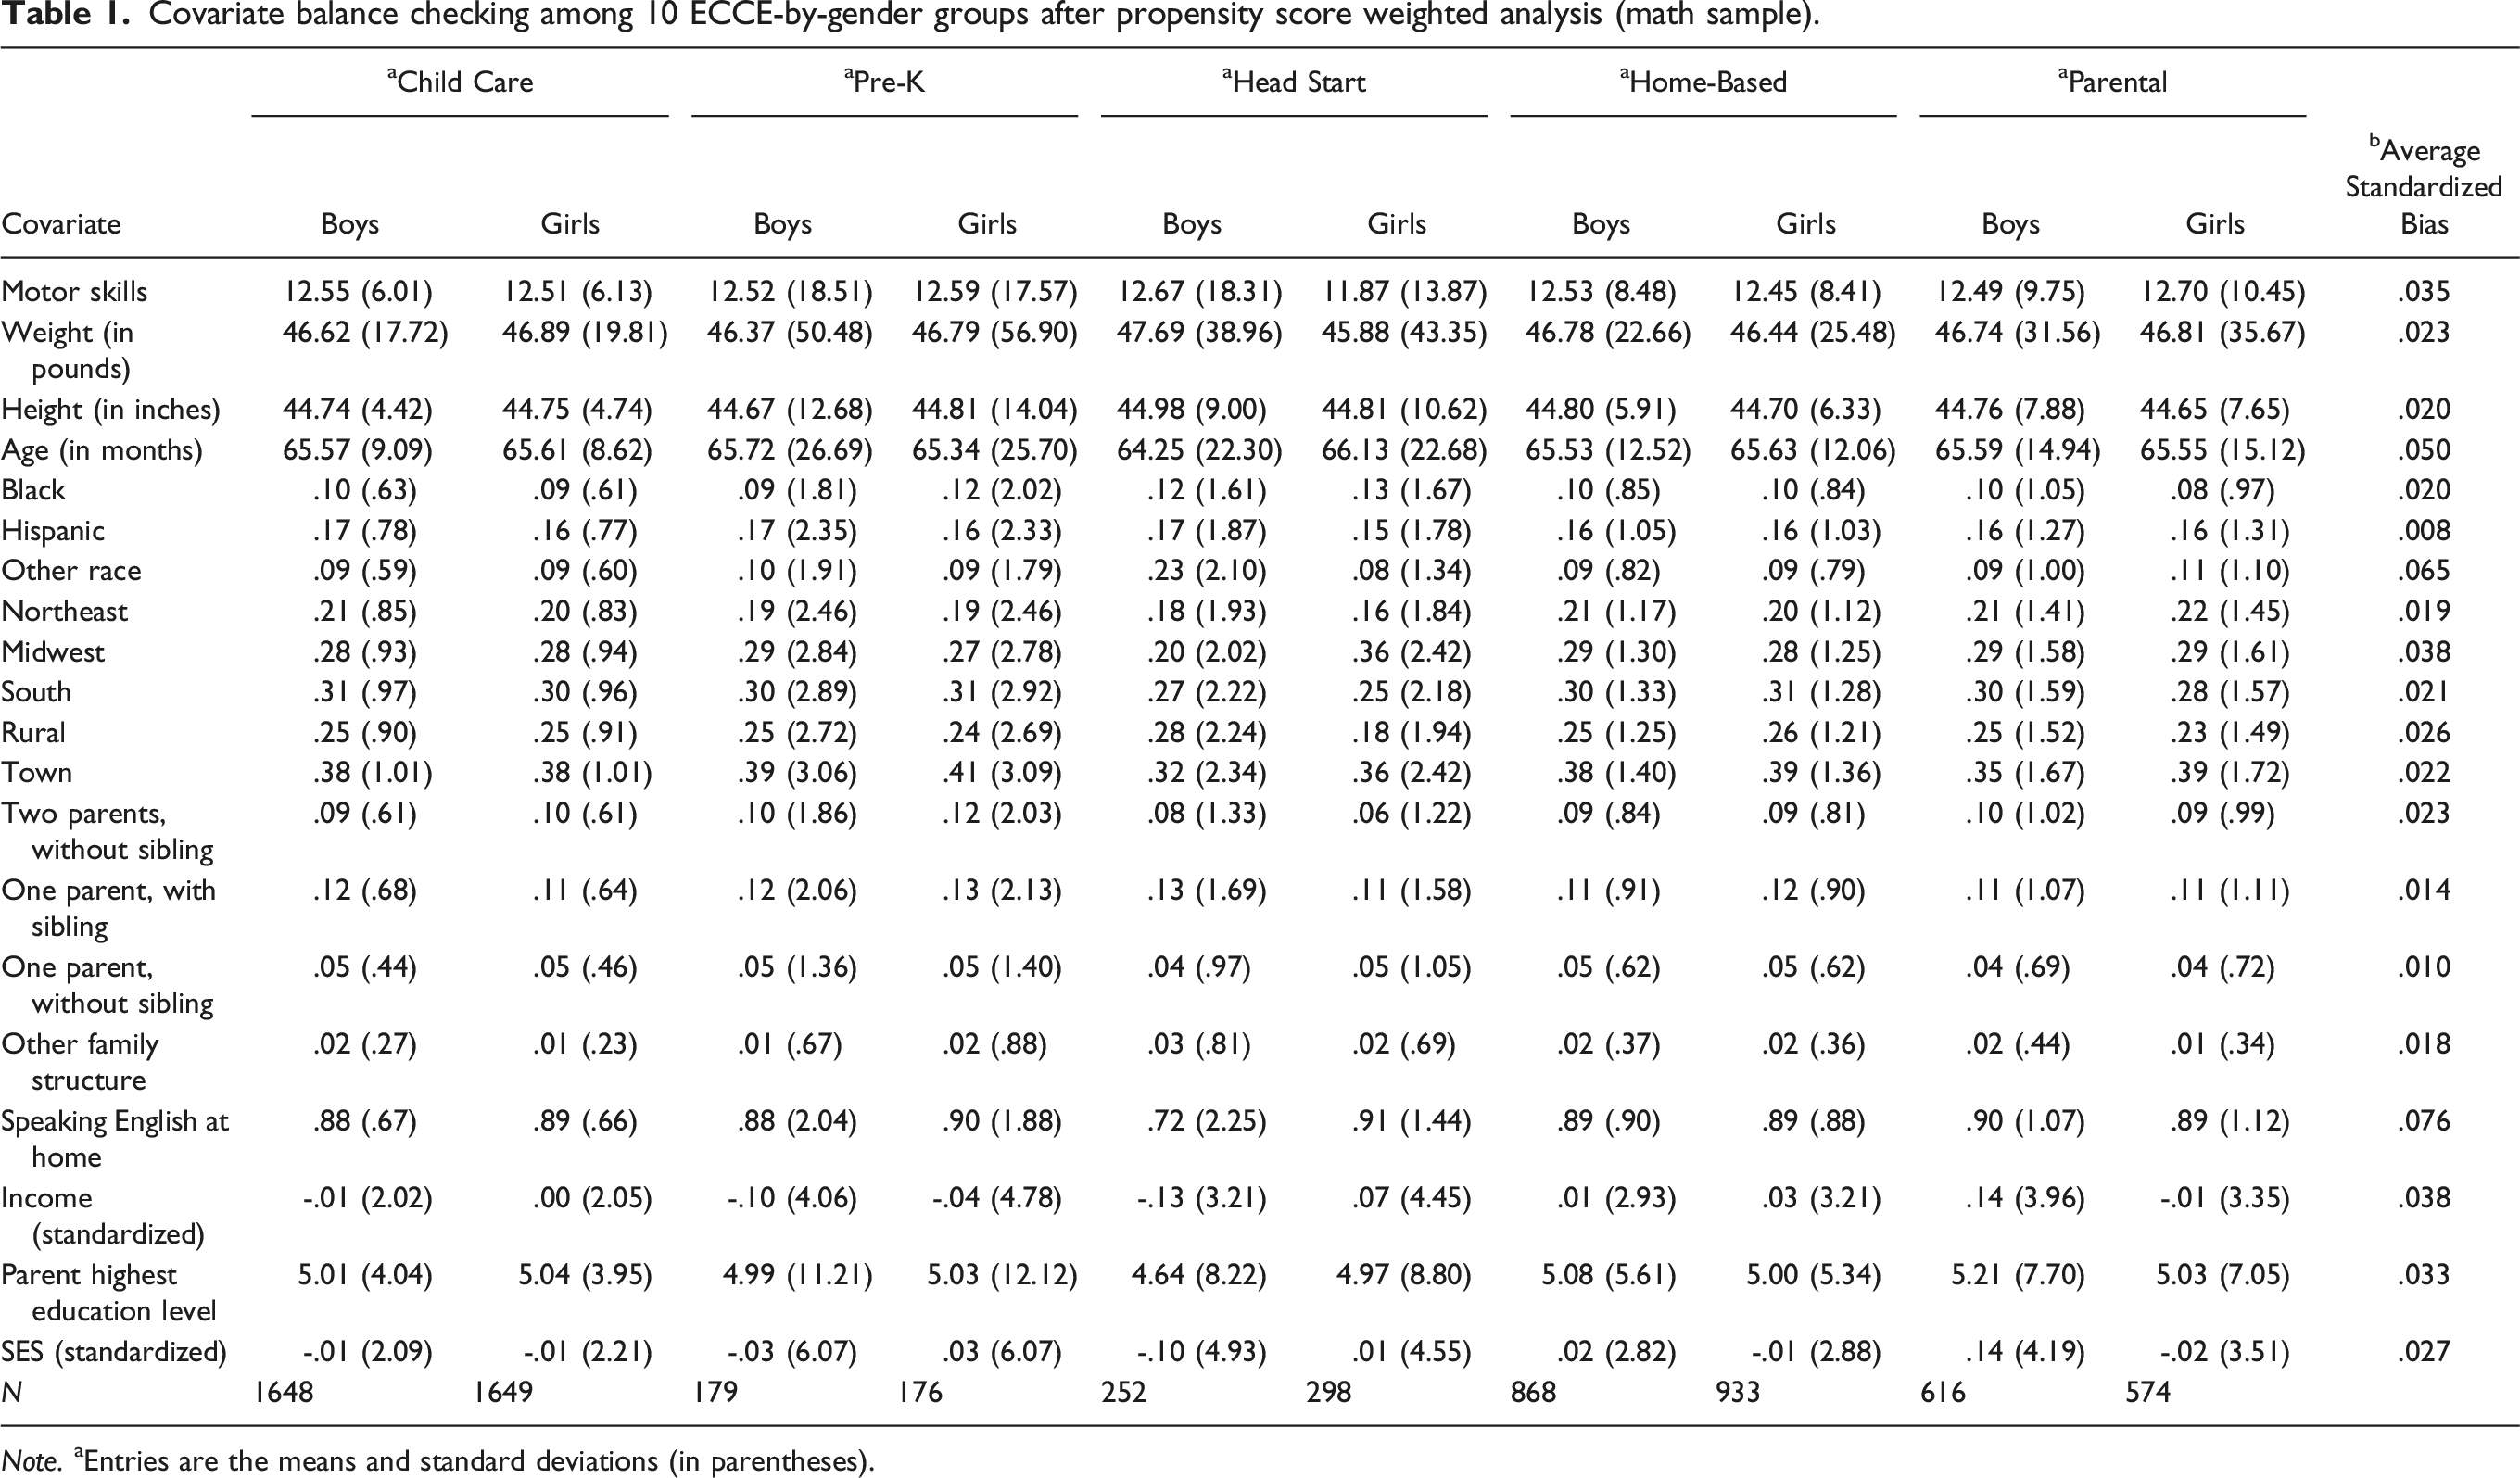
Note. aEntries are the means and standard deviations (in parentheses).
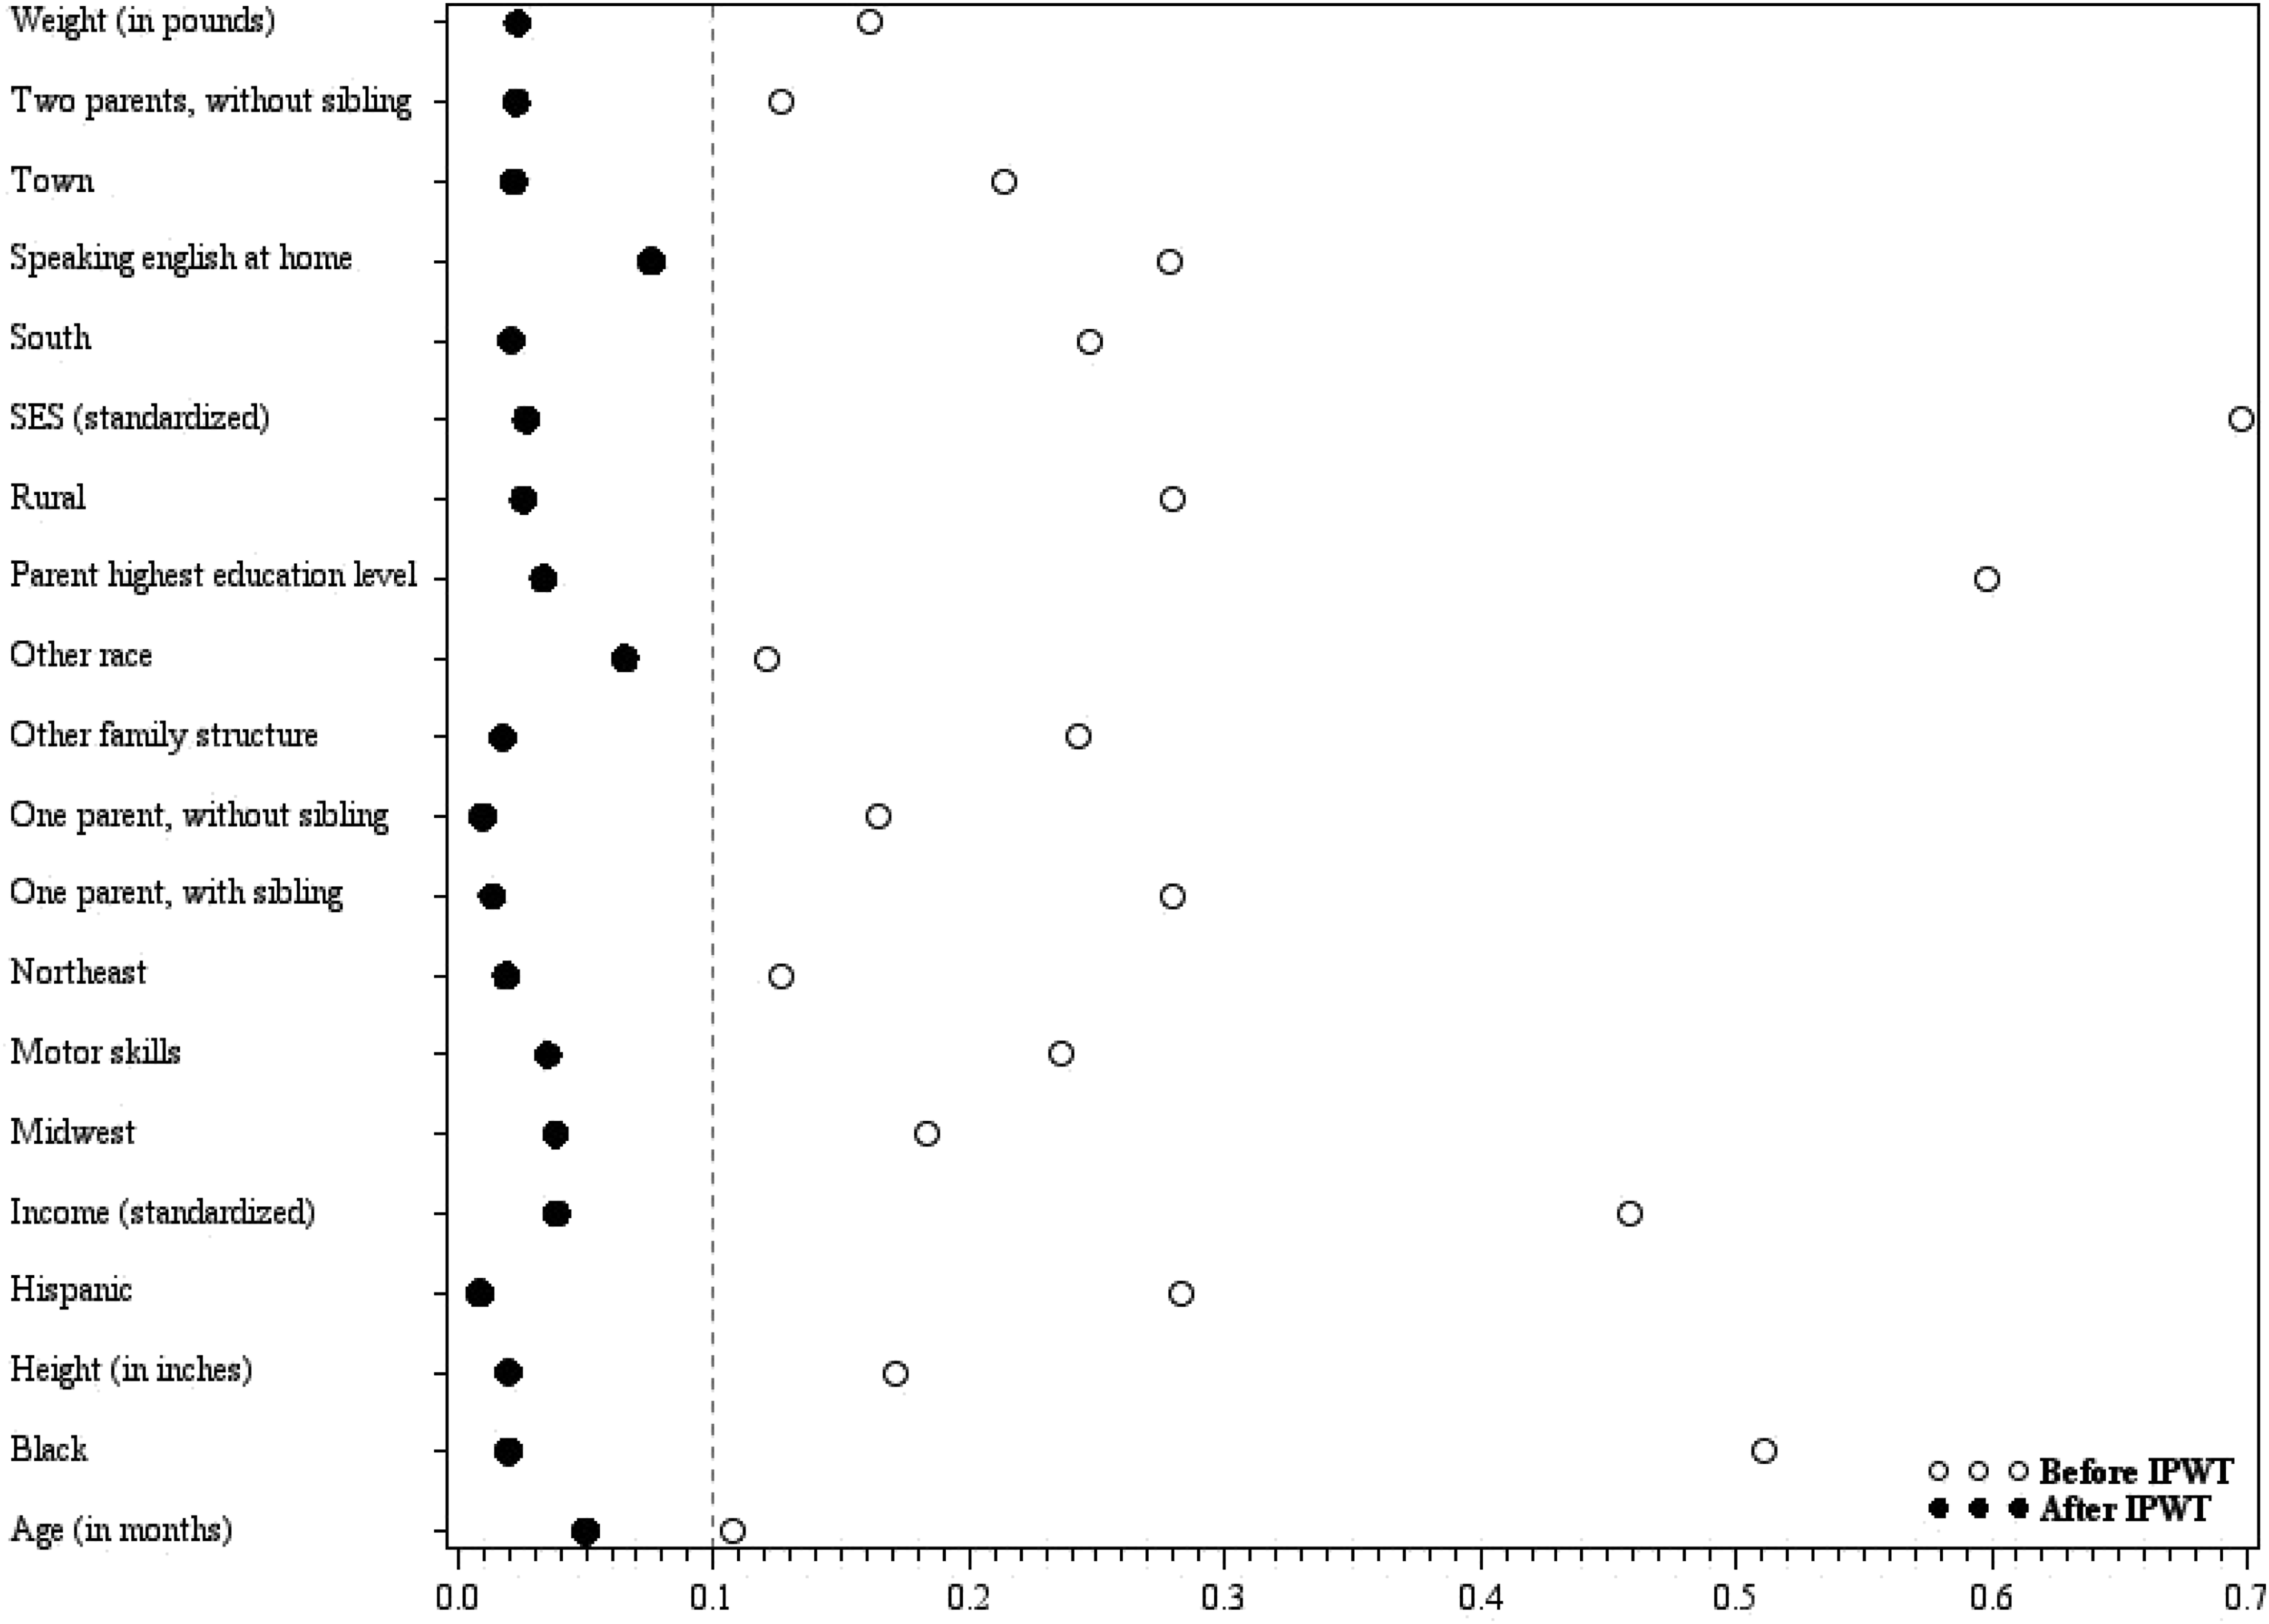
Covariate balance checking on the average standardized bias among 10 ECCE-by-Gender groups before and after propensity score weighting.
Results
Girls versus Boys academic achievement gaps (effect sizes) and 95% confidence intervals by ECCE and grade from propensity score weighted analysis.
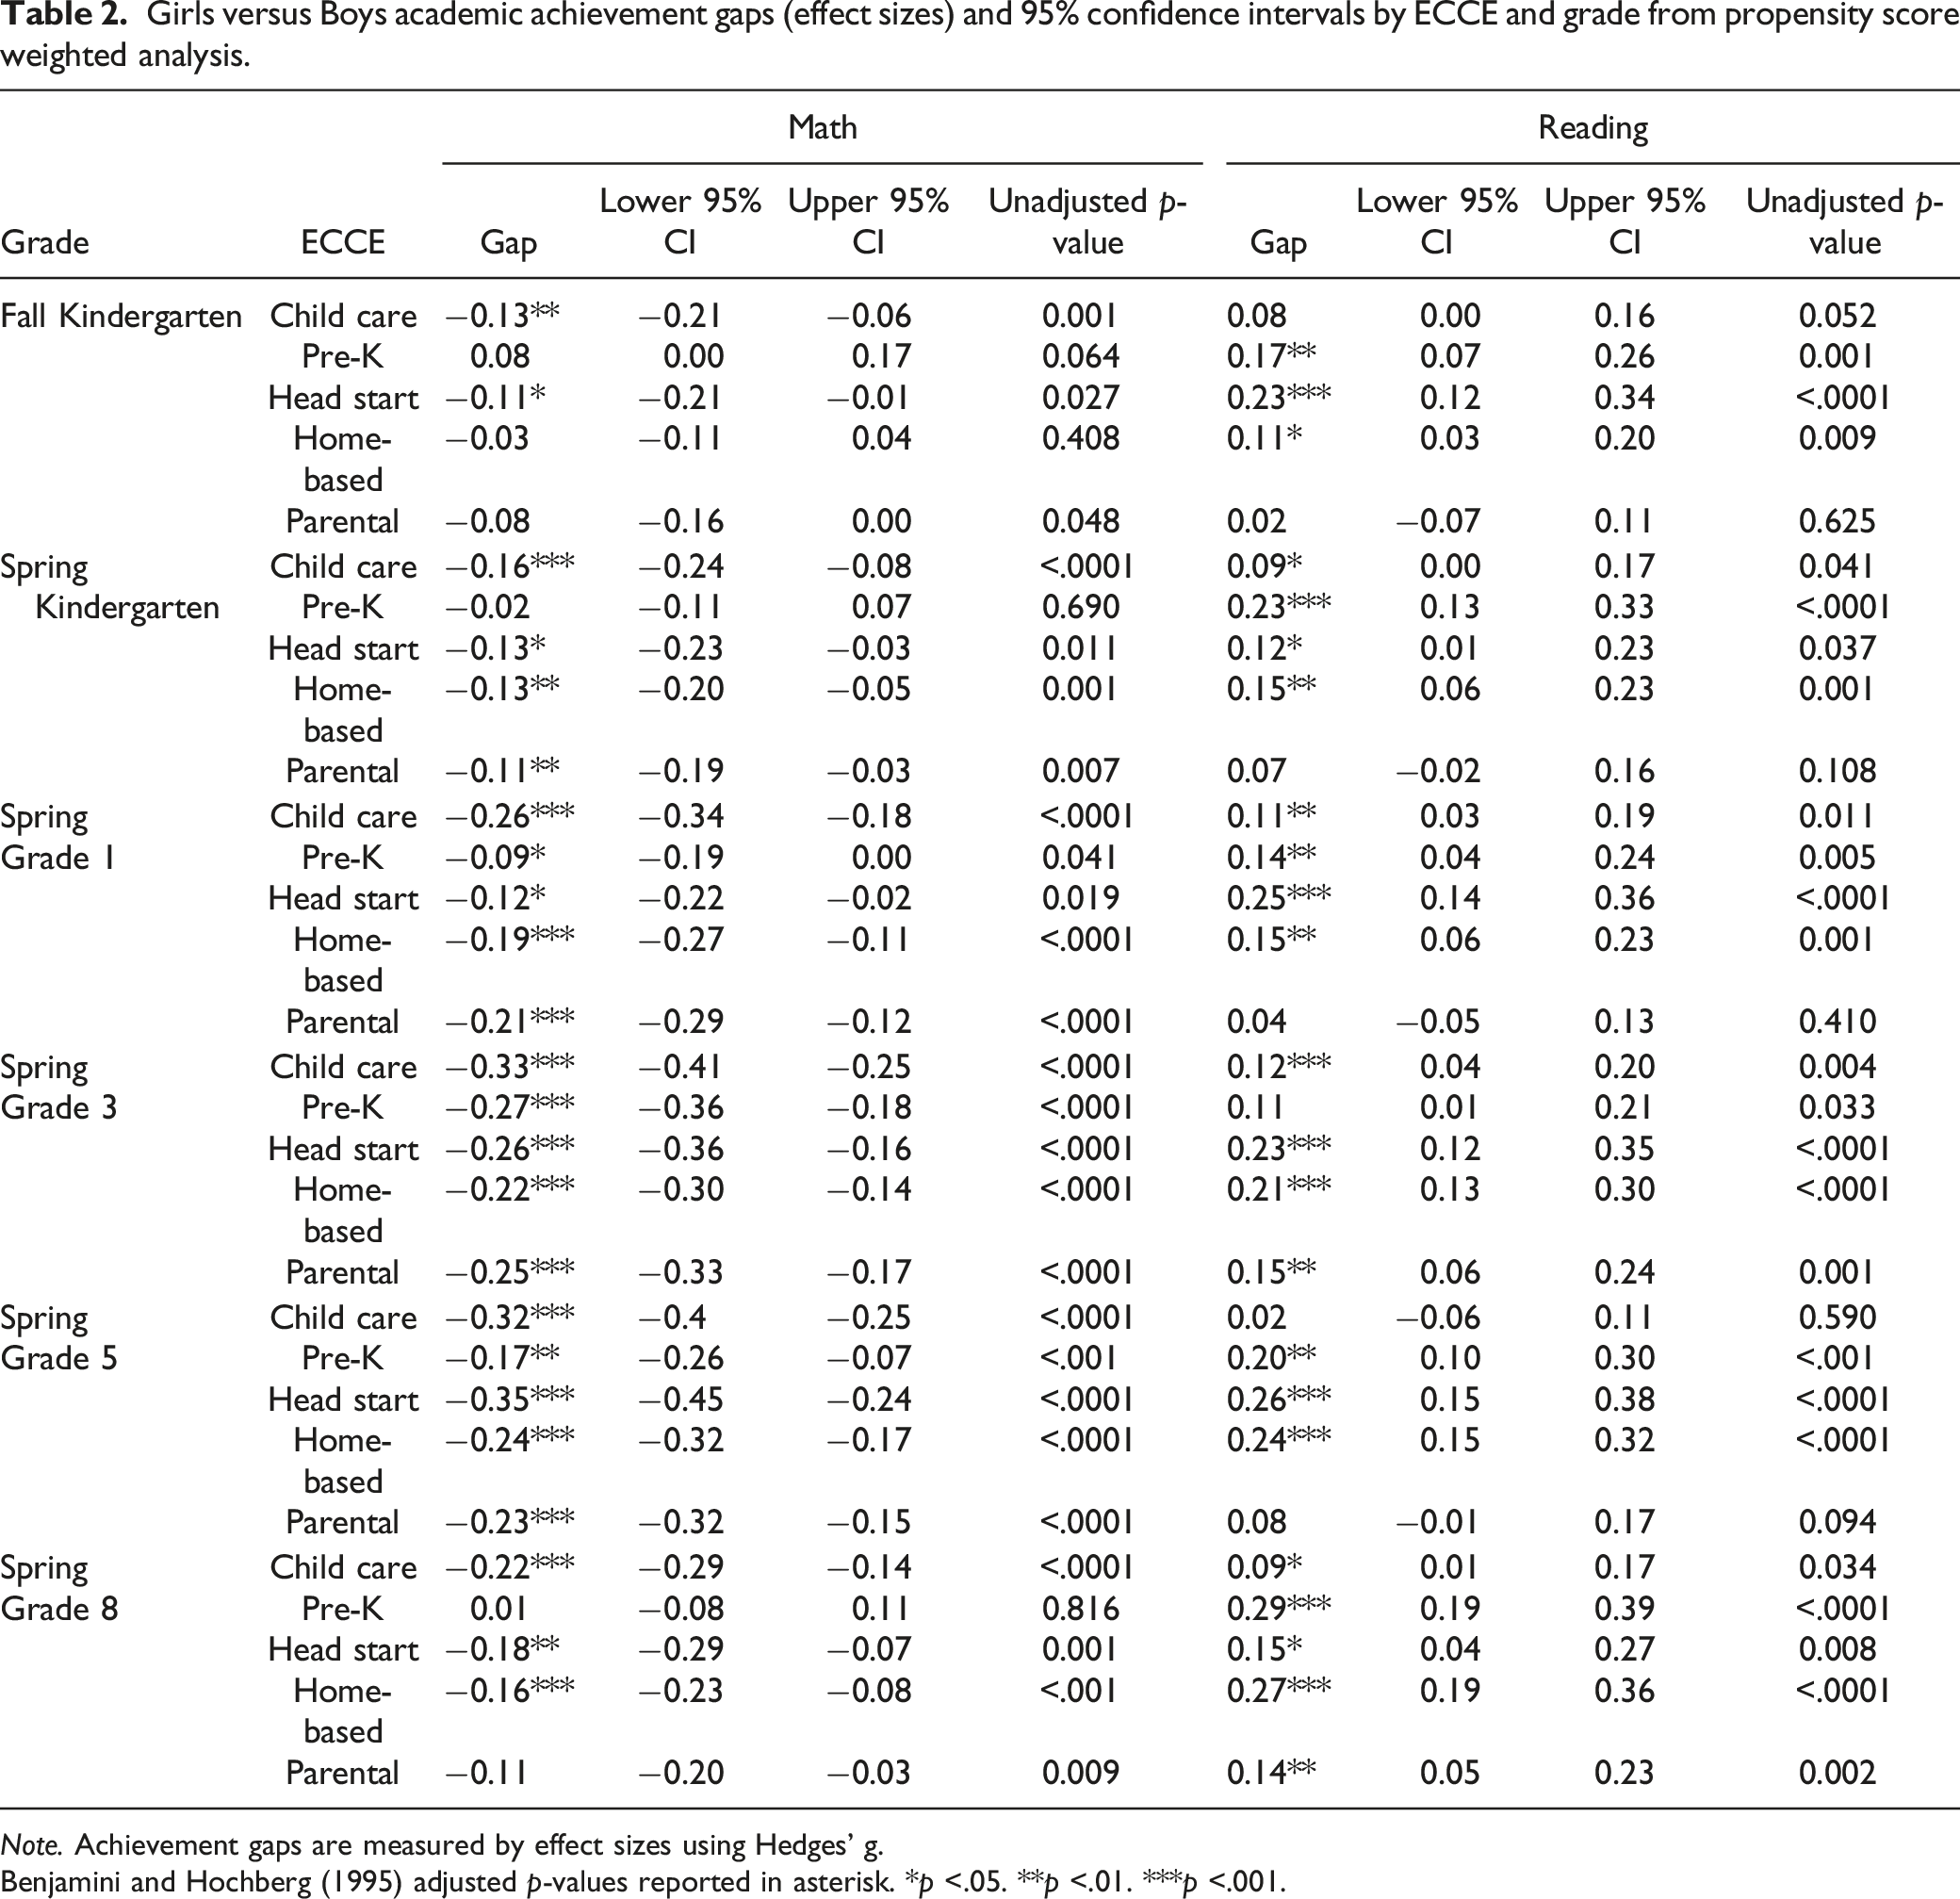
Note. Achievement gaps are measured by effect sizes using Hedges’ g.
Benjamini and Hochberg (1995) adjusted p-values reported in asterisk. *p <.05. **p <.01. ***p <.001.
Latinx versus White academic achievement gaps (effect sizes) and 95% confidence intervals by ECCE and grade from propensity score weighted analysis.
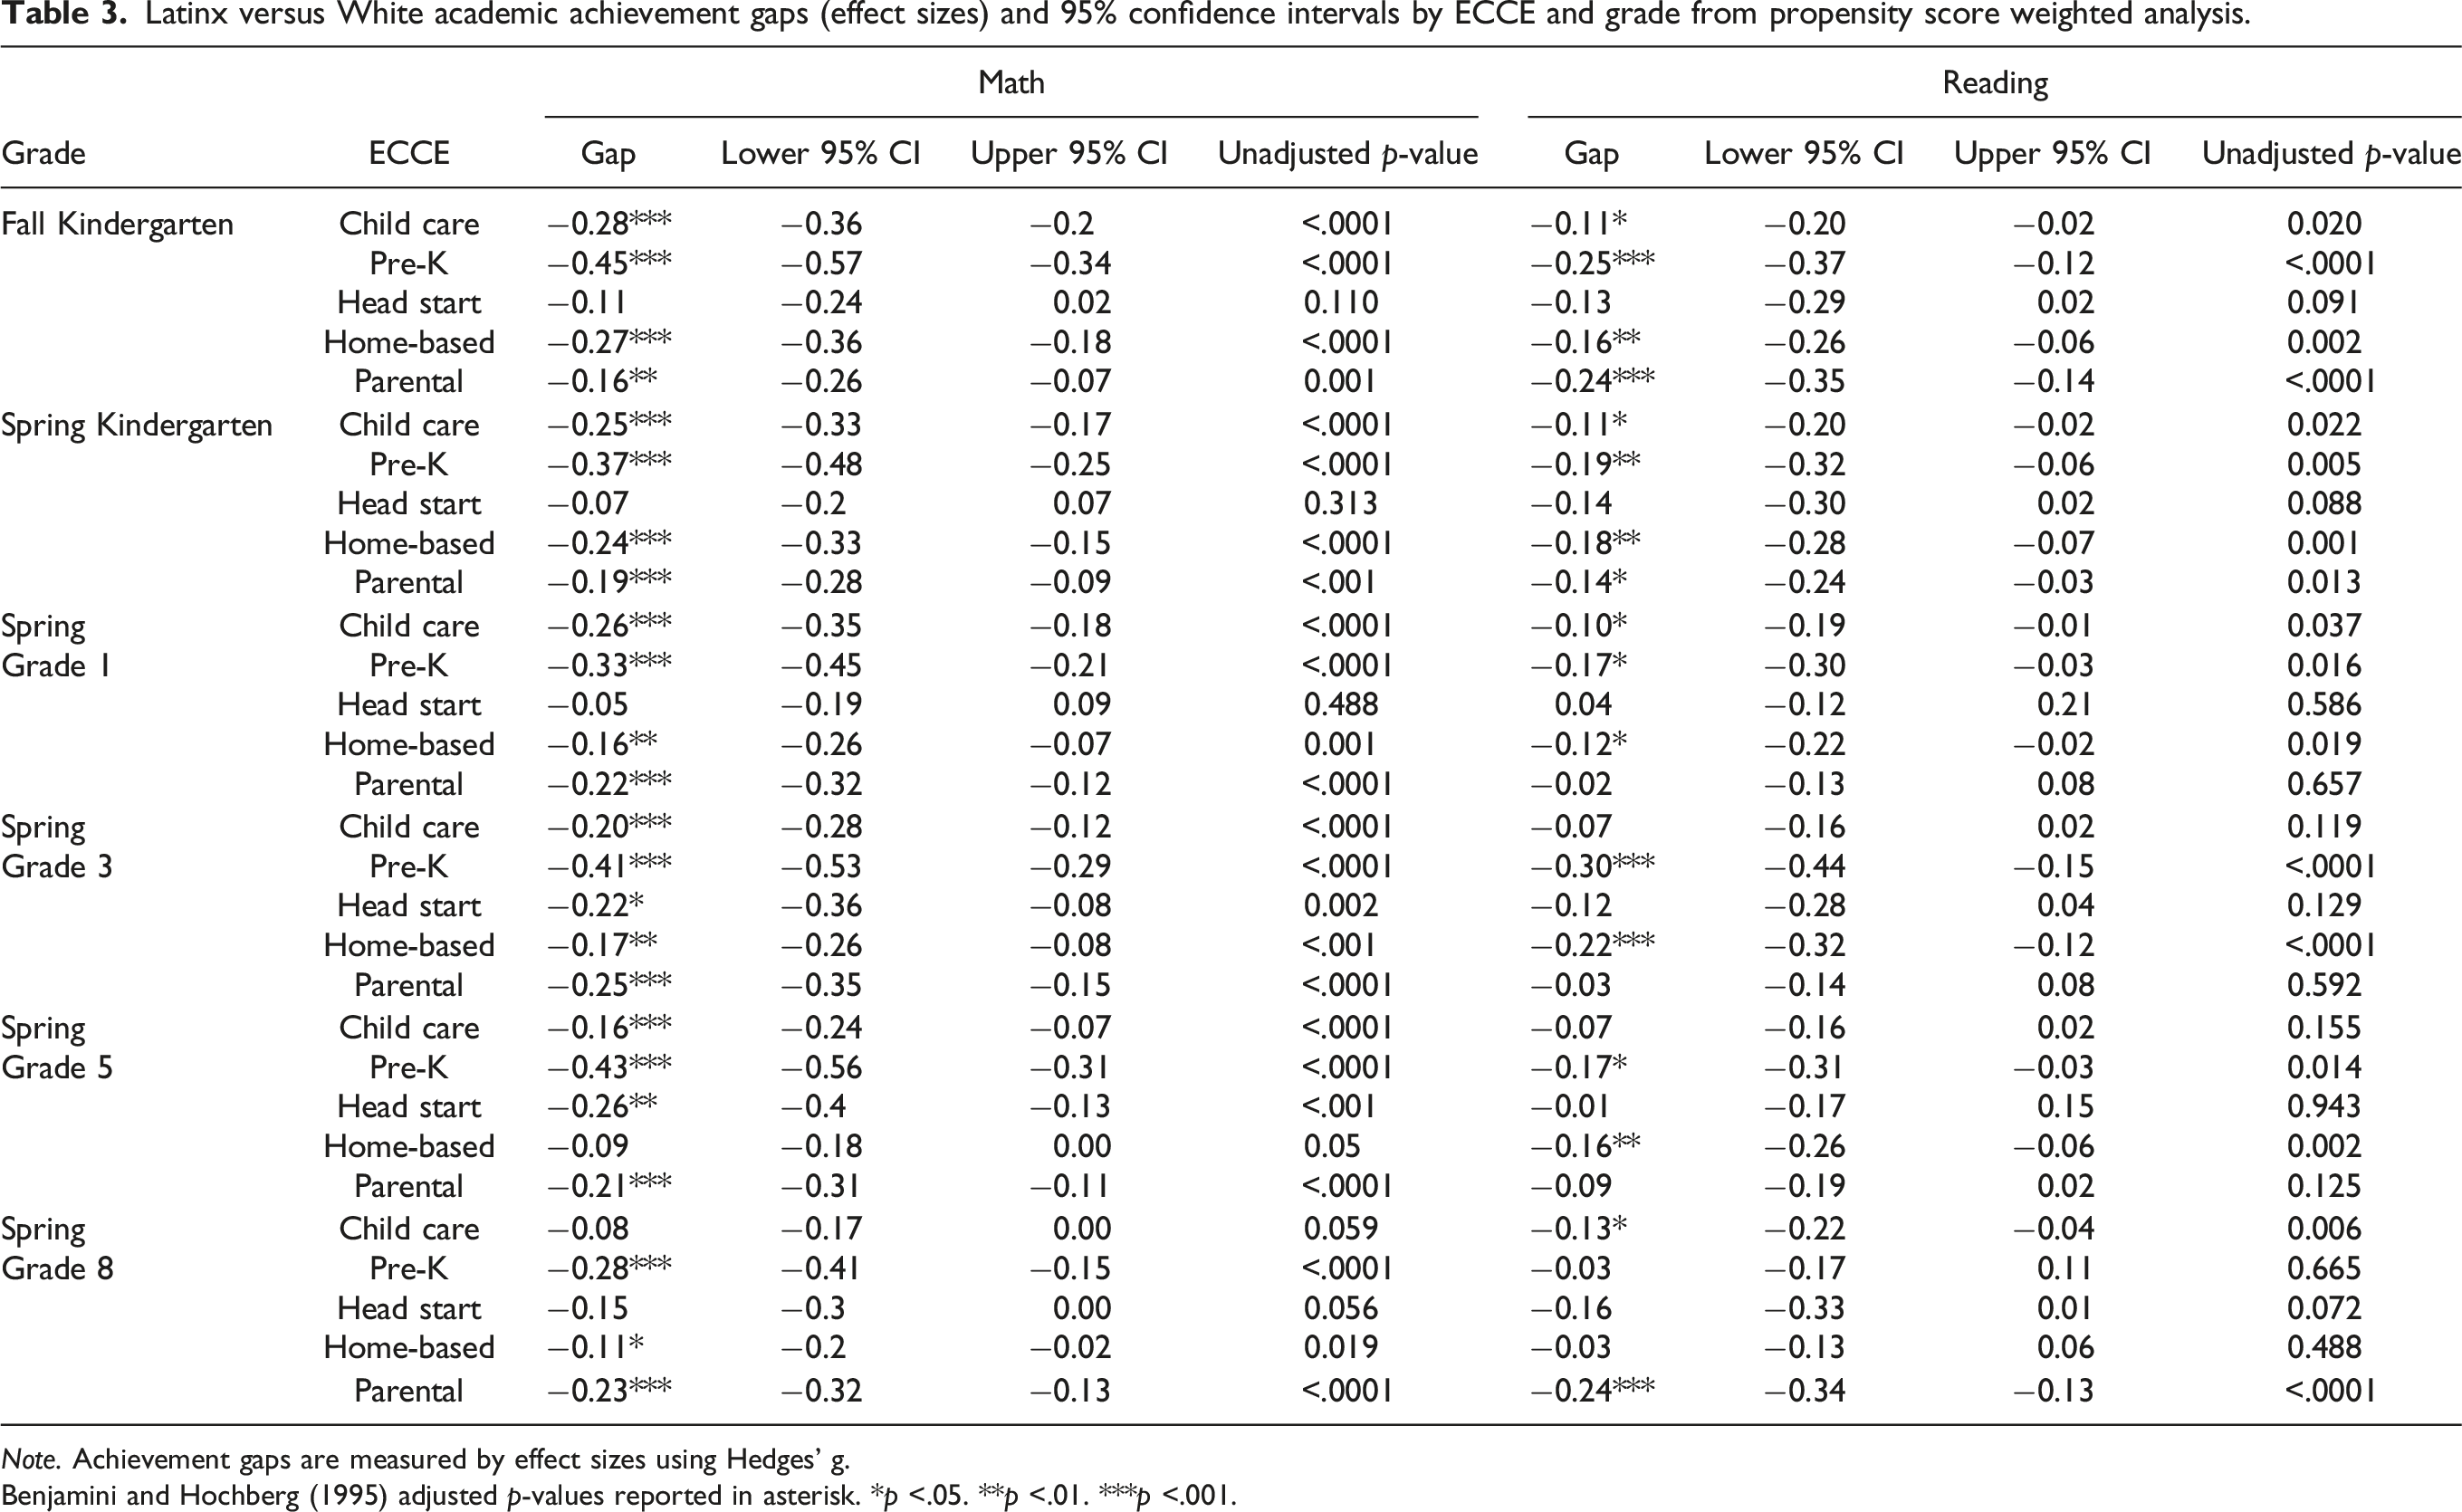
Note. Achievement gaps are measured by effect sizes using Hedges’ g.
Benjamini and Hochberg (1995) adjusted p-values reported in asterisk. *p <.05. **p <.01. ***p <.001.
Black versus White academic achievement gaps (effect sizes) and 95% confidence intervals by ECCE and grade from propensity score weighted analysis.
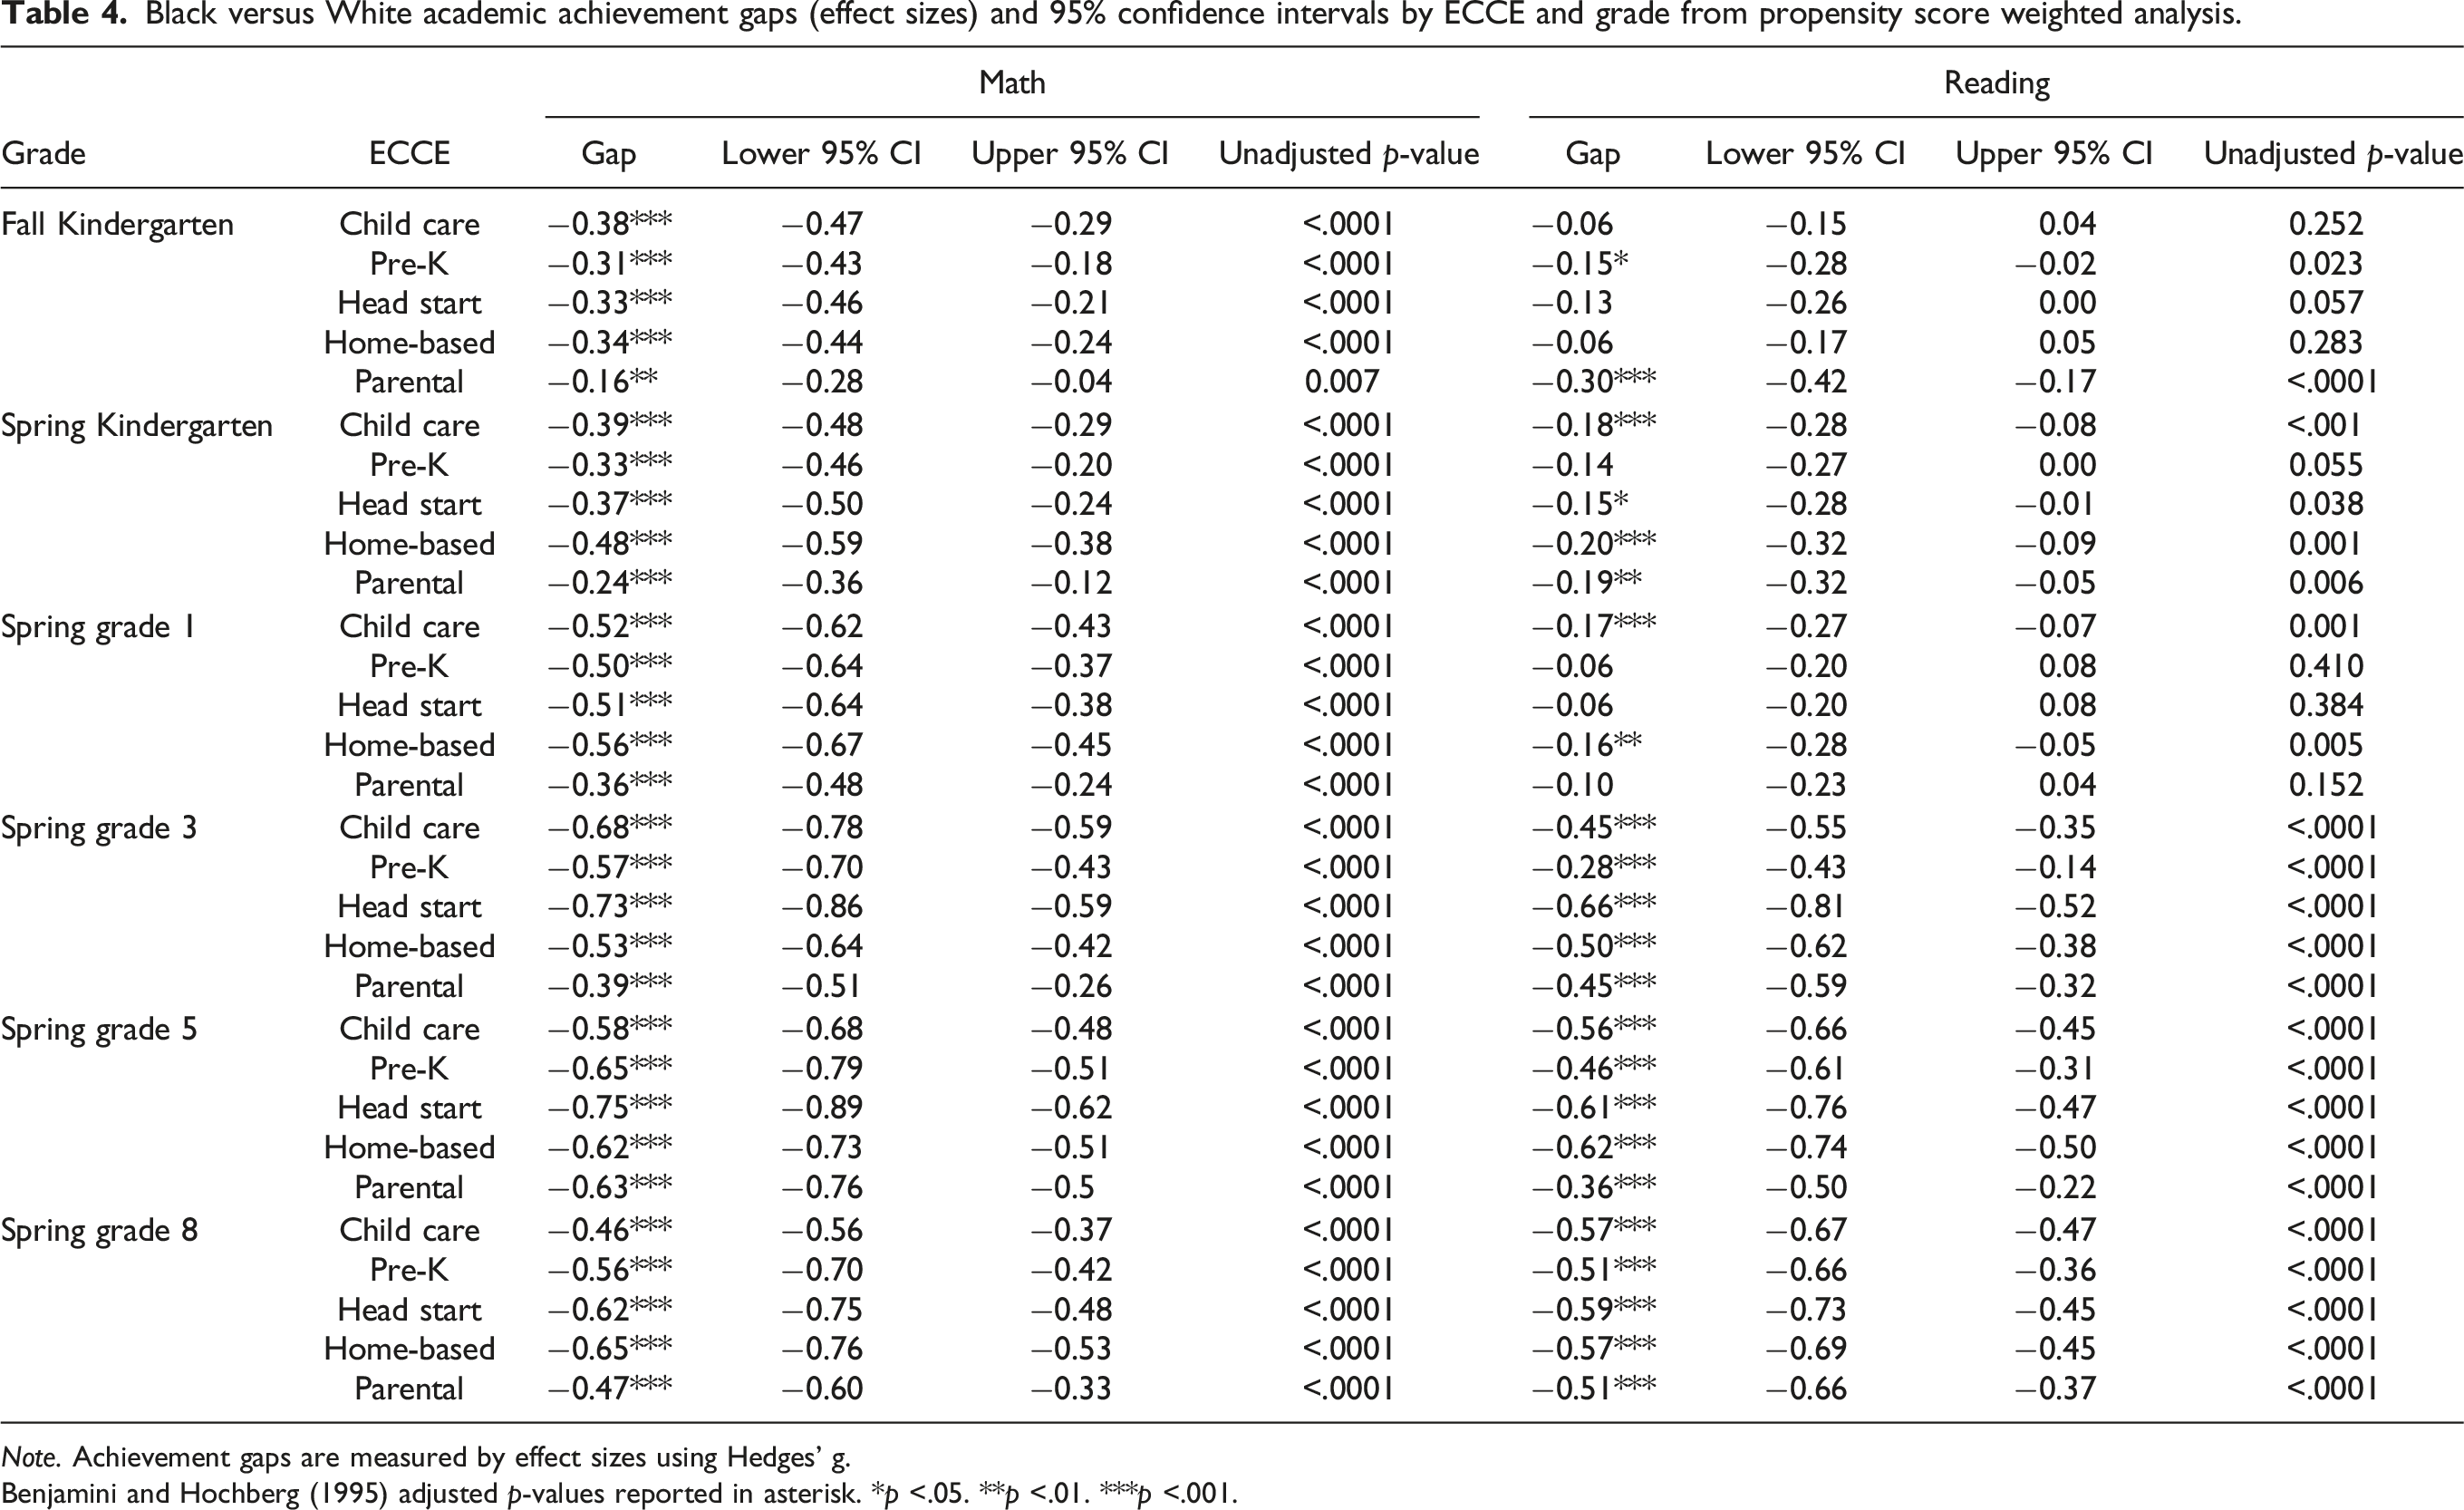
Note. Achievement gaps are measured by effect sizes using Hedges’ g.
Benjamini and Hochberg (1995) adjusted p-values reported in asterisk. *p <.05. **p <.01. ***p <.001.
Differential Effects of ECCE Experiences
The following results examine the differential effects of ECCE experiences across the various subgroups. Results are reported in Hedges’ g effect sizes with a negative g coefficient favoring the reference group and a positive g coefficient favoring comparison groups (Females, Latinxs, and Blacks). Null results indicate there is no significant achievement gap between the two subgroups, and thus can be interpreted as an indicator of the ECCE program’s success.
Girls versus Boys. Table 2 and Figures 2 and S4 present the Girls versus Boys math and reading achievement gaps among five ECCE experiences by grade using IPTW. In terms of math achievement, boys who had Child Care, Head Start, and Parental experiences outperformed girls at math in the fall of kindergarten. However, there was no difference between boys and girls who had attended Pre-K or Home-based, and such a null result indicates that Pre-K and Home-based eliminated the gap. Similarly, for math achievement in the spring of kindergarten, boys who had prior experiences in Child Care, Head Start, Home-based, and Parental care outperformed girls at math; again, Pre-K eliminated the gap as evidenced by no gender-related differences. In Grades 1st, 3rd, and 5th, boys from all ECCE experiences show stronger math skills. In 8th grade boys who had Child Care, Head Start, and Home-based experiences outperformed girls at math, but there was no gender gap for those 8th graders who had attended Pre-K or who had stayed home with their parents. Girls (1) versus Boys (0) math achievement gaps (effect sizes) and 95% confidence intervals by ECCE and grade from propensity score weighted analysis.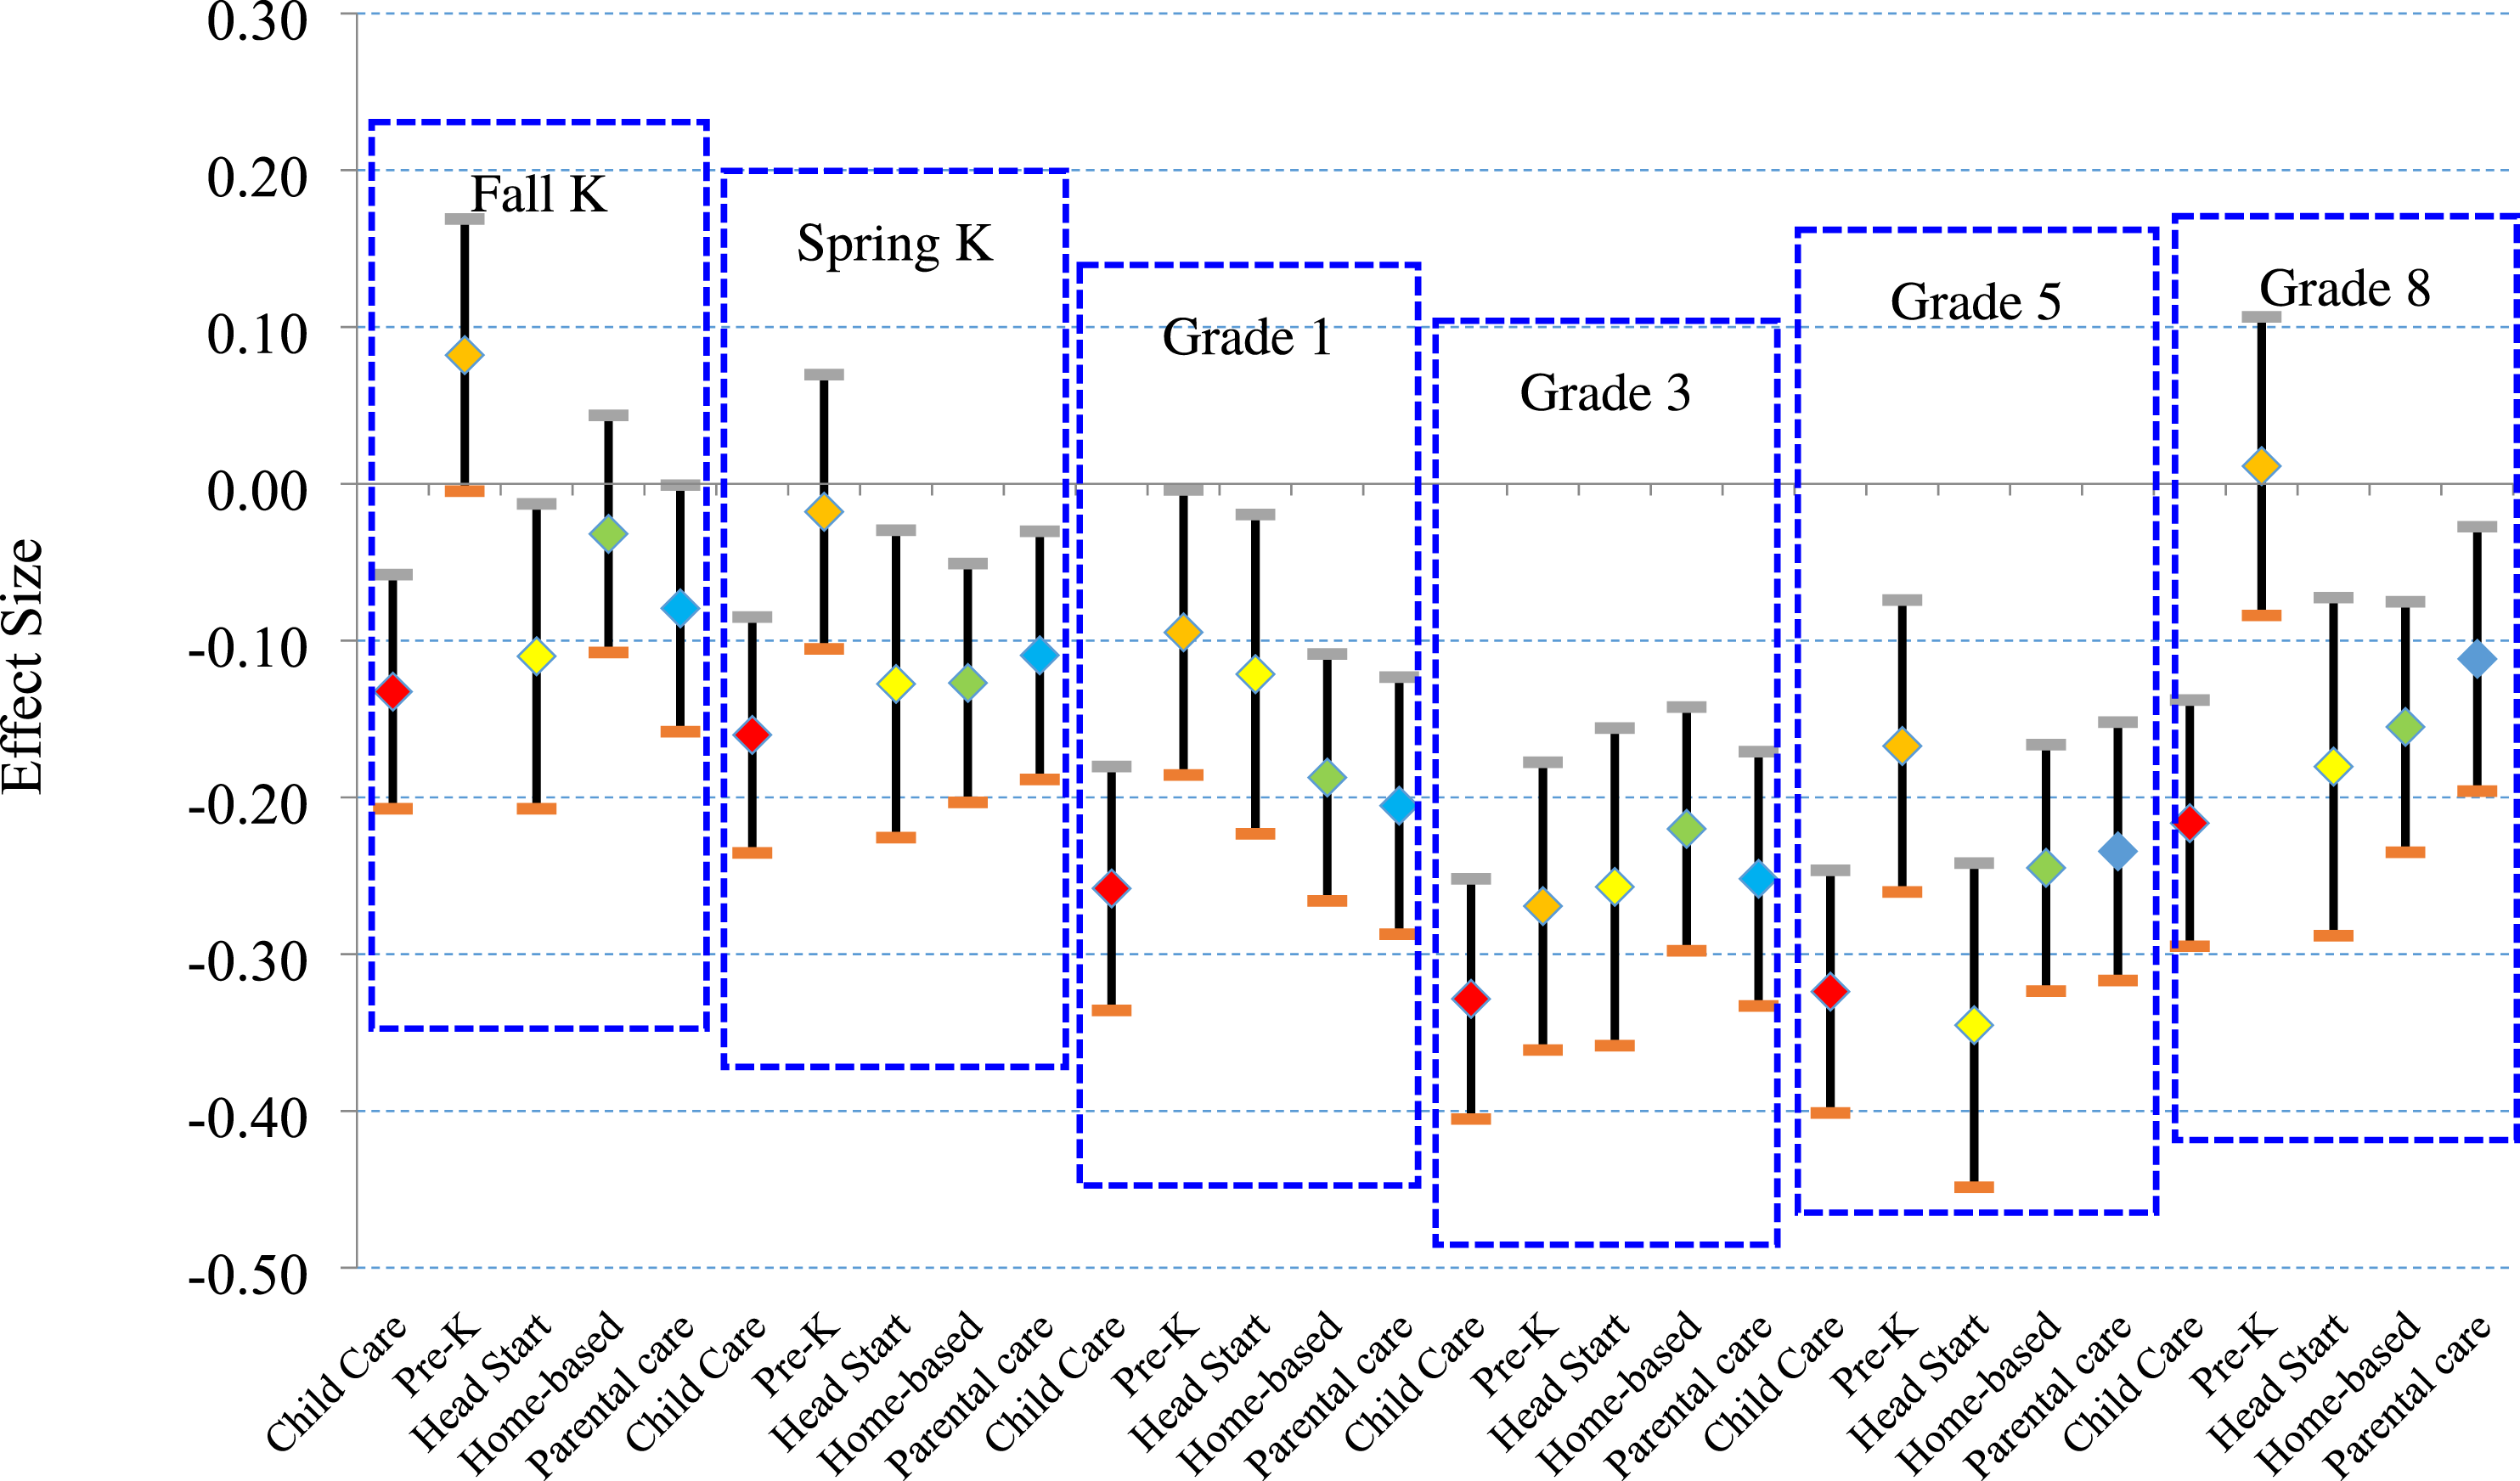
In summary, girls–boys math achievement gaps were smaller in Pre-K than the other ECCE at Fall Kindergarten, Spring Kindergarten, and Spring Grade 8, indicated by statistically insignificant girls–boys math achievement gaps for children at Pre-K. Significant girls–boys math achievement gaps existed in almost all the other ECCE at all six time points. In terms of reading achievement, gender effects were in the opposite direction: Girls displayed stronger skills than boys. In the fall of kindergarten, girls who had attended Pre-K, Head Start, or Home-based programs had stronger reading skills than boys. However, having attended the Child Care or being cared for by parents (Parental Care) was associated with smaller gender gap in reading. By the spring of kindergarten, girls who had experienced any type of ECCE outperformed boys at reading skills, but again there was no gender gap between boys and girls who had experienced Parental Care. Similar results were found in 1st Grade. By 3rd Grade boys and girls who had attended Pre-K had equivalent reading skills (no gender gap). In 5th Grade, girls who had attended Pre-K, Head Start, or Home-based care settings had stronger reading skills than boys, and in 8th Grade girls outperformed boys at reading regardless of their ECCE experience.
These results indicate that prior ECCE experiences were unable to overcome achievement gaps between girls and boys. At some grades gender effects were neutralized for those children who had attended Pre-K, meaning that for this group of children there were not gaps between boys and girls. Nevertheless, overall boys were stronger in math across almost all the ECCE from K to Grade 8 and girls were stronger in reading across all the ECCE experiences from elementary school to middle school. Furthermore, these gender gaps were widest in middle childhood (3rd and 5th Grades). Our findings on the gender achievement gaps across ECCE experiences in general were consistent with those found by Robinson and Lubienski (2011), who used the same dataset to estimate the gender achievement gaps for the overall sample without distinguishing ECCE experiences.
Latinx versus White. Table 3 and Figures 3 and S5 present the Latinx-White math and reading achievement gaps among ECCE by grade using IPTW. In terms of math achievement, Whites had higher achievement scores than Latinxs from all ECCE experiences except for Head Start, and this was true in the fall and spring of kindergarten and first Grade. These null results for Head Start indicate that Head Start was effective at eliminating achievement gaps at those grades. In 3rd Grade Whites had higher math achievement regardless of the ECCE experience. In 5th Grade, Whites had better math skills across all ECCE experiences except for Home-based. In 8th Grade, those Whites who had Pre-K, Home-based, or Parental experiences had better math achievement; however, there were no Latinx-White differences for children who had attended Child Care or Head Start, which indicates these programs were able to eliminate the gap. Latinx (1) versus White (0) math achievement gaps (effect sizes) and 95% confidence intervals by ECCE and grade from propensity score weighted analysis.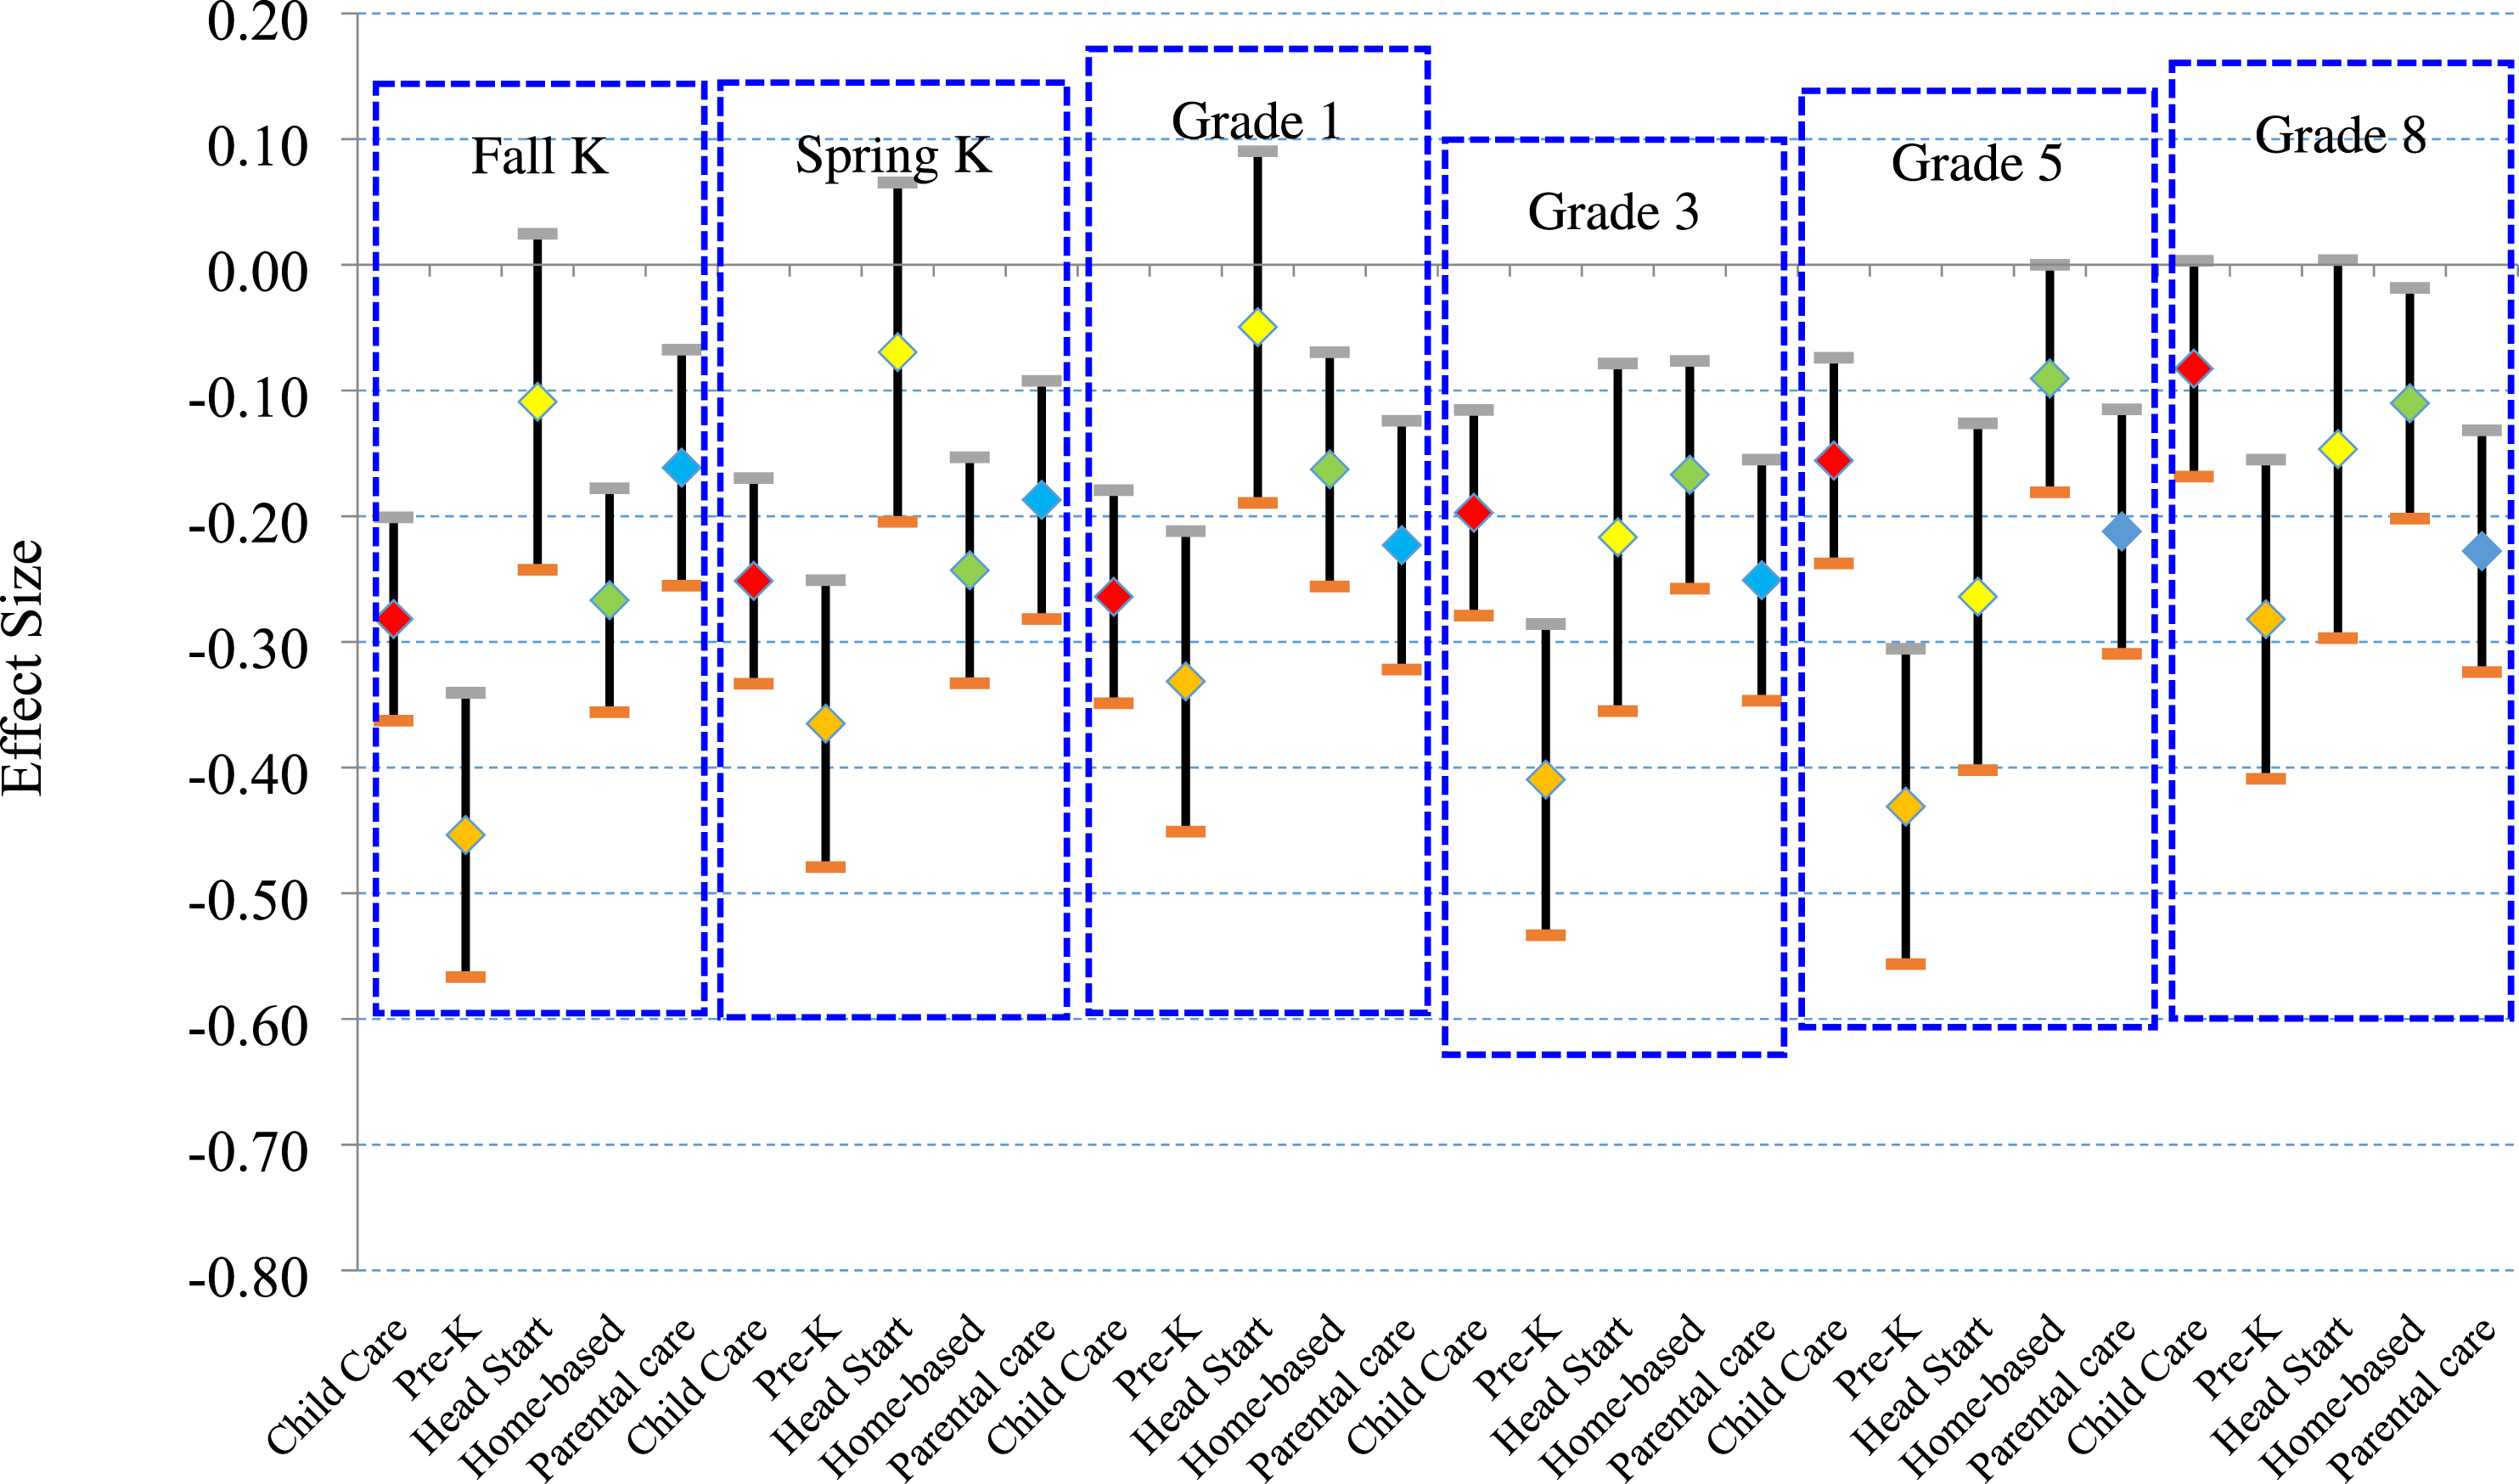
In terms of reading, the results follow the same pattern. Whites who had experienced any ECCE, except for Head Start, had higher reading skills at fall and spring of kindergarten. In 1st Grade, Whites had higher achievement than Latinx if they experienced any ECCE experience except for Head Start or Parental care. In 3rd and 5th grade, there were null effects for Pre-K and Head Start, indicating that these two programs eliminated the Latinx versus White gap at these grades; however, for children from any other ECCE group Whites had higher scores. Finally, in 8th Grade, Whites from all ECCE groups outperformed Latinxs except for those who attended Child Care or Parental Care. The racial gaps across ECCE experiences we found were consistent with those found by Reardon and Galindo (2009), who used the same dataset to estimate the racial achievement gaps for the overall sample without distinguishing ECCE experiences.
Overall, Head Start had effects in reducing Latinx versus White math and reading achievement gaps the most consistently across grades as evidenced by the null results for the children who had attended Head Start. Besides, children who have attended Child Care had non-significant achievement gaps at some grades. Furthermore, the strengths of the gaps remained consistent across time depending on the ECCE experience; for instance, the widest gaps between Latinx and Whites was found for those children who had attended Pre-K and the width of the gap remained consistent across the grades.
Black versus White: Table 4 and Figures 4 and S6 present the Black versus White math and reading achievement gaps among ECCE experiences by grade using IPTW. In terms of math, White students had higher scores in math at all grades and across all the ECCE experiences. In terms of reading, during the fall of kindergarten the gap was closed between Blacks and Whites for those who had attended Child Care, Head Start, and Home-based; only Whites who had attended Pre-K or had been cared for at home by a parent (Parental care) outperformed Blacks. By the spring of kindergarten, there was no longer a gap between those who had attended Pre-K, but White children had stronger reading skills if they had attended Child Care, Head Start, Home-based, or Parental care. This changed, however, in the next grade: The gaps were closed in 1st grade between Black and White children who had attended Pre-K, Head Start, or Parental care. Yet, in first grade, White children who had experiences in Child Care and Home-based outperformed Blacks, but there was no significant achievement gap for those who had attended the other ECCE programs. By 3rd, 5th and 8th Grade, Whites outperformed Blacks regardless of the ECCE experience. Black (1) versus White (0) math achievement gaps (effect sizes) and 95% confidence intervals by ECCE and grade from propensity score weighted analysis.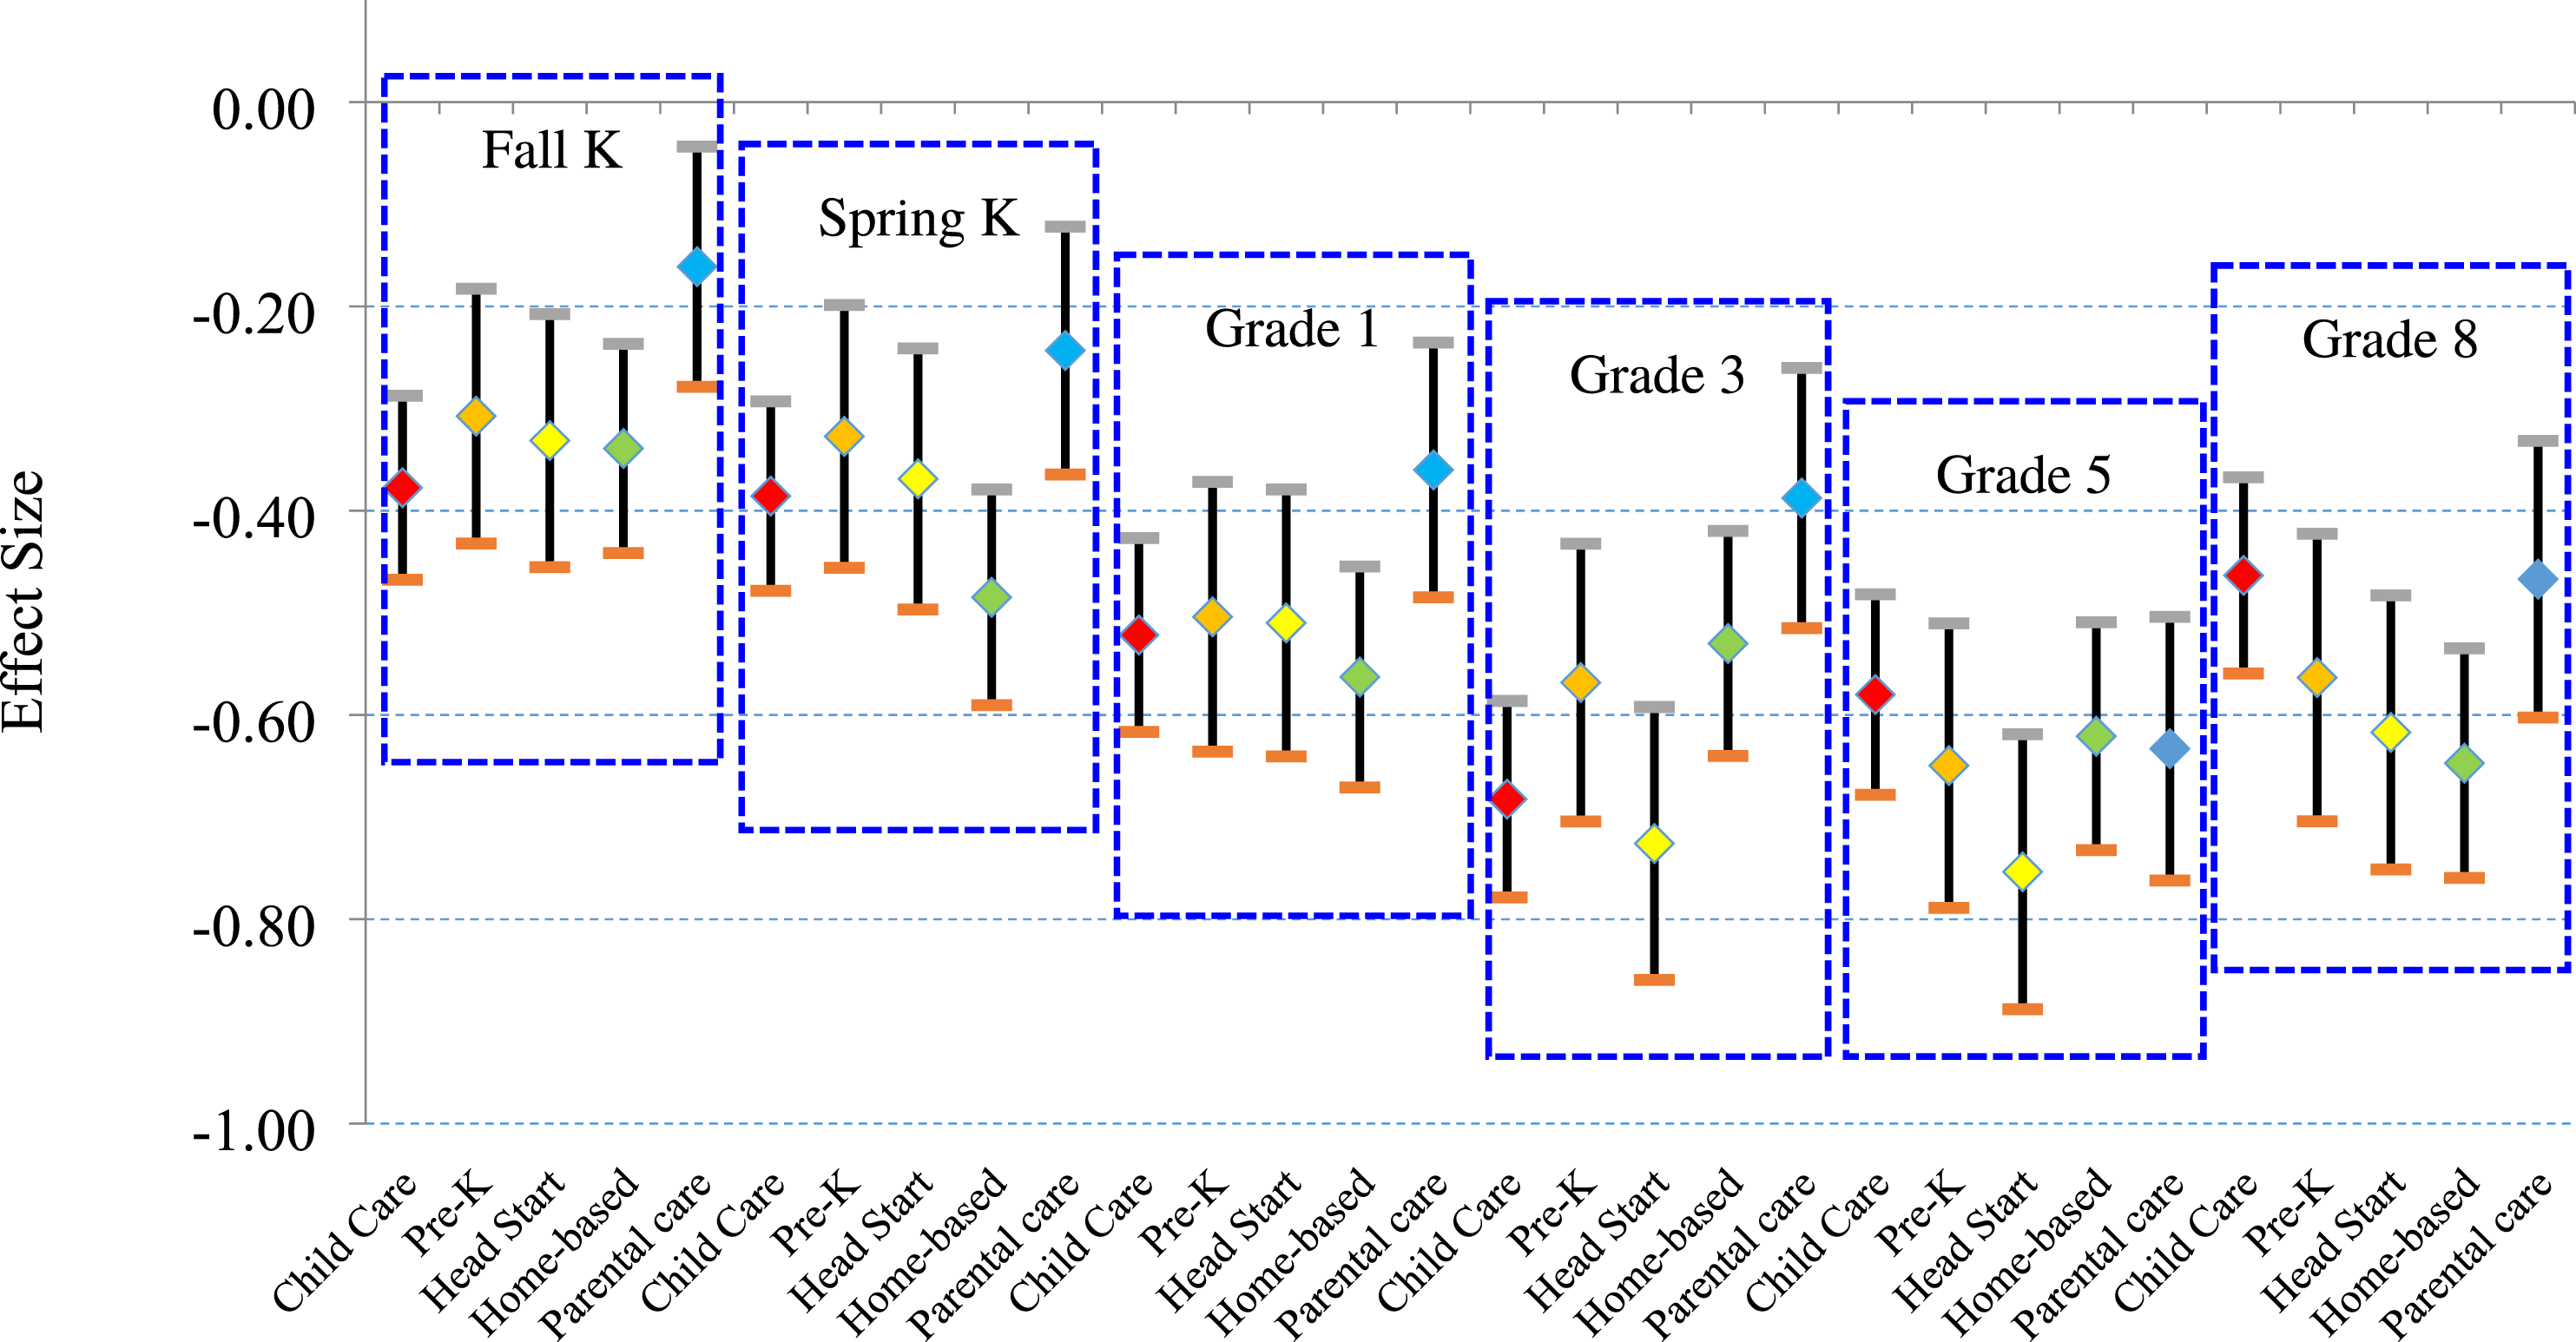
Overall, these results indicate significant and large Black versus White math achievement gaps in all ECCE experiences at all grade levels (i.e., six time points). On the other hand, there were null results indicating that for some ECCE experiences there were no Black versus White reading gaps in the early elementary grades, namely, for Pre-K at the spring of kindergarten and Pre-K, Head Start, and Parental Care at 1st grade. As with the prior results among the other groups, these achievement gaps widened (meaning the effect sizes increased) as children progressed through elementary school.
Discussion and Conclusions
We applied the causal moderation analysis framework in this study. The inverse probability of treatment weighting (IPTW) approach balanced covariates across the ECCE-by-moderator (race or gender) groups, which could reduce overt bias due to measured covariates. This novel statistical method can provide more rigorous evidence on which ECCE experience had better effects in reducing racial and gender achievement gaps from kindergarten to Grade 8. Overall, our findings reveal three areas of concern regarding the effects of ECCE on achievement gaps: (1) decreasing effects over time of all ECCEs, (2) the differing impact of ECCEs on math versus reading, and (3) the weak impact of all ECCEs for Black students.
While no single ECCE experience eliminated all achievement gaps, Head Start had the greatest success with a 33% success rate, predominantly due to their success with the Latinx subgroup. These results are in line with findings by Bassok (2010) that demonstrate the benefits of Head Start for Latinx children based on the ECLS-B data. At every time period in reading, and four out of six of the time periods in math, Latinx students who attended Head Start did not have a significant difference in achievement gap compared to White students. While the reasons for this is unclear, as the Latinx population continues to grow across the United States, the results from Head Start provide a positive outlook.
Both short-term (Grades K to 1st) and long-term (Grades 3rd to 8th) differential effects of ECCE experiences demonstrated some success in reducing math and reading achievement gaps for various subgroups, although the success appears to decrease over time. In the Fall of kindergarten, 30% of the ECCEs were successful at eliminating the achievement gap across all subgroups, the largest percentage at any time point. By 8th grade the success rate had dropped to 17%. While the increase of time increases the probability of additional factors affecting educational outcomes it does lead us to ask the question: What is happening to those students that previously had eliminated the achievement gap in kindergarten but were now behind by eighth grade? Due to their success in eliminating the achievement gap in reading for the Latinx subgroup, Head Start was the only experience to have effects in eliminating the achievement gap for at least one subgroup at each age level.
Comparing the impact of ECCEs on eliminating the achievement gap in math versus reading shows a stark contrast. Including all time periods ECCEs only had effects in eliminating the math achievement gap 12% of the time compared to 30% for reading. For the Fall-kindergarten period, Pre-K was the only ECCE unable to reduce the achievement gap in reading for any subgroup; however, it did have effects in eliminating the gap for one subgroup in the spring of kindergarten. In math, although all experiences had effects in eliminating the achievement gap at least once Head Start, and Pre-K were the most successful indicating the possibility that children are receiving more math instruction at center-based programs than those staying at home. While dependent on the ability and availability of parents/guardians, this potentially may be the result of reading books to children being deemed a part of life at home whereas teaching math is seen as a school’s domain. In addition, Head Start and parental care were equally the most effective at eliminating the reading achievement gap further indicating the ability of parents to provide quality reading instruction at home.
Unfortunately, not a single ECCE at any time point had effects in eliminating the achievement gap in math between Black versus White students. While individually Black students’ performance may have matched, or even exceeded some White students’, the results reflect that the average achievement gap in math remained in each circumstance. Additionally, it would be remiss to not consider whether environmental factors, such as housing or school segregation differences, between Black versus White students would be associated with the differantial outcomes because Blacks experience higher levels of residential and educational segregation than any other racial-ethnic group, even when they are from the same socioeconomic status (Lareau & Goyette, 2014). Comparing the reading score for Black and White students, each ECCE experience had at least one success in the early grades. From 3rd grade onwards, unfortunately, the achievement gap reaffirmed itself, suggesting that while some ECCE experiences had a positive impact at the start of kindergarten, the benefits later dissipated. Future research examining the achievement gap for Black children may want to examine how external environmental structures, such as socioeconomic disadvantage or residential or school segregation, might potentially be an influence in determining achievement for Black students over time.
Limitations
There are a few limitations of this work that require one to interpret the results cautiously. First, a wide range of covariates were included in the propensity score analysis, and these covariates spanned family level demographic characteristics even to larger geographic locations such as geographic region and urbanicity (rural, town). However, no covariates related to neighborhood were included in the propensity score analyses. Research has shown that neighborhood quality is a stronger factor for explaining Black children’s achievement than is family level factors (Iruka et al., 2015). Hence, this study is subject to the hidden bias due to omitted variables that violate the assumptions of the propensity score methods (Rosenbaum & Rubin, 1983). Although we found that using propensity scores reduced imbalance on the observables, it is hard to claim that the reduction can be extended to unobserved variables such as neighborhood characteristics. The imbalance for unobserved variables may be increased among moderator subgroups or ECCE experiences which result in bias. Further studies that collect more covariates that are associated with the ECCE experiences, neighborhood quality, and policy relevant moderators are needed in this line of work.
Second, the ECLS-K 1998-99 data are very useful to examine the achievement gap trajectories for children from 1998–99 to 2006–07, it would be very informative to examine the more recent achievement gap trajectories. One direction of future research is to apply the propensity score methods used in this paper to analyze the ECLS-K 2010-11 data to report the recent achievement gaps by ECCE over time.
Policy Implications
The question for policy makers of which ECCE experience should be promoted typically revolves around cost versus benefit. We want the most cost-effective ECCE with the best student outcomes. Just using this study, the question unfortunately remains unclear. Aside from having no effects in eliminating the Black–White math achievement gap, each ECCE option has shown the potential to have a positive impact on a specific subgroup. Should policy makers focus on providing choice to all people or should there be a focus on one form of ECCE requiring further research on how all sub-population of student can benefit.
Answering the question of which ECCE experience works best for whom, the results of the study suggest girls benefit most from Pre-K, boys from parental care, Latinx students from Head Start and Black students from Pre-K or Head Start. From a policy perspective it reminds policy makers that a one-size fits all approach to ECCE would not be cost-effective. Rather than promoting a single program it may be more useful to allow families to make the choice, potentially in the form of vouchers, free enrollment, or tax breaks. In addition, choice is limited by availability, therefore while it may be unrealistic to provide every option to every family in every location it may be possible to focus certain ECCE experiences in specific locations based on their effectiveness versus the demographics of a location.
The study can inform researchers and policy makers about short- and long-term differential effects of ECCE experiences in reducing racial and gender math and reading achievement gaps. If the focus is on the preparation of children for kindergarten, then at least one potential solution/ECCE for eliminating the gap in reading or math at the start of kindergarten is available to each student subset. Unfortunately, none of the ECCE experience were able to sustain the elimination of a gap through eighth grade. Additionally, most of ECCE experiences did not eliminate the difference in math or reading scores for the various subgroups. If the focus is on the long-term impact of ECCE exposure, then the outcome is bleak with gaps remaining at eighth grade in boys reading, and Black students' math and reading scores regardless of what ECCE experience a child received.
This work also has implications for education policy in that it raises questions about what are the societal and school factors that are driving achievement gaps, such as issues related to the “hidden curriculum” that so often plague minority children’s achievement and gender biases prevalent in society. The need to investigate these questions is best exemplified by the flip-flopped gender achievement findings for math versus reading. Boys outperformed girls in math at nearly all grade points, and the opposite was true for reading. Such findings beg the question of whether the societal stereotypes of “men (boys) being better at math” and “women (girls) having better language skills” are so prevalent that they are seeping into teacher’s instruction and classroom interactions. Another important education policy implication is our evidence showing that these ECCE experiences work less well for math achievement than they do for reading. Such findings make sense given that within the last 15 years, larger federal investments in early literacy have been made (e.g., Early Reading First) but no comparable efforts have been made for math. In the future, there needs to be more policy investments in curriculum and professional development for math in the early grades.
Footnotes
Declaration of Conflicting Interests
The author(s) declared no potential conflicts of interest with respect to the research, authorship, and/or publication of this article.
Funding
The author(s) disclosed receipt of the following financial support for the research, authorship, and/or publication of this article: This project has been funded by the National Science Foundation [DRL- 1913563]. The opinions expressed herein are those of the authors and not the funding agency.
Notes
Appendix A: Conceptual Models
Counterfactual model—potential outcomes.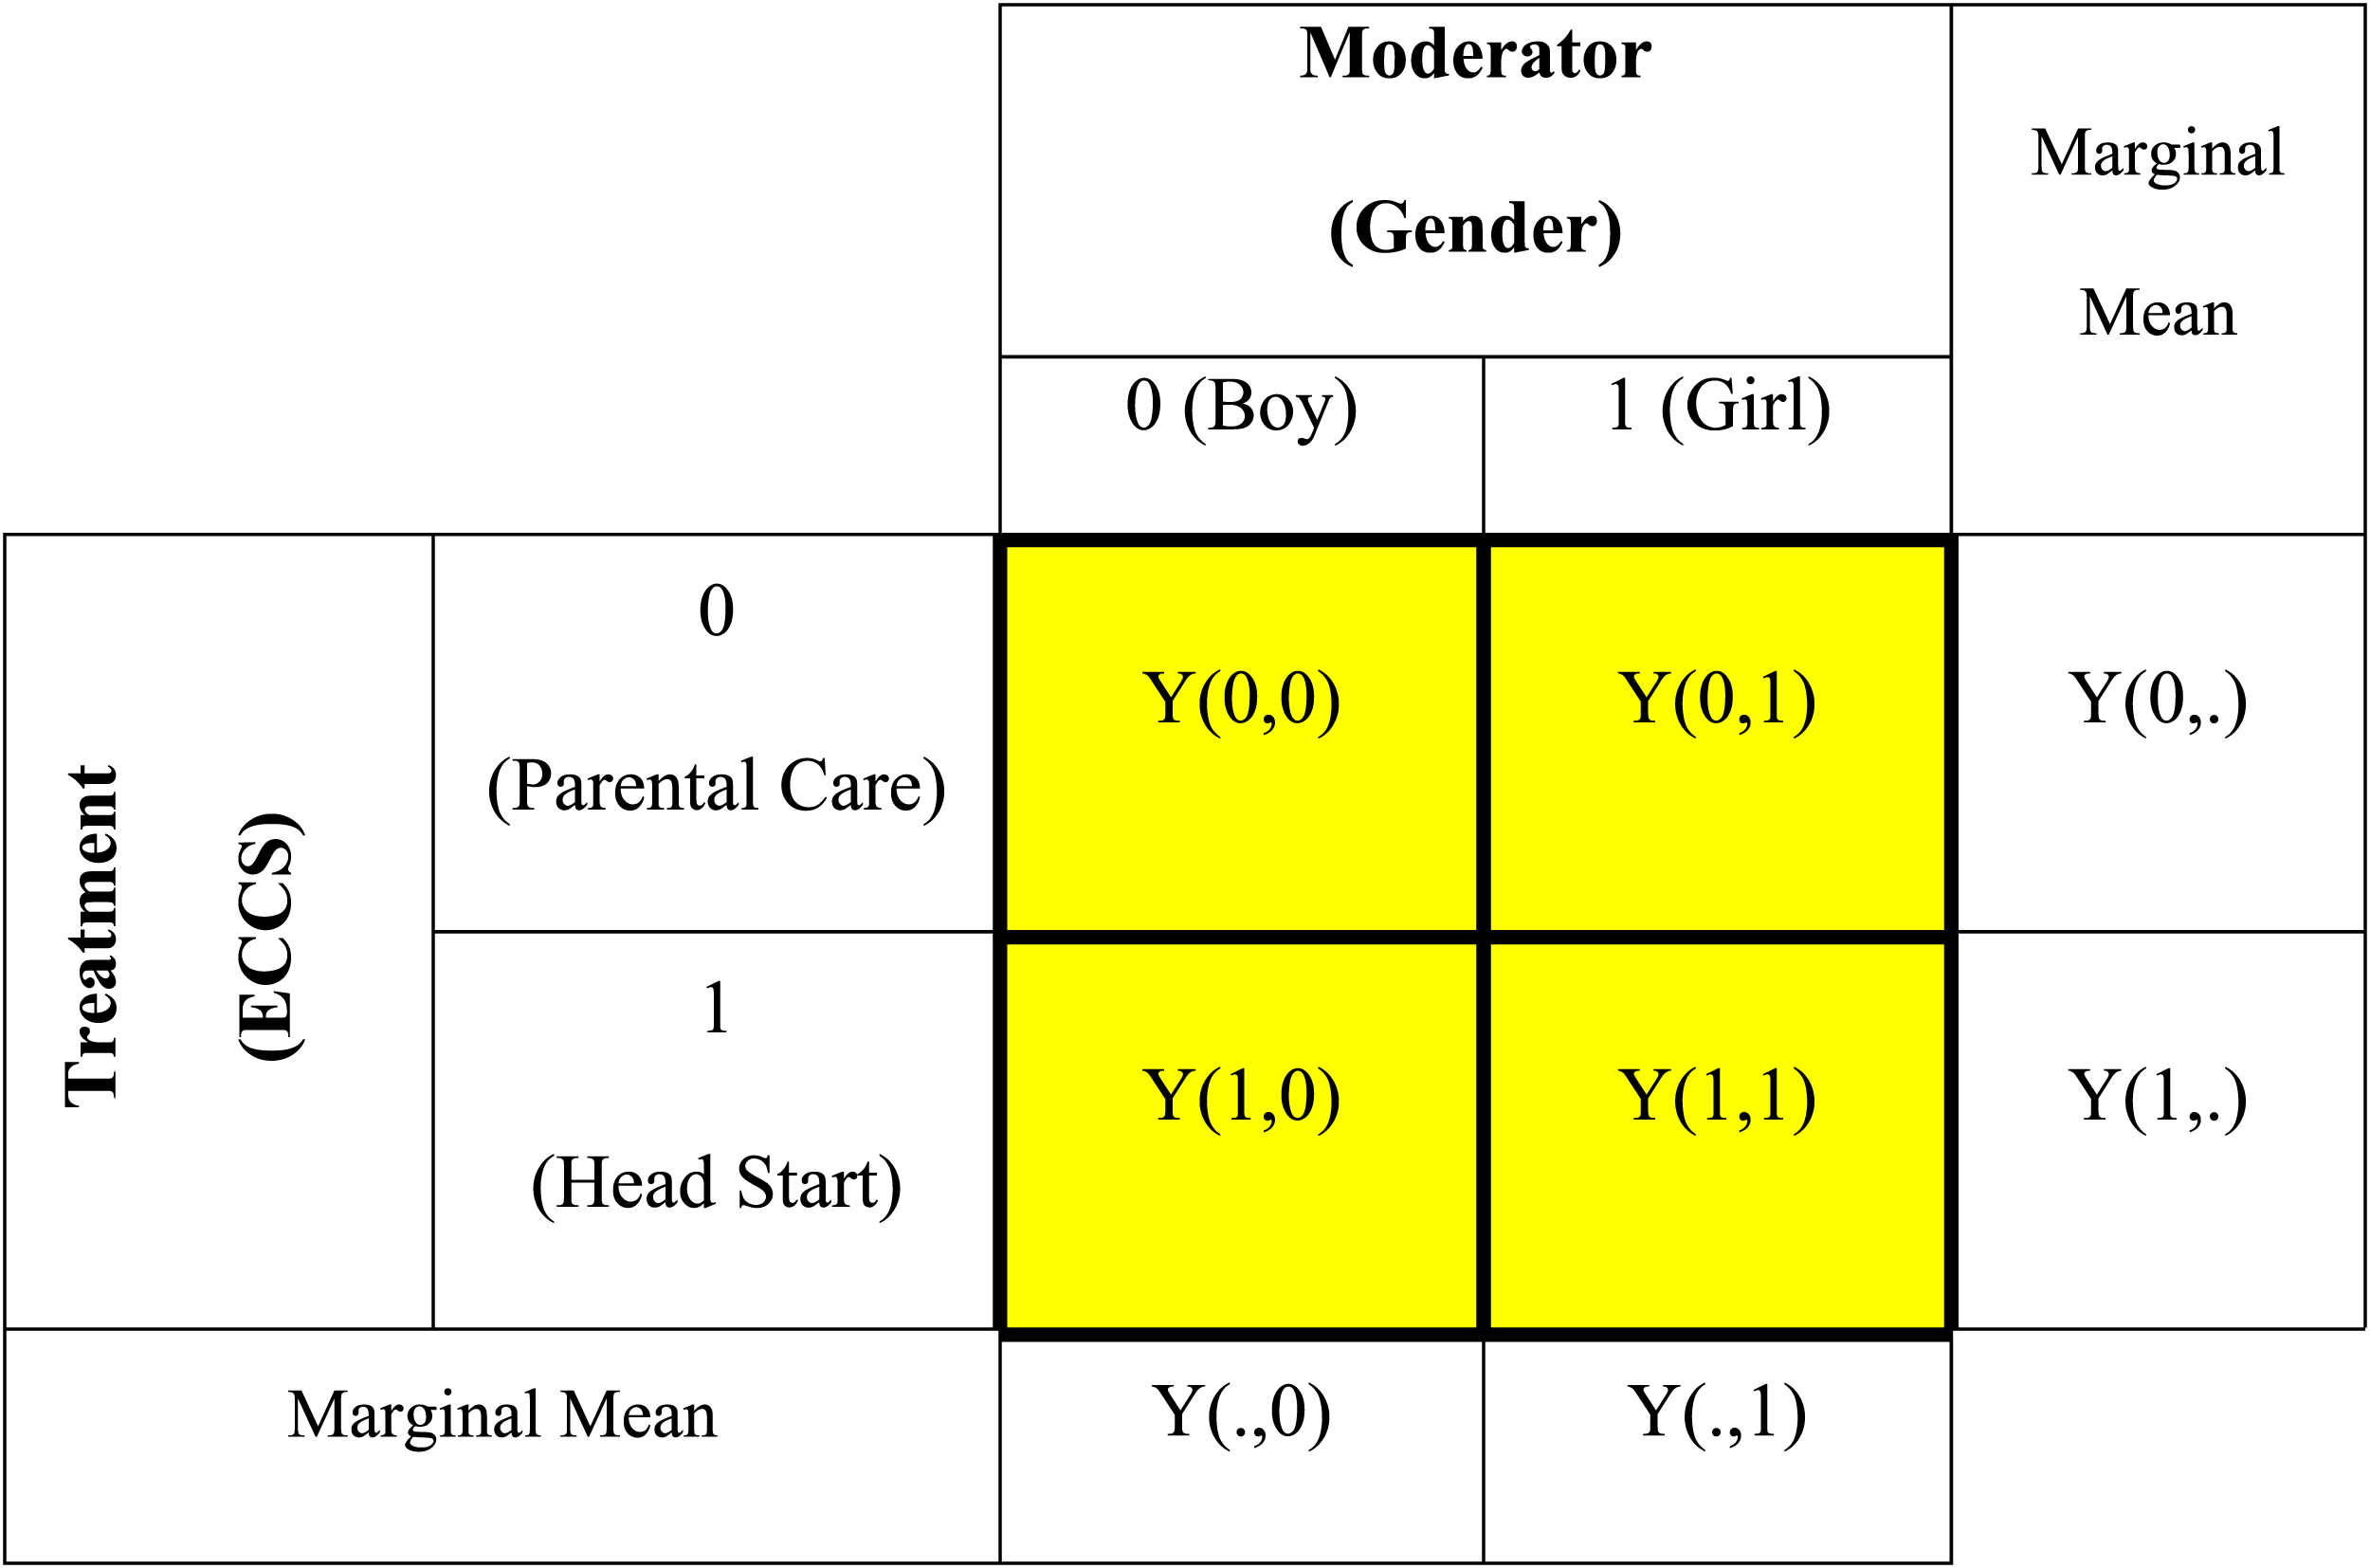
: Tables and Figures
Note. aEntries are the means and standard deviation (in parentheses).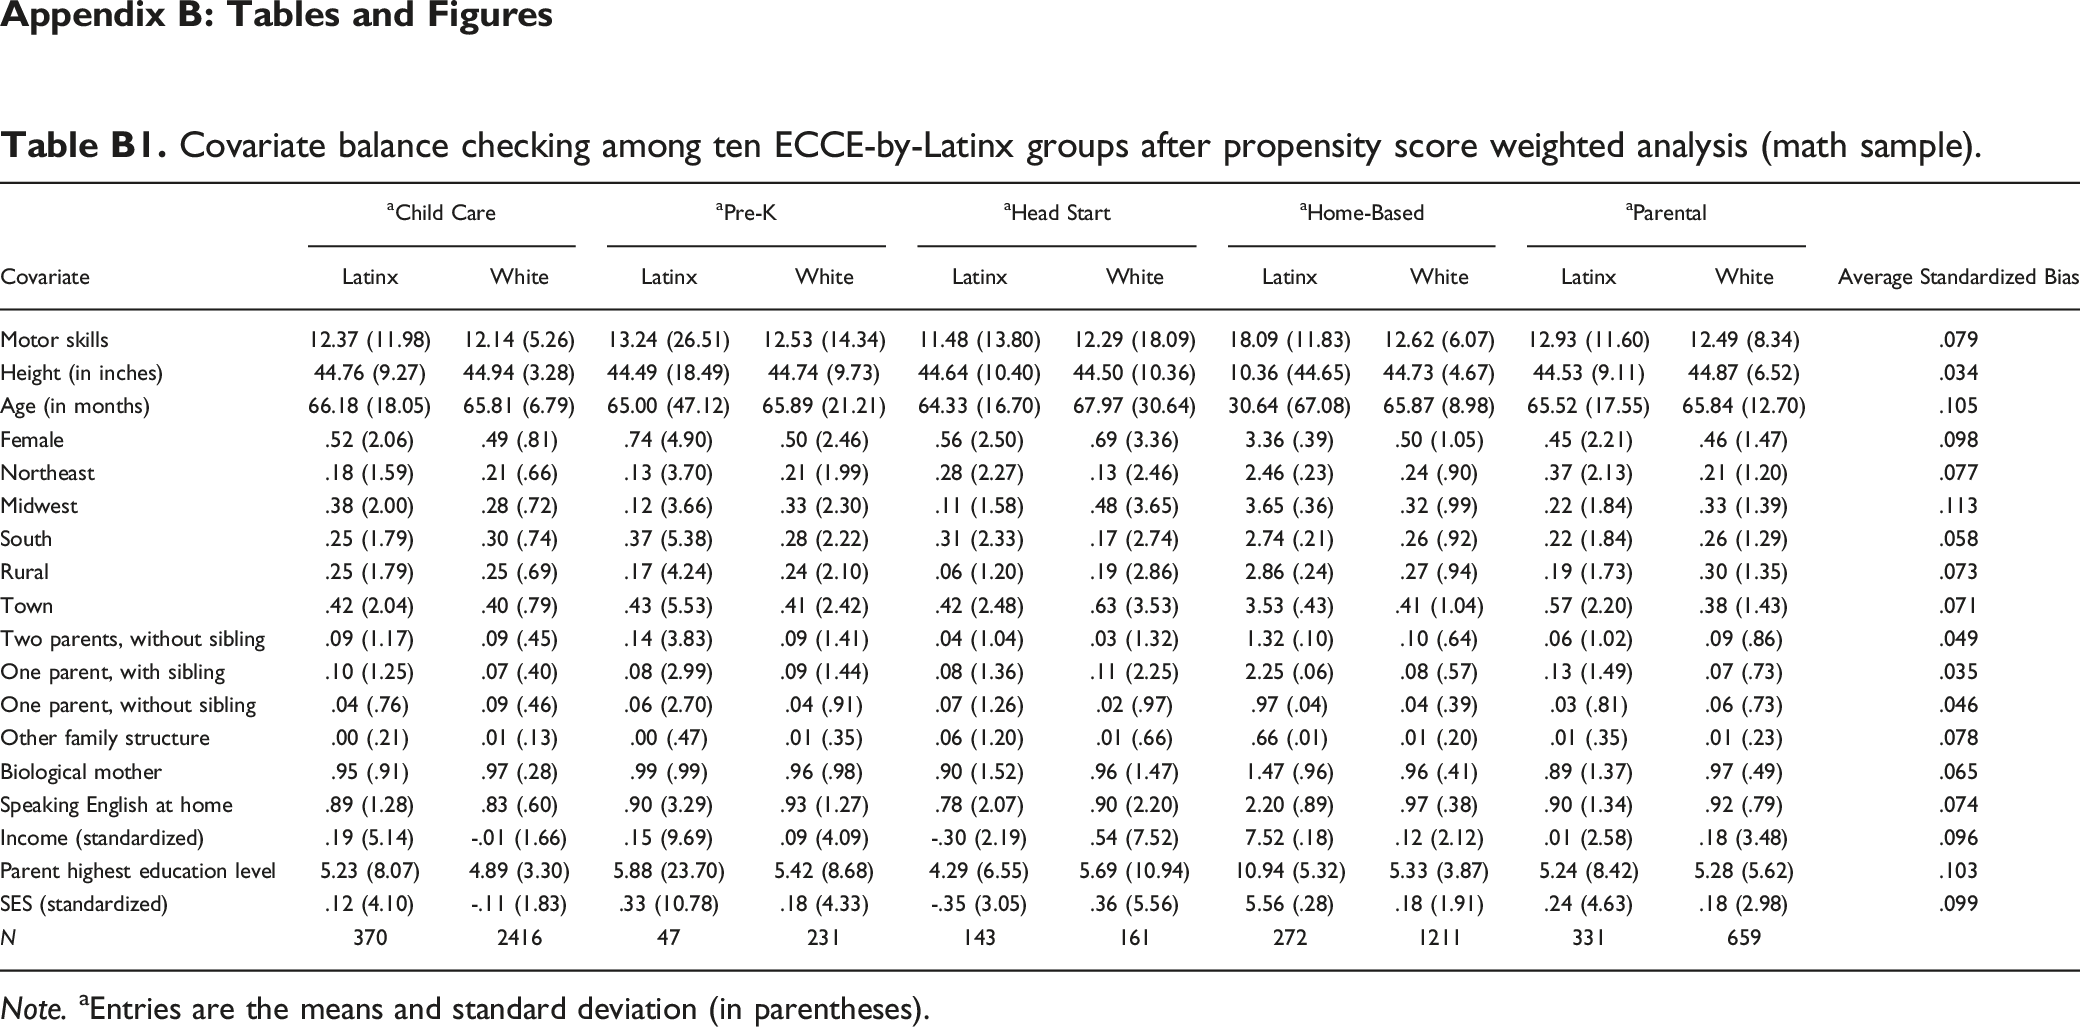
aChild Care
aPre-K
aHead Start
aHome-Based
aParental
Covariate
Latinx
White
Latinx
White
Latinx
White
Latinx
White
Latinx
White
Average Standardized Bias
Motor skills
12.37 (11.98)
12.14 (5.26)
13.24 (26.51)
12.53 (14.34)
11.48 (13.80)
12.29 (18.09)
18.09 (11.83)
12.62 (6.07)
12.93 (11.60)
12.49 (8.34)
.079
Height (in inches)
44.76 (9.27)
44.94 (3.28)
44.49 (18.49)
44.74 (9.73)
44.64 (10.40)
44.50 (10.36)
10.36 (44.65)
44.73 (4.67)
44.53 (9.11)
44.87 (6.52)
.034
Age (in months)
66.18 (18.05)
65.81 (6.79)
65.00 (47.12)
65.89 (21.21)
64.33 (16.70)
67.97 (30.64)
30.64 (67.08)
65.87 (8.98)
65.52 (17.55)
65.84 (12.70)
.105
Female
.52 (2.06)
.49 (.81)
.74 (4.90)
.50 (2.46)
.56 (2.50)
.69 (3.36)
3.36 (.39)
.50 (1.05)
.45 (2.21)
.46 (1.47)
.098
Northeast
.18 (1.59)
.21 (.66)
.13 (3.70)
.21 (1.99)
.28 (2.27)
.13 (2.46)
2.46 (.23)
.24 (.90)
.37 (2.13)
.21 (1.20)
.077
Midwest
.38 (2.00)
.28 (.72)
.12 (3.66)
.33 (2.30)
.11 (1.58)
.48 (3.65)
3.65 (.36)
.32 (.99)
.22 (1.84)
.33 (1.39)
.113
South
.25 (1.79)
.30 (.74)
.37 (5.38)
.28 (2.22)
.31 (2.33)
.17 (2.74)
2.74 (.21)
.26 (.92)
.22 (1.84)
.26 (1.29)
.058
Rural
.25 (1.79)
.25 (.69)
.17 (4.24)
.24 (2.10)
.06 (1.20)
.19 (2.86)
2.86 (.24)
.27 (.94)
.19 (1.73)
.30 (1.35)
.073
Town
.42 (2.04)
.40 (.79)
.43 (5.53)
.41 (2.42)
.42 (2.48)
.63 (3.53)
3.53 (.43)
.41 (1.04)
.57 (2.20)
.38 (1.43)
.071
Two parents, without sibling
.09 (1.17)
.09 (.45)
.14 (3.83)
.09 (1.41)
.04 (1.04)
.03 (1.32)
1.32 (.10)
.10 (.64)
.06 (1.02)
.09 (.86)
.049
One parent, with sibling
.10 (1.25)
.07 (.40)
.08 (2.99)
.09 (1.44)
.08 (1.36)
.11 (2.25)
2.25 (.06)
.08 (.57)
.13 (1.49)
.07 (.73)
.035
One parent, without sibling
.04 (.76)
.09 (.46)
.06 (2.70)
.04 (.91)
.07 (1.26)
.02 (.97)
.97 (.04)
.04 (.39)
.03 (.81)
.06 (.73)
.046
Other family structure
.00 (.21)
.01 (.13)
.00 (.47)
.01 (.35)
.06 (1.20)
.01 (.66)
.66 (.01)
.01 (.20)
.01 (.35)
.01 (.23)
.078
Biological mother
.95 (.91)
.97 (.28)
.99 (.99)
.96 (.98)
.90 (1.52)
.96 (1.47)
1.47 (.96)
.96 (.41)
.89 (1.37)
.97 (.49)
.065
Speaking English at home
.89 (1.28)
.83 (.60)
.90 (3.29)
.93 (1.27)
.78 (2.07)
.90 (2.20)
2.20 (.89)
.97 (.38)
.90 (1.34)
.92 (.79)
.074
Income (standardized)
.19 (5.14)
-.01 (1.66)
.15 (9.69)
.09 (4.09)
-.30 (2.19)
.54 (7.52)
7.52 (.18)
.12 (2.12)
.01 (2.58)
.18 (3.48)
.096
Parent highest education level
5.23 (8.07)
4.89 (3.30)
5.88 (23.70)
5.42 (8.68)
4.29 (6.55)
5.69 (10.94)
10.94 (5.32)
5.33 (3.87)
5.24 (8.42)
5.28 (5.62)
.103
SES (standardized)
.12 (4.10)
-.11 (1.83)
.33 (10.78)
.18 (4.33)
-.35 (3.05)
.36 (5.56)
5.56 (.28)
.18 (1.91)
.24 (4.63)
.18 (2.98)
.099
N
370
2416
47
231
143
161
272
1211
331
659
Covariate balance checking on the average standardized bias among 10 ECCE-by-Latinx/White groups before and after propensity score weighting.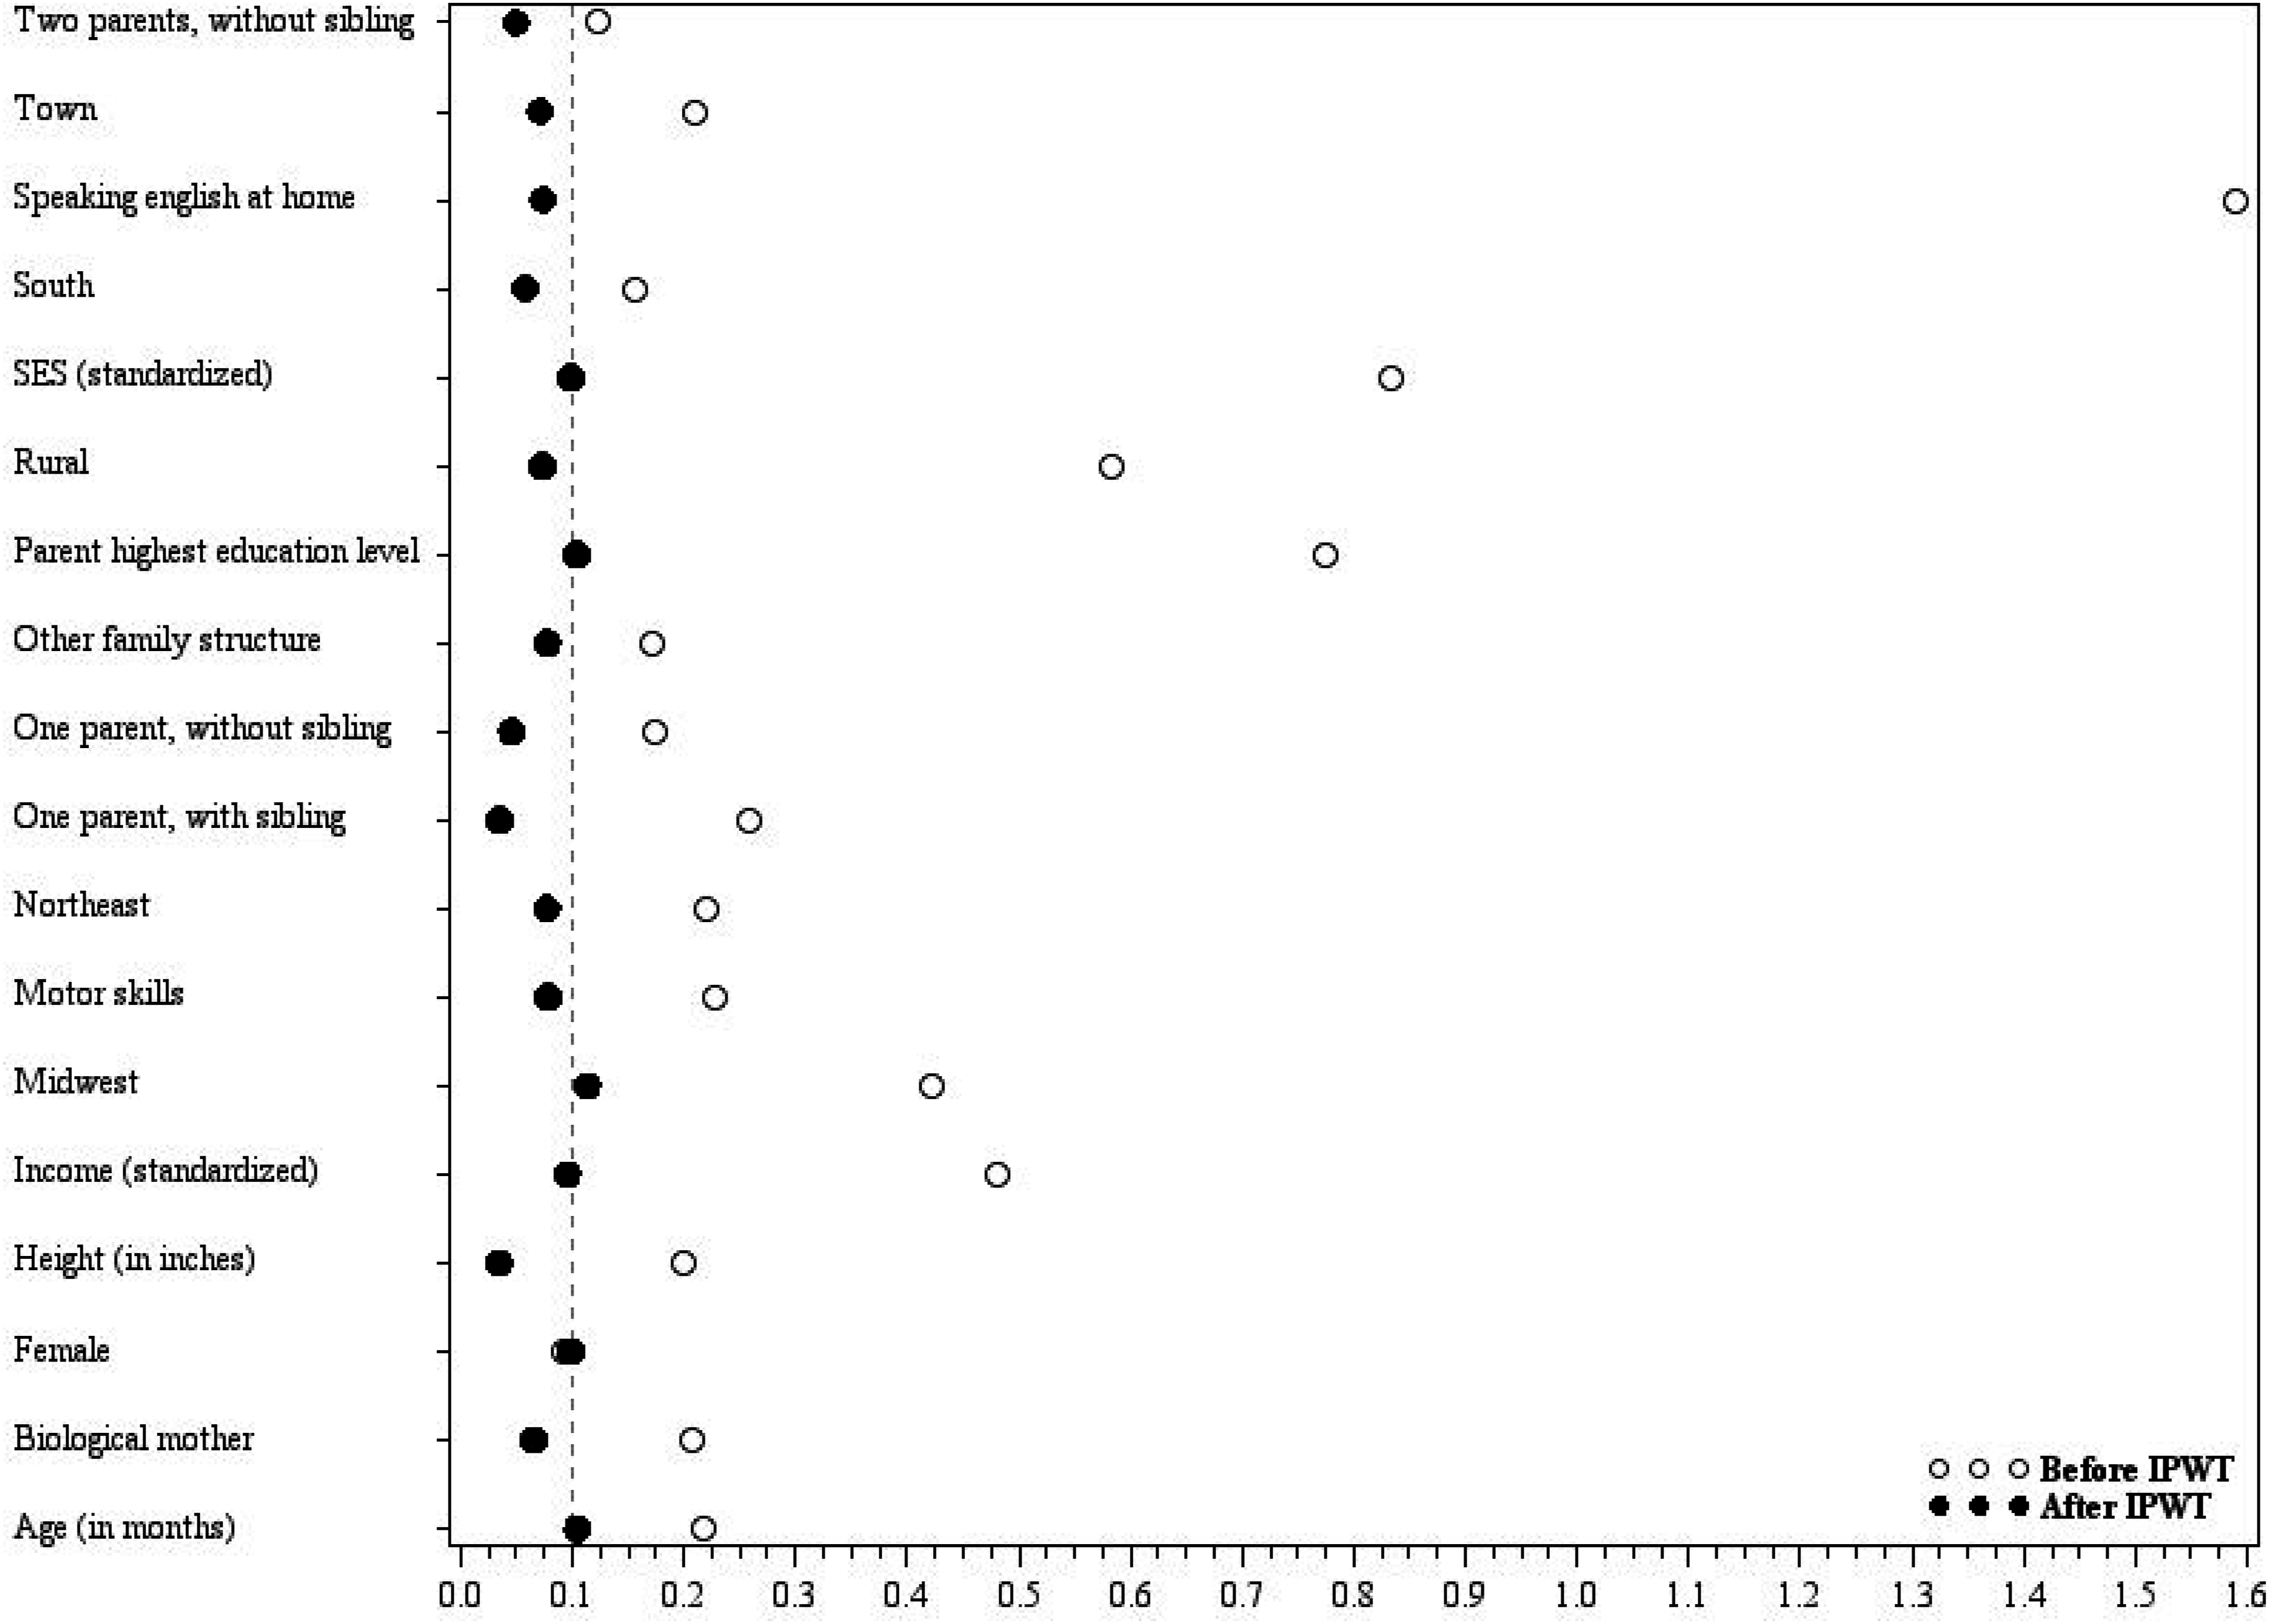
Covariate balance checking on the average standardized bias among 10 ECCE-by-Black/White groups before and after propensity score weighting.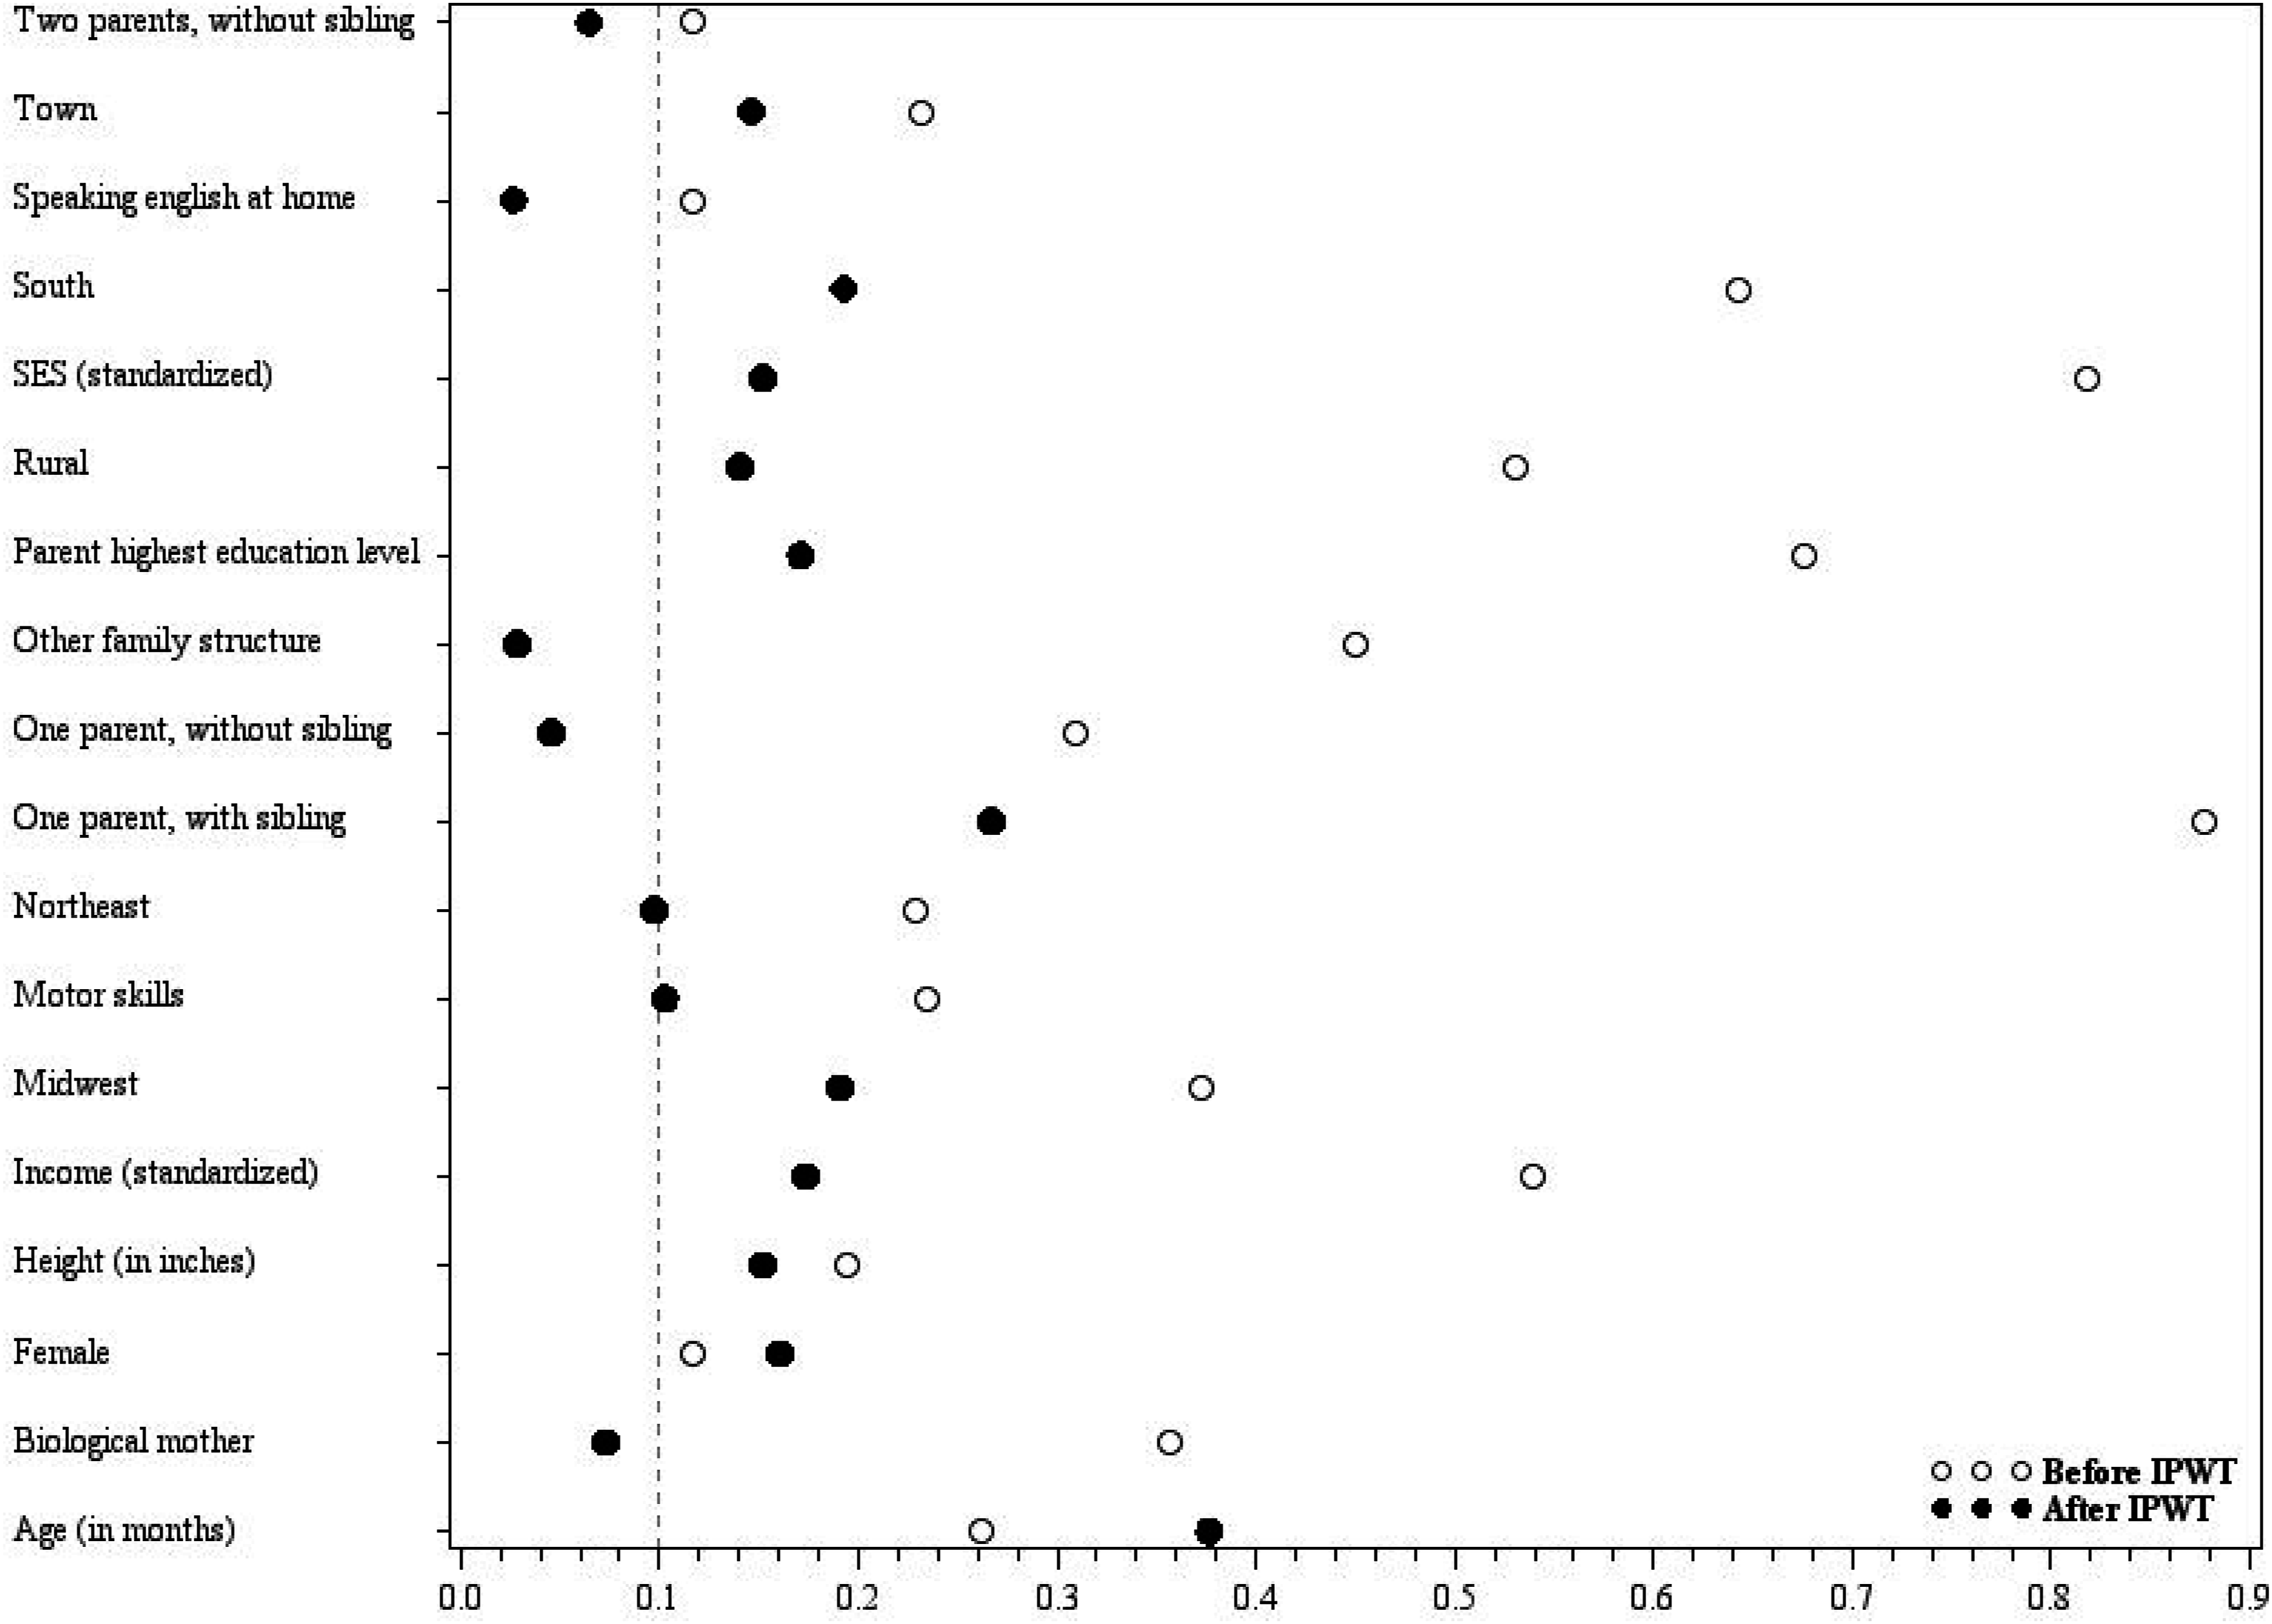
Covariate balance checking among ten ECCE-by-Black groups after propensity score weighted analysis (math sample). Note. aEntries are the means and standard deviation (in parentheses).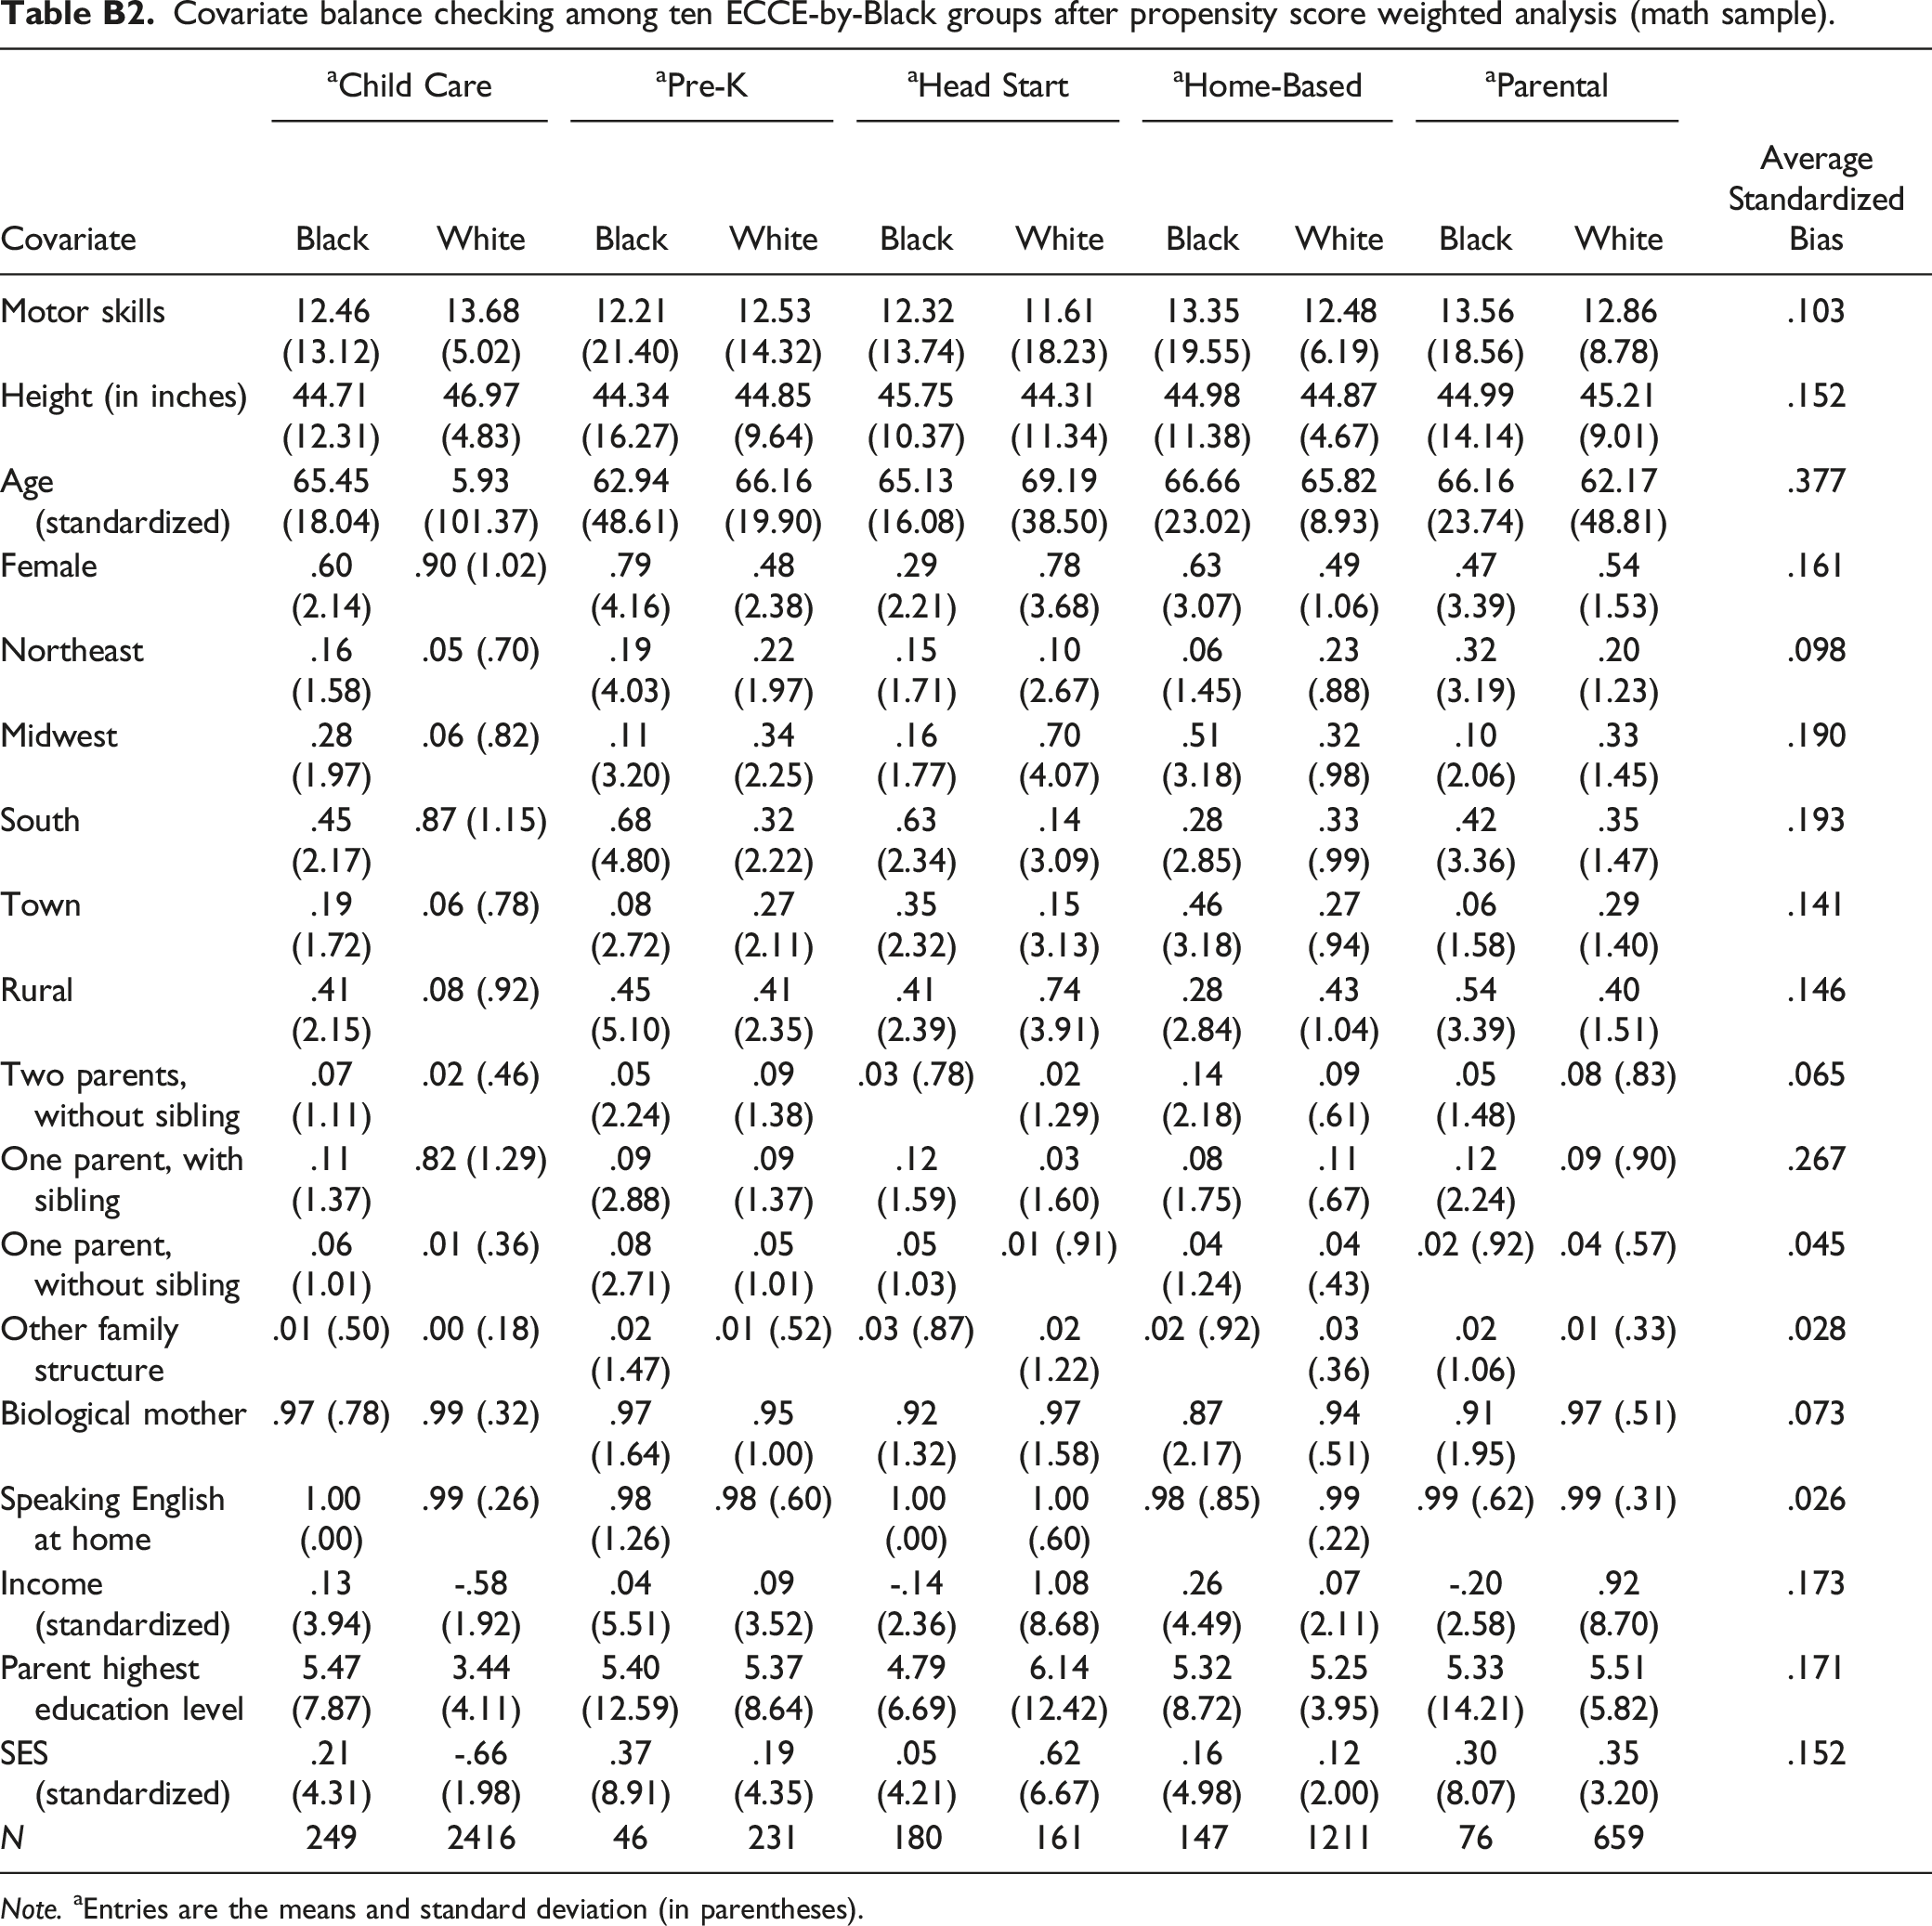
aChild Care
aPre-K
aHead Start
aHome-Based
aParental
Covariate
Black
White
Black
White
Black
White
Black
White
Black
White
Average Standardized Bias
Motor skills
12.46 (13.12)
13.68 (5.02)
12.21 (21.40)
12.53 (14.32)
12.32 (13.74)
11.61 (18.23)
13.35 (19.55)
12.48 (6.19)
13.56 (18.56)
12.86 (8.78)
.103
Height (in inches)
44.71 (12.31)
46.97 (4.83)
44.34 (16.27)
44.85 (9.64)
45.75 (10.37)
44.31 (11.34)
44.98 (11.38)
44.87 (4.67)
44.99 (14.14)
45.21 (9.01)
.152
Age (standardized)
65.45 (18.04)
5.93 (101.37)
62.94 (48.61)
66.16 (19.90)
65.13 (16.08)
69.19 (38.50)
66.66 (23.02)
65.82 (8.93)
66.16 (23.74)
62.17 (48.81)
.377
Female
.60 (2.14)
.90 (1.02)
.79 (4.16)
.48 (2.38)
.29 (2.21)
.78 (3.68)
.63 (3.07)
.49 (1.06)
.47 (3.39)
.54 (1.53)
.161
Northeast
.16 (1.58)
.05 (.70)
.19 (4.03)
.22 (1.97)
.15 (1.71)
.10 (2.67)
.06 (1.45)
.23 (.88)
.32 (3.19)
.20 (1.23)
.098
Midwest
.28 (1.97)
.06 (.82)
.11 (3.20)
.34 (2.25)
.16 (1.77)
.70 (4.07)
.51 (3.18)
.32 (.98)
.10 (2.06)
.33 (1.45)
.190
South
.45 (2.17)
.87 (1.15)
.68 (4.80)
.32 (2.22)
.63 (2.34)
.14 (3.09)
.28 (2.85)
.33 (.99)
.42 (3.36)
.35 (1.47)
.193
Town
.19 (1.72)
.06 (.78)
.08 (2.72)
.27 (2.11)
.35 (2.32)
.15 (3.13)
.46 (3.18)
.27 (.94)
.06 (1.58)
.29 (1.40)
.141
Rural
.41 (2.15)
.08 (.92)
.45 (5.10)
.41 (2.35)
.41 (2.39)
.74 (3.91)
.28 (2.84)
.43 (1.04)
.54 (3.39)
.40 (1.51)
.146
Two parents, without sibling
.07 (1.11)
.02 (.46)
.05 (2.24)
.09 (1.38)
.03 (.78)
.02 (1.29)
.14 (2.18)
.09 (.61)
.05 (1.48)
.08 (.83)
.065
One parent, with sibling
.11 (1.37)
.82 (1.29)
.09 (2.88)
.09 (1.37)
.12 (1.59)
.03 (1.60)
.08 (1.75)
.11 (.67)
.12 (2.24)
.09 (.90)
.267
One parent, without sibling
.06 (1.01)
.01 (.36)
.08 (2.71)
.05 (1.01)
.05 (1.03)
.01 (.91)
.04 (1.24)
.04 (.43)
.02 (.92)
.04 (.57)
.045
Other family structure
.01 (.50)
.00 (.18)
.02 (1.47)
.01 (.52)
.03 (.87)
.02 (1.22)
.02 (.92)
.03 (.36)
.02 (1.06)
.01 (.33)
.028
Biological mother
.97 (.78)
.99 (.32)
.97 (1.64)
.95 (1.00)
.92 (1.32)
.97 (1.58)
.87 (2.17)
.94 (.51)
.91 (1.95)
.97 (.51)
.073
Speaking English at home
1.00 (.00)
.99 (.26)
.98 (1.26)
.98 (.60)
1.00 (.00)
1.00 (.60)
.98 (.85)
.99 (.22)
.99 (.62)
.99 (.31)
.026
Income (standardized)
.13 (3.94)
-.58 (1.92)
.04 (5.51)
.09 (3.52)
-.14 (2.36)
1.08 (8.68)
.26 (4.49)
.07 (2.11)
-.20 (2.58)
.92 (8.70)
.173
Parent highest education level
5.47 (7.87)
3.44 (4.11)
5.40 (12.59)
5.37 (8.64)
4.79 (6.69)
6.14 (12.42)
5.32 (8.72)
5.25 (3.95)
5.33 (14.21)
5.51 (5.82)
.171
SES (standardized)
.21 (4.31)
-.66 (1.98)
.37 (8.91)
.19 (4.35)
.05 (4.21)
.62 (6.67)
.16 (4.98)
.12 (2.00)
.30 (8.07)
.35 (3.20)
.152
N
249
2416
46
231
180
161
147
1211
76
659