
Abstract
Oral epithelial dysplasia (OED) is characterized by abnormal structural and cellular changes in the oral mucosa epithelium. These changes are often detected histologically in potentially malignant disorders and are associated with an increased risk of malignant transformation into oral squamous cell carcinoma (OSCC). Currently, clinicians rely mainly on the pathologist’s histological gradings (binary or tertiary grading systems) to determine the follow-up protocol for patients with OED. However, both histological gradings are rather subjective and not highly reliable. Therefore, there is a need for biomarkers to distinguish high-risk OED cases from low-risk cases. Twelve oral tongue dysplasia samples were collected for multiplex immunostaining. The samples were derived from 7 patients who did not develop OSCC within 5 y of their OED diagnosis (low-risk group, LR) and 5 patients who developed OSCC (high-risk group, HR). Ten antibodies targeting epithelial cells, immune cells, a proliferation marker, and immune checkpoints were used (PanCK, CD4, CD8, CD11b, CD68, CD56, FoxP3, Ki67, PD-1, PD-L1). Uniform manifold approximation and projection generated from multiplex staining revealed distinct differences in the distribution of immune cells and immune checkpoint expression between the LR and HR groups. The HR group showed a higher number of CD8+ cytotoxic T cells and CD68+ macrophages than the LR group. Notably, both PanCK+ epithelial cells and CD8+ cytotoxic T cells exhibited increased proliferation in the HR group, as indicated by Ki67 expression. Additionally, PD-1 expression was significantly elevated in the HR group. The logistics regression model further confirmed the predictive value of individual markers and identified a multimarker model with superior predictive performance. Our multiplex immunostaining revealed significant differences in the immune landscape between LR and HR cases of OED dysplasia. CD8+ cytotoxic T cells, CD68+ macrophages, and PD-1+ cells may serve as potential biomarkers for stratifying HR from LR oral tongue dysplasia cases.
Introduction
Oral epithelial dysplasia (OED) results from alterations at the cellular and structural levels and is often present in oral potentially malignant disorders (OPMDs). Within the oral cavity, OPMDs such as lichen planus, leukoplakia, and erythroplakia increase the risk of malignant transformation (Speight and Torres-Rendon 2011). As patients with oral squamous cell carcinoma (OSCC) benefit greatly from early intervention, frequent follow-up is essential for monitoring OPMDs.
OPMDs are relatively common, with a prevalence of 4.47%. It is most frequently observed in Asian populations and is least common in North America (Mello et al 2018). Despite the relatively high prevalence of OPMDs and OED, their cumulative malignant transformation rate is only 7.9% (Iocca et al 2020). This low rate makes it difficult to predict the long-term cancer risk of individual OEDs, leading to inefficient follow-up strategies.
To address this challenge, the World Health Organization (WHO) suggests grading OED as mild, moderate, or severe (WHO Classification of Tumours Editorial Board 2024). While this grading represents progress, it has limitations as a prognostic tool for malignant progression (Odell et al 2021). Recent meta-analyses indicated that a 2-tier grading (low grade and high grade) offers better intra- and interobserver agreement (Krishnan et al 2016; Gopinath et al 2025).
Although research on potential biomarkers for the malignant transformation of OED has advanced, the range of validated biomarkers remains limited. Several promising candidates have emerged, including p16 methylation, podoplanin, and EGFR (Turton et al 2024). While most studies have focused on dysplastic epithelial cells, the immune landscape of OED remains largely unexplored. Given the growing evidence that the immune system plays a crucial role in OSCC development and progression and could also be targeted for immunotherapies, the stromal microenvironment holds promise for identifying novel biomarkers for OED malignant transformation.
Despite the urgent need and recent advancements, no clinically approved biomarkers exist for predicting the malignant potential of OED. This study sought to identify novel biomarkers for malignant transformation of oral tongue dysplasia specimens using a multiplex staining assay based on the immune microenvironment, with the objective of laying the foundation for subsequent biomarker research focused specifically on the stromal components of OED.
Materials and Methods
Patient Cohorts
Twelve OED biopsy specimens from the lateral borders of oral/mobile tongues were acquired at Oulu University Hospital; the patients were subsequently followed for at least 5 y. Seven of these lesions did not progress to cancer during the follow-up period and were classified as low risk (LR) in this study. Five lesions progressed to OSCC and were classified as high risk (HR). All samples were collected from the mobile tongue to minimize site-related heterogeneity.
The dysplasia grades for these lesions were obtained from Oulu University Hospital records. According to hospital regulations, when dysplasia is detected, at least 2 pathologists evaluate the sample before assigning the dysplasia grade. The full clinical and pathological characteristics of the OED lesions are presented in Appendix Table 1. Three samples were graded as severe dysplasia, 2 as moderate, and 7 as mild. For analysis, the severe and moderate dysplasia samples were grouped as high grade (HG), and the mild dysplasia lesions were considered low grade (LG).
The study was approved by the Northern Ostrobothnia Hospital District Ethics Committee (101/2020 18.1.2021), Biopankki Borealis (BB_2022_6009), Finnish Medicines Agency Fimea (Dnro FIMEA/2020/007614), and Finnish Social and Health Data Permit Authority Findata (Dnro THL/1218/14.02.00/2021, 7.9.2022).
Multiplex Immunofluorescence Staining and Imaging
Formalin-fixed, paraffin-embedded samples were cut into 4-µm-thick sections, deparaffinized, and rehydrated. Heat-induced antigen retrieval was performed using a PT module (Epredia) in Tris-EDTA (pH 9) at 99°C for 20 min. Endogenous peroxidase activity was blocked by incubating the slides in 0.9% hydrogen peroxide (H2O2) in Tris-buffered saline (TBS) for 15 min at room temperature (RT). Tissue blocking was performed by incubating the slides with 10% goat serum in TBS with 0.05% Tween-20 (TBST) for 15 min at RT.
The first 2 primary antibodies of round 1 were applied and incubated for 1 h at RT. Detection was performed using tyramide signal amplification with anti-mouse and anti-rabbit poly–horseradish peroxidase (HRP) (1:5 in TBST; BrightVision; Immunologic), followed by incubation with tyramide–Alexa Fluor (AF) 488 and tyramide-AF555, respectively (1:100; Thermo Fisher Scientific), in TBST with 0.0015% H2O2 for 15 min at RT. Residual HRP activity was quenched with a 0.9% H2O2.
After a second round of antigen retrieval and tissue blocking, the third and fourth primary antibodies from round 1 were applied and detected using AF647- and AF750-conjugated secondary antibodies (1:300; Thermo Fisher Scientific), respectively, along with nuclear staining with DAPI (1.6 μg/mL).
The slides were washed and mounted using ProLong Gold Antifade (Thermo Fisher Scientific) and then scanned with a Zeiss Axioscan.Z1 slide scanner (Carl Zeiss) equipped with a Colibri7 light source and filter set 112 at wavelengths of 365 nm, 488 nm, 555 nm, 647 nm, and 750 nm.
Following scanning, coverslips and fluorochromes were removed by immersing the slides in TBST, followed by bleaching with 24 mM NaOH and 4.5% H2O2. The antigen retrieval procedure was repeated, and additional primary antibody pairs listed in Appendix Table 2 were applied, followed by detection with AF647- and AF750-conjugated secondary antibodies for a total of 4 staining rounds. The antibody panels and relevant details are shown in Appendix Table 2. Representative images of the staining are shown in Figure 1.
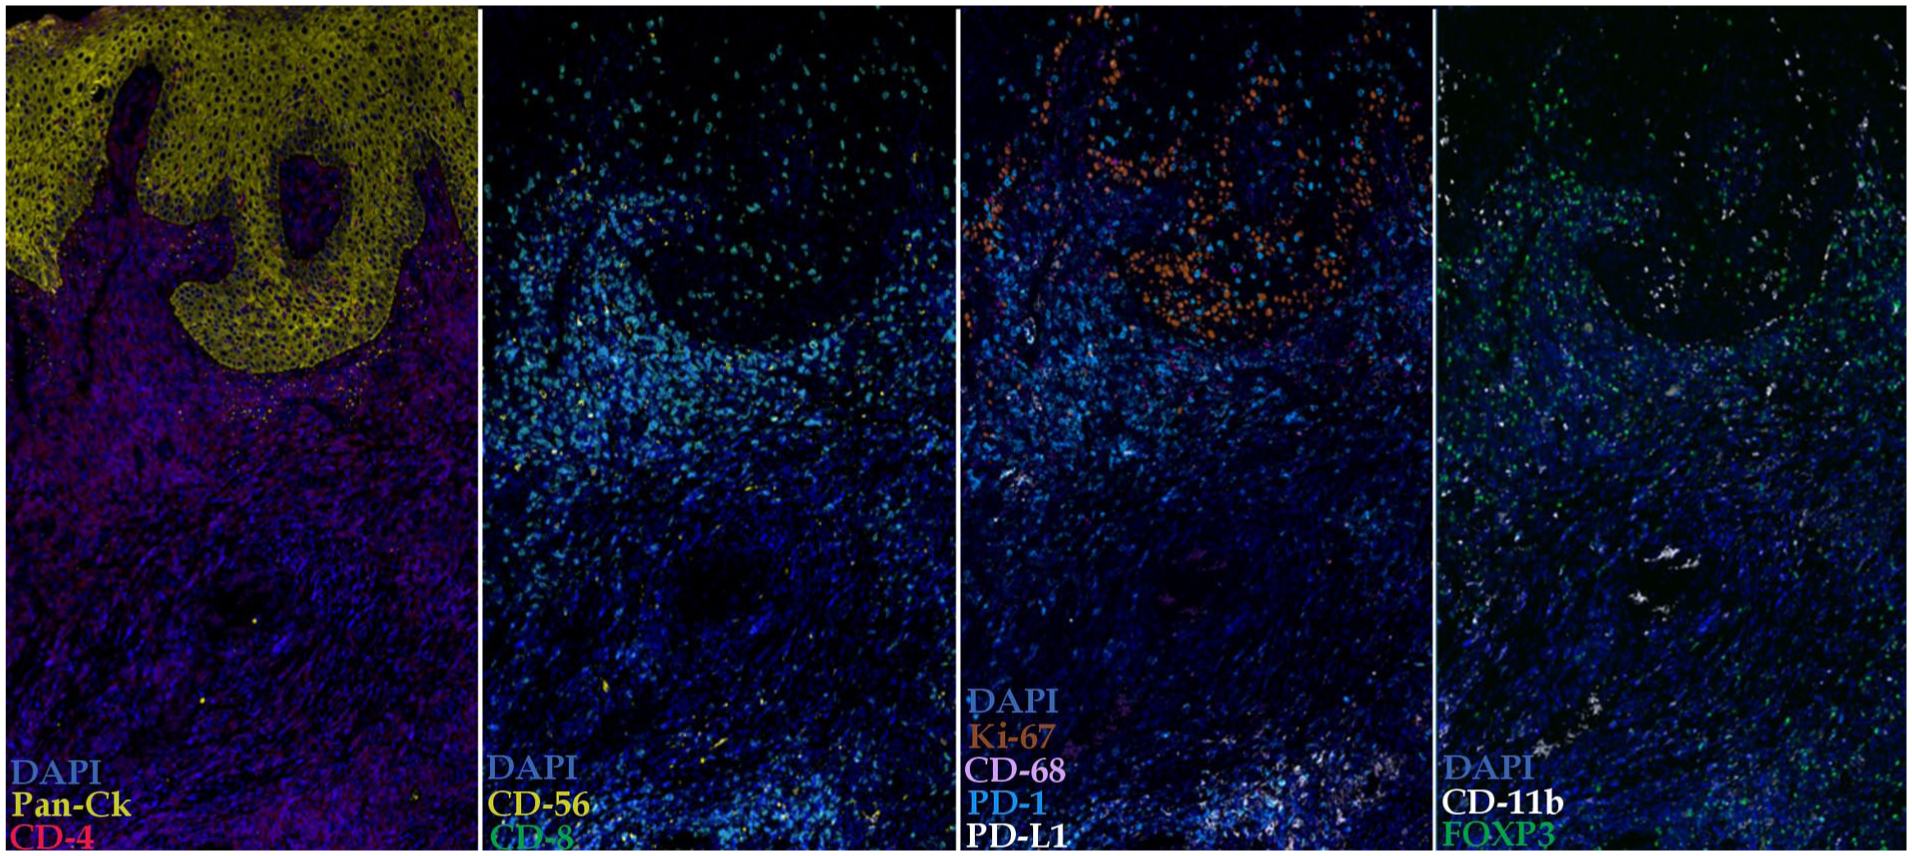
Representative multiplex immunofluorescence staining of an oral epithelial dysplasia sample. The image shows colocalization of immune and epithelial markers within the tissue architecture.
The staining panel was validated using various cancer and normal tissue samples at the FIMM Digital Microscopy and Molecular Pathology Unit. Negative controls were included by omitting the primary antibodies. In addition, antibody inactivation controls were performed to confirm signal removal and to prevent antibody carryover between staining rounds. Further details of the staining protocol are provided by Blom et al (2017). To minimize potential batch effects, all samples were processed simultaneously.
Image Processing and Feature Extraction
Details of image processing and feature extraction are provided in the Appendix Methods.
Signal Binarization, Dimensionality Reduction, and Visualization
Details of signal binarization, dimensionality reduction, and visualization are provided in the Appendix Methods.
Statistical Analysis
Details of the statistical analysis are provided in the Appendix Methods.
Results
Relative Distribution of Cells Predicted Higher Risk for Malignant Transformation
In total, the analysis quantified 121,803 cells among 7 HR dysplasia samples and 109,229 cells across 5 LR dysplasia samples.
Uniform manifold approximation and projection (UMAP) generated from the multiplex staining data revealed a clear shift toward a more inflamed microenvironment in the HR dysplasia group than in the LR group (Fig. 2). There was a noticeable increase in immune cell populations, including CD4+, CD8+, CD68+, and CD11b+ cells in the HR samples (Fig. 2). Additionally, the HR dysplasia samples had a higher prevalence of PD-1+, PD-L1+, and Ki-67+ cells than the LR samples (Fig. 2).
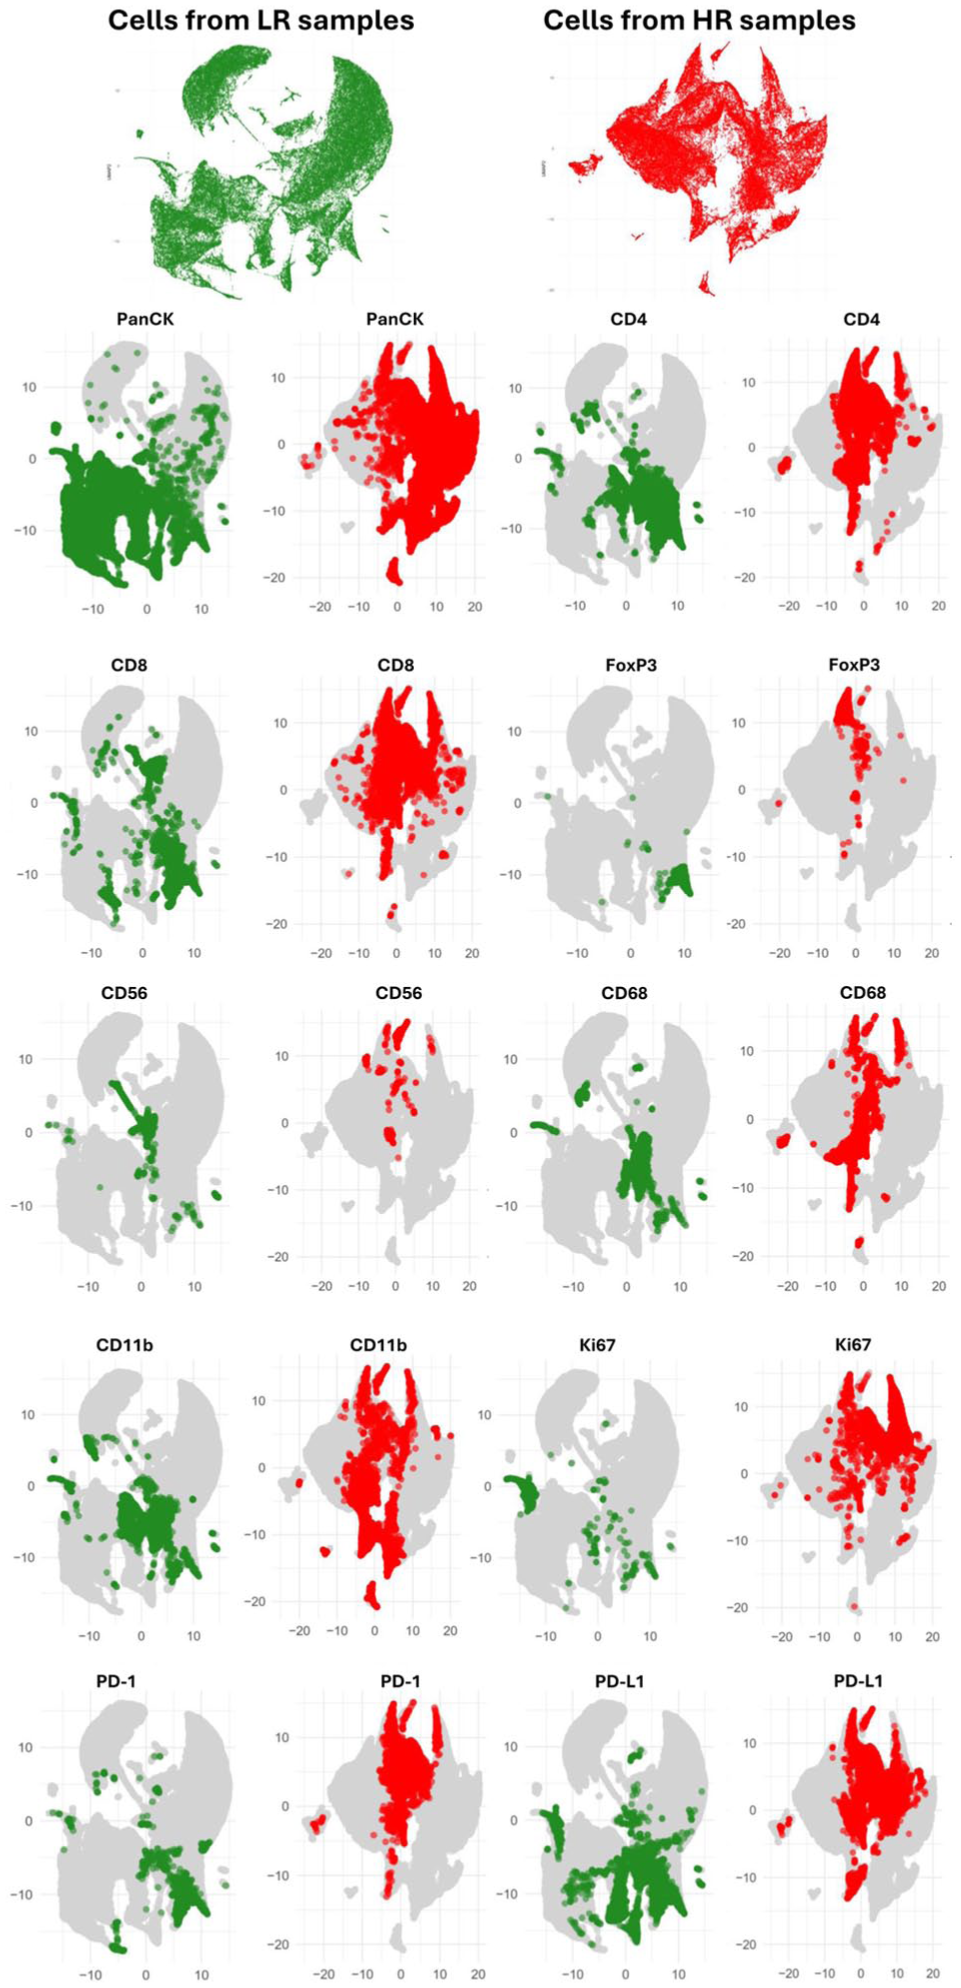
Uniform manifold approximation and projection (UMAP) visualization of immune and epithelial markers, demonstrating the spatial distribution and coexpression of these markers in low-risk (LR) and high-risk (HR) oral dysplasia samples. Data from 121,803 cells collected from 7 HR dysplasia samples and 109,229 cells from 5 LR samples were pooled to generate these UMAPs based on binarized intensity. The analysis included the following markers: PanCK (epithelial cells), CD4, CD8, FoxP3 (T cell subsets), CD56 (natural killer cells), CD68 (macrophages), CD11b (myeloid cells), Ki-67 (proliferation marker), PD-1, and PD-L1 (immune checkpoint markers).
To account for differences in total cell counts between samples, positive cell numbers were normalized to the total number of cells in each sample and presented as percentages. This revealed a marked increase in the proportion of immune cells in the HR dysplasia group, from 28% in LR samples to 48% in HR samples (Fig. 3A, B). Notably, this brought the immune cell proportion in HR samples to nearly equal that of epithelial (PanCK+) cells (Fig. 3B). In contrast, no significant difference in immune cell proportions was observed between LG and HG dysplasia groups (Fig. 3C).
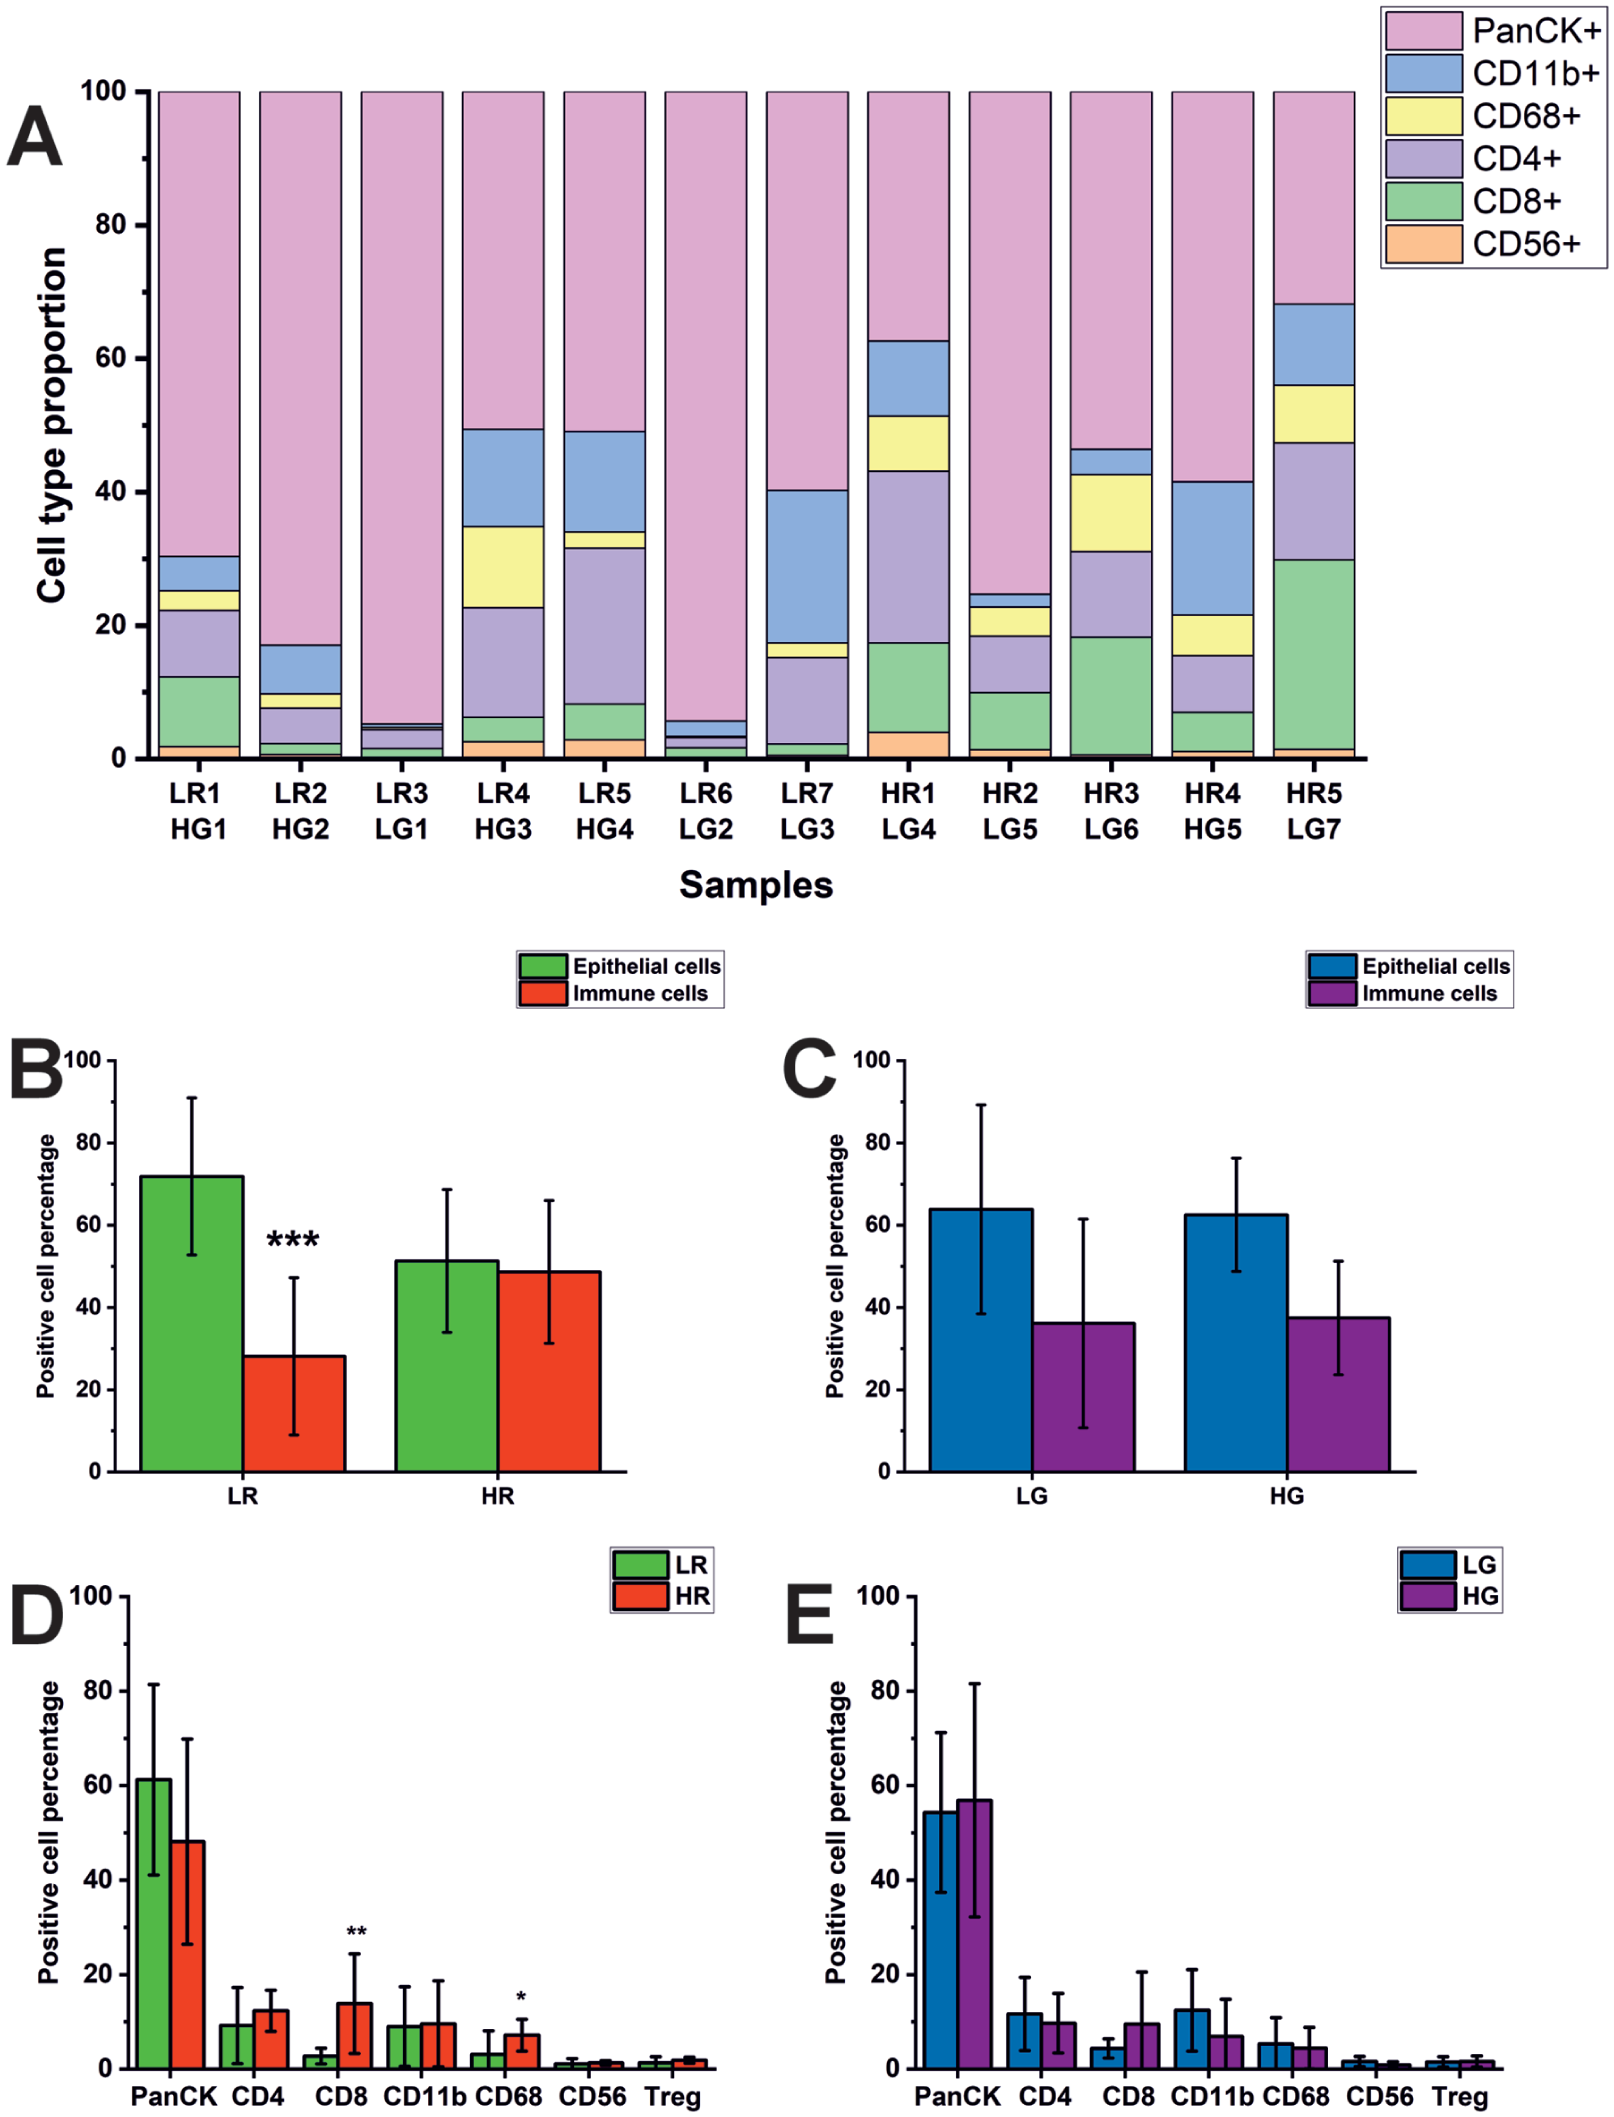
Relative distribution of cell subtypes in low-risk (LR) and high-risk (HR) cases and low-grade (LG) and high-grade (HG) dysplasia samples. (
When examining the percentage of positive cells within each cell type, both CD8+ cytotoxic T cells and CD68+ macrophages were significantly more abundant in HR dysplasia samples than in LR samples (Fig. 3D). However, no statistically significant difference was found in any cell type when comparing LG and HG dysplasia samples (Fig. 3E).
Increased Cell Proliferation Is Associated with Higher Risk of Malignant Transformation
Ki67 positivity was combined with each cell type to compare cell proliferation between different dysplasia groups. Notably, epithelial cells in the HR dysplasia samples had significantly higher proliferation levels than those in the LR group. Specifically, 7.4% of epithelial cells (PanCK+) were Ki67+ in the LR group, whereas this proportion increased significantly to 11.6% in the HR group (P = 0.048; Fig. 4A). Interestingly, when stratified into LG and HG dysplasia groups, the results were reversed, as 11.7% of the epithelial cells were Ki67+ in the LG group compared with 5.6% in the HG group (P = 0.048, Fig. 4B). This suggests potential limitations of the grading system in predicting the proliferative activity of epithelial cells.
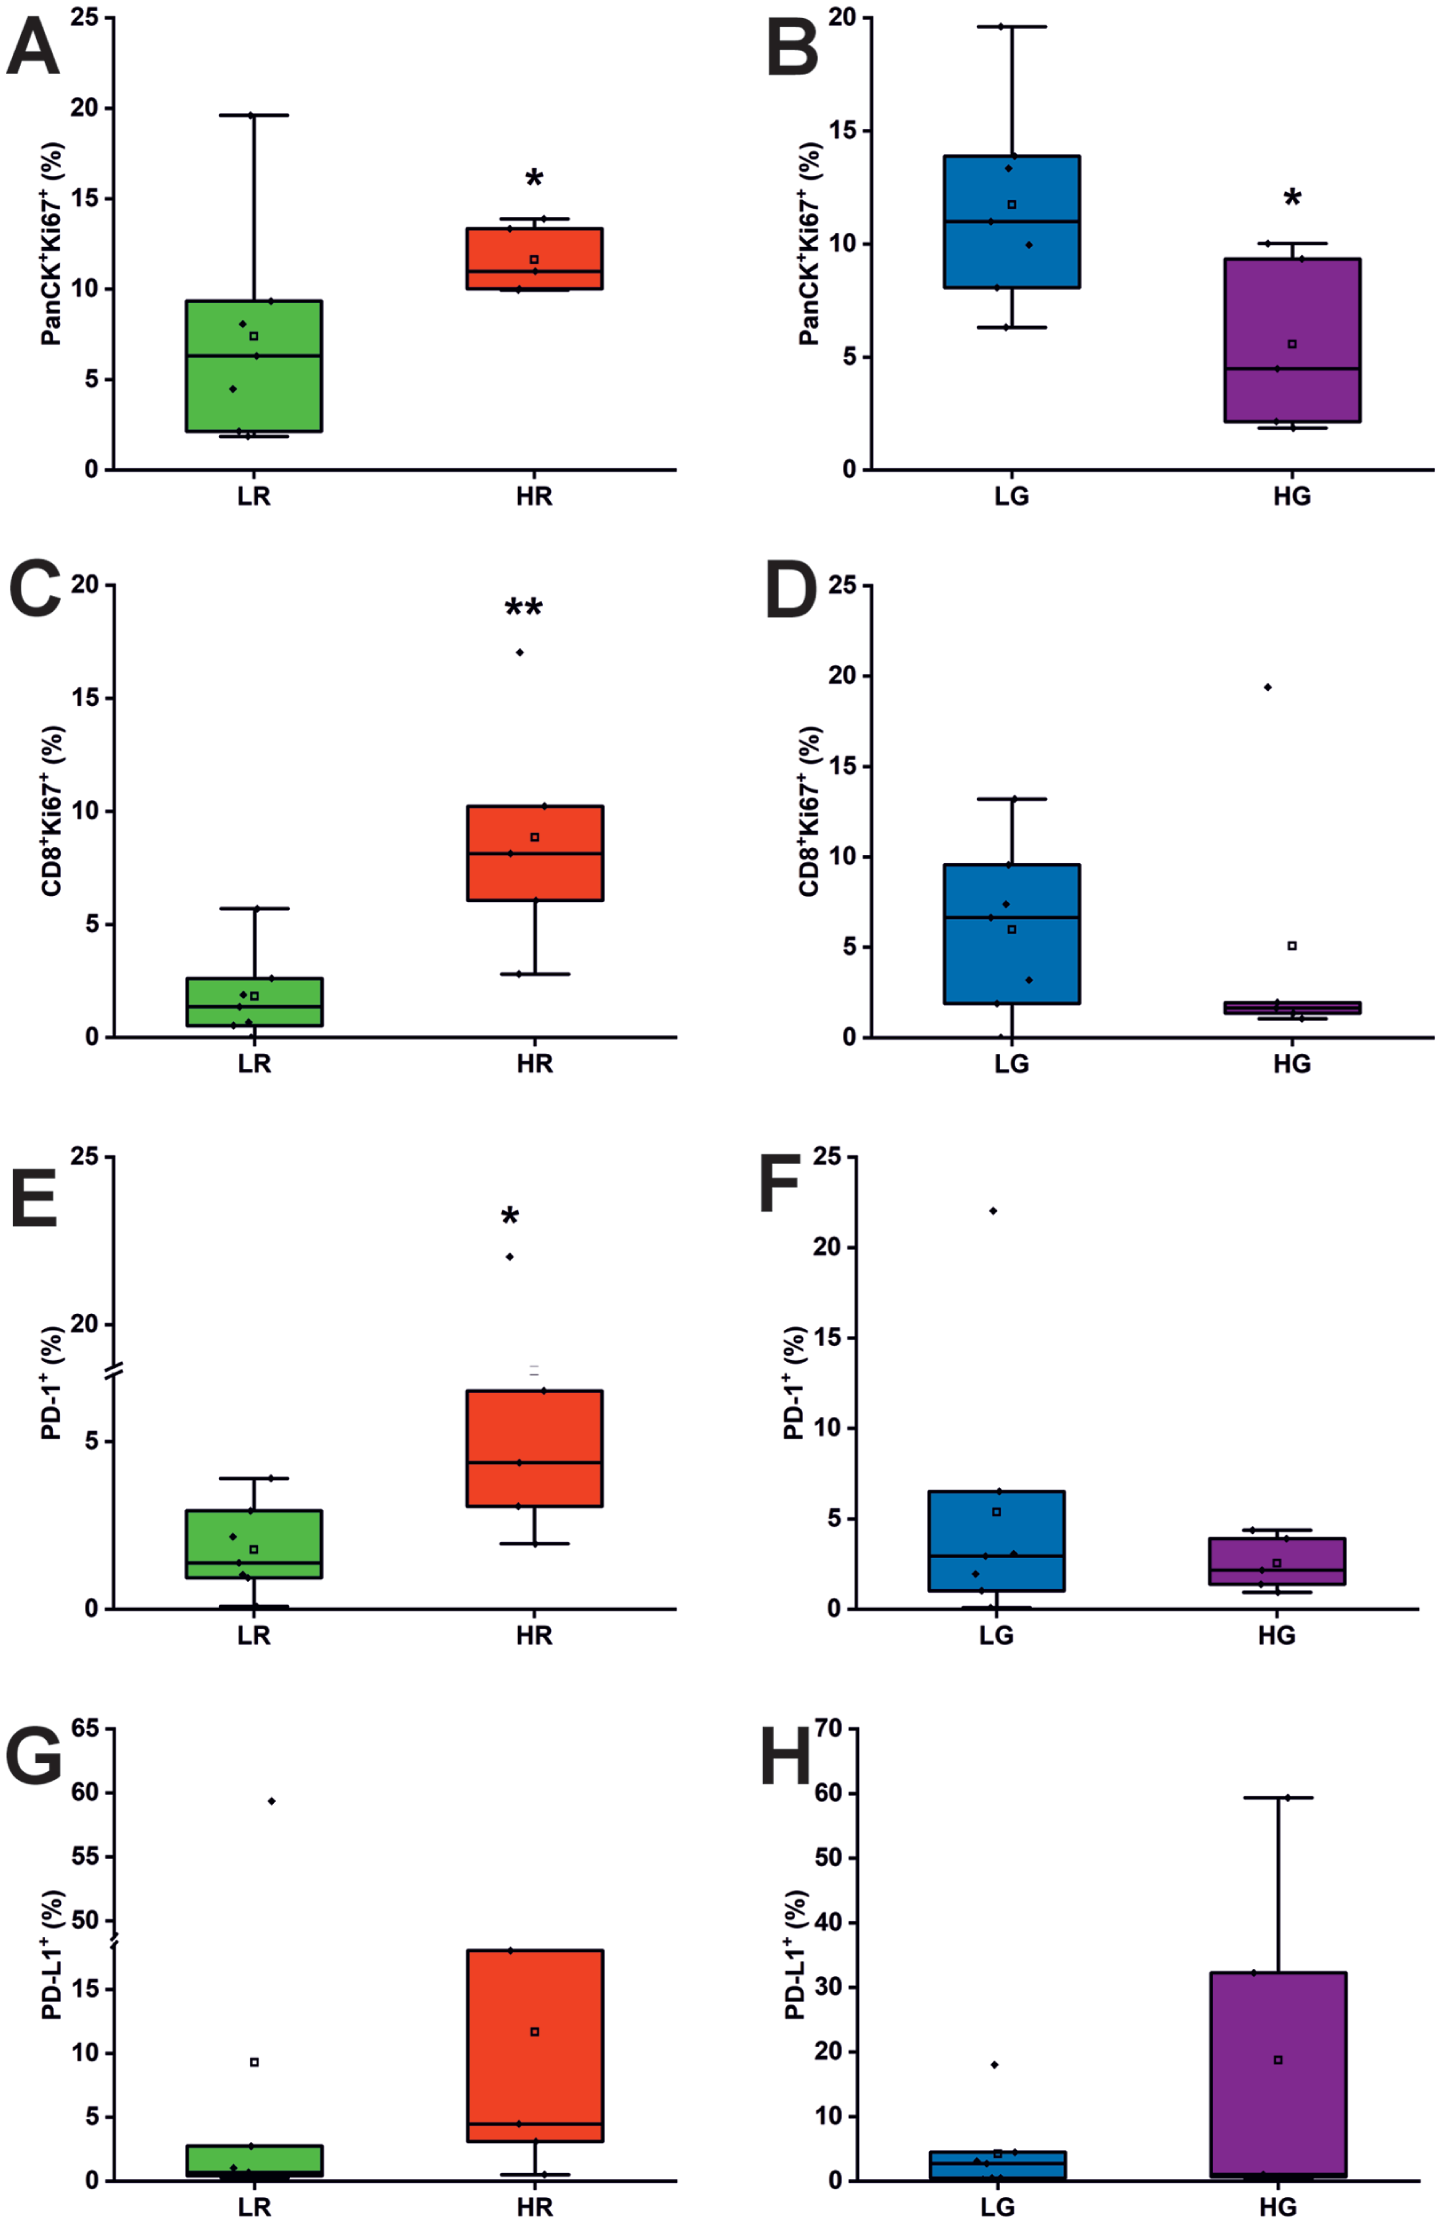
Enhanced proliferation of epithelial and CD8+ T cells and increased expression of immune checkpoints in high-risk (HR) samples. (
Correspondingly, CD8+ T cells coexpressing Ki67 were significantly more abundant in the HR group (8.9%) than in the LR group (1.8%, P = 0.005; Fig. 4C). This indicates an accelerated proliferation rate among the CD8+ cytotoxic T cell population in the HR dysplasia samples. However, no significant differences were observed in this population between LG and HG dysplasia groups (5.0% vs. 4.4%, P = 0.4; Fig. 4D).
Other immune cell subtypes coexpressing Ki67+—namely, CD11b+ (P = 0.8), CD4+ (P = 0.2), CD56+ (P = 0.4), and CD68+ (P = 0.8) cells—did not show statistically significant differences between HR and LR groups, suggesting limited predictive value for proliferation within these cell types.
PD-1/PD-L1 Pathway Is Elevated in High-Risk Samples
As the PD-1 antibody has already been approved as immunotherapy for patients with recurrent and metastatic oral cancer, we sought to investigate whether molecules in the PD-1/PD-L1 axis could have predictive value for malignant transformation of OED. Interestingly, both PD-1+ and PD-L1+ cells were more abundant in the HR group than in the LR group (Fig. 4E, G). Statistically, only PD-1 positivity was significantly higher in the HR group (7.6%) than in the LR group (1.8%, P = 0.03; Fig. 4E), suggesting enhanced immune regulation among HR samples. Although PD-1 expression is often associated with T cell immune suppression and exhaustion, it can also serve as a marker for recent T cell activation (Okazaki et al 2013; Purcarea et al 2022). As observed with other markers, no significant differences in PD-1 or PD-L1 positivity were found between LG and HG dysplasia groups based on the grading system (Fig. 4F, H).
Logistic Regression Reveals Key Immune Markers and Enhanced Multivariate Predictive Performance
Univariate logistic regression identified several markers with significant discriminatory power (false discovery rate [FDR]–adjusted P < 0.05) for each classification task. In HR versus LR, CD8 (area under the curve [AUC] = 0.709), Ki67 (AUC = 0.697), and PD-L1 (AUC = 0.670) achieved the highest individual predictive accuracies. In HG versus LG, CD8 (AUC = 0.745), FoxP3 (AUC = 0.691), and PD-L1 (AUC = 0.677) showed the highest discriminatory ability. Odds ratios (ORs) per 1 standard deviation (SD) change in marker intensity ranged from strong positive associations (e.g., PD-1 in HR vs. LR, OR = 1.72) to strong negative associations (e.g., CD8 in HG vs. LG, OR = 0.570) (Fig. 5A).
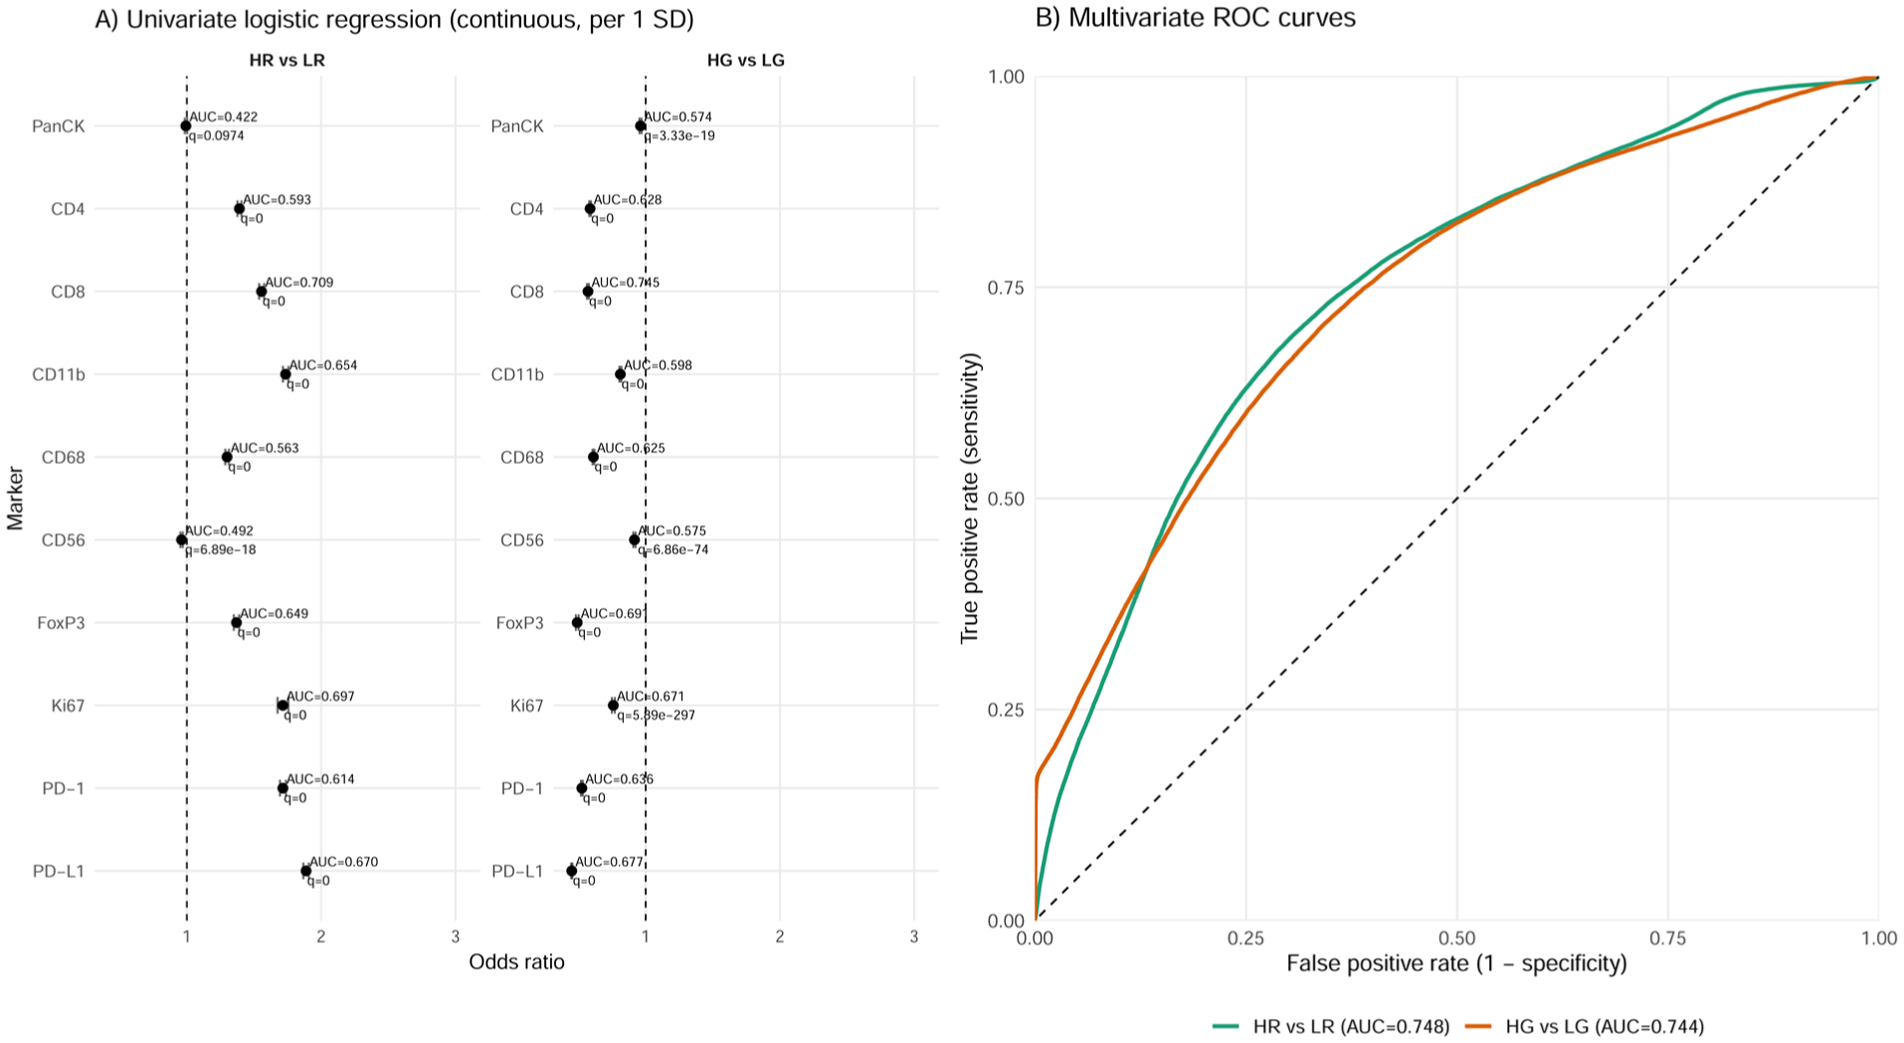
Cell-level predictive performance of marker intensities. (
Multivariate models integrating all markers outperformed all individual predictors in HR versus LR and almost all individual markers in LG versus HG. The HR versus LR model achieved a cell-level AUC of 0.748 in-sample and 0.747 ± 0.001 in 5-fold cross-validation (CV), where folds were defined over individual cells. The HG versus LG model showed similar performance (in-sample AUC = 0.744; CV AUC = 0.743 ± 0.002). ROC curves from the multivariate models demonstrated overall comparable classification performance between HR versus LR and HG versus LG models (Fig. 5B).
Discussion
This study examined the immune landscape of OED on the lateral border of the mobile tongue, with the aim of identifying potential biomarkers that predict the malignant transformation at the site most affected by oral cancer. Our key findings indicate an elevated risk of cancer development in samples with high immune cell infiltration, especially CD8+ T cells and CD68+ cells, and high expression of the proliferation marker Ki67 and the immune checkpoint PD-1.
Despite recent advances in treatment strategies for OSCC, the 5-year overall survival rate is approximately 50% globally. This high mortality rate is due to several factors, including aggressive local invasion, the presence of regional lymph node metastasis, a high recurrence rate, and, above all, the often delayed diagnosis (Dong et al 2024; Struckmeier et al 2024). Notably, almost 50% of OSCC cases are diagnosed at a late stage, which is a significant source of disparities in outcomes (Mauceri et al 2022). In contrast, OSCC detected at an early stage has survival rates exceeding 85%. Therefore, OED cases should require close monitoring to detect potential malignant transformation as early as possible. Currently, risk evaluation of OED still relies primarily on histological evaluation and patient-related risk factors (Pentenero et al 2023). However, recent research has focused on the lesion microenvironment to establish a more effective and robust foundation for OED prognosis.
OED grading is currently the only approved system for histologically evaluating the malignant transformation potential of these lesions. The latest version of the WHO grading still categorizes OEDs in 3 tiers: mild, moderate, or severe dysplasia (Hankinson et al 2024; WHO Classification of Tumours Editorial Board 2024). In addition, various 2-tier approaches (LG and HG) have been compared with the original 3-tier approach with mixed results (de Freitas Silva et al 2021). Notably, none of the analyzed markers, apart from PanCK+Ki67+ cells, was able to discriminate between LG and HG dysplasia samples. Owing to the limited sample size, these findings cannot be used to directly challenge the current dysplasia grading system; however, they underscore the need for a more comprehensive evaluation of this system in a larger cohort.
The Ki67 protein is a universal marker of cell proliferation and has a role in mitotic chromosome integrity and heterochromatin maintenance, underlying its importance for cell cycle progression (Sobecki et al 2016; Sun et al 2017; Sun and Kaufman 2018). High Ki67 levels have been observed in a variety of cancers and correlate with reduced survival (Yerushalmi et al 2010; Luo et al 2019; Jia et al 2023). Importantly, multiple studies have demonstrated the prognostic potential of Ki67 in OED (Torres-Rendon et al 2009; Gadbail et al 2018). Using UMAP, this study broadened the role of Ki67 from a single-dimensional biomarker. When compared with the LR group, there was an increased proliferation rate in the HR group in most of the studied cell types. To further confirm the findings made in UMAP, we evaluated the Ki67 expression combined with each cell subset, resulting in 2 statistically significant couplings with PanCK+ and CD8+ populations. As a notable comparison, the LG/HG dysplasia group had contradictory results as PanCK+Ki67+ was a statistically significant marker showing decreased proliferation of epithelial cells among HG samples.
CD8+ T cells are among the most studied subgroups of lymphocytes within OPMDs and have been mainly investigated in oral lichen planus and oral leukoplakia (Sutera et al 2025a). Additionally, a positive correlation between CD8+ T cells and dysplasia severity was reported before (Gannot et al 2002; Flores-Hidalgo et al 2024). Consistent with previous observations, in our analysis, higher levels of CD8+ T cells were found in the HR group. CD8+ T cells primarily participate in cytotoxic activity within the stroma but are mostly suppressed intratumorally due to high PD-1 expression (Katou et al 2007).
Macrophages are a major participant in leukocytic infiltration in tumors and may have either pro- or antitumor activity (Mantovani et al 2008; Gao et al 2022). Due to their prognostic significance for head and neck squamous cell carcinoma, macrophage infiltration has been under investigation in OPMDs. A systematic review of the state of current research concluded that macrophage infiltration increases from normal mucosa to OPMDs, OED, and finally OSCC. Additionally, the dominant profile shifted from proinflammatory M1 macrophages toward an immunosuppressive M2-dominant cell population when comparing OPMDs with OSCC (Sutera et al 2025b). Importantly, we observed a statistically significant increase in CD68+ macrophage levels in the HR group, supporting the role of macrophage infiltration as a predictive factor for OED malignant transformation.
Other immune cells examined in our study included CD4+ T cells, FoxP3+ Tregs, CD56+ natural killer cells, and CD11b+ myeloid cells. CD4+/FoxP3+ Treg populations correlate with increasing malignancy of OPMDs (Kouketsu et al 2019) but were not significant in our analysis. Of note, the CD4+ T-cell population was elevated in the HR group compared with the LR group (12.3% vs. 9.2%) but did not reach statistical significance. Likewise, CD56+ and CD11b+ cells have an active role in the immune system and are potential prognostic markers for head and neck carcinomas (Bisheshar et al 2020; Jiang et al 2021) but were not significant in our analysis.
PD-1 and PD-L1 are immune checkpoints that have been extensively studied as potential biomarkers. In the context of OPMDs, PD-L1 is a promising prognostic marker as it is often overexpressed in the lesions that progress to cancer (Yagyuu et al 2017; Dave et al 2020). In our analysis, both PD-1 and PD-L1 levels were visibly elevated in the HR group when compared with the LR group (7.6% vs. 1.8% and 11.7% vs. 9.2%, respectively); however, only PD-1 expression reached statistical significance. This may be because PD-L1 is mainly expressed by cancer cells rather than dysplastic cells.
To validate our findings on the discriminatory power of markers, we performed logistic regression analysis. The univariate results confirmed the significance of the markers identified in the previous analysis, while the multivariate analysis revealed that a model incorporating all studied markers achieved higher predictive accuracy than the individual markers. This finding suggests the potential of using a multimarker model based on the immune landscape to predict the progression of OED to OSCC, with the possibility of enhancing the demonstrated performance by further studying the composition of the multivariate model.
This study aimed to provide new immunological approaches to predict the malignant transformation of OED. However, it has limitations, such as the small sample size of 12 cases. The cohort size reflects the rarity of OED cases with complete ≥5-y follow-up and high-quality archival material suitable for multiplex immunofluorescence. As this exploratory study was based on all eligible cases available in the institutional archives, a formal a priori sample size calculation was not feasible. The findings should therefore be interpreted as hypothesis-generating and as a basis for guiding future, adequately powered validation studies. Additionally, the panel used for multiplex staining included the most promising markers as described previously, but some potentially relevant markers, such as CD20+ B cells, were not included (Phanthunane et al 2021). Another important aspect to consider when interpreting these data is that the samples were collected without information on major etiological factors of oral cancer, such as smoking history, alcohol use, and human papillomavirus status. This was because such data are not routinely collected for all patients and were not provided in the pathology reports accompanying the samples. Therefore, further studies with larger sample sizes are needed to validate the findings in this study.
Conclusion
This study sought to characterize potential stromal immunology-based biomarkers in oral tongue dysplasia specimens obtained from the lateral border of the mobile tongue by comparing cases at high or low risk for malignant transformation. We observed elevated levels of CD8+, CD68+, and PD-1+ cells and an overall increase in immune cell infiltration in HR samples. We also revealed increased proliferation across several cell populations, mainly CD8+ T cells and PanCK+ epithelial cells, as evidenced by both spatial distribution and statistical evaluation of Ki67+ expression. Furthermore, our multivariate regression analysis identified a multimarker model with higher predictive accuracy than individual markers. Although preliminary, these findings lay the groundwork for further investigation of immunological markers as potential prognostic indicators for OED. Future evaluation could be conducted using a multiplex staining technique when available or through conventional immunohistochemical methods, particularly in studies involving larger cohorts.
Author Contributions
A. Sandell, M. Giacomini, contributed to data acquisition, analysis, and interpretation, drafted the manuscript; M. Risteli, contributed to data analysis and interpretation, critically revised the manuscript; S. Kilpinen, contributed to data analysis, critically revised the manuscript; T. Salo, A. Al-Samadi, contributed to data conception and design, critically revised the manuscript. All authors gave final approval and agreed to be accountable for all aspects of the work.
Supplemental Material
sj-docx-1-jdr-10.1177_00220345251414354 – Supplemental material for Immune Landscape Reveals Biomarkers for High-Risk Oral Tongue Dysplasia
Supplemental material, sj-docx-1-jdr-10.1177_00220345251414354 for Immune Landscape Reveals Biomarkers for High-Risk Oral Tongue Dysplasia by A. Sandell, M. Giacomini, M. Risteli, S. Kilpinen, T. Salo and A. Al-Samadi in Journal of Dental Research
Footnotes
Acknowledgements
The authors thank FIMM Digital Microscopy and Molecular Pathology for their assistance.
Declaration of Conflicting Interests
The authors declared no potential conflicts of interest with respect to the research, authorship, and/or publication of this article.
Funding
The authors disclosed receipt of the following financial support for the research, authorship, and/or publication of this article: The authors gratefully acknowledge the funders of this study: the Research Council of Finland, the Sigrid Jusélius Foundation, the Minerva Foundation, and the Finnish Dental Society Apollonia.
Data Availability
A supplemental appendix to this article is available online.