
Abstract
Providing the summary effect size and its uncertainty, a prediction interval, and a measure of statistical heterogeneity constitute good reporting practices in meta-analyses. Popular statistical heterogeneity measures comprise the τ2 and I2 statistics. However, researchers often rely unduly on the I2 statistic, using naive categorizations to gauge the extent of heterogeneity, leading to misuses of the meta-analysis models, deficiencies in reporting, and misleading conclusions. The present study aimed to provide empirical evidence on the reporting and interpretation of statistical heterogeneity in systematic reviews of oral health published between 2021 and 2023 in 21 leading specialty and general dental journals. Systematic reviews with at least 1 meta-analysis on binary or continuous outcomes with the most studies were identified. Characteristics were extracted at the systematic review and meta-analysis levels. In total, 313 systematic reviews with meta-analyses were analyzed. Within this cohort of meta-analyses, the random-effects model (89%, n = 278) was frequently applied. Almost all meta-analyses (98%, n = 308) reported the I2 value, and 51% (n = 160) reported the τ2 value. For this sample, the median I2 was 76% (range: 0%–100%), and the median τ2 was 0.29 (range: 0–2,632), with 13% (n = 20/160) of these meta-analyses reporting zero τ 2 . Most of the meta-analyses (96%, n = 299) based the heterogeneity interpretation on I2 and only 21 (7%) on τ2. Although 49% (n = 152) of the meta-analyses chose the meta-analysis model a priori, only 41% (n = 63/152) justified this choice. Furthermore, 42% (n = 131) of the 313 meta-analyses chose the meta-analysis model based on the I2. Within oral health meta-analyses, there is evidence of overreliance on I2 when reporting and interpreting statistical heterogeneity and selecting the meta-analysis model. The inappropriate use of I2 in meta-analysis model selection and interpretation of statistical heterogeneity may have implications for the quality of conclusions delivered to the end users of systematic reviews.
Introduction
Pairwise meta-analysis is a long-established evidence synthesis tool with a central role in making informed decisions about the benefit-harm profile of 2 interventions. Attractive elements of pairwise meta-analysis include the increased accuracy and precision of the summary results and the greater statistical power compared with a single study, particularly when statistical heterogeneity is mitigated (Hedges and Pigott 2001).
Selecting the appropriate meta-analysis model (hereafter referred to as “model”) is pivotal for credible conclusions. Decisions regarding the model should be made during the protocol stage of the review (Lasserson et al. 2023). A random-effects model is more suitable when studies are retrieved from literature searches, as this model accounts for the inherent clinical and methodological heterogeneity across primary studies (Borenstein et al. 2010). A fixed-effect model implies one true treatment effect, and any differences in the observed results of the studies are attributed to sampling error (within-study variance) (Borenstein et al. 2010; Kanters 2022). Therefore, using a fixed-effect model is difficult to defend when the included studies come from literature searches (Borenstein et al. 2010).
The principal sources of heterogeneity in a meta-analysis are distinguished as clinical, methodological, and statistical, attributed to variance in the true treatment effects across studies (Thompson 1994; Richardson et al. 1995; Melsen et al. 2014). Statistical heterogeneity can be identified (1) visually in a forest plot by observing how much the study-specific treatment effects and their 95% confidence intervals (CIs) overlap and (2) statistically by applying the Cochran’s Q test and estimating the parameters I2 and τ2 (Fletcher 2007). The I2 is an intuitive parameter that describes the proportion of variation in observed treatment estimates attributed to statistical heterogeneity rather than sampling error alone and comprises a relative measure of statistical heterogeneity (Rücker et al. 2008; Borenstein 2023; Deeks et al. 2023). Conversely, τ2 is an absolute measure of statistical heterogeneity and quantifies the variance of the true treatment effects across the studies (Rücker et al. 2008; Borenstein 2024).
Within the health care literature, I2 and τ2 are consistently used in the reported meta-analysis results (Thorlund et al. 2012; Alba et al. 2016; Langan et al. 2017). However, questions have been raised regarding the appropriateness of the interpretation of I2 and τ2 (Rücker et al. 2008; Borenstein et al. 2017; Borenstein 2023; Borenstein 2024). Common misconceptions include using I2 to gauge the variability of the effect size across studies and to classify the extent of statistical heterogeneity using arbitrary thresholds, treating I2 as an absolute heterogeneity measure and resorting to I2 or τ2 to select the model (Rücker et al. 2008; Borenstein 2022; Borenstein 2023; Borenstein 2024). In meta-analyses with a few studies, I2 may overestimate or underestimate the degree of true statistical heterogeneity (von Hippel 2015). Furthermore, the study size and event frequency (for binary outcomes) may affect the estimation of I2 (Thorlund et al. 2012; von Hippel 2015). Consequently, using I2 to describe the extent of statistical heterogeneity can be problematic. A proposed solution is to accompany the estimated I2 with the 95% CI to communicate the uncertainty around the estimation (Ioannidis et al. 2007; Ioannidis 2008; Thorlund et al. 2012; von Hippel 2015).
Systematic reviews (SRs) with meta-analysis have been well-received by the oral health community. The surge of several bibliographic surveys and empirical studies on the reporting quality and statistical aspects of published SRs in oral health demonstrates the rising popularity of this study design in the broad oral health field. The use of SRs in clinical decisions makes it imperative that the limitations are recognized and the results of SRs are properly interpreted. To our knowledge, an empirical evaluation of the reporting and interpretation of I2 and τ2 in oral health SRs has not been previously undertaken. The primary aim of this study was to report the frequency of reporting I2 and τ2 in oral health meta-analyses. A secondary aim was to assess how the SR authors report and interpret I2 and τ2.
Materials and Methods
Eligibility Criteria
Twenty-one English-language oral health journals with the highest impact factor (2023) were included. This cohort consisted of the 2 highest impact factor (2023) journals from the following dental specialties: cariology, endodontology, periodontology, orthodontics, oral surgery/oral pathology, oral and maxillofacial surgery, implantology, reconstructive and pediatric dentistry and 3 general oral health journals. To be eligible, SRs had to report interventional procedures involving human participants or animals and have at least 1 meta-analysis for binary or continuous outcomes containing at least 3 primary studies. In SRs with more than 1 meta-analysis, the meta-analysis with the most primary studies was selected. Scoping reviews were excluded for not including any study syntheses. Network meta-analyses were also excluded for having additional analysis and reporting requirements around statistical heterogeneity. Where multiple versions of the same SR existed, we included the most recent.
Selection of SRs
Two authors (Z.T. and J.S.) independently searched journal websites manually to identify eligible SRs. The search date was from September 10, 2023, to September 17, 2023. SRs published between June 1, 2021, and August 31, 2023, were considered for further selection based on our inclusion and exclusion criteria. The terms “systematic review” or “meta-analysis” were screened in the title, abstract, and full article text. In case of disagreement, a third author (N.P.) was consulted to discuss the eligibility of the SR until consensus.
Data Extraction
Prior to data collection, a prepiloting process based on 20 SRs was undertaken to ensure consistency between the authors (E.K. and Z.T.) regarding the understanding of the extracted elements at the SR and meta-analysis levels. One hundred percent agreement was reached. All extracted elements were entered into a prepiloted Microsoft Excel® data collection sheet. Any disagreements relating to the extraction were resolved by discussion among the authors (Z.T., E.K., L.S., and N.P.) until consensus.
The following characteristics at the SR level were extracted: journal title, year of publication, journal impact factor, number of authors, the continent affiliated with the first author (Europe, America, Asia, or other), and PROSPERO registration (yes or no). At the meta-analysis level, the following characteristics were extracted from forest plots, tables, and text of the included SRs: the model (fixed-effect or random-effects), between-study heterogeneity estimator used, I2 and τ2 value with 95% CIs for the selected meta-analysis (if reported), the effect measure of the pooled estimate (e.g., mean difference, standardized mean difference, odds ratio, or risk ratio), and whether the Hartung-Knapp-Sidik-Jonkman (HKSJ) adjustment for the 95% CI of the summary effects was applied (relevant only for random-effects meta-analysis). An assessment was made on whether the model was chosen a priori or based on the I2 value. If it was chosen a priori, the full text of the SR was reviewed for any justification to support this decision by the authors, and the verbatim statements were documented. Information on whether the interpretation of the heterogeneity was based on the I2 or τ2 value was also recorded.
Statistical Analysis
The extracted data were tabulated, and descriptive statistics were used to summarize the continuous (median, interquartile range [IQR], and range) and categorical characteristics (absolute and relative frequencies). A bubble plot was used to illustrate the frequency of SRs per journal over the study time frame. Box plots with integrated dots were created to present the distribution of the point estimate and 95% CI bounds for I2 and τ2. Stacked bar plots were used to illustrate the frequency of heterogeneity interpretation with I2 or τ2 conditionally on whether the model was chosen a priori. All analyses were conducted using R statistical software (R Core Team 2023). The ggplot2 R package was used to produce the figures (Wickham 2016). The data and the functions supporting the present study’s findings are publicly available at https://github.com/LoukiaSpin/Statistical-Heterogeneity-Reporting-Quality-Oral-health-Systematic-Reviews.git.
Results
Six hundred eight oral health SRs published between June 1, 2021, and August 31, 2023, were initially identified from 21 journals (Supplementary Table S2). Following the eligibility criteria, 313 SRs containing meta-analyses with at least 3 primary studies were deemed suitable for analysis (Fig. 1 and Appendix Table S1). One hundred percent agreement was reached regarding the final selected SRs.
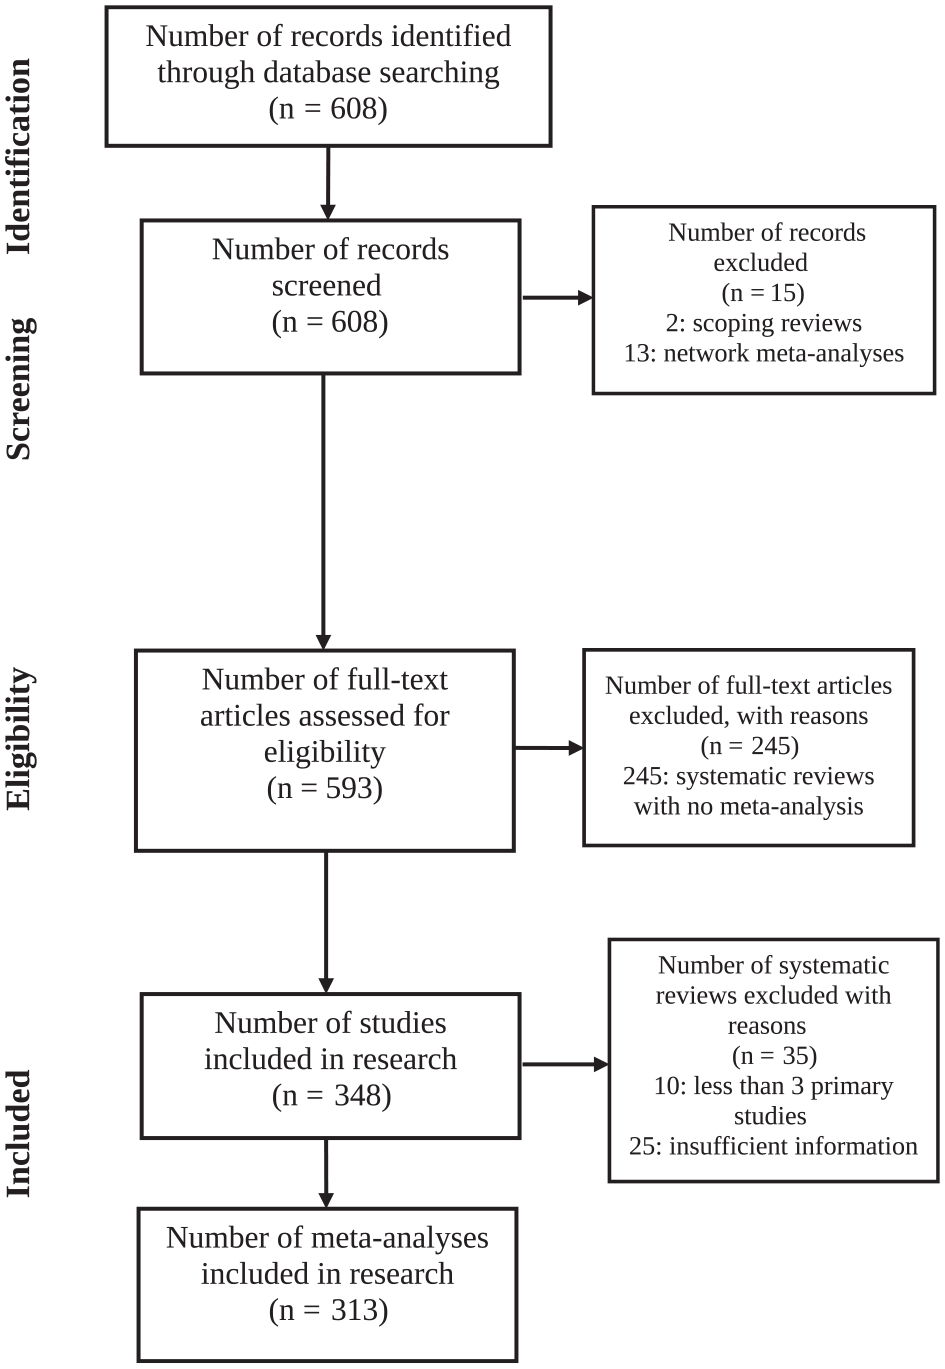
PRISMA flowchart of article identification and selection (N = 313).
The characteristics of the included SRs are summarized in Table 1. SRs included a median of 6 authors (IQR: 4 to 6), ranging from 2 to 16. Most SRs were published in Europe (35%, n = 111), followed by Asia (33%, n = 104) and America (25%, n = 77), and were registered with the PROSPERO database (75%, n = 235). The journals BMC Oral Health, Journal of Prosthetic Dentistry, and Journal of Dentistry published the most SRs (Supplementary Fig. S1).
Characteristics of included systematic reviews.

IQR, interquartile range.
The characteristics of the meta-analyses are summarized in Table 2. At the meta-analysis level, the random-effects model was more commonly used (89%, n = 278) than the fixed-effect model (11%, n = 35). Of the 278 meta-analyses that applied the random-effects model, only 72 (26%) reported a heterogeneity estimator. Of the 72 meta-analyses that reported a heterogeneity estimator, 42 (58%) applied DerSimonian and Laird, followed by the restricted maximum likelihood (36%, n = 26), Paule-Mandel (4%, n = 3), and DerSimonian-Kacker (1%, n = 1). Only 1 of the meta-analyses with a random-effects model reported a 95% CI for τ2. All 35 meta-analyses with a fixed-effect model and almost all meta-analyses with a random-effects model (98%, n = 273) reported the I2 statistic; however, only 8 (3%) meta-analyses with a random-effects model provided a 95% CI for the I2 statistic, and none of the meta-analyses with a fixed-effect model did.
Characteristics of the Included Meta-Analyses.

Twenty-six meta-analyses with a random-effects model used the Mantel–Haenszel method, where τ2 is estimated by incorporating the Mantel–Haenszel Q statistic (for the heterogeneity test) into the formula for the DerSimonian and Laird estimator.
The sample has been restricted to 152 meta-analyses (3 with a fixed-effect model and 149 with a random-effects model), where the meta-analysis model was chosen a priori.
Half of the meta-analyses used the mean difference (50%, n = 157), followed by the standardized mean difference and odds ratio in a tie (17%, n = 53) and the risk ratio (13%, n = 40) (Table 2). Other less frequently employed effect measures included the risk difference (1%, n = 3), hazard ratio (2%, n = 5), incidence ratio (0.3%, n = 1), and event rate (0.3%, n = 1).
Almost half of the 313 meta-analyses chose the model a priori (49%, n = 152); however, only 63 of 152 (41%) meta-analyses explicitly provided a reason for this choice (Table 2). Three (9%) meta-analyses with a fixed-effect model and 149 (54%) meta-analyses with a random-effects model chose the model a priori; only 1 of 3 (33%) and 62 of 149 (42%) of these meta-analyses, respectively, explained the reason for selecting a fixed-effect or random-effects model. Overall, 14 (4%) meta-analyses gave unclear information on whether there was an a priori model selection. Supplementary Table S3 provides the verbatim from those 14 meta-analyses with unclear information about the a priori selected model. Supplementary Table S4 lists the quotations from the 63 meta-analyses that justified the model selected a priori.
Forty-two percent (n = 131) of the meta-analyses chose the model based on the I2 value (Table 2). Most of the meta-analyses with a fixed-effect model (74%, n = 26) relied on the I2 value. Interestingly, most meta-analyses with a random-effects model (58%, n = 161) did not base the model selection on the I2 value.
Almost all included meta-analyses (96%, n = 299) interpreted statistical heterogeneity based on the I2 value, regardless of the selected model (fixed effect or random effects). Of the 278 meta-analyses with a random-effects model, only 21 (8%) interpreted statistical heterogeneity using the τ2 parameter.
Of the 278 meta-analyses with a random-effects model, only 5 (2%) reported to have applied the HKSJ adjustment when calculating the 95% CI for the pooled estimate. Almost all meta-analyses (98%, n = 308) reported the I2 value in their results, which ranged from 0% to 100% (IQR: 41% to 93%), with a median of 76% (Fig. 2). Of these meta-analyses, 43 (14%) provided a zero I2, and only 3 meta-analyses reported a 100% I2 value. Of the 278 meta-analyses with a random-effects model, 160 (58%) reported the τ2 in their results: τ2 had a median of 0.29, ranging from 0 to 2,632.09 (IQR: 0.04 to 1.09) (Fig. 2). Twenty (13%) of these meta-analyses reported a zero τ2; of those, 4 (20%) reported to have employed DerSimonian and Laird or the Mantel–Haenszel method, followed by 2 meta-analyses with restricted maximum likelihood and 1 with Paule-Mandel—the remaining 9 meta-analyses did not report a heterogeneity estimator.
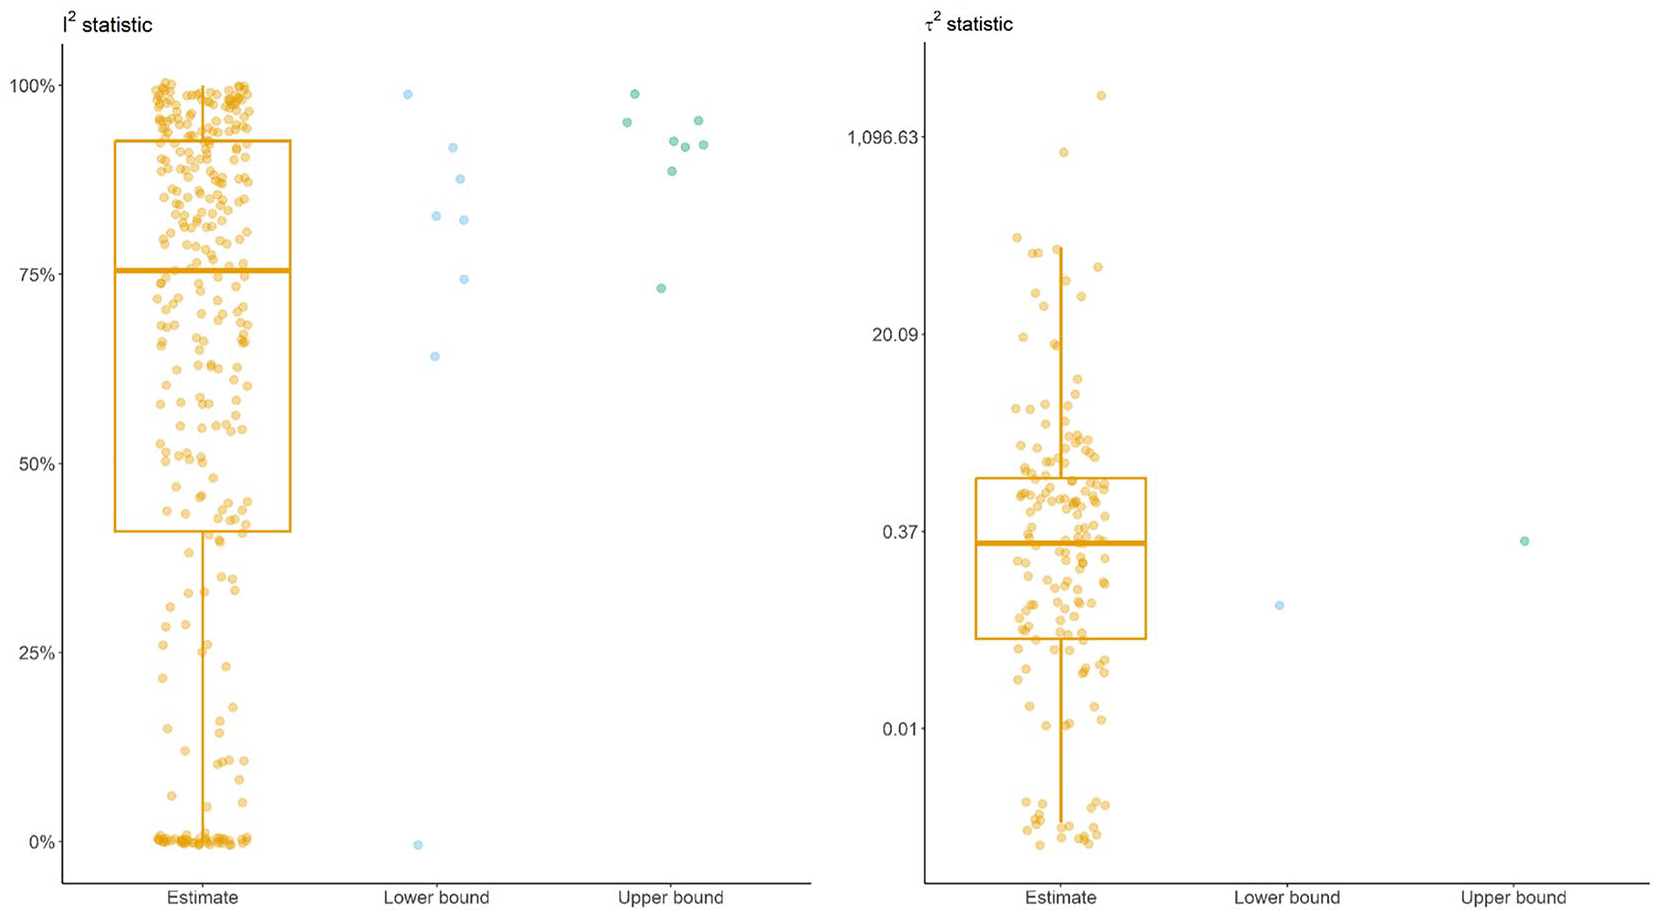
Box plots with integrated dots illustrate the estimated I2 (in percentage) and τ2 alongside the bounds (lower and upper) of their 95% confidence intervals extracted from the meta-analyses. The y-axis of the plot for τ2 is on the logarithmic scale.
Figure 3 shows the frequency of heterogeneity interpretation using I2 or τ2 based on whether the model was selected a priori. Regardless of whether the model was selected a priori, almost all meta-analyses interpreted statistical heterogeneity using I2 (Fig. 3A). Conversely, only 11% (n = 16) of meta-analyses with a priori model selection and 4% (n = 5) without a priori model selection interpreted statistical heterogeneity using τ2 (Fig. 3B). The same pattern was observed when investigating heterogeneity interpretation (using I2 or τ2) in association with whether the selected model was based on the I2 value (Fig. 3C, D).
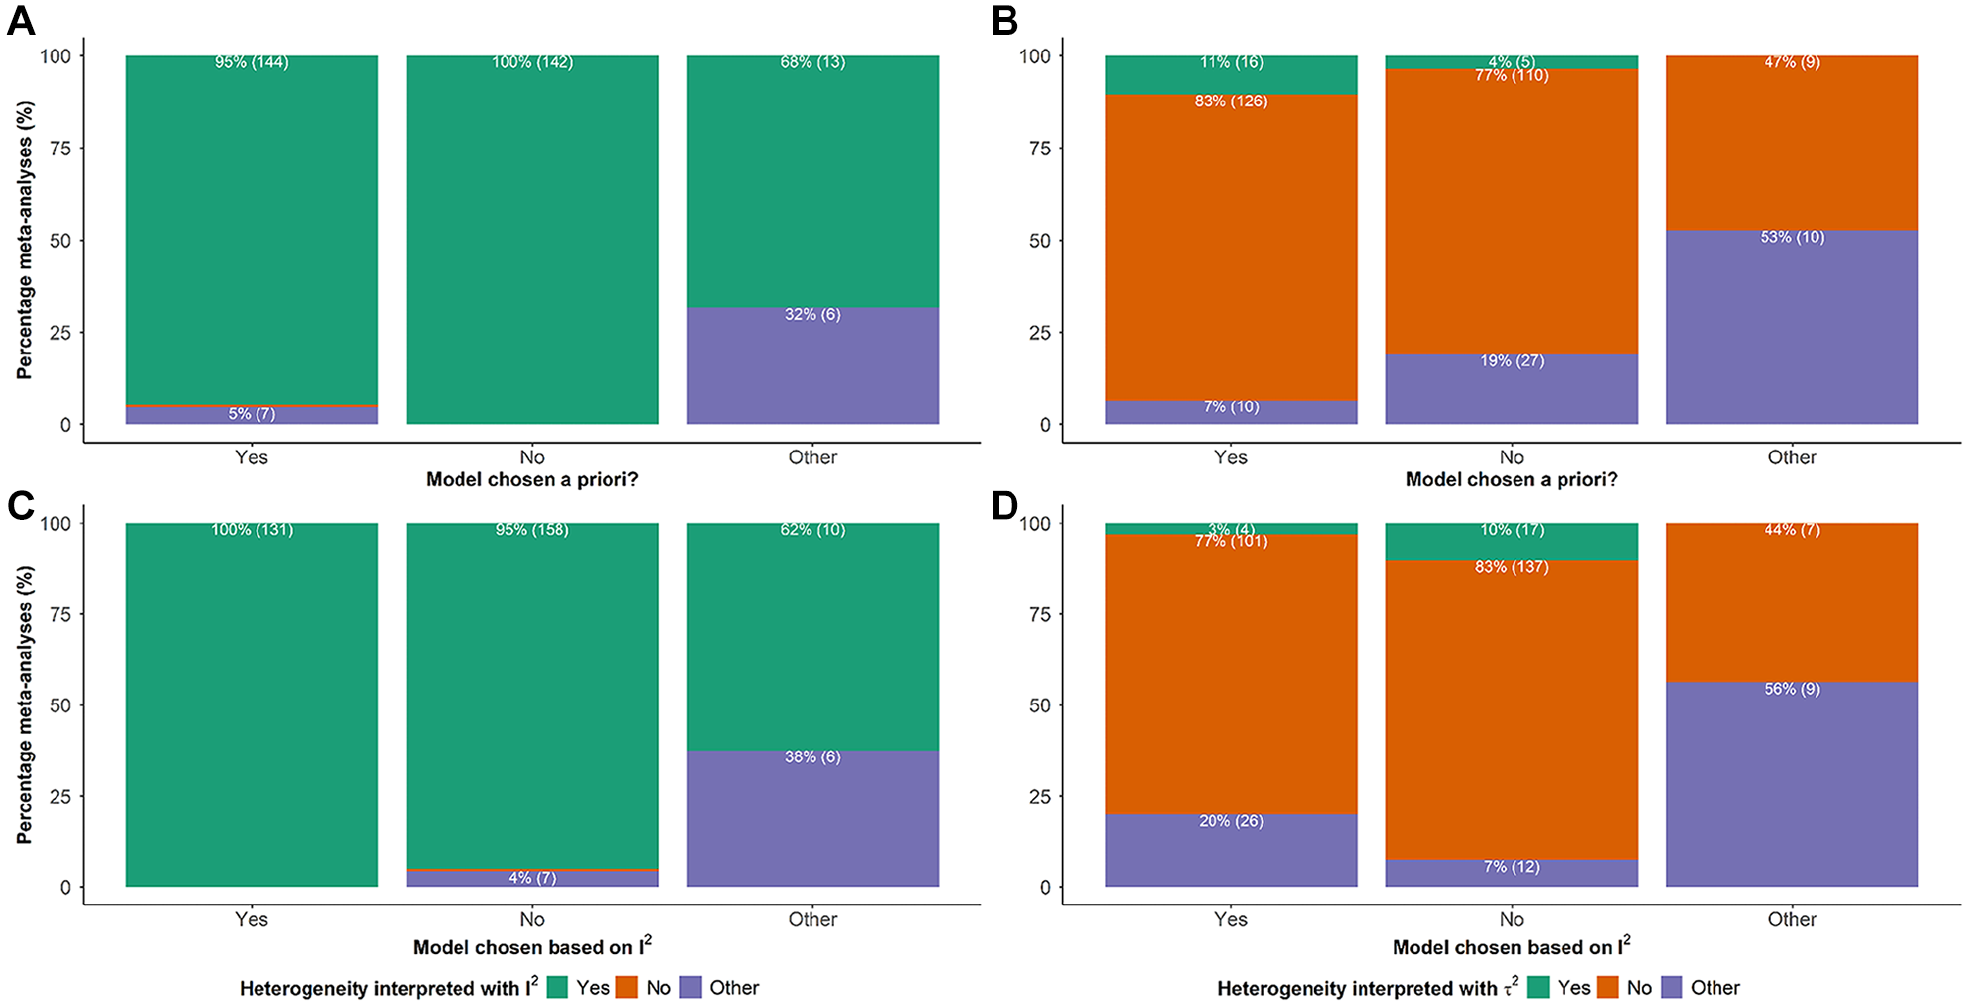
Stacked bar plots on the frequency of interpreting statistical heterogeneity using I2 and τ2 conditionally on whether the meta-analysis model was chosen a priori (plots
Discussion
The values of I2 and τ2 should not guide the selection of the meta-analysis model. Statistical heterogeneity is inherent when synthesizing studies with different protocols and should be expected (Higgins 2008). Therefore, testing for or quantifying statistical heterogeneity to decide on the meta-analysis model is redundant and misleading (Deeks et al. 2023). A nonzero I2 or τ2 indicates present statistical heterogeneity, and investigating the prespecified sources of statistical heterogeneity by employing, for instance, meta-regression or sensitivity analyses is crucial to interpreting the results (e.g., do the summary results vary in different subpopulations?) (Deeks et al. 2023). The random-effects model properly accommodates the statistical heterogeneity in the meta-analysis results and should be the preferred approach. Nevertheless, SR authors insist on selecting the model based on data-driven endeavors.
Other criteria SR authors may consider in selecting the model, beyond the statistical heterogeneity measures, deserve investigation. A survey interview of SR authors and journal editors, for instance, on their meta-analysis knowledge and involvement of a statistician, is currently missing and would be a valuable addition to the relevant literature. The role of the reviewers and journal editors in ensuring proper reporting and interpretation of the meta-analysis results is also crucial to the quality of the evidence ecosystem. For instance, updating the submission guidelines with information about the common misuses and omissions around the reporting and undertaking of meta-analysis would greatly enhance a quality peer review for submitted SRs with meta-analysis.
The present study revealed that I2 was used almost exclusively (96%) to assess and interpret the level of heterogeneity. Conversely, only 21 (7%) meta-analyses used τ2 for this purpose. Furthermore, 42% of SRs chose the model based on the I2 values. Our findings are consistent with previous relevant literature (Page et al. 2018; Bassani et al. 2019). In the analysis of 110 SRs, more than half used I2 with arbitrary thresholds to interpret heterogeneity (Page et al. 2018). In addition, 30% of SRs relied on I2 or the Cochran’s Q test to decide on the model (Page et al. 2018). Similarly, in the assessment of the reporting characteristics of 495 SRs, in 115 of the 221 SRs (52%) that investigated statistical heterogeneity, the I2 values inappropriately guided the model choice (Bassani et al. 2019).
Ideally, the estimated I2 should always be reported with a 95% CI (Ioannidis et al. 2007; Ioannidis 2008; von Hippel 2015). The reporting of CIs provides an understanding of the plausibility of the range values, especially when few or small studies populate the meta-analysis, where substantial uncertainty is inevitable (Thorlund et al. 2012). In our study, only 8 of 313 meta-analyses provided the 95% CIs for I2. However, oral health meta-analyses include generally few primary studies, which may lead to wide, uninformative CIs that cover very small and very large I2 values (Koletsi et al. 2016; Koletsi et al. 2018; Botelho et al. 2022). It is unclear whether the underreporting of CIs for I2 results from a lack of awareness by review authors or the presence of uninformative CIs due to the limited included studies. Moreover, the underreporting of CIs for the heterogeneity measures could be related to the available features of the software used. For example, R and Stata allow users to program necessary analysis functions, ensuring the meta-analysis features are up to date with the relevant methodological literature.
The reported findings are concerning as they suggest a lack of awareness of the appropriate use of I2 and τ2 by SR authors. The issue of incorrect interpretation of heterogeneity based on I2 is likely to be amplified, as meta-analyses undertaken within oral health typically involve few studies (Saltaji et al. 2013; Saltaji et al. 2016; Koletsi et al. 2018; Botelho et al. 2022; Tatas et al. 2024). To ensure a more accurate gauging of statistical heterogeneity, we recommend the following: (1) τ2 should be routinely reported with its 95% CI for being a proper measure of statistical heterogeneity and integral element of the prediction intervals (Rücker et al. 2008; Borenstein 2024); (2) I2 has an intuitive interpretation and ideally should be reported alongside its 95% CI in a forest plot to allow a visual inspection of the degree of statistical heterogeneity; (3) the meta-analysis model should be selected during the SR protocol stage rather than based on malpractices, including after calculating τ2 and I2 or inspecting the forest plot; and (4) the involvement of a statistician at the protocol stage to ensure appropriate evidence synthesis methods.
This study comprised SRs published in leading dental journals over a 3-y period. Non-English studies were excluded, which could have resulted in selection bias. This could be further compounded by the fact that only oral health journals with the highest current impact factor were included. Furthermore, the median number of included studies may not represent all available meta-analyses published in the oral health literature. However, the present study aimed to establish a baseline understanding of this specific statistical issue that can affect the clinical conclusions presented in SRs. Given the overall agreement of our findings with those previously published in the literature, we do not expect the results would have differed if all available dental meta-analyses were included.
Reporting the prediction intervals alongside the 95% CI of the summary estimate constitutes good reporting practices in a meta-analysis. Prediction intervals indicate the range of values within which the effect size of a future study would be found if randomly selected from the same population of the synthesized studies (Borenstein 2024). They are pivotal in the confidence placed in the summary results: a 95% CI that excludes the value of no difference accompanied by a wide prediction interval that includes the null value indicates the presence of nonnegligible statistical heterogeneity that needs to be investigated. However, we did not assess the reporting quality of the prediction intervals since this topic has already been investigated in recent bibliographic surveys (Faggion et al. 2021; Seehra et al. 2021; Tatas et al. 2023; Tatas et al. 2024).
Conclusions
The reporting quality of the statistical heterogeneity parameters in oral health SRs with meta-analysis is suboptimal.
There is evidence of an overreliance on I2 when reporting and interpreting statistical heterogeneity.
Selecting the meta-analysis model based on the I2 value is common in oral health systematic reviews and should be avoided.
The parameter τ2 should be routinely reported alongside the 95% CI when a random effects model is used, and the prediction interval should be provided.
Misinterpretation of statistical heterogeneity can implicate the quality of conclusions delivered to the end-users of SRs. For instance, relying on I2 and using naive categorizations to gauge the magnitude of statistical heterogeneity may spuriously affect decisions to investigate sources of statistical heterogeneity in further analyses and downgrade the quality of the available evidence, with negative implications for subsequent clinical practice recommendations.
Author Contributions
Z. Tatas, contributed to data acquisition, interpretation, drafted and critically revised the manuscript; E. Kyriakou, contributed to data acquisition, drafted and critically revised the manuscript; J. Seehra, contributed to data acquisition, critically revised the manuscript; N. Pandis, contributed to conception or design, drafted and critically revised the manuscript; L.M. Spineli, contributed to conception or design, supervision, data acquisition, interpretation, drafted and critically revised the manuscript. All authors gave final approval and agree to be accountable for all aspects of the work.
Supplemental Material
sj-docx-1-jdr-10.1177_00220345251316279 – Supplemental material for Statistical Heterogeneity in Oral Health Meta-Analyses
Supplemental material, sj-docx-1-jdr-10.1177_00220345251316279 for Statistical Heterogeneity in Oral Health Meta-Analyses by Z. Tatas, E. Kyriakou, J. Seehra, N. Pandis and L.M. Spineli in Journal of Dental Research
Footnotes
Declaration of Conflicting Interests
The authors declared no potential conflicts of interest with respect to the research, authorship, and/or publication of this article.
Funding
The authors received no financial support for the research, authorship, and/or publication of this article.
Data Availability
A supplemental appendix to this article is available online.
References
Supplementary Material
Please find the following supplemental material available below.
For Open Access articles published under a Creative Commons License, all supplemental material carries the same license as the article it is associated with.
For non-Open Access articles published, all supplemental material carries a non-exclusive license, and permission requests for re-use of supplemental material or any part of supplemental material shall be sent directly to the copyright owner as specified in the copyright notice associated with the article.