
Abstract
Machine learning (ML) models, especially deep neural networks, are increasingly being used for the analysis of medical images and as a supporting tool for clinical decision-making. In this study, we propose an artificial intelligence system to facilitate dental decision-making for the removal of mandibular third molars (M3M) based on 2-dimensional orthopantograms and the risk assessment of such a procedure. A total of 4,516 panoramic radiographic images collected at the Center of Dental Medicine at the University of Zurich, Switzerland, were used for training the ML model. After image preparation and preprocessing, a spatially dependent U-Net was employed to detect and retrieve the region of the M3M and inferior alveolar nerve (IAN). Image patches identified to contain a M3M were automatically processed by a deep neural network for the classification of M3M superimposition over the IAN (task 1) and M3M root development (task 2). A control evaluation set of 120 images, collected from a different data source than the training data and labeled by 5 dental practitioners, was leveraged to reliably evaluate model performance. By 10-fold cross-validation, we achieved accuracy values of 0.94 and 0.93 for the M3M–IAN superimposition task and the M3M root development task, respectively, and accuracies of 0.9 and 0.87 when evaluated on the control data set, using a ResNet-101 trained in a semisupervised fashion. Matthew’s correlation coefficient values of 0.82 and 0.75 for task 1 and task 2, evaluated on the control data set, indicate robust generalization of our model. Depending on the different label combinations of task 1 and task 2, we propose a diagnostic table that suggests whether additional imaging via 3-dimensional cone beam tomography is advisable. Ultimately, computer-aided decision-making tools benefit clinical practice by enabling efficient and risk-reduced decision-making and by supporting less experienced practitioners before the surgical removal of the M3M.
Introduction
The use of machine learning (ML) to support decision-making and to automate routine tasks in the medical domain causes an increase in efficiency and more robust decision-making in the health care system (Shehab et al. 2022). Biologically inspired, deep multilayered neural networks (DNNs) have been introduced for various classification, regression, and segmentation tasks, including the analysis of medical images (Litjens et al. 2017; Shen et al. 2017). Particularly, the analysis of these medical images has benefited greatly from the introduction of convolutional and transformer neural networks, with the residual neural network (ResNet) (He et al. 2016) and the vision transformer (ViT) (Vaswani et al. 2017) being the most widely used model architectures. In dentistry, methodological research in this area has proved fruitful, with several variations of these models proposed for tooth structure segmentation, the classification of dental plaque, and the detection of caries (Schwendicke et al. 2020; Shan et al. 2021; Wang et al. 2021; Kuhnisch et al. 2022).
The removal of mandibular third molars (M3Ms) is the most common surgical procedure in oral surgery and can cause multiple complications, including damage to the inferior alveolar nerve (IAN) (Leung and Cheung 2011; Sigron et al. 2014). It is known from the literature that direct contact of the M3M root with the IAN significantly increases the risk of an IAN damage occurring. In a study by Eyrich et al. (2011), it was documented that a narrowing of the IAN canal and the direct contact between M3M root and the IAN were the most prominent factors influencing the risk of IAN impairment. Furthermore, these authors demonstrated that in 95.7% of the cases, postsurgical IAN impairment occurred in M3Ms with fully developed roots. To minimize the operative risks, localization of the listed structures based on radiographs has to be preoperatively assessed as a mandatory surgery step. In critical cases, 3-dimensional imagery is required to evaluate the anatomical location of the IAN and M3M root superimposition and the root development as observed in the orthopantogram (OPG). To automate the task of identifying critical cases, previous studies made steps toward automatically evaluating the risk of extraction difficulties and IAN damage after M3M surgery by using deep learning on radiographic or computed tomography (CT) images. The most popular approaches employ ResNet models to classify the positional relationship between the M3M and the IAN (Fukuda et al. 2020; Choi et al. 2022; Sukegawa et al. 2022).
In this study, we built an end-to-end pipeline to detect and to classify M3M and IAN in panoramic radiography (OPG images) by evaluating multiple recent methods from the machine learning field (Fig. 1). The OPG is a commonly applied screening image. In clinical practice, it is not appropriate to routinely perform a cone beam CT (CBCT) due to radiation exposure. The OPG needs to fulfill various criteria in order to indicate a CBCT. Semisupervised methods allow building artificial intelligence (AI) systems for less demanding tasks of clinical practitioners, making diagnostic procedures more scalable. In particular, even a nonchallenging labeling task can be highly time-consuming and costly. In our pipeline, a spatially dependent U-Net (SDU-Net) was used to detect and segment the region of the M3M and IAN, and a ResNet-101 architecture, trained through contrastive-based semisupervised learning, then classified M3M and IAN superimposition and M3M root development on the identified patches. The final output classification results were used to decide if an additional diagnostic method is required for therapy planning (Fig. 2A).
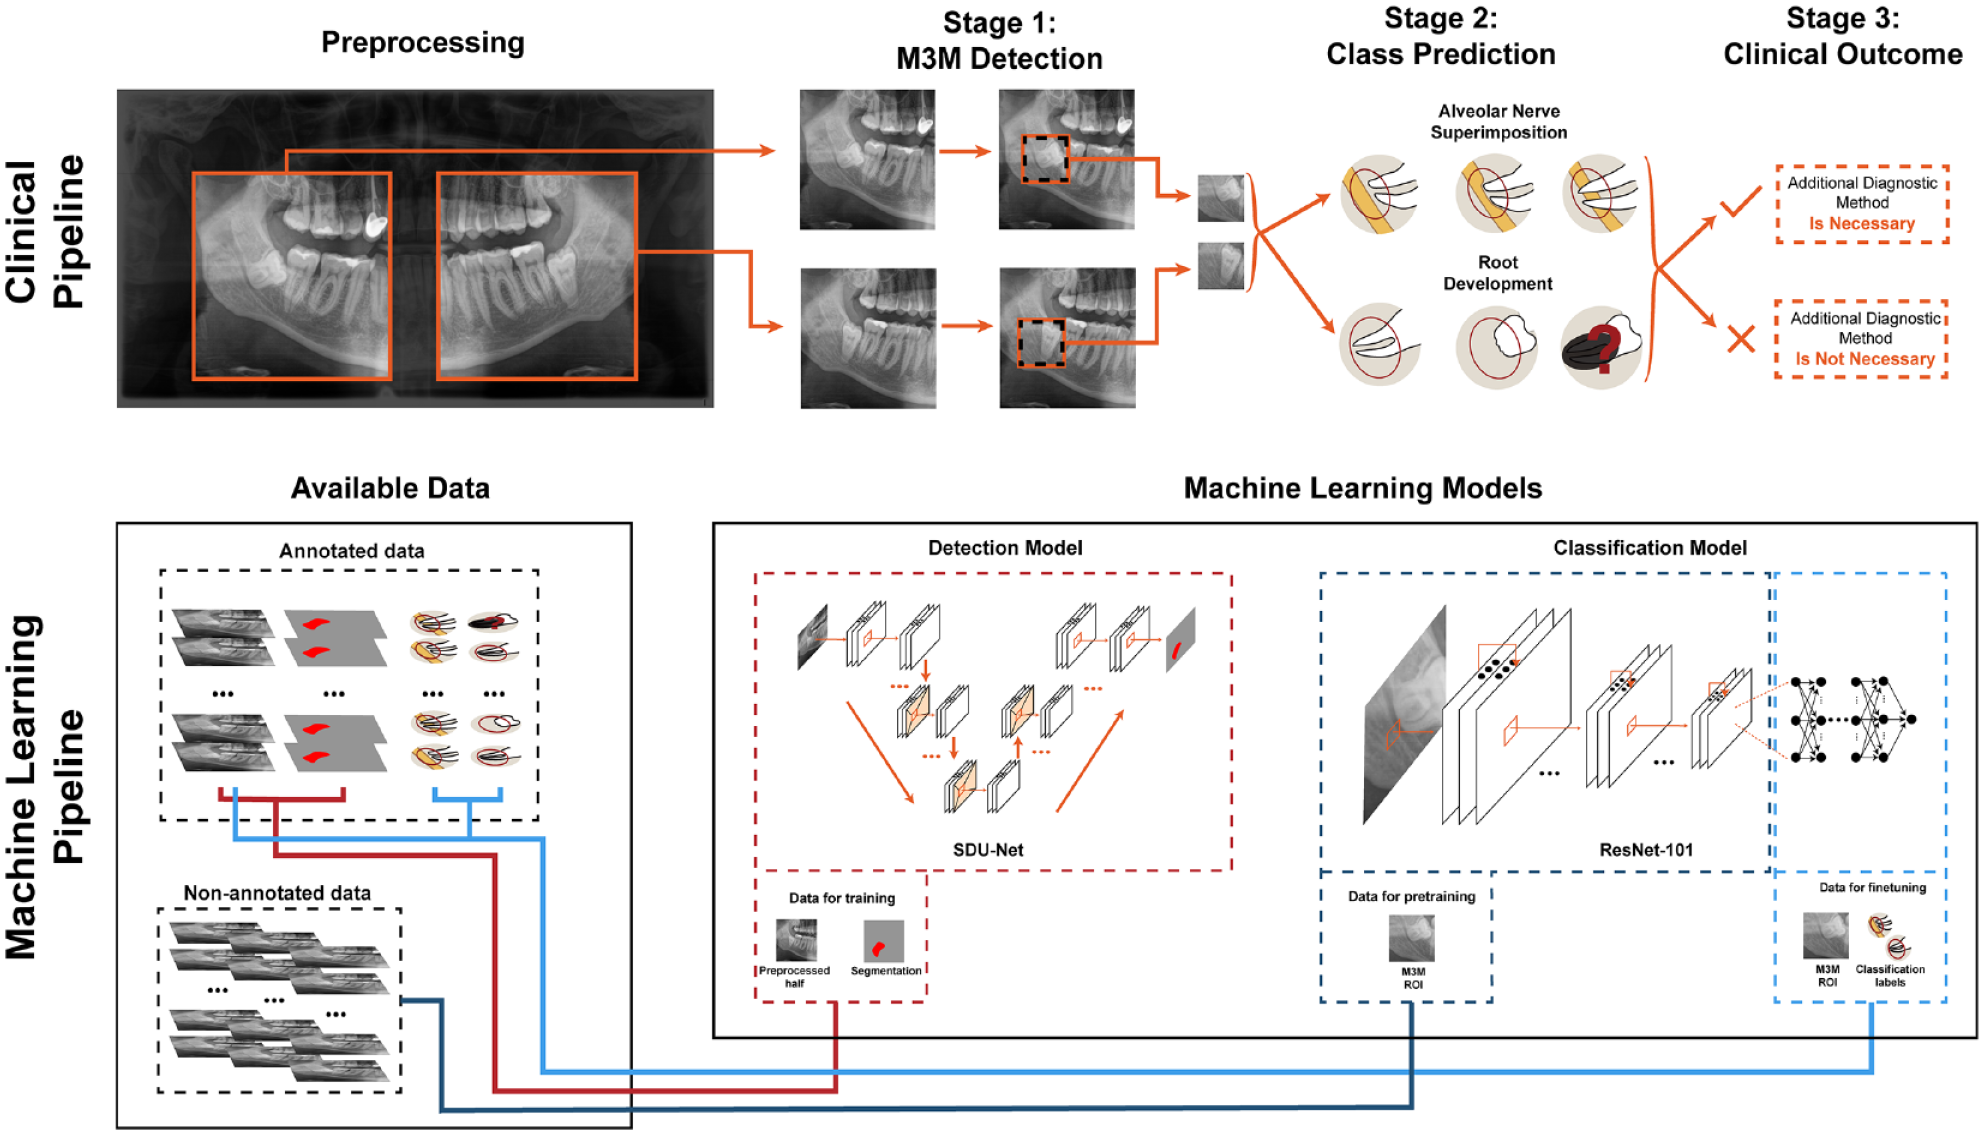
Summary of the end-to-end pipeline. Clinical pipeline: depiction of the 3 main stages that include detection of the mandibular third molar (M3M), its characterization with respect to superimposition with inferior alveolar nerve (IAN) and root development, and the final clinical outcome to require or not require an additional diagnostic method. Machine learning pipeline: depiction of the available annotated and nonannotated data and its usage to train the machine learning models that will provide the necessary outcomes for the clinical pipeline. More precisely, the spatially dependent U-Net (SDU-Net) relies on orthopantogram (OPG) images and masks data (red connecting line) and outputs the location of the M3M; the ResNet-101 is first pretrained with nonannotated images (dark blue line) and then fine-tuned with OPG images and the class labels (light blue line).
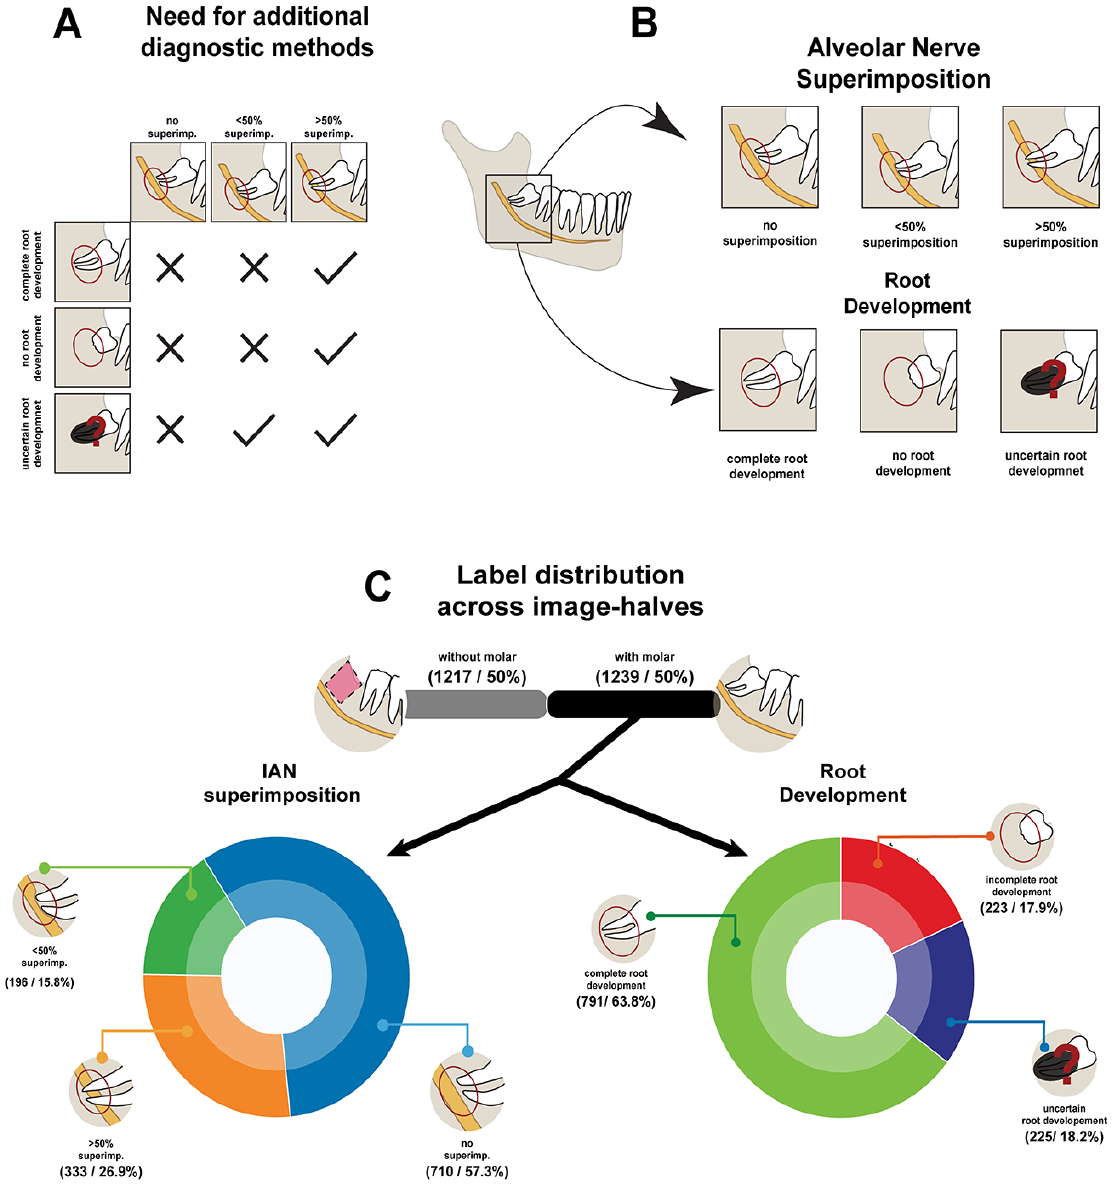
Therapy planning characterization and additional details on labelling procedure. (
Materials and Methods
As all data are completely anonymized, no ethics approval was required for this study. Nevertheless, an ethics waiver was obtained from the cantonal ethics committee Zurich (BASEC-Nr.: 2021-00057). For additional details concerning the description of materials and methods, refer to the Appendix.
Training and Validation Data Set
A total of 4,516 panoramic radiographic images were collected from patients at the Center of Dental Medicine of the University of Zurich, Switzerland, acquired between 2017 and 2021. Patients had a mean age of 37.3 ± 22.2 y with a sex distribution of 2,479/2,034 men/women. For 3 patients, no record of the sex could be found. In total, 2,940 images were acquired using Sirona Orthophos SL (Dentsply-Sirona) and 1,576 using Soredex Cranex-D (Dexis) with pixel numbers of 1,404 to 1,536 vertically and 2,612 to 3,296 horizontally. Pixel sizes were 0.096 mm and 0.1 mm for Cranex and Sirona, respectively.
In total, 1,228 of the Sirona data were labeled by a last-year dental student who was trained on the task according to the annotation scheme illustrated in Figure 2B. Both halves of every image were annotated with a polygon, circumscribing the region of interest (ROI) of the M3M and the IAN, and each identified M3M was classified according to its spatial relation to the IAN (no superimposition, superimposition <50%, and superimposition >50%) and its root development (undeveloped, fully developed, and uncertain development). The distribution of label frequency within the data set of 1,228 labeled images is depicted in Figure 2C. The remaining 3,288 images (1,712 Sirona and 1,576 Cranex) had annotations provided.
Control Evaluation Data Set
A total of 120 panoramic radiographic images were collected from a new cohort of patients at the Center of Dental Medicine of the University of Zurich, Switzerland, acquired in 2022 with a panoramic x-ray (Axeos; Dentsply-Sirona). Patients had a mean age of 31 ± 21.6 y with a sex distribution of 56/64 men/women. All images were acquired using Sirona Axeos with 1,404 vertical and 2,612 to 2,988 horizontal pixels. The data set was labeled following the same guidelines described for the training and validation data sets and as illustrated in Figure 2B. From the 120 OPGs, there were 144 identified M3Ms, which will be used in evaluating the classification tasks. No ROI segmentation masks were provided for the external evaluation data set. A total of 5 dental practitioners annotated each image independently. Inconsistent annotations were resolved by committee consensus. The overall agreement between the 5 annotators for the 3 annotation tasks before discussion can be seen in the Table, as calculated using Fleiss’s κ for the assessment of reliability of agreement between several annotators classifying items, with 1 meaning perfect agreement and 0 meaning no agreement. We used the interannotator agreement to identify and judge border cases preemptively.
Agreement between the Annotators for the External Evaluation Data Set.
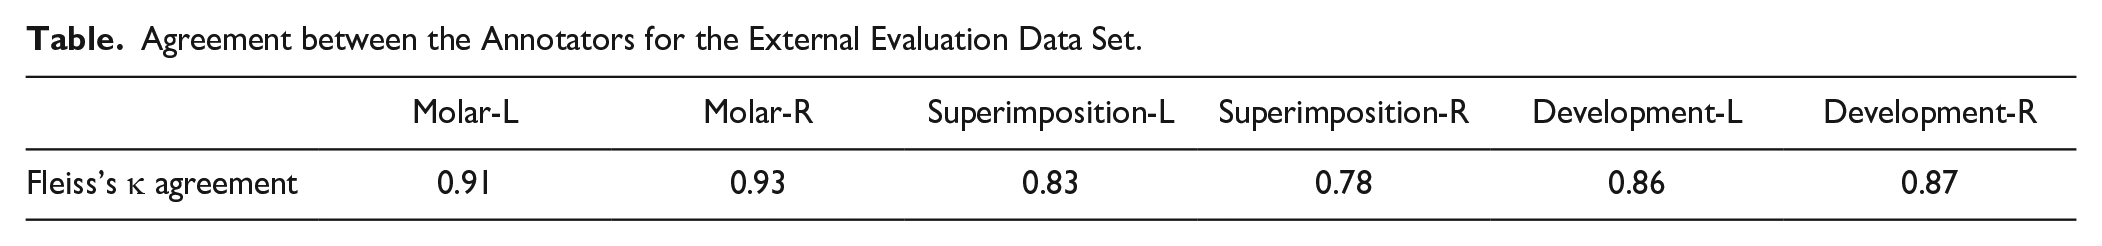
Image Preprocessing
All OPGs were split into 2 halves across the vertical axis, and each half was cropped such that the region from the mandibular jaw angle to the second incisive was preserved. The left half was horizontally flipped to match the positioning of the right half of the jaw. Final OPG patches were normalized to the pixel range of [0,1] and downsampled to 224 × 224 pixels.
Mandibular Third Molar Detection
To detect the ROI around the M3M and IAN, 3 different DNNs were evaluated: the YOLOv5 (Jocher 2020), which is a regression-based architecture developed specifically for object detection in images, and 2 different architectures developed for medical image segmentation, the U-Net and the SDU-Net (Ronneberger et al. 2015; Carvalho et al. 2022). Models with segmentation-based architectures were trained through supervised learning with the polygonal mask as a target and the YOLOv5 through the centroid of the mask.
Mandibular Third Molar and Alveolar Nerve Classification
For the classification task, 2 widely used and high-performing DNNs were extensively evaluated: the ResNet-101 and the ViT-B. Both networks share a 2-stage construction principle: they can be separated into 1) a feature extractor, which learns how to extract features through a series of complex transformations of the original input image, and 2) a compact classifier component, which predicts the labels of the classification task from extracted features.
In this work, we explored a novel approach in which the feature extractor was pretrained through contrastive-based self-supervised learning. For this method, both models were pretrained using large amounts of nonannotated OPG data, relying only on properties from the image itself for learning, and ultimately leading to models that were more robust to the inherent biases of the labeling process.
For the pretraining of the feature extractors, all images, both labeled and unlabeled, were used for self-supervised training through SimCLR (Chen et al. 2020). After selecting the ROI, each image patch was augmented by composing a series of transformations: rotations, translations, additive gaussian noise, and gaussian smoothing. Maximizing the agreement between features from augmented versions of the same image, while minimizing the agreement between features from augmented versions from different images, empowered the model to learn highly descriptive features for each image.
Final classification models
After the self-supervised pretraining, the models were trained by supervised learning for both subtasks using the corresponding annotations. The models were fine-tuned by temporarily fixing the weights of the feature extractor and by adjusting the learning rate. To compare our semisupervised approach to a baseline model, we additionally trained each model by purely supervised learning (see Fig. 4).
Model Performance Evaluation
For the evaluation of model performance, accuracy, precision, recall, Matthew’s correlation coefficient (MCC) (Chicco and Jurman 2020), and the F1-score were used, with the last 2 metrics being known to robustly mitigate imbalances in the label distribution (Boughorbel et al. 2017). The in-distribution evaluation was performed through 10-fold cross-validation, where the models were trained in 8 of the subsets, validated on 1, and evaluated on the last subset. All data splits were performed in a patient-wise way. The main goal of the cross-validation was to disperse the inherent intraclass variation of the images. To statistically and scientifically validate the performance of our models, we used the external evaluation data set described earlier. A control evaluation set with a different cohort of patients and a different panoramic x-ray machine is considered an out-of-distribution data set.
To visualize model performance, we used the receiver operator characteristics (ROC) curve to depict the performance of the model prior to fixing its threshold and the confusion matrix to show all truly and falsely predicted classes of the models.
Results
Third Molar Detection
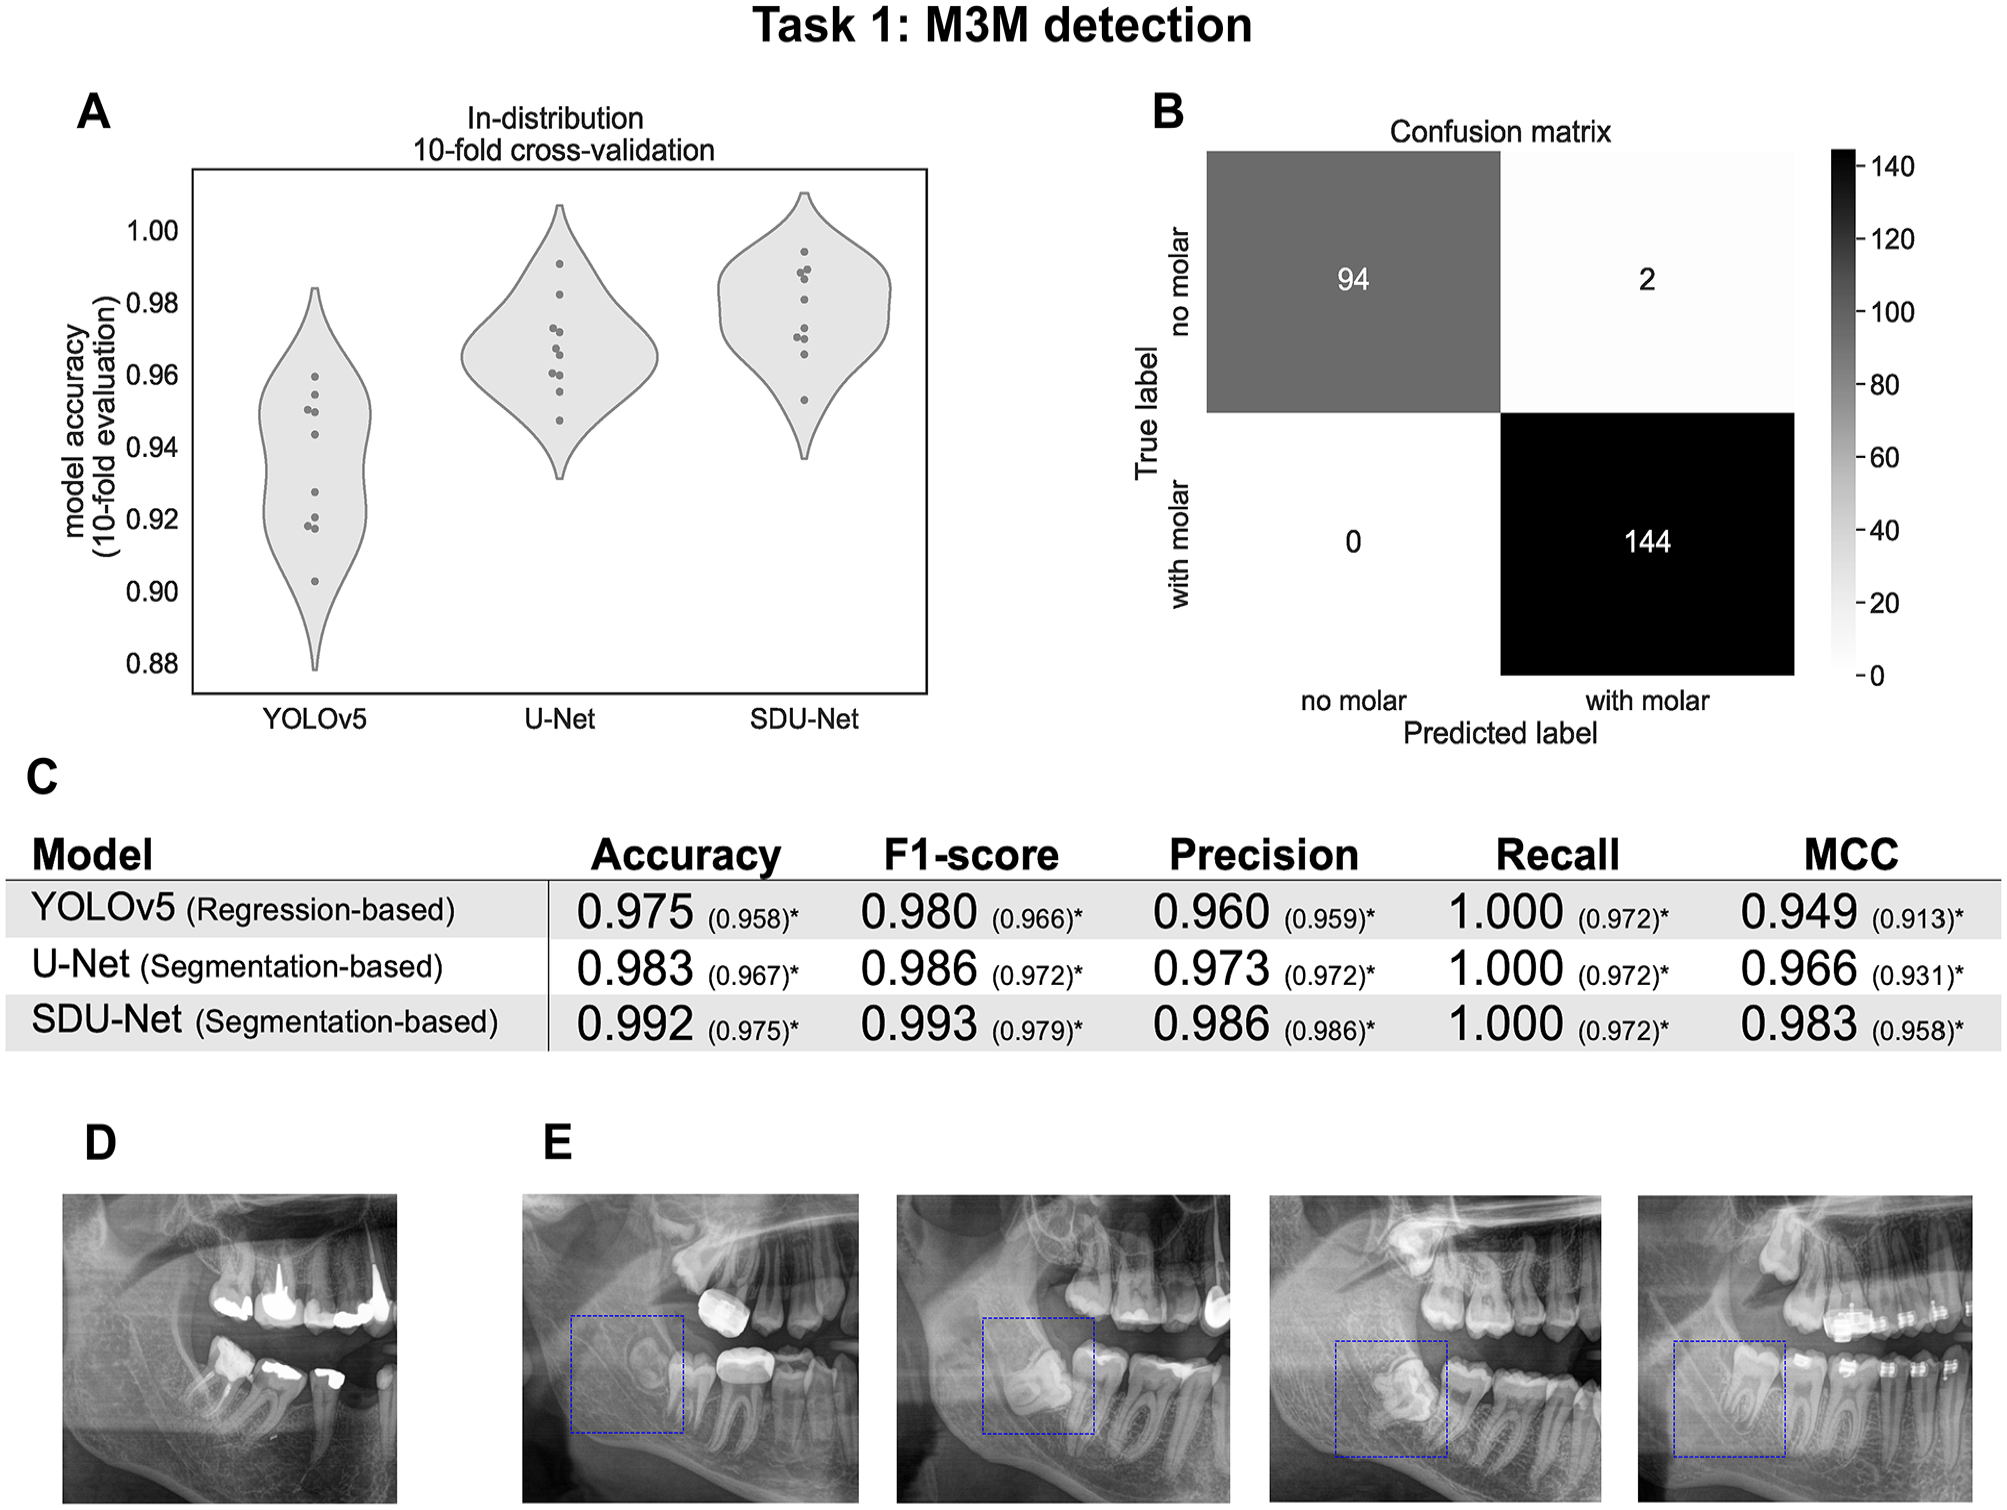
Figure 3 shows a direct comparison of the performances of the 3 detection models used, evaluated in both the training data set (in-distribution evaluation; see “Training and Validation Data Set”) and the external evaluation data set (out-of-distribution evaluation; see “Control Evaluation Data Set”).
Overall results of model performance for the mandibular third molar (M3M) detection task. (
In the in-distribution evaluation, as depicted in Figure 3A, YOLOv5 has both an overall lower performance, as well as a higher standard deviation across cross-validation folds when compared to segmentation-based methods, with the U-Net being slightly outperformed by the SDU-Net. The accuracies for the YOLOv5, the U-Net, and the SDU-Net were 0.934 ± 0.019, 0.967 ± 0.013, and 0.977 ± 0.013, respectively. The accuracy, F1-score, precision, recall, and MCC values evaluated on the out-of-distribution data can be seen in Figure 3C. The values inside the brackets represent results including 4 samples that had shifted M3Ms and were therefore wrongly classified. An example of a shifted M3M can be seen in Figure 3D. Excluding these cases, all 3 architectures were able to correctly identify all M3M, achieving a recall of 1.00. In all settings, the segmentation-based architectures, U-Net and SDU-Net, showed a better performance than the regression-based method, YOLOv5, with the SDU-Net being the best-performing model across all metrics tested. This model achieved accuracy values and an F1-score above 0.99, having misidentified only 2 images. Figure 3E shows 4 examples of correctly identified M3Ms.
Classification
For both the IAN superimposition and the root development prediction tasks, the performances of the cross-validations are depicted in the violin plots in Figure 4A and F, respectively. Note that in these 2 tasks, from the total of 240 image-halves, only the 144 labeled as having a M3M were used to evaluate the models. The supervised ResNet-101, which was the best-performing model in the in-distribution setting, achieved an accuracy of 0.94 ± 0.01 and 0.93 ± 0.02; the supervised ViT-B achieved 0.92 ± 0.03 and 0.90 ± 0.02; the semisupervised ResNet-101 achieved 0.93 ± 0.01 and 0.90 ± 0.02; and the semisupervised ViT-B achieved 0.90 ± 0.02 and 0.87 ± 0.02, all respectively for the IAN superimposition and the root development prediction tasks.

Overall results for the superimposition of the mandibular third molar (M3M) with the inferior alveolar nerve (IAN) and the M3M root development classification tasks. (
Interestingly, the trend of supervised models overperforming semisupervised ones was inverted when evaluating these models on the external evaluation data set, as can be seen on the ROC curves in Figure 4B and G and on the accuracy in the tables in Figure 4D and I. Evaluated on the external evaluation set, the best model was the semisupervised ResNet-101. For the IAN and M3M superimposition, the semisupervised ResNet-101 and the semisupervised ViT-B yielded area under the receiver operating characteristic AUROC scores equal to or greater than 0.90 (Fig. 4B). For the root development task, these models achieved AUROC scores of 0.90 and 0.87, respectively (Fig. 4G).
Figure 4C and H show the confusion matrices of the semisupervised ResNet-101, which was the best-performing model, making it easier to visualize single failure points. For the IAN superimposition task, 10 images out of 83 were misclassified for 0% superimposition, 3 images out of 40 for <50% superimposition, and 2 images out of 21 for >50% superimposition, giving a total failure rate of 10%. For the root development, the total failure rate was 13% with 12 out of 91, 5 out of 45, and 2 out of 8 misclassifications for incomplete, complete, and uncertain root development, respectively.
Discussion
Following the recent trend to develop DNN-based models for the detection and diagnosis of the M3M, this work bridges several gaps in previous research. First, it demonstrates the potential of semisupervised learning (Shehab et al. 2022), being, to the best of our knowledge, the first of its kind in the field of dental imaging to use large quantities of original data without expert annotations as a catalyst for highly robust ML models. Second, it also demonstrates the full potential of an integrated end-to-end pipeline that, starting from an original OPG image, detects and classifies the M3M into the relevant categories for further clinical diagnostic. With the final classification of both the M3M root development and its superimposition with the IAN, the clinical practitioner effectively receives the most relevant diagnostic information to further decide on the best next steps in the diagnostic radiological assessment pipeline for the patient.
Our proposed evaluation strategy was developed to identify and correct overly optimistic model performance both through robust evaluation metrics that are resilient to unbalanced label distribution and through an external validation data set that could potentially detect assimilated shortcut features. As highlighted in the medical imaging domain (Shehab et al. 2022), and in particular in the field of dentistry (Schwendicke et al. 2020; Ma et al. 2022), such benchmarking proved essential for trustworthy machine learning. As expected, we observed an overall drop in all model performances when models were evaluated by in-distribution cross-validation in comparison to the out-of-distribution control data set. However, these drops in performance were relatively minor in all models trained through semisupervised learning, indicating strong robustness of our models to distribution shifts. Such a robustness to distribution shifts was also confirmed recently by Navarro et al. (2021) in a work tackling pneumonia detection in x-rays. As Hendrycks et al. (2019) advanced, one explanation to the inherent robustness of semisupervised learning is its nonreliance on labels for training and thus effectively being able to avoid any nonrelevant potential correlation between the labeling process and image features.
There have been several studies trying to evaluate the risk of extraction complications during M3M. Although some studies have reported good prediction accuracy, none of the studies challenged their performance results by external validation, rendering it difficult to reliably assess the robustness of their models. First, in the M3M detection, our work compares favorably to Lee et al. (2022) and Zhu et al. (2021), which report a recall of 0.83 and 0.85, respectively. In screening pipelines, high precision should be prioritized to avoid excessive manual labor. However, as Hicks et al. (2022) point out, optimal recall may be necessary in settings where identifying all positive samples is crucial. In fact, in this clinical pipeline, any missed M3M leads to a complete break in the system, and to this extent, we see our detection model effectively fulfilling its goal. It is still important to highlight that all detection models have failed to detect the shifted M3M, and this may point out a systematic annotation error in the original training data. In the classification task, Choi et al. (2022) showed an accuracy of 0.63, Sukegawa et al. (2022) reached an accuracy of 0.86, and Zhu et al. (2021) reported an average precision of 0.85 when evaluating the spatial relation of the M3M and the IAN on OPGs. Liu et al. (2022) have used the more advanced visualizing technique of CBCTs to evaluate the M3M–IAN relation, achieving the highest accuracy of 0.93. These results demonstrate that we could outperform recent studies on the spatial relation of M3M and IAN using OPG images, reaching an accuracy of 0.9. We could not find any other studies mastering the task of automated root development prediction, making our study the first to address this question. Finally, MCC values of 0.82 for the M3M–IAN relation task and 0.75 for the M3M root development task, performed on the control evaluation test, suggest that our models were able to strongly generalize.
From a clinical point of view, a limitation of OPTs is that IAN branches may be undetected, indicating a CBCT. The indication of CBCTs, however, has to be weighted against the radiation exposure. For this reason, the Swiss guidelines suggest that the indication of a CBCT prior to third molar removal is based on defined 2-dimensional characteristics in OPTs (Dula et al. 2015). A ML-based system supports dentists in radiological diagnosis possibly avoiding misdiagnosis. An advantage is the opportunity to integrate, for example, a guideline into a decision support system that would equally be available for more or less radiologically experienced practitioners. A further aspect is that incidental findings could be automatically detected, avoiding a time-consuming consultation of radiological experts.
Therefore, we see future efforts advancing beyond the methodological limitations of this work by establishing consistent benchmarks and widely accepted systematic annotation schemes, as already suggested in Ma et al. (2022). In addition, with the recent development of generative modeling in computer vision (Pang et al. 2021), we like to highlight the potential of infusing OPG images with 3-dimensional information, enabling a highly robust and fine-grained estimation of the relationship between the M3M and the IAN. In a consecutive project, it would be of interest to develop an algorithm that automatically detects the relation between the tooth roots and the mandibular canal for CBCTs.
Conclusion
Even though AI is in the center of many research projects and will most likely play a major role in aided medical and dental decision-making, its application has hardly found its way into dental routine. In this study, we have developed a robust end-to-end ML pipeline that enables preoperative M3M assessment from OPGs to support the practitioner in everyday clinical practice as a decision-making aid and potentially supports the time management of clinical staff with significantly increased efficiency. Our pipeline helps to classify the risk of nerve injury during the removal of the M3M by preemptively evaluating M3M root growth and the positional relationship of the M3M root and the IAN. Based on the classification outcome, the practitioner can decide whether further radiological examination is required or not and thus considerably improve patient care.
Author Contributions
J.S. Carvalho, contributed to conception and design, data analysis and interpretation, drafted and critically revised the manuscript; M. Lotz, S. Unger, contributed to conception and design, data acquisition and interpretation, drafted and critically revised the manuscript; L. Rubi, contributed to data analysis and interpretation, drafted and critically revised the manuscript; T. Pfister, contributed to data acquisition, drafted and critically revised the manuscript; J.M. Buhmann, contributed to data conception and design, critically revised the manuscript; B. Stadlinger, contributed to conception and design, data interpretation, critically revised the manuscript, All authors gave final approval and agree to be accountable for all aspects of the work.
Supplemental Material
sj-docx-1-jdr-10.1177_00220345231200786 – Supplemental material for Preinterventional Third-Molar Assessment Using Robust Machine Learning
Supplemental material, sj-docx-1-jdr-10.1177_00220345231200786 for Preinterventional Third-Molar Assessment Using Robust Machine Learning by J.S. Carvalho, M. Lotz, L. Rubi, S. Unger, T. Pfister, J.M. Buhmann and B. Stadlinger in Journal of Dental Research
Footnotes
Acknowledgements
We thank Valérie Schmidt-Ziltener for supporting the data extraction and Yara Jäkel for supporting the figure design.
Declaration of Conflicting Interests
The authors declared no potential conflicts of interest with respect to the research, authorship, and/or publication of this article.
Funding
The authors received no financial support for the research, authorship, and/or publication of this article.
A supplemental appendix to this article is available online.
References
Supplementary Material
Please find the following supplemental material available below.
For Open Access articles published under a Creative Commons License, all supplemental material carries the same license as the article it is associated with.
For non-Open Access articles published, all supplemental material carries a non-exclusive license, and permission requests for re-use of supplemental material or any part of supplemental material shall be sent directly to the copyright owner as specified in the copyright notice associated with the article.